Postnatal development of dendrodendritic inhibition in the mammalian olfactory bulb
- Department of Molecular and Cellular Biology, Center for Brain Science, Harvard University, Cambridge, MA, USA
The mitral–granule cell (MC–GC) reciprocal synapse is an important source of auto- and lateral-inhibition in the olfactory bulb (OB), and this local inhibition is critical for odor discrimination. We may gain insight into the role of MC autoinhibition in olfaction by correlating the functional development of the autoinhibition with the postnatal development of olfactory function. We have studied the functional development of the MC–GC reciprocal synapse using whole-cell patch-clamp recordings from MCs and GCs in acute OB slices from 3- to 30-day-old rats. The magnitude of dendrodendritic inhibition (DDI) measured by depolarizing a single MC and recording recurrent inhibition in the same cell increased up to the fifteenth day of life (P15), but dropped between P15 and P30. The initial increase and later decrease in DDI was echoed by a similar increase and decrease in the frequency of miniature inhibitory post-synaptic currents, suggesting an accompanying modulation in the number of synapses available to participate in DDI. The late decrease in DDI could also result, in part, from a decrease in GC excitability as well as an increase in relative contribution of N-methyl d-aspartate (NMDA) receptors to γ-amino butyric acid (GABA) release from GC synapses. Changes in release probability of GABAergic synapses are unlikely to account for the late reduction in DDI, although they might contribute to the early increase during development. Our results demonstrate that the functional MC–GC circuit evolves over development in a complex manner that may include both construction and elimination of synapses.
Introduction
The olfactory bulb (OB) is the first processing center for odor information in the mammalian brain (Shepherd and Greer, 1998; Mori et al., 1999; Schoppa and Urban, 2003). Mitral and tufted cells receive excitatory input from the olfactory receptor neurons in the olfactory epithelium and project their axons to the olfactory cortex and other higher brain regions. Mitral cell (MC) firing is modulated in the bulb by inhibition from glomerular interneurons, which form GABAergic synapses on the primary dendritic tufts of MCs (Parrish-Aungst et al., 2007; Shao et al., 2009), as well as from local GABAergic interneurons called granule cells (GCs) that form reciprocal synapses with MC lateral dendrites (Rall et al., 1966; Price and Powell, 1970; Yokoi et al., 1995). Local inhibition is critical for odor discrimination in insects and vertebrates (Stopfer et al., 1997; Gheusi et al., 2000; Nusser et al., 2001; Abraham et al., 2010).
In rats, some olfactory function is present at birth and is necessary to initiate nursing (Teicher and Blass, 1977; Brunet et al., 1996). Pups are capable of appetitive learning at P1 (Johanson and Hall, 1979), can respond to odors with sniffing and increased respiratory rates at P2 (Welker, 1964), and can perform simple odor discriminatory tasks as early as P3 (Armstrong et al., 2006). These early olfactory abilities manifest well before the number of GCs and the number of MC–GC reciprocal synapses approach adult levels. The number of GCs rises from 10% of adult levels at birth to nearly 100% at P30, whereas MCs are slightly overabundant at birth and are pruned away to form the adult complement of cells by P10–20 (Rosselli-Austin and Altman, 1979; Frazier and Brunjes, 1988). There have been few anatomical studies of synapse formation during development in the OB; the best available measurements were made in mice by Hinds and Hinds (1976) using electron microscopy. MC-to-GC synapse density in the external plexiform layer (EPL) starts at about 10% of the adult level at P0 and reaches the adult level at about P15; GC-to-MC synapse density lags behind slightly, reaching 90% of adult levels by P30 but continuing to increase into adulthood (Hinds and Hinds, 1976). In other areas of the brain, anatomical studies can over- or under-estimate the number of functional synapses (Pun et al., 1986; Isaac et al., 1995; Liao et al., 1995; Durand et al., 1996), and physiological studies have been necessary to demonstrate functionality.
The development of the mitral–granule reciprocal synapse is also important in light of the adult neurogenesis of GCs. The OB is one of two known brain areas in which newborn neurons are found throughout adulthood (Lledo et al., 2005). New GCs are generated in the subventricular zone and migrate to the bulb, where they form functional synapses and assume adult-appearing morphology (Carlen et al., 2002; Carleton et al., 2003). Comparison of the development of the mitral–granule synapse in the first weeks after birth with its development in adult-born cells may further our understanding of how adult-born cells can integrate themselves into a pre-existing network.
We hope to gain insight into the role of MC autoinhibition in olfaction by correlating the functional development of the synapse with the postnatal development of olfactory function. Using extracellular recordings of field potentials, Wilson and Leon (1986) found that the period of suppressed firing induced in the cells near the MC layer in vivo by antidromic stimulation of MC axons en route to the olfactory cortex increases from P5 to P15–P19, as one might expect, but then decreases in adulthood. In a related study, these same authors used indirect extracellular field potential recordings to suggest that presumed GC mediated inhibition underwent complex developmental changes (Wilson and Leon, 1987). Here, we have sought to identify the cellular and synaptic bases of developmental changes in dendrodendritic inhibition (DDI) using more direct whole-cell recordings in slices.
Materials and Methods
Three hundred micrometer horizontal slices from the OBs of rats aged P3–30, were prepared and recordings were made as previously described (Dietz and Murthy, 2005). Briefly, slices were maintained in oxygenated, buffered saline (in mM, 119 NaCl, 26.2 NaHCO3, 11 glucose, 2.5 KCl, 1 NaH2PO4, 2.5 CaCl2, 1.5 MgCl2, pH 7.3, osmolarity 290–300 mOsm) at room temperature. Animal care and experimental procedures adhered to guidelines approved by the Harvard University IACUC and conformed to NIH guidelines. Whole-cell recordings were obtained from MC somata, using 1–2 MΩ borosilicate glass pipettes containing cesium chloride (in mM, CsCl 111, TEA-Cl 13, HEPES 20, Di-tris-P-creatine 11, Na2ATP 3, Na3GTP 0.2, EGTA 0.2) and voltage-clamped at −70 mV. For extracellular stimulation, a 200-μs biphasic stimulus of 1–50 μA was delivered through a glass monopolar electrode placed in the EPL driving GC firing. For some experiments the extracellular Mg concentration was reduced to zero. GC somata were patched with 5–7 MΩ borosilicate glass pipettes containing potassium gluconate (in mM, potassium gluconate 130, HEPES 10, MgCl2 2, MgATP 2, Na2ATP 2, GTP 0.3, NaCl 4). GC resting membrane potentials were recorded in current clamp, and the somata were held below firing threshold. GC firing properties were studied by delivering consecutive current pulses, 500 ms duration each, ranging from −20 to +150 pA with a 10-pA increment. For miniature inhibitory post-synaptic current (mIPSC) recordings from MCs, 1 μM TTX, 100 μM APV, and 5 μM CNQX were added to the bath; for evoked DDI recordings, 1 μM TTX; for extracellular stimulation recordings, 100 μM APV and 5 μM CNQX; and for GC recordings 100 μM APV, 5 μM CNQX, and 100 μM picrotoxin (PTX). Currents were analyzed using MATLAB (Mathworks, Natick, MA, USA), Clampfit (Molecular Devices, CA, USA), and MiniAnalysis (Synaptosoft, Decatur, GA, USA). Rise time of a current was defined as the time it took for a current to increase from 10 to 90% of its maximum amplitude, and decay time was defined as time to decrease from 90 to 37%. For mIPSC analysis, events with rise times between 0.5 and 12 ms, a minimum area of about 30 pA·ms, and amplitude at least three times the root mean square of the noise were accepted for analysis. All mIPSCs were visually inspected before being accepted for analysis. DDI was evoked by recording a MC in whole-cell voltage clamp and depolarizing the cell with a 100-ms voltage step from −70 to 0 mV, resulting in a barrage of IPSCs, spread over several seconds, that could be recorded with the same patch pipette in the MC soma. The DDI was quantified by integrating the current over a 2-s period after the cessation of voltage step for physiological Mg, and over a 4-s period for 0 Mg. The time constant of DDI was measured by fitting a single exponential to the decay. Statistical tests included one-way analysis of variance (ANOVA), N-way ANOVA, unpaired T-test, and pairwise comparison by Tukey’s honestly significantly different (HSD) test. All errors are reported as the SEM.
Results
Evoked DDI Peaks at P15, and then Declines
We assayed the functional properties of the mitral–granule reciprocal circuit by depolarizing MCs in the presence of TTX. The resulting DDI recorded in the same MC is composed of feedback inhibition from multiple reciprocally connected GCs in the form of a barrage of IPSCs (Chen and Shepherd, 1997; Isaacson and Strowbridge, 1998; Friedman and Strowbridge, 2000; Margrie et al., 2001). We measured the extent of DDI in MCs from animals of various ages by imposing voltage steps from the holding potential of −70 to 0 mV for 100 ms, which evoked a flurry of IPSCs from reciprocally connected GCs (Figure 1B). DDI increased significantly from P3 to P15, in line with expectations from anatomical studies showing an age-dependent increase in MC–GC and GC–MC synapses over this time. There was a significant decrease in DDI after P15, dropping to neonatal levels by P30. The DDI at P12 and P15 were significantly larger than at all other ages, except P12 was not significantly larger than P20 (ANOVA p = 1.0e−4; pairwise comparison by Tukey’s HSD test, p < 0.05). The most obvious explanation for the early increase in DDI is the increase in the number of anatomically identified synapses, but other factors may also contribute; the late reduction in DDI even as synapses are added is more counterintuitive and intriguing. From this point we will focus our attention on possible mechanisms for this more unexpected late fall in DDI.
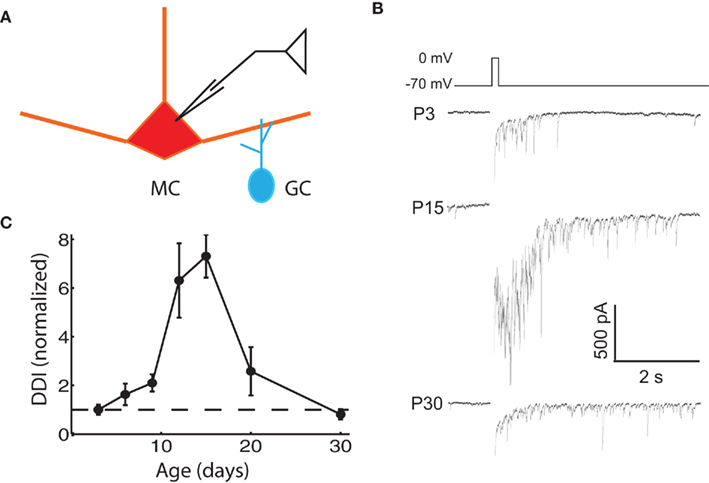
Figure 1. Evoked DDI peaks at P15, and then declines. (A) Drawing of the recording configuration, in which glutamate release is evoked via voltage steps in the MC, and GABAergic IPSCs from GCs are recorded in the same MC. (B) Sample single trace of DDI evoked by 100 ms voltage step from −70 to 0 mV at three representative ages, with the period of the stimulus blanked. (C) DDI plotted as a function of age, normalized to the average value at P3 (dashed line drawn through ordinate value of 1). N = 4 cells for P3, P12, and P30; N = 3 for P6, P9, P15, and P20. The DDI at P12 and P15 were significantly higher than at all other ages, except P12 was not significantly higher than P20 (ANOVA p = 1.0e−4; pairwise comparison by Tukey’s HSD test, p < 0.05).
Variations in Recording Conditions and Input Resistance Do Not Account for the Changes in DDI
We first investigated possible reasons for the paradoxical drop of DDI between day 15 and 30 relating to the recording techniques and the intrinsic electrical properties of the cells. One potential reason for a decrease in DDI could be a change in input resistance of MCs or GCs. The intrinsic properties of GCs will be discussed below. Although input resistance of MCs dropped significantly over the entire age range (ANOVA p = 3.5e−12), most of the decrease occurred as DDI was increasing up to P15, and there was no significant change between P15 and P30, the period of DDI decrease (Figure 2A). Another potential explanation for the decrease is a change in the access resistance of our whole-cell recordings. All cells were compensated for access resistance, but compensation may not completely correct large resistances. Access resistance increased modestly, but significantly, with age (ANOVA p = 0.05), but as access resistance was slightly positively correlated with the extent of DDI (correlation coefficient = 0.10), the increase in access resistance in older cells was still within tolerance for quality recordings and did not compromise the experiments (Figure 2B). Insufficient diffusion of the chloride-based pipette internal solution to distal sites could contribute to reduced DDI if distal synapses were not exposed to the high driving force of the artificial intracellular solution; we think inadequate diffusion is unlikely since the extent of DDI did not increase significantly with the time of recording in any given cell, as might be expected if diffusion to distal sites was a factor over recordings lasting up to 1 h (data not shown). Finally, measurements of IPSCs might be confounded by changes in the length of MC lateral dendrites between P3 and P30, which could lead to increasing electrotonic filtering – this is discussed below.
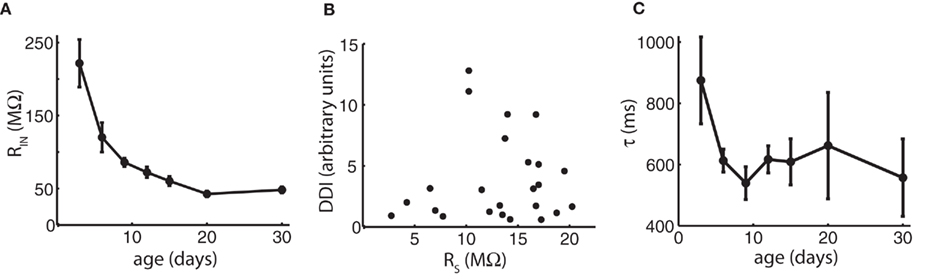
Figure 2. Changes in input resistance, access resistance, and time course of decay do not account for the late reduction in DDI. (A) Mean input resistance (MΩ) vs. age shows no change between P15 and P30 that would account for the reduction in DDI. N = 11 cells for P3, P6, P9, and P30; N = 12 for P12, P15, and P20. (B) Access resistance is slightly positively correlated with the extent of DDI and does not account for the reduction. Mean DDI (arbitrary units) evoked in physiological magnesium and 1 μM TTX plotted vs. access resistance in MΩ for 24 cells ages P3–P30. Correlation coefficient = 0.10. (C) Average decay time constants τ for DDI (in physiological magnesium). Time constants are not significantly different with age (ANOVA p = 0.37). N = 4 cells for P3, P12 and P30; N = 3 for P6, P9, P15, and P20.
Changes in Time Course of DDI Do Not Contribute to the Late Reduction in DDI
Dendrodendritic inhibition evoked by voltage steps decays over a period of seconds (Figure 1; Isaacson and Strowbridge, 1998; Schoppa et al., 1998), probably due to a long and variable delay of GC release back onto the MC (Kapoor and Urban, 2006). In our analysis, we measured the extent of DDI by integrating the total charge in a long time period following the voltage step. To determine if there was a systematic change in the time course of DDI with age, we fitted a single exponential to the average time course of DDI at different ages (Figure 2C). The decay time constant was similar to that reported by Isaacson and Strowbridge (1998) and did not change significantly with age (ANOVA p = 0.37).
Changes in the Number of Synapses Participating in DDI May Contribute to the Increase and Reduction in DDI
The changes in DDI could also be due to a change in the number or the strength of the MC–GC synapses available to participate in DDI. An increase in the number of synapses would doubtless increase the DDI evoked by a current step. Furthermore, the same number of synapses could mediate increased DDI if they gained in strength, either presynaptically or post-synaptically. Estimating the number of synapses available for DDI and assessing their strength using electrophysiological methods requires the combination of several measurements. We began by first recording mIPSCs in MCs in the presence of TTX. The number and strength of these miniature events are related to the number and strength of synapses onto a cell (Turrigiano and Nelson, 2004). The frequency of mIPSCs can be modeled to depend on the product of the release probability p and the number of release sites n (Kerchner and Nicoll, 2008). An increase in mIPSC frequency could result from an increase in the number of synapses onto a cell, an increase in release probability, or an increase in the number of docked vesicles per synapse (Malenka and Nicoll, 1997; Lisman et al., 2007). We first measured changes in mIPSC frequency and properties; we then investigated some possible contributors to changes in frequency, such as release probability and silent synapses, discussed in the following sections. If other contributors to changes in mIPSC frequency can be ruled out, the change in frequency can then be ascribed to a change in synapse number. Other measurements derived from mIPSCs, such as amplitude and time course, can indicate changes in synaptic strength.
The frequency of mIPSCs remained steady at about 2.5 Hz from P3 to P12, peaked at 6.1 ± 0.42 Hz at P20, then dropped back down to about 2.4 ± 0.52 at P30 (Figure 3). The frequency at P20 was significantly higher than at P3, 6, 9, and 30 (ANOVA p = 0.0012, pairwise comparison by Tukey’s HSD test, p < 0.05). The amplitude of mIPSCs increased significantly with age (ANOVA p = 0.037), being higher at P30 than at P9 (p < 0.05), with most of the increase occurring after P15. Rise time peaked at P12, increasing from 2.4 ± 0.22 ms at P3 to 3.4 ± 0.21 ms at P12, then dropping back to 2.5 ± 0.21 by P30 (ANOVA p = 0.0012); the P12 value was significantly higher than those at P3 and P30, while the P15 value was significantly higher than the P3 value (p < 0.05). Decay time did not change significantly (Figure 3D; ANOVA p = 0.42). We obtained a rough estimate of the number of quanta contributing to DDI at each age by dividing the mean area of the evoked DDI by the mean area of the mIPSC for each age. As a result, the increase in the number of quanta per DDI from P3 to P15, and the subsequent decrease from P15 to P30 were even more striking than the total charge per DDI (Figure 3E). The approximate numbers of quanta in the DDI barrage were 269 at P3, 1143 at P15, and 150 at P30. The changes in mIPSC frequency suggest that either the number of available synapses, the number of release sites per synapse, or the release probability may rise and fall at roughly the same time as the DDI.
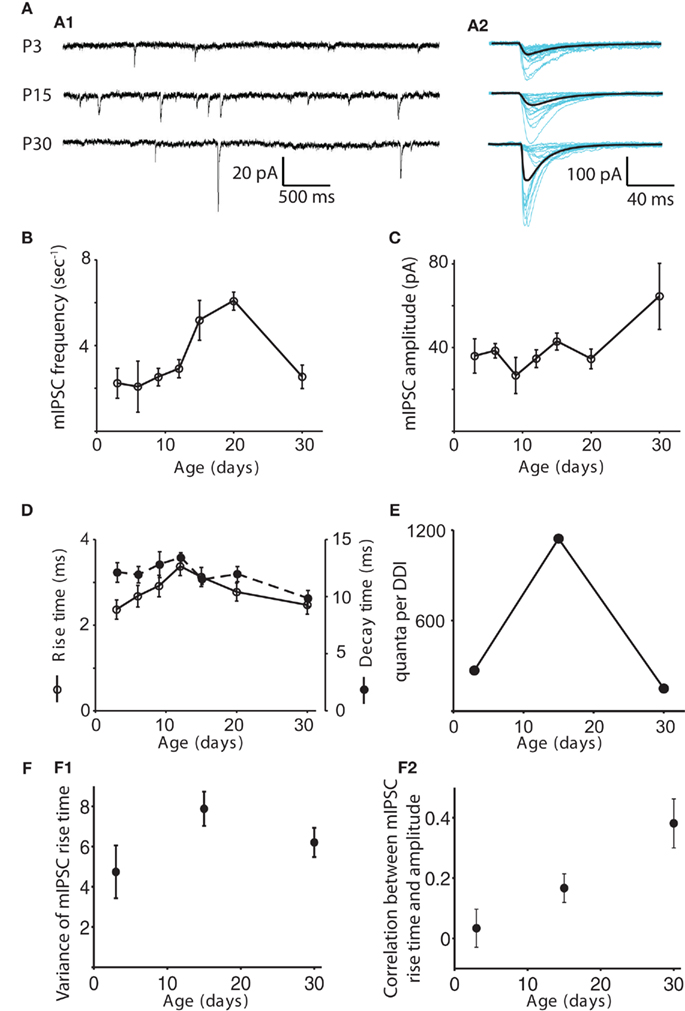
Figure 3. Changes in the properties of mIPSCs with age. (A) Examples of mIPSCs recorded in mitral cells at P3, P15, and P30 in 1 μM TTX, 100 μM APV, and 5 μM CNQX. (A1) Sample recordings at each age. (A2) Individual mIPSCs recorded in a different cell are shown aligned by their onset (blue), and the average mIPSC is shown in black. (B–D) mIPSC frequency, amplitude, rise time and decay time are shown as functions of age. N = 11 cells for P3, P6, P9, and P30; N = 12 for P12, P15, and P20. The frequency of mIPSCs remains steady for P3–P12, peaks at P20, and then drops back down at P30. The frequency at P20 is significantly higher than those at P3, 6, 9, and 30 (ANOVA p = 0.0012, pairwise comparison by Tukey’s HSD test, p < 0.05). The amplitude of mIPSCs increases significantly with age, being significantly higher at P30 than at P9 (Tukey’s p < 0.05). Rise time peaks at P12; the P12 value is significantly higher than those at P3 and P30, while the P15 value is significantly higher than the P3 value (ANOVA p = 0.0012, Tukey’s p < 0.05). Decay time does not change significantly (ANOVA p = 0.42). (E) The number of quanta in a single DDI trial was obtained by dividing the integrated charge in the DDI by the integrated charge in the average mIPSC at each age. Note that the increased amplitude of the P30 mIPSCs outweighs the moderate speeding of its decay time to give it a larger area than the P3 and P15 mIPSCs. For clarity, data for only three representative ages are shown. Error bars are not included as the values are derived from other measurements. (F) Electrotonic filtering is not a source of variability in mIPSC kinetics. (F1) Mean variance of rise time vs. age. The variance of the rise times of all mIPSCs recorded in a particular cell is calculated, and the average variance for each age is plotted (N = 6 for each age). The variance does not change with age (ANOVA p = 0.12). (F2) Mean correlation coefficient of rise time and amplitude as a function of age. The correlation coefficient of rise time and amplitude for all mIPSCs recorded in a particular cell is calculated, and the average value for each age is plotted (N = 6 for each age). The positive correlation increases significantly with age (ANOVA p = 0.007).
We also looked for any contribution of changes in electrotonic decay to the measured mIPSC parameters (Figure 3F). Assuming that rise times will be more readily high-pass filtered than decay times (Magee and Cook, 2000), and that rise times are less likely than decay times to be dependent on GABAA receptor subunit assemblies (Hajos and Mody, 1997), we calculated the variance in rise times of the individual mIPSCs recorded in six cells each at P3, P15, and P30 and found no change with age. Increasing heterogeneity of electrotonic locations should lead to increasing variance of rise times when mean rise times are similar across ages. We also computed the correlation between the rise times and amplitudes of individual mIPSCs recorded in six cells each at P3, P15, and P30. We found a positive correlation between rise time and amplitude, significantly increasing from P3 to P30 (mean correlation coefficient 0.03 ± 0.06 at P3, 0.17 ± 0.05 at P15, and 0.38 ± 0.08 at P30, ANOVA p = 0.007). One would expect that filtering would make mIPSCs from distal synapses appear artificially slow and small; the fact that the slower events tend also to be larger in P15 and P30 cells, suggests that either those distal synapses have unexpectedly large amplitudes or the distal events are not being detected at all. If distal mIPSCs are indeed not electrically detectable at the soma, their absence would suggest that an increase in passive electronic filtering or a change in active dendritic processes as the lateral dendrites lengthen with age could contribute to the reduction of DDI in older animals.
Changes in Paired-Pulse Ratio May Contribute to the Early Increase in DDI
Another candidate for the reduction in the DDI between P15 and P30 is a decrease in release probability. If the release probability at either the MC-to-GC excitatory synapse or the GC-to-MC excitatory synapse was reduced, a voltage step in a MC would evoke less DDI in the older animal. A direct measurement of release probability is quite challenging. However, the depletion model of synaptic depression predicts that an increase in initial probability of release (P) at a synapse results in a decrease in paired-pulse ratio (PPR; Zucker and Regehr, 2002). At other rodent synapses, the PPR can increase (Bolshakov and Siegelbaum, 1995), decrease (Mori-Kawakami et al., 2003), or remain unchanged (Hsia et al., 1998) during development. Physical substrates for a change in release probability can include a change in any parameter starting with action potential (AP) shape, calcium dynamics, vesicle pool properties, and exocytic machinery (Atwood and Karunanithi, 2002; Branco and Staras, 2009). To look for a developmental change in initial release probability, we tested the PPR of the granule-to-mitral synapse at ages P3, 15, and 30. We have shown previously that the combined mitral–granule synapse, as measured with DDI, displays paired-pulse depression at P9–17; we have also shown that the two sides of the synapse can be isolated using extracellular stimulation in the EPL (Dietz and Murthy, 2005). The GC-to-MC side of the synapse is a promising place to look for changes in release probability for two reasons: first, because the GC-to-MC synapse displayed characteristic paired-pulse depression that probably dominates the circuit behavior at short interstimulus intervals, and second, because a reduction in release probability at the GC-to-MC synapse would also explain the reduced frequency of mIPSCs recorded in MCs. Here, we delivered two stimuli 100 ms apart and measured the PPR as the ratio of the peak of the second response to the first (Figure 4). At P3, the synapse displayed paired-pulse facilitation (an average PPR of 1.27 ± 0.27), while at P15 and P30, it displayed depression (PPRs of 0.52 ± 0.10 and 0.35 ± 0.08, respectively; the P3 value was significantly different from the P15 and P30 values, ANOVA p = 0.0039; pairwise Tukey’s HSD, p < 0.05 and 0.01, respectively). At the granule-to-mitral synapse, the decrease in PPR suggests an increase in P, which could partially account for the increase in evoked DDI between P3 and P15, but does not account for the decrease in evoked DDI or mIPSC frequency between P15 and P30.
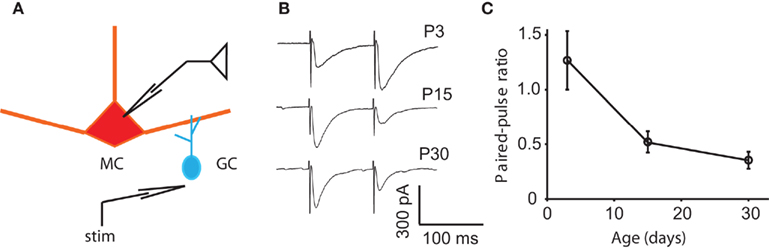
Figure 4. Changes in paired-pulse ratio may contribute to the early increase in DDI. (A) Drawing of the recording configuration, in which GC release is evoked by extracellular stimulation in the EPL and IPSCs recorded in the MC. (B) Sample traces of responses to pairs of extracellular stimuli in the EPL with an interpulse interval of 100 ms. Traces are averages of 10, 8, and 11 trials, respectively. (C) Average paired-pulse ratio at different ages. At P3, the synapse displays paired-pulse facilitation, while at P15 and P30, it displays depression (N = 6 cells for each age). The P3 value is significantly different from the P15 and P30 values (the P3 value is significantly different from the P15 and P30 values, ANOVA p = 0.0039; pairwise Tukey’s p < 0.05 and 0.01, respectively).
Changes in the Balance of AMPA and NMDA Currents May Contribute to the Late Reduction in DDI
Another mechanism that could account for the decrease in DDI with age would be an increase in the proportion of NMDA-only silent synapses at the excitatory MC-to-GC side of the reciprocal synapse. Silent synapses would appear anatomically, but would not be activated by glutamate release unless the magnesium block of the NMDA receptors on the post-synaptic GC were relieved. The magnesium block would normally be relieved by depolarization of the post-synaptic cell in vivo, but in vitro the block can be relieved simply by recording in magnesium-free extracellular solution. If DDI in 0 Mg did not show the decrease after P15, we would conclude that some of the synapses appearing late in development were indeed NMDA-only silent synapses.
In 0 Mg, peak currents of up to 10 nA could be evoked with a 100-ms step to 0 mV (Figure 5). The mean current evoked in physiological Mg (1.5 mM) was 10% of the mean current evoked in 0 Mg at P15. NMDA-mediated currents are known to be unusually important for fast synaptic transmission at this synapse when their Mg block is relieved by concomitant AMPA receptor activation; as a result of this strong influence of NMDA receptors we found DDI to be greatly enhanced in the absence of Mg at all ages, as has previously been shown in older animals (Isaacson and Strowbridge, 1998; Schoppa et al., 1998). We measured DDI at five age groups in 0 Mg. Evoked DDI peaked at P20, with DDI changing significantly with age and P15 being significantly larger than P3–6 (ANOVA p = 0.044, pairwise Tukey’s HSD, p < 0.05). The DDI data for physiological Mg and 0 Mg are plotted in Figure 5B; they are also shown normalized to their respective values at P3 in Figure 5C, with the data obtained with physiological Mg from Figure 1 binned to compare with the 0 Mg data. The curves were similar in shape, but the effect in the absence of Mg was much less pronounced. It is also interesting to note that the peak DDI arrives at P20 in 0 Mg, later than the P15 in physiological Mg. If these large currents evoked in 0 Mg were saturating, the largest currents at P15 and P20 might be blunted and the effect of age on DDI masked. However, a shorter, 5 ms voltage step in these same cells evoked smaller currents that displayed the same age-dependent curve (Figure 5B). Since the phenomenon of reduced DDI between P15–20 and P30 was greatly dampened in 0 Mg, an increase in the relative contribution of NMDA receptors may indeed contribute to the reduction in DDI between P15 and P30.
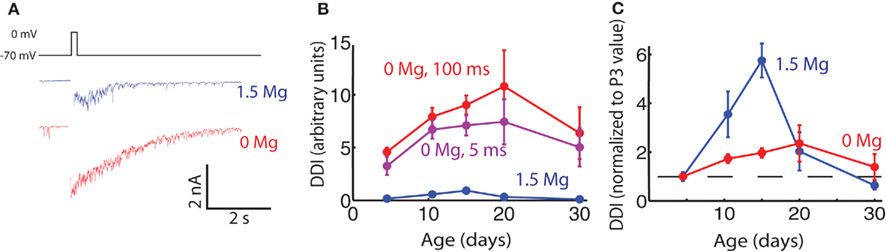
Figure 5. Evoked DDI in 0 extracellular Mg peaks less sharply than in physiological Mg. (A) Sample single trace of DDI evoked by 100 ms voltage step from −70 to 0 mV, in two cells in P15 animals, one in physiological Mg (1.5 mM, blue), and one in 0 Mg (red). The period of the stimulus is blanked. (B) DDI plotted as a function of age for three conditions: 1.5 mM Mg and 100 ms step (blue); 0 Mg and 100 ms step (red), and 0 Mg and 5 ms step (purple). The 1.5-Mg: N = 7 cells for P3–6 and P9–12; N = 3 for P15 and P20; and N = 4 for P30. The 0-Mg, both step lengths: N = 8 for P3–6, N = 7 for P9–12, N = 4 for P15 and P20; and N = 3 for P30. At each age point the DDI in 0 Mg 100 ms step was significantly different from the DDI in 1.5 Mg (unpaired t-test, p < 0.02). Within the 0-Mg 100 ms step condition the DDI were significantly different with age, P15 being higher than P3–6 (ANOVA p = 0.04, Tukey’s p < 0.05). (C) DDI plotted as a function of age, normalized to the average value at P3 (dashed line drawn through ordinate value of 1)
GC Excitability Contributes Only Moderately to the Late Reduction in DDI
Another possible contributor to the changes in DDI would be a change in GC excitability; if the GCs become less excitable with age, a voltage step in the MC releasing the same quantity of glutamate at a given synapse may be less likely to evoke reciprocal GABA release in the GCs. In a slice preparation, increasing the excitability of GCs via muscarinic receptors facilitates the long-term inhibition of MCs (Pressler et al., 2007), and decreasing the excitability of GCs via blockade of mGluR activity reduces MC autoinhibition (Heinbockel et al., 2007). Although no direct developmental studies of GC excitability have been previously attempted, newborn GCs in adults are moderately more excitable than older cells (Saghatelyan et al., 2005), but adult-born GCs become electrically indistinguishable from older cells once they become fully mature (Carleton et al., 2003). We tested the excitability of GCs at ages P5, 15, and 30 by making whole-cell current-clamp recordings and measuring their intrinsic properties and responses to current injection.
Granule cell somata were patched, their resting membrane potentials recorded, and the somata held below firing threshold with small current injections (Figure 6A). Excitability was measured in several ways. The GC firing properties were studied by delivering consecutive current pulses, 500 ms duration each, ranging from −20 to +150 pA with a 10-pA increment (Figure 6B). Within the resolution of the current steps used, the minimum current required to evoke APs did not change significantly with age (Figure 6C, ANOVA p = 0.50). Once the minimum threshold current was reached, however, the latency to the first spike for currents above threshold did increase significantly with age (Figure 6D, N-way ANOVA, contribution of age p = 3.4e−7). In other cell types, an increase in latency to the first spike is attributed largely to low-threshold inactivating potassium currents (IA), with contributions from other low-threshold currents (Llinas and Alonso, 1992; Nisenbaum et al., 1994; Molineux et al., 2005; Koyama and Appel, 2006). Prominent IA currents are present in GCs, and blocking these currents greatly increases their spiking in response to MC-mediated excitation (Schoppa and Westbrook, 1999). The input resistance did not change significantly with age (Figure 6E, ANOVA p = 0.48), but the resting membrane potential did become more negative with age (Figure 6F; ANOVA p = 0.05, P5 significantly different from P30 Tukey’s HSD, p < 0.05). Combined, the changes in resting membrane potential and spike latency would lead to a decrease in GC excitability between P15 and P30 and could contribute to the reduction in DDI over this period.
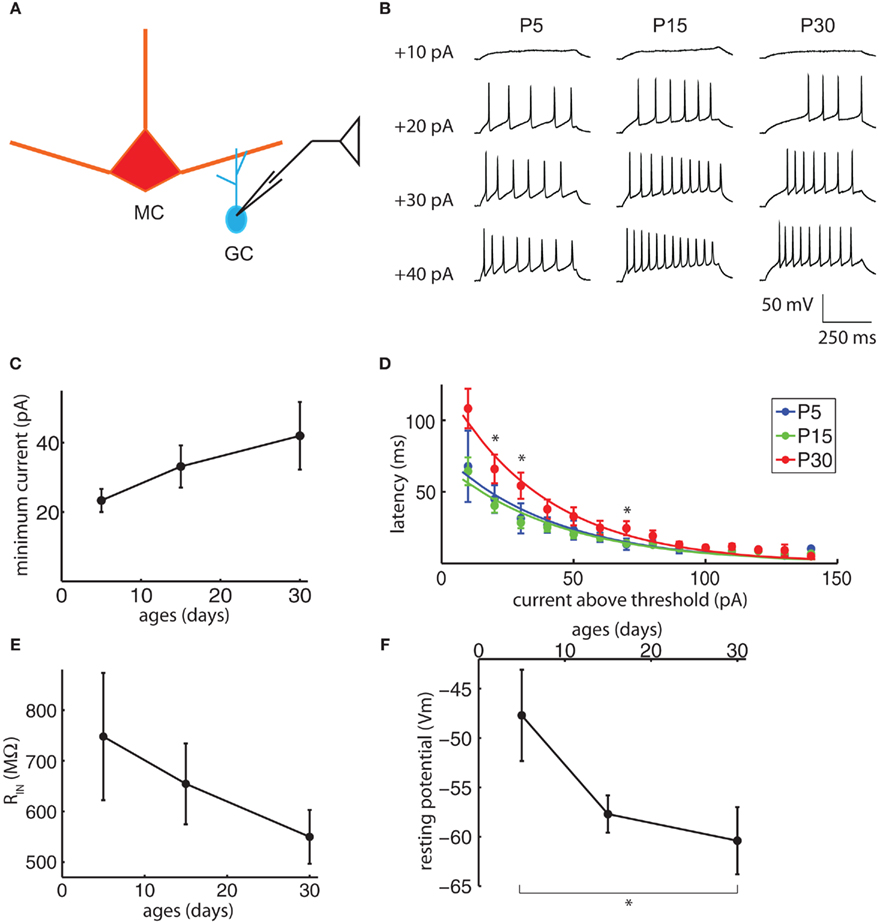
Figure 6. Granule cell excitability may contribute to the late reduction in DDI. (A) Drawing of the recording configuration. Consecutive 500 ms duration current injections from −20 to +150 pA were delivered into GCs, with 10 pA increments and 5 s inter-injection intervals. (B) Sample traces of the minimum current injection to evoke action potentials (APs) in GCs with age, showing the injected current and the latency to the first spike. (C) The minimum current to evoke APs does not change significantly with age (ANOVA p = 0.50). (D) The latency to the first AP increases with age. The current above threshold is plotted vs. time between the onset of the current step and the first spike for ages P5, P15, and P30 (N-way ANOVA, contribution of age p = 3.4e−7). Curves are fitted to a single exponential. Asterisks indicate time points for which the P30 values are significantly different from P5 and P15 (Tukey’s p < 0.05). (E) Input resistance does not change significantly with age (ANOVA p = 0.48). (F) Resting potentials become significantly more negative with age (ANOVA p = 0.05, pairwise Tukey’s p < 0.05 indicated by asterisk). N = 6 for P5; N = 25 for P15; N = 12 for P30 for (D–F), N = 3 for P5; N = 16 for P15; N = 10 for P30 for (C).
Discussion
We have shown that the strength of DDI increases from P3 to P15, and then decreases between P15 and P30. We have tested several possible mechanisms.
The increase in DDI from P3 to P15 presumably arises largely from the increase in the number of synapses, with a contribution from an increase in release probability from GCs. The decrease in DDI from P15 to P30 even as the number of anatomically identified synapses increases, may arise from several factors. A moderate reduction in GC excitability likely contributes to the fall, but may be insufficient to account for the entire, dramatic effect. The reduction in mIPSC frequency from P20 to P30 may hold the answer. A drop in mIPSC frequency can be a result of reduced synapse number, reduced number of release sites per synapse, reduced release probability, or an increase in the proportion of synapses that are functionally silent (for example, with no functional GABAA receptors, or with a synaptic weight near zero). We have shown that release probability in the GC-to-MC direction does not change between P15 and P30. This leaves two major mechanisms: a reduction in the number of release sites available to participate in autoinhibition, and an increase in the number of functionally silent synapses.
Possible Changes in the Number of Available Release Sites
How might synapses anatomically identified by microscopy methods actually be ineffective or non-functional? GC–MC synapses could be made inaccessible to the voltage-step-evoked depolarization even as the total number of synapses increases. Based on our recordings of mIPSCs, the lack of an increase in variance with age, and the absence of small and slow mIPSCs seem to suggest that distal synapses are indeed becoming electrically isolated from the soma by passive electrotonic filtering. Although our detection criteria for mIPSCs were permissive for very slow events, events of very small amplitude would have eventually disappeared below the noise. It is possible that if mIPSCs are not recordable at the soma, mIPSC-sized events from those synapses are less likely to contribute to changes in membrane potential at the soma (although DDI would be less affected by passive filtering than would individual mIPSCs, as charge transfer is significantly less sensitive to changes in electrotonic distance than are rise time and amplitude; Byrne and Shepherd, 2009). Instead, these synapses may participate in local dendrodendritic computations that are entirely separate from the somatic compartment. In addition to the effect of passive filtering, active processing in the dendrites could change with age. For example a developmental change in dynamic gating (Lowe, 2002; Xiong and Chen, 2002) could electrically isolate even relatively proximal synapses in older animals. Proximal GC–MC synapses could be pruned as distal synapses are added, effectively reducing the number of synapses available for DDI evoked in the soma even as the total number of synapses increases. A final possibility is that many of the synapses identified microscopically in the adult animal, despite their appearance, lack critical synaptic machinery, or have synaptic weights near zero. In future studies, immunohistochemistry or electron microscopy can be used to map the development and distribution of synapses containing specific synaptic proteins in order to address these interesting possibilities.
The reduction in DDI amplitude from P15–20 to P30 may indicate that connections between MCs are being made more precise over this period. Odor recognition could be improved by optimization of connections between MCs that respond to odotopes associated with the same odorant molecule, or to odors that are commonly associated in the environment. Refinement of connections between MCs could help to sharpen responses to behaviorally relevant stimuli by, for example, weakening lateral inhibition between MCs that respond to related odors, enhancing their mutual ability to fire in response to that odor.
In glomerular formation, anatomical targeting is complete by birth (Meisami and Sendera, 1993; Treloar et al., 1999). Adult-like patterns of odor-evoked glomerular activation evolve only slightly from P4 to P24, but MC activation patterns become much sparser as more GCs appear in the bulb and are activated by the odor (Guthrie and Gall, 2003). Even though fewer MC–GC synapses may be activated, they may be more effective. A single proximal GC closing off propagation along an entire dendrite may do more to influence network formation than dozens of GCs located more distally, or at less critical anatomic junctions (Lowe, 2002; Xiong and Chen, 2002). Therefore, even as the total DDI evoked by voltage step decreases, effective auto- and lateral-inhibition evoked in vivo could be increasing. It is also possible that changes in MC synapses with inhibitory interneurons in the glomerular layer over development may contribute to changing DDI, although there is little evidence for a contribution of glomerular inhibition to the DDI measured in the manner reported here (Pimentel and Margrie, 2008). MCs also display some self-excitation through dendritic glutamate receptors; although the magnitude of self-excitation is small compared to the DDI evoked with symmetric chloride concentration, self-excitation could also change with age and make some contribution (Aroniadou-Anderjaska et al., 1999; Isaacson, 1999; Friedman and Strowbridge, 2000).
The Changing Role of NMDA with Age
The MC–GC reciprocal synapse is unusually dependent on NMDA receptors for fast synaptic transmission. Isaacson and Strowbridge (1998) showed that in physiological levels of magnesium, in which NMDA currents must be released from Mg-dependent voltage block by simultaneous AMPA activation, both AMPA and NMDA channels are necessary for DDI. In Mg-free solution, in which NMDA currents are relieved from voltage-dependent block, DDI is both greatly enhanced and is mediated predominantly by NMDA receptors. While both Mg-containing and Mg-free DDI peak at P15–P20, the effect in the absence of Mg is much reduced. As a result of the much greater age-dependent change in DDI in physiological Mg, the ratio of the DDI measured in physiological Mg to 0 Mg conditions peaks at P15, suggesting that NMDA currents onto GCs are greater early and late in development than in the P15–P20 window. There are many possible explanations for this relative increase in the importance of NMDA. One is an increase in NMDA-only silent synapses (Kerchner and Nicoll, 2008) late in development. Although post-synaptically silent synapses can persist in adult animals (Sametsky et al., 2010), silent synapses are usually associated with early development, converting to mixed AMPA/NMDA synapses with maturity (Isaac et al., 1995; Liao et al., 1995; Durand et al., 1996; Wu et al., 1996; Li and Sheng, 2003). Another possible but as yet undemonstrated mechanism would be synapses that contain both AMPA and NMDA increasing their proportion of NMDA receptors. A reduction in the calcium permeability of AMPA receptors with age could also reduce the effectiveness, and the relative contribution, of AMPA receptors even as they remained numerous (Kumar et al., 2002; Cull-Candy et al., 2006). Finally, a change in the distribution of pre- and post-synaptic machinery, such as increasing colocalization of NMDA channels and GABA vesicles, could enhance the effect of NMDA channels on reciprocal GABA release (Halabisky et al., 2000; although see Isaacson, 2001).
Conclusion
In summary, our experiments have uncovered a striking developmental profile of MC autoinhibition in the OB as measured with DDI. An initial increase in DDI is followed by a reduction by 1 month of age. We have investigated several possible mechanisms for this unexpected reduction, and conclude that a reduction in the number of available synapses; a decrease in GC excitability; and an increase in the relative contribution of NMDA receptors to GABA release from GC synapses could contribute to the reduction. An interesting question for future studies is how this biphasic development of inhibition affects or constrains odor processing in the OB.
Acknowledgments
We thank Ron Harris-Warrick, Charles Greer, and Thom Cleland for comments on the manuscript. Research in this manuscript was supported in part by funds from Harvard University to Venkatesh N. Murthy, a Swiss National Foundation fellowship to Foivos Markopoulos and a Ruth L. Kirschstein National Research Service Award (5F31 DC5273) to Shelby B. Dietz.
References
Abraham, N. M., Egger, V., Shimshek, D. R., Renden, R., Fukunaga, I., Sprengel, R., Seeburg, P. H., Klugmann, M., Margrie, T. W., Schaefer, A. T., and Kuner, T. (2010). Synaptic inhibition in the olfactory bulb accelerates odor discrimination in mice. Neuron 65, 399–411.
Armstrong, C. M., DeVito, L. M., and Cleland, T. A. (2006). One-trial associative odor learning in neonatal mice. Chem. Senses 31, 343–349.
Aroniadou-Anderjaska, V., Ennis, M., and Shipley, M. T. (1999). Dendrodendritic recurrent excitation in mitral cells of the rat olfactory bulb. J. Neurophysiol. 82, 489–494.
Atwood, H. L., and Karunanithi, S. (2002). Diversification of synaptic strength: presynaptic elements. Nat. Rev. Neurosci. 3, 497–516.
Bolshakov, V. Y., and Siegelbaum, S. A. (1995). Regulation of hippocampal transmitter release during development and long-term potentiation. Science 269, 1730–1734.
Branco, T., and Staras, K. (2009). The probability of neurotransmitter release: variability and feedback control at single synapses. Nat. Rev. Neurosci. 10, 373–383.
Brunet, L. J., Gold, G. H., and Ngai, J. (1996). General anosmia caused by a targeted disruption of the mouse olfactory cyclic nucleotide-gated cation channel. Neuron 17, 681–693.
Byrne, J. H., and Shepherd, G. M. (2009). “Electronic properties of axons and dendrites,” in From Molecules to Networks, 2nd Edn, eds J. H. Byrne, and J. L. Roberts (Burlington, MA: Academic Press), 111–132.
Carlen, M., Cassidy, R. M., Brismar, H., Smith, G. A., Enquist, L. W., and Frisen, J. (2002). Functional integration of adult-born neurons. Curr. Biol. 12, 606–608.
Carleton, A., Petreanu, L. T., Lansford, R., Alvarez-Buylla, A., and Lledo, P. M. (2003). Becoming a new neuron in the adult olfactory bulb. Nat. Neurosci. 6, 507–518.
Chen, W. R., and Shepherd, G. M. (1997). Membrane and synaptic properties of mitral cells in slices of rat olfactory bulb. Brain Res. 745, 189–196.
Cull-Candy, S., Kelly, L., and Farrant, M. (2006). Regulation of Ca2+-permeable AMPA receptors: synaptic plasticity and beyond. Curr. Opin. Neurobiol. 16, 288–297.
Dietz, S. B., and Murthy, V. N. (2005). Contrasting short-term plasticity at two sides of the mitral-granule reciprocal synapse in the mammalian olfactory bulb. J. Physiol. (Lond.) 569, 475–488.
Durand, G. M., Kovalchuk, Y., and Konnerth, A. (1996). Long-term potentiation and functional synapse induction in developing hippocampus. Nature 381, 71–75.
Frazier, L. L., and Brunjes, P. C. (1988). Unilateral odor deprivation: early postnatal changes in olfactory bulb cell density and number. J. Comp. Neurol. 269, 355–370.
Friedman, D., and Strowbridge, B. W. (2000). Functional role of NMDA autoreceptors in olfactory mitral cells. J. Neurophysiol. 84, 39–50.
Gheusi, G., Cremer, H., McLean, H., Chazal, G., Vincent, J. D., and Lledo, P. M. (2000). Importance of newly generated neurons in the adult olfactory bulb for odor discrimination. Proc. Natl. Acad. Sci. U.S.A. 97, 1823–1828.
Guthrie, K. M., and Gall, C. (2003). Anatomic mapping of neuronal odor responses in the developing rat olfactory bulb. J. Comp. Neurol. 455, 56–71.
Hajos, N., and Mody, I. (1997). Synaptic communication among hippocampal interneurons: properties of spontaneous IPSCs in morphologically identified cells. J. Neurosci. 17, 8427–8442.
Halabisky, B., Friedman, D., Radojicic, M., and Strowbridge, B. W. (2000). Calcium influx through NMDA receptors directly evokes GABA release in olfactory bulb granule cells. J. Neurosci. 20, 5124–5134.
Heinbockel, T., Laaris, N., and Ennis, M. (2007). Metabotropic glutamate receptors in the main olfactory bulb drive granule cell-mediated inhibition. J. Neurophysiol. 97, 858–870.
Hinds, J. W., and Hinds, P. L. (1976). Synapse formation in the mouse olfactory bulb. I. Quantitative studies. J. Comp. Neurol. 169, 15–40.
Hsia, A. Y., Malenka, R. C., and Nicoll, R. A. (1998). Development of excitatory circuitry in the hippocampus. J. Neurophysiol. 79, 2013–2024.
Isaac, J. T., Nicoll, R. A., and Malenka, R. C. (1995). Evidence for silent synapses: implications for the expression of LTP. Neuron 15, 427–434.
Isaacson, J. S. (1999). Glutamate spillover mediates excitatory transmission in the rat olfactory bulb. Neuron 23, 377–384.
Isaacson, J. S. (2001). Mechanisms governing dendritic gamma-aminobutyric acid (GABA) release in the rat olfactory bulb. Proc. Natl. Acad. Sci. U.S.A. 98, 337–342.
Isaacson, J. S., and Strowbridge, B. W. (1998). Olfactory reciprocal synapses: dendritic signaling in the CNS. Neuron 20, 749–761.
Johanson, I. B., and Hall, W. G. (1979). Appetitive learning in 1-day-old rat pups. Science 205, 419–421.
Kapoor, V., and Urban, N. N. (2006). Glomerulus-specific, long-latency activity in the olfactory bulb granule cell network. J. Neurosci. 26, 11709–11719.
Kerchner, G. A., and Nicoll, R. A. (2008). Silent synapses and the emergence of a postsynaptic mechanism for LTP. Nat. Rev. Neurosci. 9, 813–825.
Koyama, S., and Appel, S. B. (2006). A-type K+ current of dopamine and GABA neurons in the ventral tegmental area. J. Neurophysiol. 96, 544–554.
Kumar, S. S., Bacci, A., Kharazia, V., and Huguenard, J. R. (2002). A developmental switch of AMPA receptor subunits in neocortical pyramidal neurons. J. Neurosci. 22, 3005–3015.
Li, Z., and Sheng, M. (2003). Some assembly required: the development of neuronal synapses. Nat. Rev. Mol. Cell Biol. 4, 833–841.
Liao, D., Hessler, N. A., and Malinow, R. (1995). Activation of postsynaptically silent synapses during pairing-induced LTP in CA1 region of hippocampal slice. Nature 375, 400–404.
Lisman, J. E., Raghavachari, S., and Tsien, R. W. (2007). The sequence of events that underlie quantal transmission at central glutamatergic synapses. Nat. Rev. Neurosci. 8, 597–609.
Lledo, P. M., Gheusi, G., and Vincent, J. D. (2005). Information processing in the mammalian olfactory system. Physiol. Rev. 85, 281–317.
Llinas, R. R., and Alonso, A. (1992). Electrophysiology of the mammillary complex in vitro. I. Tuberomammillary and lateral mammillary neurons. J. Neurophysiol. 68, 1307–1320.
Lowe, G. (2002). Inhibition of backpropagating action potentials in mitral cell secondary dendrites. J. Neurophysiol. 88, 64–85.
Magee, J. C., and Cook, E. P. (2000). Somatic EPSP amplitude is independent of synapse location in hippocampal pyramidal neurons. Nat. Neurosci. 3, 895–903.
Malenka, R. C., and Nicoll, R. A. (1997). Learning and memory. Never fear, LTP is hear. Nature 390, 552–553.
Margrie, T. W., Sakmann, B., and Urban, N. N. (2001). Action potential propagation in mitral cell lateral dendrites is decremental and controls recurrent and lateral inhibition in the mammalian olfactory bulb. Proc. Natl. Acad. Sci. U.S.A. 98, 319–324.
Meisami, E., and Sendera, T. J. (1993). Morphometry of rat olfactory bulbs stained for cytochrome oxidase reveals that the entire population of glomeruli forms early in the neonatal period. Brain Res. Dev. Brain Res. 71, 253–257.
Molineux, M. L., Fernandez, F. R., Mehaffey, W. H., and Turner, R. W. (2005). A-type and T-type currents interact to produce a novel spike latency-voltage relationship in cerebellar stellate cells. J. Neurosci. 25, 10863–10873.
Mori, K., Nagao, H., and Yoshihara, Y. (1999). The olfactory bulb: coding and processing of odor molecule information. Science 286, 711–715.
Mori-Kawakami, F., Kobayashi, K., and Takahashi, T. (2003). Developmental decrease in synaptic facilitation at the mouse hippocampal mossy fibre synapse. J. Physiol. (Lond.) 553, 37–48.
Nisenbaum, E. S., Xu, Z. C., and Wilson, C. J. (1994). Contribution of a slowly inactivating potassium current to the transition to firing of neostriatal spiny projection neurons. J. Neurophysiol. 71, 1174–1189.
Nusser, Z., Kay, L. M., Laurent, G., Homanics, G. E., and Mody, I. (2001). Disruption of GABA(A) receptors on GABAergic interneurons leads to increased oscillatory power in the olfactory bulb network. J. Neurophysiol. 86, 2823–2833.
Parrish-Aungst, S., Shipley, M. T., Erdelyi, F., Szabo, G., and Puche, A. C. (2007). Quantitative analysis of neuronal diversity in the mouse olfactory bulb. J. Comp. Neurol. 501, 825–836.
Pimentel, D. O., and Margrie, T. W. (2008). Glutamatergic transmission and plasticity between olfactory bulb mitral cells. J. Physiol. (Lond.) 586, 2107–2119.
Pressler, R. T., Inoue, T., and Strowbridge, B. W. (2007). Muscarinic receptor activation modulates granule cell excitability and potentiates inhibition onto mitral cells in the rat olfactory bulb. J. Neurosci. 27, 10969–10981.
Price, J. L., and Powell, T. P. (1970). The synaptology of the granule cells of the olfactory bulb. J. Cell Sci. 7, 125–155.
Pun, R. Y., Neale, E. A., Guthrie, P. B., and Nelson, P. G. (1986). Active and inactive central synapses in cell culture. J. Neurophysiol. 56, 1242–1256.
Rall, W., Shepherd, G. M., Reese, T. S., and Brightman, M. W. (1966). Dendrodendritic synaptic pathway for inhibition in the olfactory bulb. Exp. Neurol. 14, 44–56.
Rosselli-Austin, L., and Altman, J. (1979). The postnatal development of the main olfactory bulb of the rat. J. Dev. Physiol. 1, 295–313.
Saghatelyan, A., Roux, P., Migliore, M., Rochefort, C., Desmaisons, D., Charneau, P., Shepherd, G. M., and Lledo, P. M. (2005). Activity-dependent adjustments of the inhibitory network in the olfactory bulb following early postnatal deprivation. Neuron 46, 103–116.
Sametsky, E. A., Disterhoft, J. F., Geinisman, Y., and Nicholson, D. A. (2010). Synaptic strength and postsynaptically silent synapses through advanced aging in rat hippocampal CA1 pyramidal neurons. Neurobiol. Aging 31, 813–825.
Schoppa, N. E., Kinzie, J. M., Sahara, Y., Segerson, T. P., and Westbrook, G. L. (1998). Dendrodendritic inhibition in the olfactory bulb is driven by NMDA receptors. J. Neurosci. 18, 6790–6802.
Schoppa, N. E., and Urban, N. N. (2003). Dendritic processing within olfactory bulb circuits. Trends Neurosci. 26, 501–506.
Schoppa, N. E., and Westbrook, G. L. (1999). Regulation of synaptic timing in the olfactory bulb by an A-type potassium current. Nat. Neurosci. 2, 1106–1113.
Shao, Z., Puche, A. C., Kiyokage, E., Szabo, G., and Shipley, M. T. (2009). Two GABAergic intraglomerular circuits differentially regulate tonic and phasic presynaptic inhibition of olfactory nerve terminals. J. Neurophysiol. 101, 1988–2001.
Shepherd, G. M., and Greer, C. A. (1998). “Olfactory bulb,” in The Synaptic Organization of the Brain, ed. G. M. Shepherd (New York: Oxford University Press), 159–203.
Stopfer, M., Bhagavan, S., Smith, B. H., and Laurent, G. (1997). Impaired odour discrimination on desynchronization of odour-encoding neural assemblies. Nature 390, 70–74.
Teicher, M. H., and Blass, E. M. (1977). First suckling response of the newborn albino rat: the roles of olfaction and amniotic fluid. Science 198, 635–636.
Treloar, H. B., Purcell, A. L., and Greer, C. A. (1999). Glomerular formation in the developing rat olfactory bulb. J. Comp. Neurol. 413, 289–304.
Turrigiano, G. G., and Nelson, S. B. (2004). Homeostatic plasticity in the developing nervous system. Nat. Rev. Neurosci. 5, 97–107.
Wilson, D. A., and Leon, M. (1986). Early appearance of inhibition in the neonatal rat olfactory bulb. Brain Res. 391, 289–292.
Wilson, D. A., and Leon, M. (1987). Abrupt decrease in synaptic inhibition in the postnatal rat olfactory bulb. Brain Res. 430, 134–138.
Wu, G., Malinow, R., and Cline, H. T. (1996). Maturation of a central glutamatergic synapse. Science 274, 972–976.
Xiong, W., and Chen, W. R. (2002). Dynamic gating of spike propagation in the mitral cell lateral dendrites. Neuron 34, 115–126.
Yokoi, M., Mori, K., and Nakanishi, S. (1995). Refinement of odor molecule tuning by dendrodendritic synaptic inhibition in the olfactory bulb. Proc. Natl. Acad. Sci. U.S.A. 92, 3371–3375.
Keywords: olfaction, autoinhibition, mitral
Citation: Dietz SB, Markopoulos F and Murthy VN (2011) Postnatal development of dendrodendritic inhibition in the mammalian olfactory bulb. Front. Cell. Neurosci. 5:10. doi: 10.3389/fncel.2011.00010
Received: 16 March 2011; Accepted: 08 June 2011;
Published online: 27 June 2011.
Edited by:
Michael T. Shipley, University of Maryland School of Medicine, USAReviewed by:
Michael Beierlein, University of Texas Medical School at Houston, USANathan Urban, Carnegie Mellon University, USA
Matt Wachowiak, University of Utah, USA
Copyright: © 2011 Dietz, Markopoulos and Murthy. This is an open-access article subject to a non-exclusive license between the authors and Frontiers Media SA, which permits use, distribution and reproduction in other forums, provided the original authors and source are credited and other Frontiers conditions are complied with.
*Correspondence: Shelby B. Dietz, Department of Neurobiology and Behavior, Cornell University, Seeley Mudd Hall, Ithaca, NY 14853, USA. e-mail: sdietz@cornell.edu; Venkatesh N. Murthy, Department of Molecular and Cellular Biology, Harvard University, 16 Divinity Avenue, Cambridge, MA 02138, USA. e-mail: vnmurthy@fas.harvard.edu