Changes in physiology before, during, and after yawning
- Department of Psychology, University at Albany, State University of New York, Albany, NY, USA
The ultimate function of yawning continues to be debated. Here, we examine physiological measurements taken before, during, and after yawns in humans, in an attempt to identify key proximate mechanisms associated with this behavior. In two separate studies we measured changes in heart rate, lung volume, eye closure, skin conductance, ear pulse, respiratory sinus arrhythmia, and respiratory rate. Data were depicted from 75 s before and after yawns, and analyzed at baseline, during, and immediately following yawns. Increases in heart rate, lung volume, and eye muscle tension were observed during or immediately following yawning. Patterns of physiological changes during yawning were then compared to data from non-yawning deep inhalations. In one study, respiration period increased following the execution of a yawn. Much of the variance in physiology surrounding yawning was specific to the yawning event. This was not the case for deep inhalation. We consider our findings in light of various hypotheses about the function of yawning and conclude that they are most consistent with the brain cooling hypothesis.
Introduction
Yawning has been recorded in all five classes of vertebrates, and is phylogenically old, implying that it is an evolved mechanism that serves an important adaptive function (Baenninger, 1987). Yawning consists of opening the mouth, deep inspiration, a short period of apnea, followed by expiration (Walusinski and Deputte, 2004). In humans and other animals, yawning frequency has been shown to be dependent upon circadian rhythms (Zilli et al., 2007). Studies of yawning have generated varying explanations regarding its ultimate function and proximate mechanisms (Guggisberg et al., 2010).
One commonly held notion is that yawning functions to modify levels of oxygen and carbon dioxide in the blood. However, when measured in a controlled environment, yawning frequency was not affected by manipulating levels of oxygen and carbon dioxide (Provine et al., 1987). The same study demonstrated that while exercise doubled breathing rate, indicating a strong increase in oxygen requirements, yawning frequency remained unaffected.
A more recent hypothesis proposes that yawning facilitates arousal (Baenninger, 1997; Walusinski, 2006). Evidence for this hypothesis comes from the elevated occurrence of yawning before important events or during behavioral transitions (Baenninger, 1997). Matikainen and Elo (2008) proposed a proximate mechanism to support this theory, suggesting that yawning mechanically stimulates the carotid artery, promoting an increase in cortical arousal via neck compressions that accompany yawning. The carotid body is highly vascularized and compressions may increase circulation, resulting in stimulation by hormones such as adenosine or catecholamines (Matikainen and Elo, 2008).
The occurrence of contagious yawning has led some researchers to conclude that the primary purpose of yawning is to provide a means of inner-species social communication (Guggisberg et al., 2010), suggesting that yawning may be a catalyst for conveying empathetic feelings, or messages to a member of ones species. This hypothesis fails to account for several important aspects of yawning; including the proximate behaviors associated with yawning such as stretching, eye and mouth watering, mouth gaping, eye closure, or deep respiration, and the fact that contagious yawning occurs only in a few species, and frequently occurs in solitude. A recent review of this theory, suggests that the social implications of yawning are most likely a derived feature, and that the ultimate function is likely physiological due to its phylogenic history (Gallup, 2011).
Another hypothesis that has received recent support posits that yawning is a brain cooling mechanism (Gallup and Gallup, 2007, 2008). The brain cooling hypothesis stipulates that yawning is triggered by an increase in brain temperature, and that the physiological reactions following a yawn promote a return to brain thermal homeostasis. Many thermoregulatory mechanisms have been observed in animals, and possible routes of human brain cooling have been suggested (Zenker and Kubik, 1996). Recent research directly measured cortical temperature in rats and found a distinctive association between brain temperature and yawning (Shoup-Knox et al., 2010). By continuously monitoring cortical temperatures during the 3-min prior to and following a yawn, these researchers found a significant increase in temperature leading up to the onset of a yawn, followed by a significant decrease in temperature and return to baseline in the 3-min following the yawn.
While the ultimate function of yawning remains debated, the current study measured and evaluated the physiology associated with spontaneous yawning. Presented here are two studies which evaluated a variety of physiological measurements before, during, and after a yawn. Previous attempts to measure physiology include examinations of skin conductance (Baenninger and Greco, 1991; Greco and Baenninger, 1991), heart rate (Heusner, 1946; Greco and Baenninger, 1991), and vasoconstriction (Heusner, 1946). Greco and Baenninger (1991) found increased variability in heart rate and inconclusive skin conductance changes associated with yawning. Heusner (1946), however, found an increase in beats per minute and an accompanying vasoconstriction, but her results were gathered from a small number of subjects and were not tested statistically. Our goal is to identify replicable patterns of physiological change associated with yawning to better inform theories of an ultimate function. Our first study examined archival physiological data, and focused on the impact of yawning on heart rate, eye closure, lung volume, and respiration rate. Additionally, we examined the effects of yawning on sympathetic and parasympathetic activity by measuring skin conductance and respiratory sinus arrhythmia (RSA). The second study more closely controlled measurements of heart rate, skin conductance, lung volume, respiration rate, and facial temperature, and provided a reliable control variable, in the form of deep inhalations.
Study 1
Materials and Methods
Originally intended to examine the long-term psychophysiological effects of childhood maltreatment, the data were collected during presentations of adult–child conflictual and non-conflictual interactions (Olezeski, 2011). Physiological measurement equipment was connected to a bioamplifier (James Long Company, Caroga Lake, NY, USA), which was used to take continuous psychophysiological measurements from each subject as they viewed the interaction stimuli. The data collection protocol was approved by the Institutional Review Board, and all participants consented to the experiments after being made aware of the equipment to be used.
Tidal volume, RSA, and respiration period were measured using a respiration bellow (strain gage) fitted around the torso. The strain gage was connected to the bioamplifier for amplification, transduction, and digitization. Respiratory period represents the amount of time elapsed for each inhalation and exhalation cycle.
Respiratory sinus arrhythmia is the difference between minimum inter-beat intervals during inspiration and the maximum inter-beat intervals during expiration, as measured by the electrocardiography (ECG) electrodes and the respiration bellow. RSA was calculated by extracting R-wave times from the ECG output and were manually edited using ECGRWAVE software (James Long Company, Caroga Lake, NY, USA). Previously, RSA has been shown to be a reliable measure of parasympathetic nervous system activity (Katona and Jih, 1975).
Electromyography measurements were taken from the orbicularis oculi muscle using two silver–silver chloride electrodes fitted with electro gel; one was placed just below the inner corner of the eye and the other below the outer corner. A third ground electrode was placed behind the ear lobe on the same side of the head. The area of electrode placement was cleaned with ethanol and abraded to reduce impedance less than 10 Ω. Eye EMG measures muscle tension associated with strong eye closure and the startle response.
Ear pulse amplitude (Eamp) and ear pulse transit time (Eptt) were measured by using a pulse transducer attached to the lobe of the ear. Eamp measures the magnitude of a pulse of blood, converting mechanical force transduced into an electrical signal. Eptt is the time interval between electrical activity in the left ventricle to the peripheral appearance of the pulse, in the form of mechanical pressure, in the ear lobe. Amplification of ear pulse was adjusted individually for each participant.
Heart rate data were collected using two electrodes with disposable adhesive contacts (Skintact, Inverness, FL, USA). Subjects self-applied each electrode to the ribcage approximately 6″ below each axilla, and a third ground electrode placed behind the ear. ECG was sampled and digitized at 1 kHz.
Skin conductance was measured by adhering silver–silver chloride electrodes to the third and fourth distal phalanges of the subject’s non-dominant hand. To provide a conductive barrier between the electrodes and surface of the skin, adhesive electrode collars filled with isotonic citrate salt electrode gel were used. To measure skin conductance levels (SCLs) the bioamplifier used a 500-mV, 30 Hz sinusoidal excitation waveform, yielding a SCL output of 10 μS/V. Data were digitized at 1 kHz, and the A/D converter had a 16-bit resolution and a ±μ2.5 V input range. Skin conductance reactivity was 1 μS/V, single-pull high-pass, and filtered at 0.01 Hz. This second high-pass gain output is helpful in measuring acute changes in skin conductance. Skin conductance reactivity was measured as the SCL during the first two adult–child conflict clips minus the average SCL during baseline. Skin conductance has proven to be a reliable measure of sympathetic nervous system activity (Critchley et al., 2000).
In an attempt to minimize physiological variance not related to the adult–child interaction stimuli, Olezeski (2011) recorded estimated timestamps each time a subject was observed yawning.
Originally observed yawns were physiologically confirmed by measurements of tidal volume and electromyography (EMG) of the orbicularis oculi muscles. We used tidal volume and eye EMG to operationalize yawns according to Provine’s (1986) definition of yawning requiring deep inhalation and eye closure. Tidal volume measures thoracic circumference, and is a reliable indicator of lung volume, and eye EMG tracks the strength of eye-blink movements. At each time-point that a yawn was indicated tidal volume was assessed for peaks of 200% or greater relative to average tidal volume variation for that subject, signaling particularly deep inhalations of air. When these peaks were concurrent with peaks of 200% or greater in EMG relative to surrounding EMG variance (signaling eye closure) a yawn was confirmed. Using the apex from the peak in tidal volume as the anchor point we extracted the surrounding 1.5 min of data from the continuous data set (75 s prior to the anchor point and 75 s following the anchor point) to examine changes in physiology across all parameters. This window of time allowed for assessment of a consistent baseline period, the changes associated with yawning (and those following the yawn) and a subsequent return to baseline. Of the original 200 subjects that participated in the study, we identified 31 yawns from 27 different subjects.
Results
Ear pulse amplitude, eye electromyography, RSA, and heart rate were log transformed to normalize data distributions.
A one-way repeated measures ANOVA was used to analyze each physiological parameter at five different time points; Baseline (calculated by averaging the data from −70 to −40 s prior to the peak of the yawn), Peak, and 5-, 10-, and 15-s after the peak of the yawn. The means and SDs for each variable across each time-point are listed in Table 1. These five time points were chosen post hoc after examination of each 1.5 min window of data surrounding the average yawn. Across all physiological parameters little variation existed during −70 to −40 s so this range provided an appropriate baseline to compare other time points. No effect lasted for more than 15 s following the peak of the yawn, so 5 s intervals were chosen to consistently examine effects across all parameters.
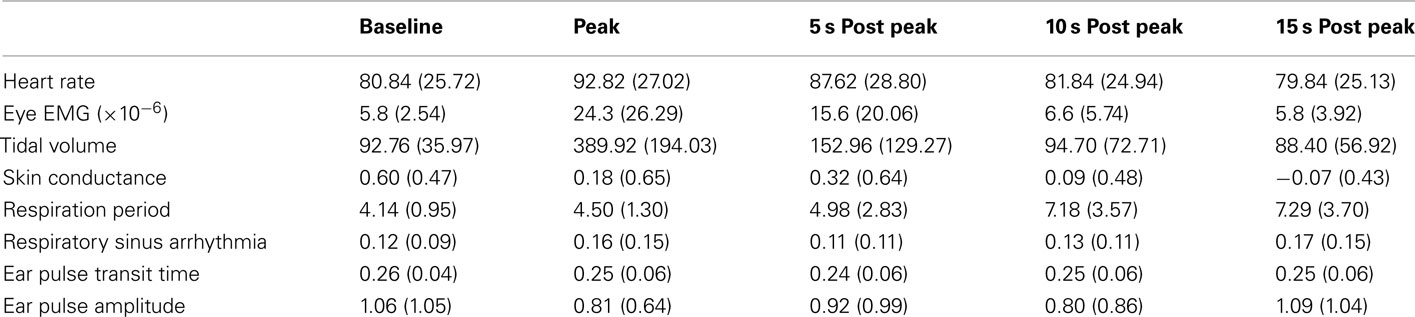
Table 1. Means and SDs for each physiological parameter across the five time points used in the ANOVA analysis for study one.
Where repeated measures ANOVAs violated assumptions of sphericity the values reported are using the Greenhouse-Geisser degrees of freedom adjustment. When main effects were significant, post hoc pair wise comparisons with Bonferroni corrections were performed between each time-point to identify the approximate onset, offset, and duration of each effect.
Heart Rate significantly differed across the five time points F(2.96, 88.93) = 10.51, p < 0.001, η2 = 0.26. Post hoc analysis revealed a significant increase in heart rate at the peak of yawning compared to baseline (p < 0.001), 10 s post yawn (p = 0.002), and 15 s post yawn (p < 0.001). There were no differences between the peak of yawning and 5 s post yawning (p = 0.49), showing that the increase in heart rate lasted for at least 5 s (see Figure 1).
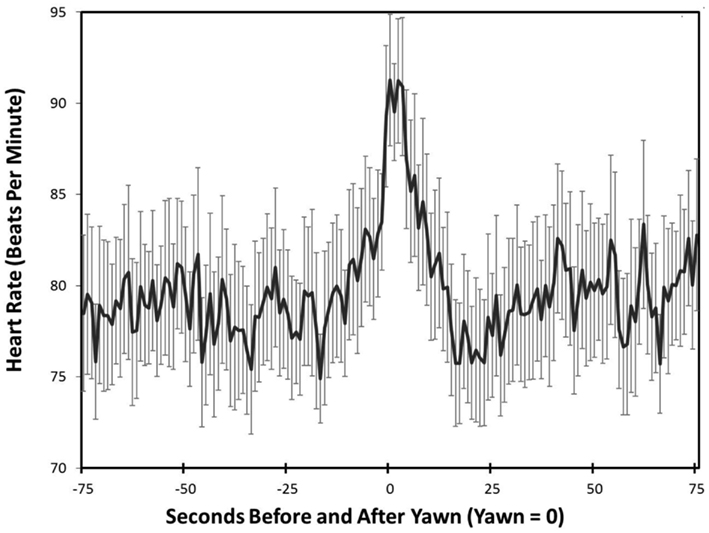
Figure 1. Heart rate – study one. Mean heart rate and SDs across time leading up to and following peak yawning (Peak = 0).
Eye-blink, as measured by EMG, showed significant mean differences in EMG strength across the five time points, F(2.93, 87.75) = 23.40, p < 0.001, η2 = 0.44. Baseline EMG was significantly lower than peak yawning (p < 0.01) and 5-s post yawning (p < 0.01). Peak yawning EMG and 5-s post yawning were both significantly higher than10- and 15-s post yawning (p < 0.01 for all four differences). EMG results at 10- and 15-s post yawning were not significantly different from each other and neither was significantly different from baseline EMG.
Tidal volume was significant mean differences across time, F(2.06, 61.8) = 53.52, p < 0.001, η2 = 0.64. Peak tidal volume was significantly higher than all other time points, (p < 0.01 for all comparisons). There were no significant mean differences between baseline and 5-, 10-, or 15-s post yawning.
Respiration showed overall mean differences across the five time points, F(2.39, 71.62) = 11.04, p < 0.01, η2 = 0.27) with baseline and peak respiration period being significantly lower than both 10- and 15-s post yawning (see Figure 2), (p < 0.01 for all mean differences). Five seconds post yawning was significantly lower from 10 s post yawning (p = 0.01) but 10- and 15-s post yawning were not significantly different from each other.
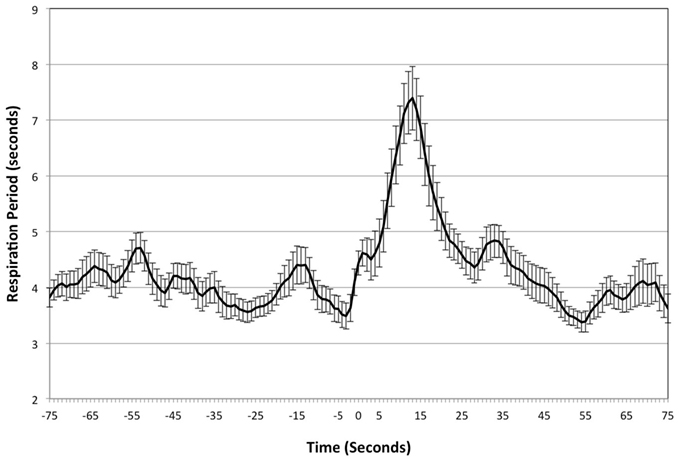
Figure 2. Respiratory period – study one. Mean respiration period and SDs across time leading up to and following peak yawning (Peak = 0).
Respiratory sinus arrhythmia, Eamp, and Eptt did not show overall mean differences across the five time points, F(3.02, 90.67) = 2.11, p = 0.10, η2 = 0.07), F(2.58, 77.34) = 0.54, p = 0.63, η2 = 0.02), F(2.68, 80.45) = 0.82, p = 0.47, η2 = 0.03 (respectively). Skin conductance approached but did not reach significant overall within-subject effects, F(2.11, 63.29) = 2.82, p = 0.06, η2 = 0.09.
Discussion
This study details several physiological changes that occur in association with yawning. As expected at the onset of a yawn, sharp increases in lung volume and eye closure were observed. An increase in heart rate also coincided with the inhalation during yawning, and 10 s following the onset of a yawn, breathing rate decreased. Although temperature was recorded in the original data set, this parameter was not examined in Study 1 because the collection site (the back of the non-dominant hand) resulted in high between subject variability.
Our data show that the occurrence of a yawn is strongly characterized by clear physiological changes. While eye closure and deep inhalation have commonly been used to define characteristics of a yawn (Provine, 1986), our results are the first to quantify each behavior and demonstrate that these two actions tightly coincide with each other, and with the yawn. Additionally, heart rate significantly increased at the point of a yawn, and approached, but fell short of significance 5 s after a yawn (see Figure 1). This heightened heart rate may lead to an increase in circulation, including blood flow to the brain and turnover therein. It is possible that the increase in heart rate is a result of acute sympathetic nervous system arousal, but we did not find a coinciding increase in skin conductance.
The observed decrease in respiratory rate shown in Figure 2 also has interesting implications. Slowed breathing persisted for ∼15 s following peak inhalation; arguing against the hypothesis that yawning acts as a respiratory mechanism to regulate the amount of oxygen and carbon dioxide in the blood. Rather, this finding suggests a decrease in post yawning oxygen intake, due to the decreased breathing rate. Nor is the decreased breathing rate compensated for by deeper breaths. While respiration period was significantly decreased at 10 and 15 s after a yawn, tidal volume returned to baseline approximately 5 s following yawning, demonstrating that breathing rate slowed without compensatory change in lung volume. Thus, any surplus oxygen achieved by the deep inhalation associated with yawning would appear to be nullified by the subsequent decrease in respiratory rate. This is in agreement with the observations of Provine et al. (1987), showing that yawning frequency is not influenced by oxygen and CO2 levels.
Although this study was conservative in the methods used to identifying yawns, it was limited by the dependence on previous researchers to observe and accurately record yawns during original data collection. Also, because participants were not video recorded, we were unable to obtain comparison data to determine whether physiological changes were unique to yawning. Further, some physiological measurements surrounding yawns; specifically skin conductance, may have been masked by variance in physiology associated with the stimuli presented to the participants during original data collection. The following study was conducted in an attempt to replicate these findings while using video recorded, confirmed yawns. As a comparative measure we also examined the physiology of deep inhalations, a respiratory behavior similar, but not identical, to yawning.
Study 2
Materials and Methods
In the second study yawns were documented via video recording and direct observation. Unlike study one, this study did not use previously collected data, and was free from confounds by the emotional stimuli presented during the first study. Forty-eight undergraduates from the University at Albany participated in the study for course credit (M = 29, F = 19). The average age of the sample was 18.94 (SD = 1.51). All participants confirmed they were neither smokers nor suffering from fever or any condition that compromised normal respiration during the time of the experiment. All participant testing occurred between the hours of 10 a.m. and 5:30 p.m. Average room temperature across during data collection was 22.97°C (±1.29°C).
Respiration rate, tidal volume, skin conductance, and ear pulse were measured using the same methods and equipment as Study One. Heart rate was measured using the same two electrodes placed approximately 6″ below the axilla but the third ground electrode was place 1″ above the navel. The temperature probe was placed near the inner corner of the eye on the upper nose and held in place with medical tape. The facial site was chosen due to its proximity to the facial vein and artery, which branch from the external carotid artery. It was unnecessary to gather eye EMG during this study because all yawns could be confirmed by video. All physiology data were collected continuously for ∼25 min while participants alternated between rest periods and working on a Tower of Hanoi task, a mildly challenging virtual game. This task has been found to increase spontaneous yawning during rest periods following play (Shoup-Knox, 2011) and there is no reason to believe these yawns are physiologically different from spontaneous yawns collected in the absence of this activity. All procedures were approved by the Institutional Review Board, and all participants consented to the experiments.
Results
The video recordings of each participant were viewed and time points of yawns were recorded. Eighty-eight yawns were captured from 22 of the 48 participants, however for one participant who yawned six times throughout the experiment we were unable to obtain usable physiology data, leaving 21 participants for physiology analyses. Measurement data from all physiological parameters were gathered in 1-s intervals.
Recorded yawn times were compared to tidal volume data and the time-point associated with the highest peak in tidal volume within 5 s of the recorded yawn time was used as the anchor point for extracting data for all other physiological parameters. Three recorded yawns did not have distinctive tidal volume peaks compared to surrounding tidal volume measurements and therefore were not included in the final analyses of yawn physiology. As in Study 1, data from the remaining 79 yawns were visually examined from 75 s prior to the peak in tidal volume to 75 s after the peak in tidal volume.
In addition to extracting physiological data surrounding yawns we also examined the 75-s before and after deep inhalations that did not accompany a yawn. We identified these time points by reviewing videos and tidal volume data in search of inhalations with tidal volume peaks equivalent to those of yawning (see Figure 3). As with the yawning data, we used the time-point associated with the highest peak in tidal volume to identify and extract data for all other physiological parameters. One inhalation was extracted for each participant who yawned. Two participants did not exhibit inhalation of equal amplitude, leaving us with physiology data from 19 total inhalations.
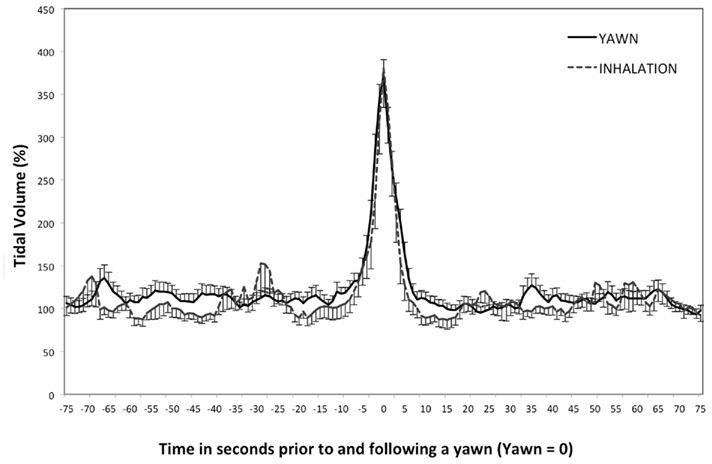
Figure 3. Tidal volume – study two. Mean tidal volume and SDs leading up to and following a yawn, or deep inhalation. (peak = 0).
Each physiological parameter was analyzed by repeated measures ANOVA to assess differences across the same five time points before, during, and after yawns and deep inhalations as was true for Study 1. All p-values reported from pairwise comparisons were adjusted for multiple comparisons using the Bonferroni correction. Where Mauchly’s test was significant (identifying a violation to the assumption of sphericity) the Greenhouse-Geisser degrees of freedom adjusted ANOVA is reported.
T-tests were performed between yawns and deep inhalations at each time-point for each physiological parameter. In addition, Levene’s test was used to compare the amount of variation in the minutes leading up to and following yawning and deep inhalation. This test was performed for each physiological parameter between the average of all yawns and the average of all inhalations from 75 s prior to the peak to 75 s following the peak.
Yawning produced a significant change in tidal volume across time (see Figure 2), F(2.32, 176.48) = 139.69, p < 0.01, η2 = 0.65. Tidal volume at Peak and Post5 were significantly higher than all other time points, including each other, ps < 0.01, with Peak being the highest value. Deep inhalation produced a similar effect of time on tidal volume, F(1.53, 27.55) = 46.18, p < 0.01, η2 = 0.72. Peak tidal volume was significantly higher than all other time points, ps < 0.01, however Post5 was not different from any other time points (p > 0.05). Although the magnitude of the inhalation was similar for yawns and deep inhalations, the increased tidal volume lasted longer for yawns than for deep inhalations. Levene’s test revealed no difference in tidal volume variation between average yawns and inhalations during the minutes leading up to and following a yawn, F(1, 300) = 0.16, p = 0.69. T-tests showed that tidal volume was not significantly different between yawning and deep inhalation at any of the five time points (ps > 0.14).
Figure 4 shows there was an overall effect of time on heart rate during yawns, F(2.61, 185.16) = 4.23, p < 0.01, η2 = 0.06, with higher beats per minute at Post5 than either BL or Post15 (ps < 0.01). Heart rate also changed across the five time points during deep inhalations (see Figure 4), F(1.9, 30.38) = 5.09, p < 0.01, η2 = 0.24, but Peak, was higher than all other time points (ps < 0.05). Although both yawns and inhalations were associated with significant changes in heart rate during and immediately following peak tidal volume, Levene’s test revealed that the amount of variance in the minutes surrounding the average inhalation was greater than that of yawning, F(1, 300) = 36.99, p < 0.01. This suggests that the variance in heart rate surrounding a yawn is more event specific than that surrounding a deep inhalation. T-tests revealed no differences in heart rate between yawning and deep inhalation at any time-point (ps > 0.11).
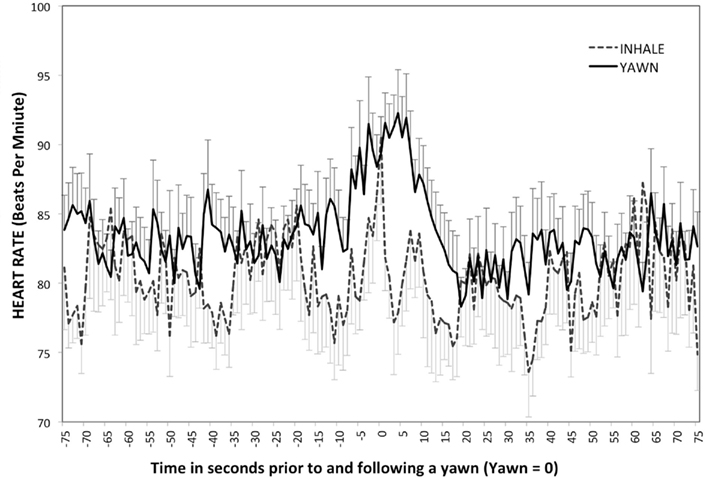
Figure 4. Heart rate – study two. Mean heart rate associated with deep inhalation and yawns over time (peak = 0). Error bars represent SD above yawns and below inhales.
There was an overall effect of time on SCL (Figure 5A) and skin conductance response (SCR) for yawning (see Figure 5B), SCL F(2.38, 183.87) = 6.18, p < 0.01, η2 = 0.07, SCR F(3.26, 250.64) = 2.83, p = 0.04, η2 = 0.04. For both measures of skin conductance Peak and Post5 were higher than BL (ps < 0.02). However, there was no main effect of time on SCL or response for deep inhalation, SCL F(1.18, 21.18) = 1.78, p = 0.2, SCR F(2.36, 42.41) = 1.67, p = 0.2. Levene’s test revealed that the amount of variance in SCL and SCR during the minutes surrounding the average inhalation was greater than that of yawning, SCL: F(1, 300) = 424.83, p < 0.01, SCR: F(1, 300) = 212.14, p < 0.01. T-tests at each of the five time points showed no difference between yawns and non-yawns for either SCL or SCR (ps > 0.31).
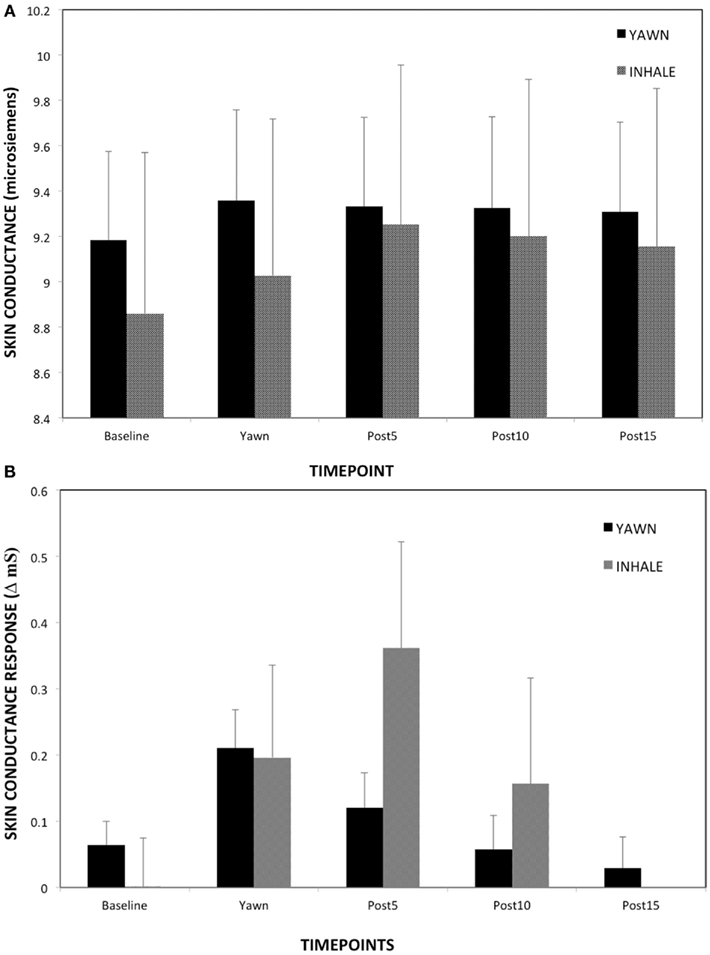
Figure 5. (A) Skin conductance over the five time points – study two. (B) Skin conductance response over the five time points – study two. Mean skin conductance and SD associated with deep inhalation and yawns over time (peak = 0).
During a yawn pulse amplitude showed significant changes over time (see Figure 6), F(2.88, 221.39) = 6.97, p < 0.01, η2 = 0.08. Pairwise comparisons showed that at Peak and Post5 pulse amplitude was significantly lower than baseline and Post15 (ps < 0.01). Post 10 was also lower than Post 15, p = 0.03. There was no effect of time on pulse amplitude for deep inhalations, F(2.39, 43.08) = 0.51, p < 0.64, which had significantly higher variance on average compared to yawning, F(1, 300) = 17.10, p < 0.01. T-tests showed that, at Post 5, pulse amplitude was significantly higher during a yawn than a non-yawn, t(17) = −2.41, p = 0.03.
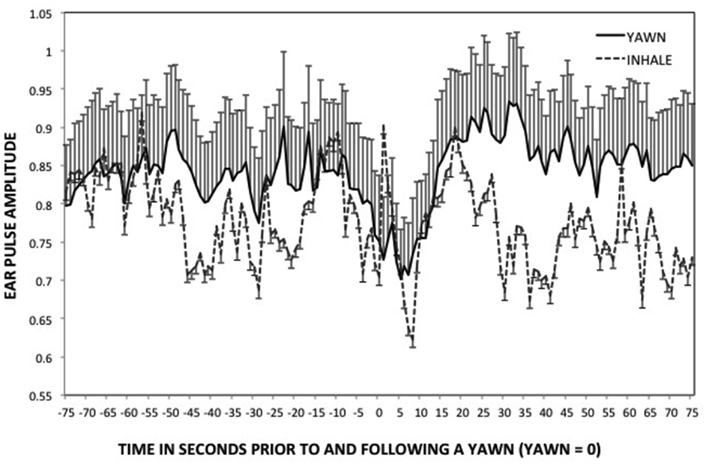
Figure 6. Ear pulse – study two. Mean ear pulse amplitude and SDs leading up to and following a yawn, or deep inhalation. (peak = 0).
Respiration period did not show a significant overall effect of time during yawning, F(1.58, 120.04) = 1.2, p = 0.15, or during deep inhalation, F(1.63, 29.4) = 1.38, p = 0.26. In the minutes surrounding a yawn there was significantly more variance in respiration period than in the minutes surrounding a deep inhalation, F(1, 300) = 11.32, p < 0.01. Respiration period at10- and 15-s was significantly higher following a yawn compared to deep inhalations, t(18) = 2.38, p < 0.03; t(18) = 3.28, p < 0.01 (respectively).
Inner eye temperature changed across time for yawning, F(1.89, 145.25) = 3.41, p = 0.04, η2 = 0.04, and deep inhalation (see Figure 7), F(1.65, 29.68) = 4.75, p < 0.02, η2 = 0.21. For both events temperature increased over time, but only among yawns was temperature significantly higher at Post10 and Post15 than Post5 or Peak, (ps < 0.05). Inner eye temperature was more variable in the minutes surrounding a deep inhalation than a yawn, F(1, 300) = 15.46, p < 0.01. T-tests showed that temperature was not significantly different between yawning and deep inhalation at any of the five time points (ps > 0.38).
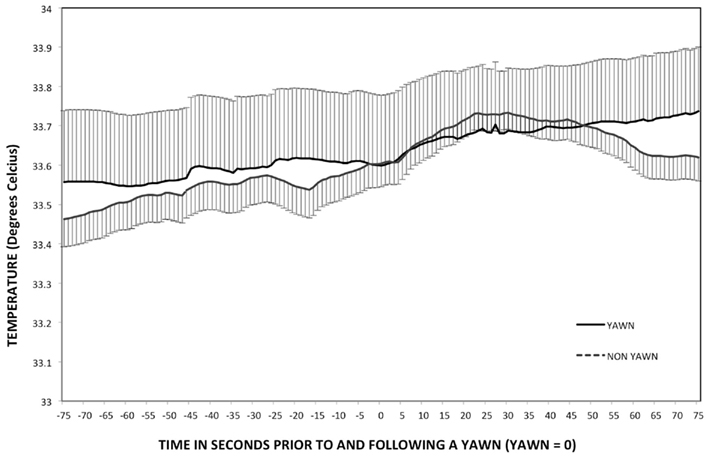
Figure 7. Temperature – study two. Mean inner eye temperature and SDs leading up to and following a yawn. (peak = 0).
Discussion
Our first study revealed interesting physiological changes associated with yawning, however the use of archival data posed two complications. Subjects in the first study were presented with images intended to evoke an emotional psychophysiological response. These subjects were also not recorded on video. Because of this, we were unable to provide a control variable, and were limited by investigating only yawning behaviors. This second study included recording the physiological changes associated with deep inhalations. By comparing these measurements with those of yawns, we are able control for reactions that may be specific to similar respiratory behaviors, but not specific to yawning. The similarities between the two behaviors in mean tidal volume across the five time points as well as variance in the minutes surrounding each event verify that the deep inhalations chosen for analysis were appropriate for comparison (see Figure 3).
Although t-tests showed similarities in heart rate at each of the five time points, Levine’s analysis demonstrated that heart rate fluctuations were more specific to the period of time immediately surrounding yawning then to deep inhalation. The increased amount of variance surrounding deep inhalations events can be seen in Figure 4.
The current study is also the first to report an increase in both SCL and SCR during and immediately following yawning. Study one may have failed to detect changes in these parameters due masking effects of the emotionally salient stimuli viewed by participants during original data collection. An overall increase in skin conductance may have overshadowed any specific changes associated with yawning. The current findings suggest an acute sympathetic nervous system response concurrent with increases in heart rate and tidal volume. Changes in respiration period were not replicated in study two. Although respiration period did increase10 and 15 s following peak yawning and was significantly higher than the same time points following deep inhalation, this within-subject trend across time was not significant in Study 2. The slowed respiration rate following yawning and increased skin conductance may signal a relaxation following acute sympathetic nervous system arousal. This would not be expected if yawning were a transition to a state of increased arousal. All of the above parameters evidence an acute physiological effect with return to baseline occurring within 10 s of peak tidal volume. Inner eye temperature was the only variable to show an effect lasting beyond 5 s following the peak in tidal volume. This increase occurred for both yawning and deep inhalation.
General Discussion
Together, these two studies demonstrate and replicate unique physiological changes associated with yawning. These physiological responses constitute clues as to the ultimate function of yawning. Yawning, as well as deep inhalation increased facial temperature, lung volume, and heart rate. Yawning, but not deep inhalation caused a transient increase in sympathetic nervous system arousal, and a temporary decrease in Eamp. Also a decrease in breathing rate appeared to be associated with deep inhalation behaviors rather than yawning specifically. The current findings suggest an acute sympathetic nervous system response concurrent with increased heart rate and tidal volume. These data also dispute previous findings that claim yawning did not produce autonomic nervous system arousal (Guggisberg et al., 2007).
Our results also differ from previous studies that observed an increased variability in heart rate following a yawn (Greco and Baenninger, 1991; Guggisberg et al., 2007). We observed a significant increase in heart rate which was surrounded by less variability than was observed surrounding deep inhalation. This discrepancy may be due to the large amount of yawns that Greco and Baenninger (1991) analyzed, and the awareness of their subjects to the research topic. They observed an average of 18.58 yawns an hour per person, across 30 subjects (4.59 per person during a 15-min trial). This is a much higher rate of yawning than previous studies have reported, suggesting that because they knew they were in a yawning study their subjects were displaying aberrant amounts of yawning. Furthermore, their data should not be considered indicative of spontaneous yawns, but rather contagious yawns. In contrast, both studies herein examined spontaneous yawning from individuals with no knowledge of being observed or participating in a yawning study.
In Study 2, the magnitude of increase in heart rate immediately following yawning (from 82.71 at baseline to 90.59 at its highest point) replicated the findings from Study 1, but surprisingly the difference from baseline did not occur until Post5 as opposed to our previous effect at Peak. Heusner (1946) also reported similar cardiac acceleration: from 80 to 90 beats per minute, with variations depending on the strength of yawning. The acceleration reported by Heusner accompanied vasoconstriction in the finger. Changes in both heart rate and vasoconstriction began 4–5 s following the initiation of inhalation and were maximal at ∼9–10 s after initiation. These results temporally mimic the present results, confirming an increase in heart rate following yawning. Heart rate findings coupled with previous reports of vasoconstriction clearly reveal circulatory changes associated with yawning. Also, the observed increase in facial–eye temperature suggests an increase in blood flow. Local skin temperature has been shown to rise with increases in blood flow (for review see Charkoudian, 2003). With an increase in heart rate and skin temperature, we feel confident that there is an increase in blood flow associated with yawning.
The rate of blood flow to the brain is one of the key factors in determining the temperature of the brain. Blood flow rate, blood supply temperature, and metabolic thermogenesis as a result of neural activity, are the three primary determinates of temperature in the brain (Kiyatkin et al., 2002). Kiyatkin et al. (2002) also observed that the temperature of the arterial blood supplying the brain is consistently lower than the temperature of the brain during neuronal activation. The increase in heart rate observed in our study would enable this cooler blood to pass through the warmer brain tissue more rapidly, increasing convective cooling.
Because of the observed changes in physiology, we believe that yawning serves a physiological purpose. The changes lend support to multiple physiological hypotheses, specifically giving evidence for changes in arousal, cognitive state, and brain temperature. An increase in heart rate, and sympathetic nervous system activity could be causing increases in arousal as well as facilitating changes in cognitive state. Further, the increased heart rate strongly suggests increased blood flow, and thus increased convective cooling This suggests that proposed changes in arousal following a yawn (Baenninger, 1997; Walusinski and Deputte, 2004; Matikainen and Elo, 2008) may be caused by increased blood flow. The same could be true for the proposed state-change hypothesis (Provine, 1986, 2005), which suggests that yawning is a vigorous, widespread behavior that stirs up our physiology and thus facilitates transitions to different cognitive states. Because of the increase in blood flow, we believe that our physiological data best match the brain cooling hypothesis (Gallup and Gallup, 2007). The regulation of brain temperature could explain observed changes in arousal levels, and would also support cognitive state-changes.
Consistent with the brain cooling hypothesis, arousal, and state-change hypotheses, it is known that human brain temperature and yawning co-vary with circadian sleep–wake cycles. Yawning occurs most frequently in the morning after waking, and in the evening just prior to sleep (Zilli et al., 2007). Brain temperature is highest before sleep, while lowest during sleep. Yawning stops during sleep, but yawning upon waking may be due to an increase in metabolic activity. The state-change associated with waking, and the increased arousal that accompanies waking may require an immediate change in blood flow, and temperature regulation as well.
Neither the brain cooling, arousal, state-change hypothesis, nor our current findings that heart rate increased during yawning are mutually exclusive of the hypothesis that yawning promotes alertness and wakefulness by stimulating the carotid artery (Matikainen and Elo, 2008). The carotid body is the main oxygen sensing organ in the body, its primary function is to mediate cardiorespiratory reflexes in response to systemic hypoxia and hypercapnia (Prabhakar et al., 2005; Kumar and Bin-Jaliah, 2007; Matikainen and Elo, 2008). A combination of increasing blood flow, inhaling cool air, or a transient spike in oxygen may cause the carotid body to release physiology-regulating hormones. This hypothesis needs to be empirically tested, and revised to take into account the mounting physiological evidence associated with yawning observed in this paper as well as others.
Some hypotheses regarding yawning stress that its primary significance is to promote social or empathetic communication (Guggisberg et al., 2010). The suggestion that the ultimate function of yawning is a social one fails to explain the changes in physiology associated with yawning. While social communication may be an additional/derived function among humans and a limited number of other species (Gallup, 2011), it is important to note the prevalence of yawning across species, including those that live in solitude and the majority of species which lack cognitive empathy and communicative understanding, such as fish and rats. Among humans yawning begins prenatally (Walusinski, 2010), yet contagious yawning does not begin until age 4 or 5 (Anderson and Meno, 2003), suggesting that social or communicative effects of yawning are a derived feature in a very small number of species.
These studies document the physiological mechanisms that occur during and following a yawn. While our findings show changes in physiology that are consistent with the concept that yawning acts as a thermoregulatory regulator, future studies need to examine this concept more closely. Further, we understand that a behavior as complex and phylogenetically salient as yawning may be amenable to numerous hypotheses regarding its ultimate function. We stress the importance of proximate mechanisms that have been documented to occur in tandem with yawning when when thinking about the adaptive function of yawning. The physiological changes we have identified are the measurable, salient, and important features of yawning.
In conclusion, we believe that our data are most consistent with the brain cooling hypothesis, and demonstrate an increase in blood flow; one of several physiological mechanisms by which yawning could induce brain cooling. The increase in heart rate and sympathetic nervous system activity associated with yawning also needs to be considered when dealing with cases of excessive yawning, and yawning related medical symptoms. There is evidence linking painful headaches (Jacome, 2001) and a variety of thermoregulatory disorders (Sato-Suzuki et al., 1998; Gallup and Gallup, 2008) with excessive yawning. The yawning experienced during these times may be due to circulatory dysfunction. This coupled with evidence that yawning has medical implications for a variety of disorders (Sato-Suzuki et al., 1998; Gallup and Gallup, 2008), suggests that aberrant yawning is symptomatic of thermoregulatory dysfunction. Thus, excessive yawning could be clinically associated with thermoregulatory/circulatory distress/dysfunction, and could be used as a diagnostic indicator. Further research needs to be done to examine cranial–facial blood circulation, as well as take direct thermal measurements during yawning to define pathways by which yawning influences brain temperature.
Conflict of Interest Statement
The authors declare that the research was conducted in the absence of any commercial or financial relationships that could be construed as a potential conflict of interest.
Acknowledgments
The authors thank Christy Olezeski, Ari Rabkin, and Celia Barbaro for assistance with data collection.
References
Anderson, J. R., and Meno, P. (2003). Psychological influences on yawning in children. Curr. Psychol. Lett. 11. Available at: http://cpl.revues.org/index390.html
Baenninger, R. (1987). Some comparative aspects of yawning in Betta splendens, Homo sapiens, Panthera leo, and Papio sphinx. J. Comp. Psychol. 101, 349–354.
Baenninger, R., and Greco, M. (1991). Some antecedents and consequences of yawning. Psychol Rec. 41, 453–460.
Charkoudian, N. (2003). Skin blood flow in adult human thermoregulation: how it works, when it does not, and why. Mayo Clin Proc. 552, 295–302.
Critchley, H. D., Elliot, R., Mathias, C. J., and Dolan, R. J. (2000). Neural activity relating to generation and representation of galvanic skin conductance responses: a functional magnetic resonance imaging study. J. Neurosci. 20, 3033–3040.
Gallup, A. C. (2011). Why do we yawn? Primitive versus derived features. Neurosci. Biobehav. Rev. 35, 765–769.
Gallup, A. C., and Gallup, G. G. Jr. (2007). Yawning as a brain cooling mechanism: nasal breathing and forehead cooling diminish the incidence of contagious yawning. Evol. Psychol. 5, 92–101.
Gallup, A. C., and Gallup, G. G. Jr. (2008). Yawning and thermoregulation. Physiol. Behav. 95, 10–16.
Greco, M., and Baenninger, R. (1991). Effects of yawning and related activities on skin conductance and heart rate. Physiol. Behav. 50, 1067–1069.
Guggisberg, A. G., Mathis, J., Hermann, U. S., and Hess, C. W. (2007). The functional relationship between yawning and vigilance. Behav. Brain. Res. 179, 159–166.
Guggisberg, A. G., Mathis, J., Schnider, A., and Hess, C. W. (2010). Why do we yawn? Neurosci. Biobehav. Rev. 34, 1267–1276.
Katona, P. G., and Jih, F. (1975). Respiratory sinus arrhythmia: noninvasive measure of parasympathetic measure of cardiac control. J. Appl. Physiol. 35, 801–805.
Kiyatkin, E. A., Brown, P. L., and Wise, R. A. (2002). Brain temperature fluctuation: a reflection of functional neural activation. Eur. J. Neurosci. 16, 164–168.
Kumar, P., and Bin-Jaliah, I. (2007). Adequate stimuli of the carotid body: more than just an oxygen sensor? Respir. Physiol. Neurobiol. 157, 12–21.
Matikainen, J., and Elo, H. (2008). Does yawning increase arousal through mechanical stimulation of the carotid body? Med. Hypothesis 70, 488–492.
Olezeski, C. L. (2011). Biological and Behavioral Correlates Among Young Adults Exposed to Harsh Parenting Practices. Doctoral dissertation. [Retrieved from PsychInfo].
Prabhakar, N. R., Peng, Y. J., Jacono, F. J., Kumar, G. K., and Dick, T. E. (2005). Cardiovascular alterations by chronic intermittent hypoxia: importance of carotid body chemoreflexes. Clin. Exp. Pharmacol. Physiol. 32, 447–449.
Provine, R. R. (1986). Yawning as a stereotyped action pattern and releasing stimulus. Ethology 72, 109–122.
Provine, R. R., Tate, B. C., and Geldmacher, L. L. (1987). Yawning: no effect of 3-5% CO2, 100% CO2, and exercise. Behav. Neural Bio. 48, 382–393.
Sato-Suzuki, I., Kita, I., Oguri, M., and Arita, H. (1998). Steretyped yawning responses induced by electrical and chemical stimulation of paraventricular nucleus of the rat. J. Neurophysiol. 80, 2765–2775.
Shoup-Knox, M. L. (2011). Physiology of Yawning: Proximate Mechanisms Supporting an Ultimate Function. Doctoral dissertation. [Retrieved from PsychInfo].
Shoup-Knox, M. L., Gallup, A. C., Gallup, G. G. Jr., and McNay, E. C. (2010). Yawning and stretching predict brain temperature changes in rats: support for the thermoregulatory hypothesis. Evol. Neurosci. 2, 108.
Walusinski, O. (2006). Yawning: unsuspected avenue for a better understanding of arousal and interoception. Med. Hypotheses 67, 6–14.
Walusinski, O., and Deputte, B. L. (2004). Le baillement: phylogenese, ethologie, nosogenie. Rev. Neurol. (Paris) 160, 1011–1021.
Zenker, W., and Kubik, S. (1996). Brain cooling in humans-anatomical considerations. Anat. Embryol. 193, 1–13.
Keywords: yawning, thermoregulation, temperature, brain cooling, heart rate, respiration, physiology
Citation: Corey TP, Shoup-Knox ML, Gordis EB and Gallup G. G. Jr. (2012) Changes in physiology before, during, and after yawning. Front. Evol. Neurosci. 3:7. doi: 10.3389/fnevo.2011.00007
Received: 14 July 2011;
Paper pending published: 10 August 2011;
Accepted: 27 November 2011;
Published online: 03 January 2012.
Edited by:
Steven M. Platek, Georgia Gwinnett College, USAReviewed by:
James J. Bonaiuto, University of Southern California, USAAndrew C. Gallup, Princeton University, USA
Copyright: © 2012 Corey, Shoup-Knox, Gordis and Gallup Jr. This is an open-access article distributed under the terms of the Creative Commons Attribution Non Commercial License, which permits non-commercial use, distribution, and reproduction in other forums, provided the original authors and source are credited.
*Correspondence: Melanie L. Shoup-Knox, University of Pittsburgh, 4215 Sennott Square, 210 S. Bouquet Street, Pittsburg, PA 15260, USA. e-mail: melshoup@gmail.com
†Timothy P. Corey and Melanie L. Shoup-Knox share first authorship.