Exploring the role of low level visual processing in letter–speech sound integration: a visual MMN study
1
Department of Cognitive Neuroscience, Faculty of Psychology and Neuroscience & Maastricht Brain Imaging Institute, Maastricht University, Maastricht, Netherlands
2
Division of Child and Adolescent Psychiatry, Columbia University College of Physicians and Surgeons, New York, NY, USA
In contrast with for example audiovisual speech, the relation between visual and auditory properties of letters and speech sounds is artificial and learned only by explicit instruction. The arbitrariness of the audiovisual link together with the widespread usage of letter–speech sound pairs in alphabetic languages makes those audiovisual objects a unique subject for crossmodal research. Brain imaging evidence has indicated that heteromodal areas in superior temporal, as well as modality-specific auditory cortex are involved in letter–speech sound processing. The role of low level visual areas, however, remains unclear. In this study the visual counterpart of the auditory mismatch negativity (MMN) is used to investigate the influences of speech sounds on letter processing. Letter and non-letter deviants were infrequently presented in a train of standard letters, either in isolation or simultaneously with speech sounds. Although previous findings showed that letters systematically modulate speech sound processing (reflected by auditory MMN amplitude modulation), the reverse does not seem to hold: our results did not show evidence for an automatic influence of speech sounds on letter processing (no visual MMN amplitude modulation). This apparent asymmetric recruitment of low level sensory cortices during letter–speech sound processing, contrasts with the symmetric involvement of these cortices in audiovisual speech processing, and is possibly due to the arbitrary nature of the link between letters and speech sounds.
The ability to rapidly integrate crossmodal sensations originating from a single object allows efficient and profound perception of our environment. Thanks to the invention and application of neuroimaging methods our understanding of the neural networks involved in multisensory integration has gained enormously during the last two decades. A classic example of multisensory integration which is frequently investigated is that of audiovisual speech processing. It has been shown that audiovisual speech processing involves multisensory integration sites as well as low level auditory and visual sensory systems, presumably via feedback projections (Calvert et al., 1999
, 2000
; Macaluso et al., 2004
). Another example of audiovisual integration with which we are daily confronted is that of a basic literacy skill such as letter–speech sound integration. While recent studies revealed that multisensory as well as low level auditory processing are involved during letter–speech sound integration (Hashimoto and Sakai, 2004
; Van Atteveldt et al., 2004
, 2007a
; Blau et al., 2008
), the role of low level visual processing is less consistently reported and is the objective of the present study.
In alphabetic scripts, learning the associations between letters and speech sounds is a crucial step during reading acquisition (Ehri, 2005
). Failure of this step during learning to read is proposed as a cause for reading problems in developmental dyslexia (McCandliss and Noble, 2003
; Vellutino et al., 2004
; Blau et al., 2009
). Insights in the neurocognitive nature of letter–speech sound processing might therefore contribute to theories of normal and abnormal literacy development. A behavioral study investigating the nature of letter–speech sound processing revealed differential influences of congruent and incongruent letter primes on reaction times in a speech sound identification task, suggesting automatic letter–speech sound integration (Dijkstra et al., 1989
). Converging evidence from several recent neuro-imaging studies points to heteromodal areas in the Superior Temporal Sulcus (STS) as a crucial locus of this integration process (Raij et al., 2000
; Hashimoto and Sakai, 2004
; Van Atteveldt et al., 2004
, 2007b
; Blau et al., 2008
). In these studies, letter–speech sound pairs activated areas in STS stronger in comparison with single letters or speech sounds. Van Atteveldt et al. (2004
, 2007a)
furthermore showed that not only heteromodal areas in STS, but also low level auditory areas (Heschl’s sulcus and Planum Temporale) are involved in letter–speech sound integration. These low level auditory areas were activated more by congruent letter–speech sound pairs in comparison with incongruent pairs (congruency effect). Based on these results the following neural mechanism for letter–speech sound processing was proposed: sensory specific input in low level sensory areas and letter–speech sound integration in STS, followed by feedback to “sensory specific” auditory areas modulating speech sound processing depending on the congruency of the letter–speech sound combinations (Van Atteveldt et al., 2004
, 2007a
; Blau et al., 2008
).
In contrast with what is observed during audiovisual speech processing, no integration effect was found in low level visual areas during passive letter–speech sound processing (Van Atteveldt et al., 2004
, 2007a
). This indicates an asymmetry in the involvement of low level sensory areas when integrating letters and speech sounds, which is in agreement with the asymmetry in the representations of letter–speech sound associations found on a behavioral level (Hardy et al., 1972
; Dijkstra et al., 1993
). However, the involvement of low level visual areas has been reported in two other studies (Herdman et al., 2006
; Blau et al., 2008
). In a magnetoencephalography (MEG) study, subjects were required to make a congruency decision on the presented letters and speech sounds (Herdman et al., 2006
). Cortical oscillations revealed congruency effects in low level visual areas between 250 and 500 ms. Such a congruency effect was not found for the same task when functional magnetic resonance imaging (fMRI) was used (Van Atteveldt et al., 2007b
), suggesting that the use of a high temporal resolution method may be critical for revealing relevant effects. This suggestion seems contradicted by an fMRI-study by Blau et al. (2008)
, in which congruency effects were observed in extra-striate areas while subjects were identifying speech sounds co-occurring with congruent or incongruent letters. However, in this study, degraded letters were presented, possibly requiring stronger involvement of low level visual areas already during unimodal processing in comparison with non-degraded letters.
The role of low level visual areas during passive letter–speech sound integration has not been investigated before with a high temporal resolution method. However, in two recent ERP-studies, the auditory mismatch negativity (aMMN), known to reflect automatic auditory deviancy detection, was successfully employed to investigate the automaticity and timing properties of the influence of letters on low level speech sound processing (Froyen et al., 2008
, 2009
). The aMMN is evoked between 100 and 250 ms after stimulus onset when in a sequence of auditory stimuli a rarely presented sound (the deviant) deviates in one or more aspects from a frequently presented sound (the standard) (Näätänen, 1995
; Schröger, 1998
). The aMMN is an automatic and purely auditory deviance detection mechanism with a major source located in the auditory cortex (Giard et al., 1990
; Ahlo, 1995
). The aMMN evoked by the deviant speech sound /o/ violating the standard speech sound /a/ (auditory only experiment) was compared with the aMMN evoked by the deviant speech sound /o/ violating both the standard speech sound /a/ and the simultaneously presented standard letter “a” (audiovisual experiment) (Froyen et al., 2008
). The aMMN amplitude evoked in the audiovisual experiment was enhanced in comparison with the aMMN amplitude in the auditory only experiment, presumably caused by the double deviation of the deviant speech sound from the standard speech sound and the standard letter. Considering the properties of the aMMN, this enhancement strongly points to early and automatic influences of letters on speech sound processing. Recently, the same MMN paradigm was successfully employed to investigate the influence of reading development on the time course and automaticity of letter–speech sound processing (Froyen et al., 2009
), which validated this paradigm as a tool to investigate letter–speech sound processing passively and non-invasively.
Recently a number of studies have found converging evidence for the existence of a visual counterpart of the aMMN (Tales et al., 1999
; Berti and Schröger, 2003
; Heslenfeld, 2003
; Czigler et al., 2004
; Maekawa et al., 2005
; Czigler, 2007
). The visual MMN (vMMN) is described as a negativity measured at the occipital electrodes between 150 and 350 ms after the onset of an infrequent (deviant) visual stimulus in a sequence of frequently presented (standard) visual stimuli (Pazo-Alvarez et al., 2003
; Czigler, 2007
). The vMMN is suggested to have similar properties as the aMMN. It can be evoked pre-attentively and it reflects the use of a memory representation of regularities of visual stimulation (Czigler, 2007
). The vMMN has been reported to be elicited by deviants differing in spatial frequency (Heslenfeld, 2003
; Kenemans et al., 2003
), line orientation (Astikainen et al., 2007
) and shape (Tales et al., 1999
, 2008
; Maekawa et al., 2005
; Tales and Butler, 2006
). The neural sources are suggested to reside in the extrastriate areas of the brain (Czigler et al., 2004
). The properties of the vMMN make it an appropriate tool to look for automatic influences of speech sounds on letter processing and investigate the time course of these influences. The advantage of the MMN-paradigm, in comparison with for example the frequently used additive model approach (AV = A + V) as in Raij et al. (2000)
, is that the MMN is also evoked under passive conditions. Consequently no task is required, which facilitates investigating clinical groups and young children. Although the additive design has shown its merits, its use is not without complications (Besle et al. 2004
; Calvert and Thesen, 2004
; Gondan and Röder, 2006
). One example is that common activity, e.g. anticipatory slow waves, might be present in the crossmodal condition and in both unimodal conditions. Following the additive model this common activity (C) is subtracted twice while it is present in the crossmodal condition only once: AV + C = (A + C) − (V + C), consequently causing supposedly super-additive effects in the audiovisual condition. Additionally, the combination of using EEG and the additive model, makes it harder to infer the source of a crossmodal effect due to the inverse problem one is confronted with when aiming to do source localization. The neural generators of the MMN are well investigated and described to reside in low level sensory cortex, e.g. the extrastriate visual areas are depicted as the main locus of the visual MMN (Czigler et al., 2004
).
In the present study the vMMN evoked by a deviant letter in a visual-only experiment (Figure 1
A) is compared with the vMMN evoked by the same deviant letter accompanied by a standard speech sound (audiovisual, Figure 1
B). The visual stimulation in both experiments is exactly the same, standard letter “a” and deviant letter “o”. As a control for the letter-specificity of potential auditory effects on the vMMN, a second deviant, the non-letter “*”, was included. The only aspect in which both experiments differ is that in the audiovisual experiment a speech sound /a/ is presented simultaneously with each letter or non-letter. This speech sound creates an incongruence with the deviant letter “o” and the non-letter “*”. First, we predict a typical vMMN in the visual-only experiment reflecting the assumed violation of the memory trace built up by the standard letter. Second, if there is, due to early integration, an automatic influence of the speech sound on letter processing, this is expected to be reflected in an effect of experiment (visual versus audiovisual) on the vMMN amplitude in analogy to the aMMN studies (Froyen et al., 2008
, 2009)
. Based on these previous results, we expect the vMMN-amplitude in the audiovisual experiment to be enhanced, due to the additional, crossmodal incongruence of the deviant letter versus the standard speech sound. Third, if this influence is letter-specific, we expect a differential effect of the speech sound on the vMMN evoked by the letter versus the non-letter, reflected in an interaction between experiment (visual versus audiovisual) and condition (letter versus non-letter).
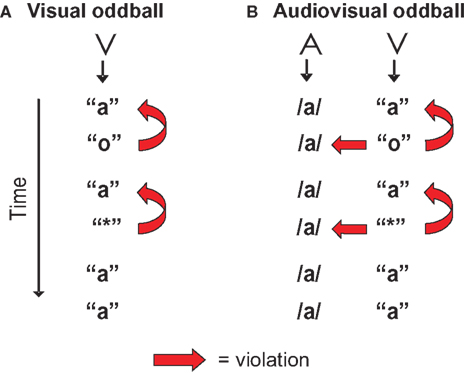
Figure 1. Visualization of the design in the visual (A) and the audiovisual experiment (B). ‘A’ stands for auditory stimulus, ‘V’ stands for visual stimulus. The ‘o’ was the letter deviant violating the previously presented standard letter ‘a’, and in the audiovisual experiment also the simultaneously presented speech sound /a/. The ‘*’ was the non-letter deviant included to control for letter-specificity.
The present design furthermore allows to investigate whether letter–speech sound processing has comparably strong integration properties as audiovisual speech processing. Previous audiovisual MMN studies revealed that a visual deviant which is incongruent with an auditory sound can evoke an auditory MMN, even if the physical properties of the auditory stimulus remain unaltered (Sams et al., 1991
; de Gelder et al., 1999
; Colin et al., 2002
; Möttönen et al., 2002
; Stekelenburg et al., 2004
). Some of these audiovisual speech studies used the McGurk-illusion (McGurk and MacDonald, 1976
) to evoke an auditory MMN (Sams et al., 1991
; Colin et al., 2002
; Möttönen et al., 2002
): Subjects perceived, for example, /da/ while the lip movement of /ga/ is simultaneously presented with the sound of /ba/. This altering of the auditory percept by merely changing the visual part of the audiovisual stimulus is reflected in the evocation of a genuine auditory MMN. In the audiovisual experiment of the present study the standard speech sound is always the /a/, but is either presented with the standard letter “a”, the deviant letter “o” or the deviant non-letter “*”. If the incongruent deviant letter “o” would evoke an auditory MMN, despite the standard speech sound /a/ being unaltered, this would compare with the MMN evoked by the McGurk effect and thus indicate that letter–speech sound processing has comparably strong integration properties as audiovisual speech processing has.
Participants
We performed a between-subject study with 32 subjects. Subjects were randomly assigned to either the visual or the audiovisual experiment. Sixteen subjects participated in the visual-only experiment, (12 female, range 18–28, mean age 22 years) and 16 subjects participated in the audiovisual experiment, (14 female, range 20–33, mean age 24 years). In addition, four subjects that had participated in the visual experiment also participated in the audiovisual experiment and four subjects that had participated in the audiovisual experiment also participated in the visual experiment. The additional data is not included in the statistical analysis, but is used in Figure 4
to illustrate a within-subject effect in a small group of eight subjects. Subjects were all students who were paid for their participation or received course credits per experiment. Informed consent was obtained from all the subjects, according to the approval by the Ethical Committee of the Faculty of Psychology and Neuroscience, Maastricht.
Stimuli and Procedure
Stimuli were the natural speech sound /a/ (384 ms), the visually presented single letters “a” and “o”, and a visually presented non-letter ‘*’. The speech sound /a/ was digitally recorded (sampling rate 44.1 kHz, 16 bit quantization) from a female speaker. Recordings were band-pass filtered (180–10,000 Hz) and resampled at 22.05 kHz with Praat software (Boersma and Weenink, 2002
). The sounds were presented binaurally through loudspeakers at about 65 dBA. Letters and non-letters were presented in white on a black background in the centre of a computer screen for 500 ms (visual angle: 1.2 by 0.8 degrees). Between the presentations of the visual stimuli a white fixation cross was presented in the centre of the screen.
In both experiments, subjects saw either the standard letter “a” (80%), the letter deviant “o” (10%) or the non-letter deviant ‘*’ (10%). To ensure that subjects were at all times focusing the screen, we presented 10 non-related salient color pictures per run. Subjects had to press a button when they saw the picture. During the visual experiment there was no auditory stimulation (Figure 1
A). In the audiovisual experiment a speech sound /a/ was presented simultaneously with the visual stimuli (Figure 1
B). In each experiment, there were 4 blocks with 534 trials. Trial length was 1250 ms, the inter-trial interval was 750 ms.
In the audiovisual experiment we also presented a speech sound deviant /o/ (10%), but this condition is irrelevant for the present research aim and is reported elsewhere (Froyen et al., 2008
). During the trials of interest for the present study, the speech sound /a/ was always presented simultaneously with the visual stimulus. The eight subjects that were participating in the both the visual and the audiovisual experiment were not presented with the irrelevant speech sound deviant /o/ in the audiovisual experiment.
Recording and Analysis
EEG data were recorded with NeuroScan 4.2 from 0.01 to 50 Hz with a sampling rate of 250 Hz in a sound-attenuating and electrically shielded room from 30 electrode positions (Extended International 10–20 system) relative to a nose reference. Eye-movements and blinks were measured with bipolar VEOG/HEOG channels. All electrode impedance levels (EEG and EOG) were kept below 5 kΩ. EEG data were epoched from −50 to 800 ms relative to trial onset, baseline corrected (50 ms pre stimulus interval), and 1–30 Hz band pass filtered with NeuroScan 4.2. Epochs containing data exceeding a maximum voltage criterion of 75 �V were rejected. Standards immediately following deviants were not included in the analysis, as were the trials with target pictures. Our stimulus presentation program (Presentation, Neurobehavioral systems) was programmed to randomly select standards to obtain an equal number of standards and deviants for the analysis, in order to keep the absolute number over which we average the same in both stimulus conditions (Picton et al., 2000
; Luck, 2005
). The raw EEG data were corrected for vertical eye-movements (i.e. blink artifacts). In the visual experiment we retained 178 (89%) letter standard, 178 (89%) letter deviant and 176 (88%) non-letter deviant trials and in the audiovisual experiment we retained 178 (89%) standard, 178 (89%) letter deviant and 180 (90%) non-letter deviant trials. Epochs were averaged separately for each condition and each participant. Difference waves were calculated by subtracting the ERPs to the standard condition from ERPs to the deviant condition.
Statistical analysis was performed on 11 electrodes covering the fronto-central (Fz, Cz, FC3, FC4), temporal (T3 and T4), parietal (CP3 and CP4), and occipital (Oz, O1 and O2) regions of the brain to investigate the visual MMN. A data-driven approach was chosen in order to define the time window of interest in an objective manner and to minimize the likelihood of a Type I error (Guthrie and Buchwald, 1991
). A t-test was calculated per condition (letter deviant and non-letter deviant) and per time point of the middle occipital electrode (Oz), were the vMMN was expected to be most prominent (Czigler et al., 2004
). With 20 subjects, an autocorrelation of .9 and an epoch of 150 data points (spanning 600 ms), a time window containing at least 13 consecutive data points where the t-test exceeded the 0.05 alpha criterion was considered to be of interest for further analysis (Guthrie and Buchwald, 1991
).
Within this time window, we derived two dependent variables per condition: (I) the latency measured at the maximum peak amplitude at electrode Oz and (II) the amplitude measured as the mean amplitude for each individual electrode across 50 ms centered around the individual peak latency. Since there is individual variability in the exact latency of the vMMN, we opted to check per individual whether the highest peak in the time windows of interest on electrode Oz was a peak likely to reflect a genuine MMN or rather some artifact that coincidently was higher than the MMN peak. The amplitude of the other electrodes was determined by taking the amplitude at the latency of the chosen peak at Oz. This method is described in Luck (2005
, p. 230–231). Both measures (I and II) were derived separately for each subject and condition. We used the mean area amplitude rather than the peak amplitude as it is considered a more reliable measure. Consequently, in the present study, the term amplitude always refers to the mean area amplitude. First, a repeated measures ANOVA with electrode sites (Fz, Cz, Pz, Oz, FC3, FC4, T3, T4, O1, O2, CP3 and CP4) and condition (deviant letter and deviant non-letter) as within subject variables and experiment (visual only and audiovisual) as between subject variable was performed. If there was an interaction with electrode, the analysis on the initial 11 electrodes was followed by a detailed analysis on the occipital electrodes (Oz, O1 and O2), where the deviancy-effect was expected to be most prominent (Czigler et al., 2004
). Amplitude and latency measures of the grand average waveforms were analyzed to check for an effect of speech sounds on letter processing. All reported p-values from the repeated measures ANOVA were Greenhouse–Geisser corrected. All post-hoc analyses were Bonferroni corrected.
Since an additional aim was to explore whether an auditory MMN would be evoked in the audiovisual letter deviant condition, additional analysis focused on the frontocentral electrodes at which the auditory MMN is typically most pronounced (Schröger, 1998
). In order to check for this we again calculated a t-test per time point of the difference waves in the audiovisual experiment measured at the frontal and the fronto-central electrodes Fz and Cz, were the auditory MMN is assumed to be most prominent (Näätänen, 1995
; Schröger, 1998
). A time window containing at least 13 consecutive data points where the t-test exceeded the 0.05 alpha criterion would be considered to be of interest for further analysis.
General Description of ERP Waveforms and Determination of Windows of Interest
A positive (P1)–negative (N1)–positive (P2) deflection was observed in the grand average waves to standard, letter deviant and non-letter deviant stimuli in both experiments, indicating typical exogenous components (Figure 2
). Difference waveforms (letter deviant minus standard and non-letter deviant minus standard trials) are shown in Figure 3
. Most pronounced in the difference waves at the occipital electrodes (Oz, O1 and O2), a deviant related negativity (DRN) was observed between 150 and 400 ms after stimulus onset, which is in line with previously reported latencies (Pazo-Alvarez et al., 2003
; Czigler, 2007
).
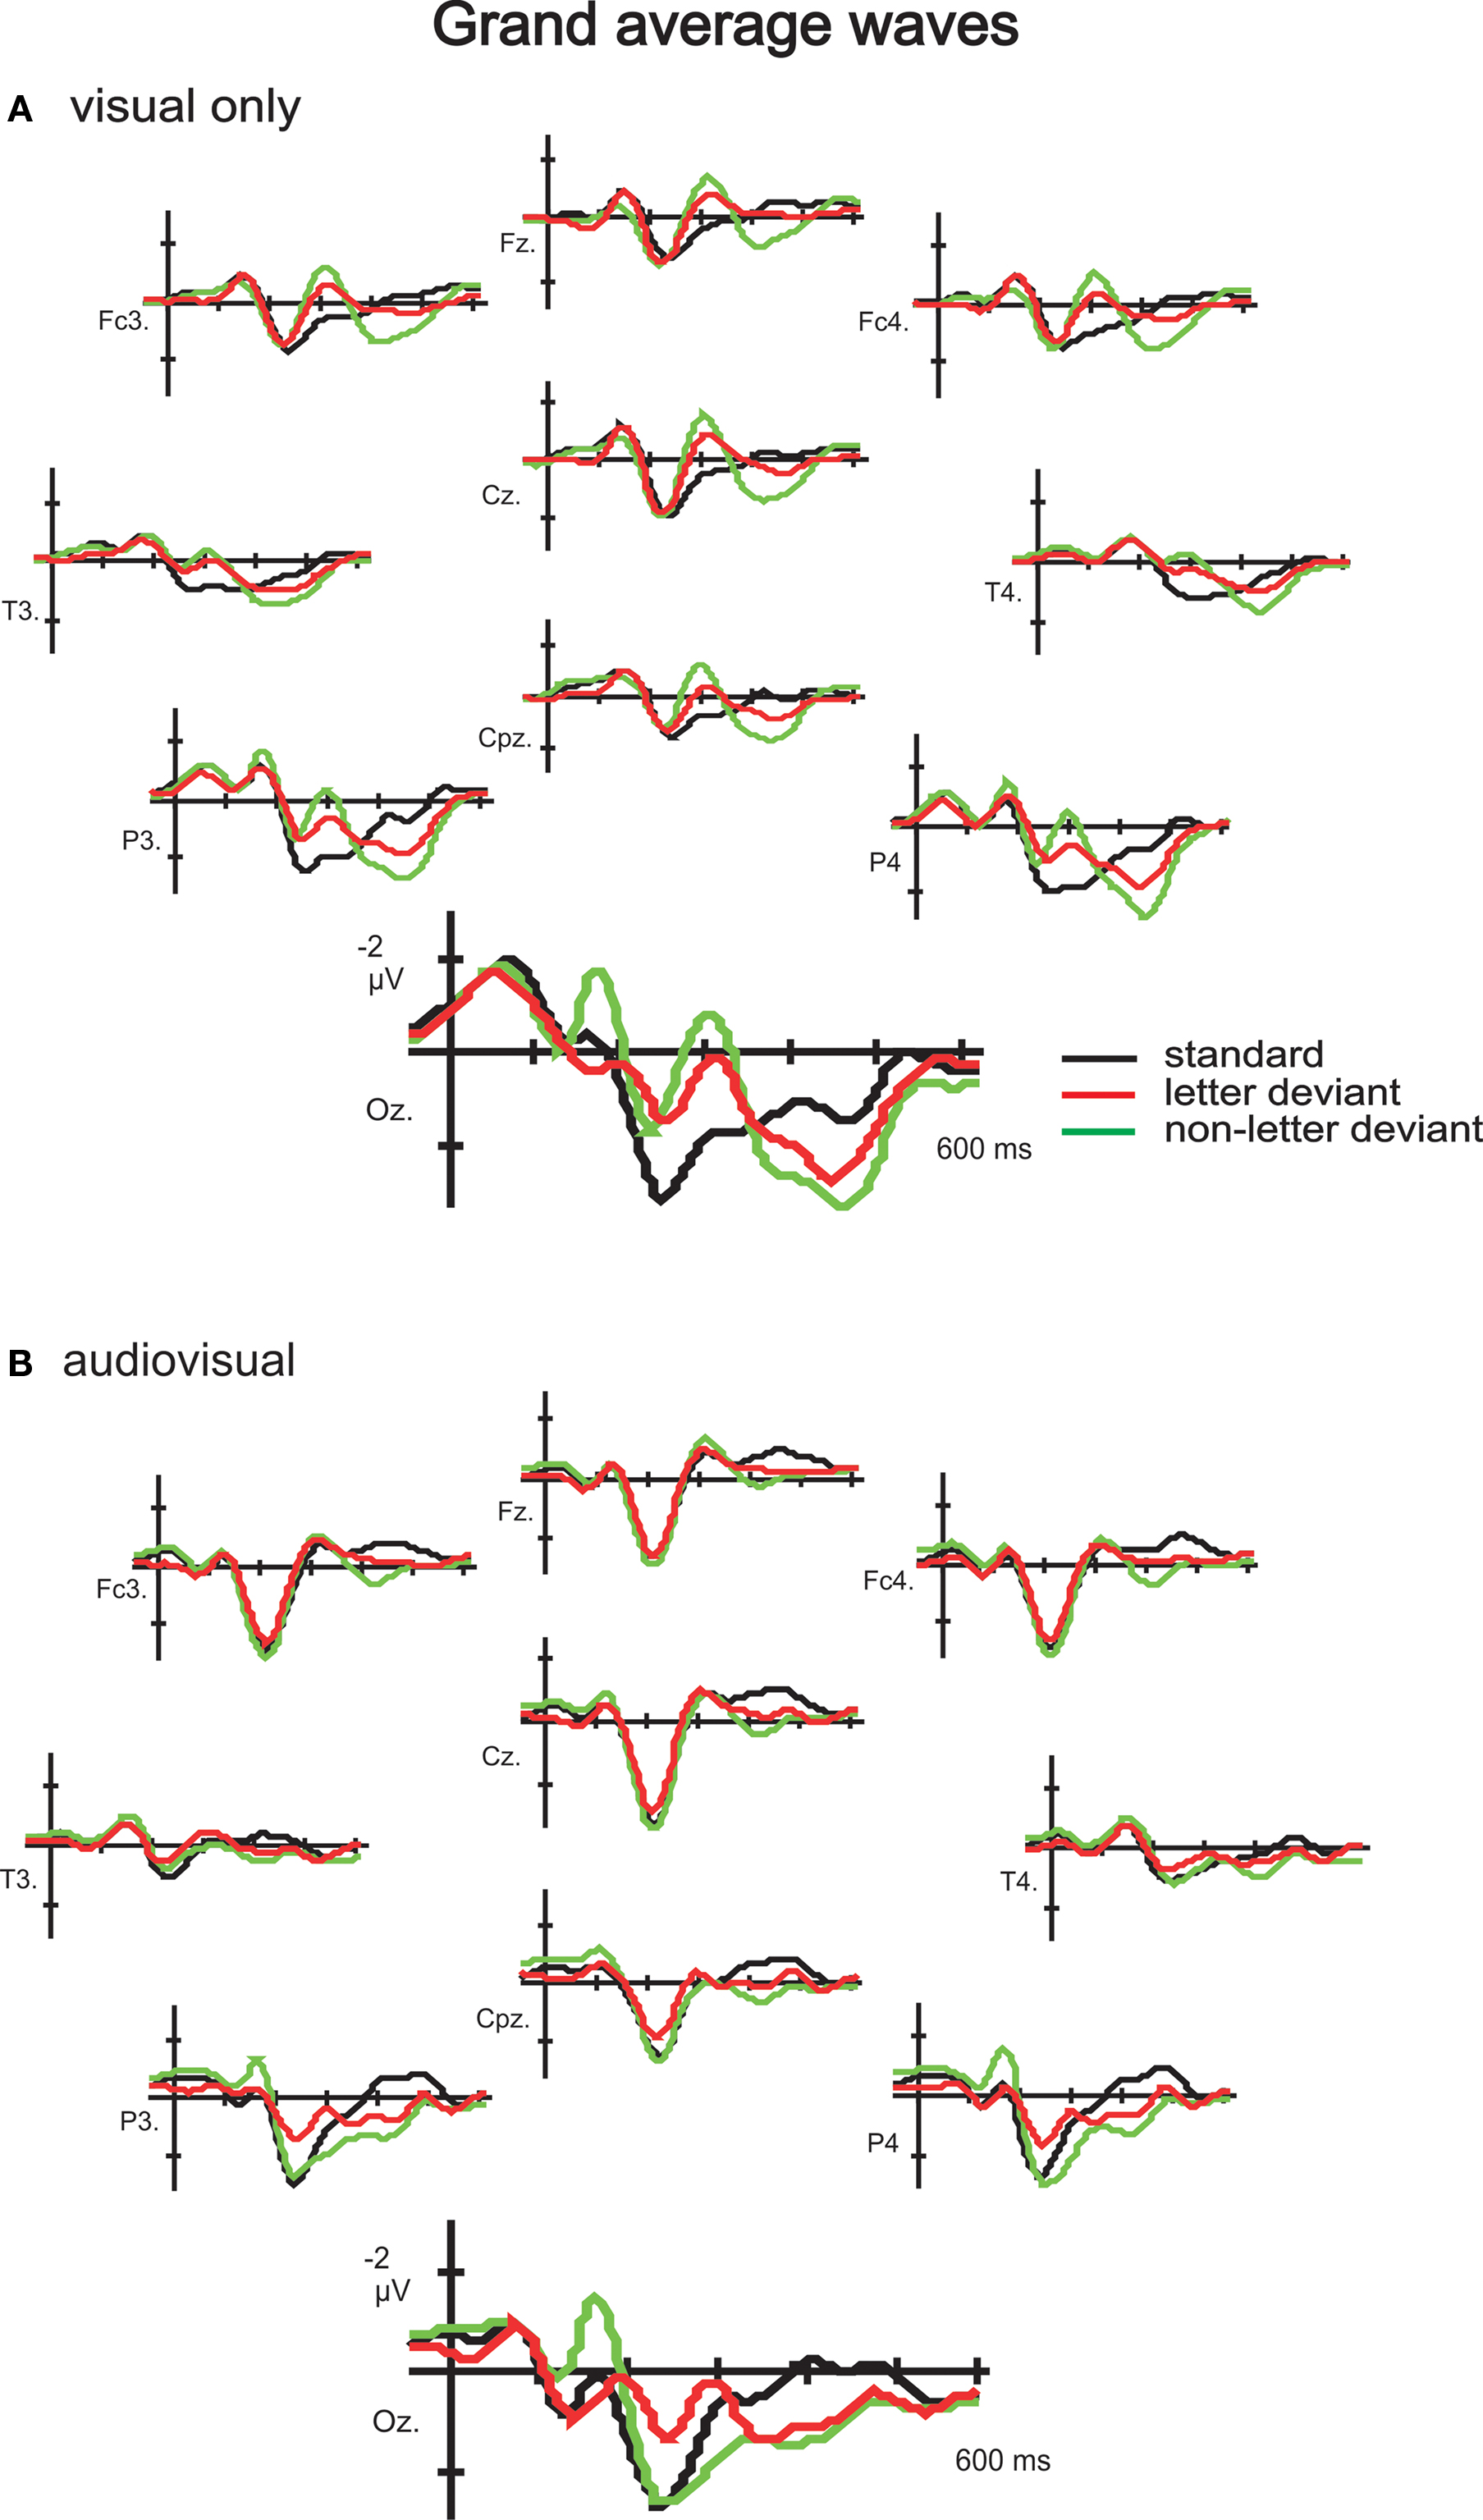
Figure 2. Grand-average waves to standard letters, letter deviants and non-letter deviants observed at 10 electrodes (Fz, Fc3, Fc4, Cz, T3, T4, Cpz, P3, P4 and Oz) in the visual experiment (A) and the audiovisual experiment (B).
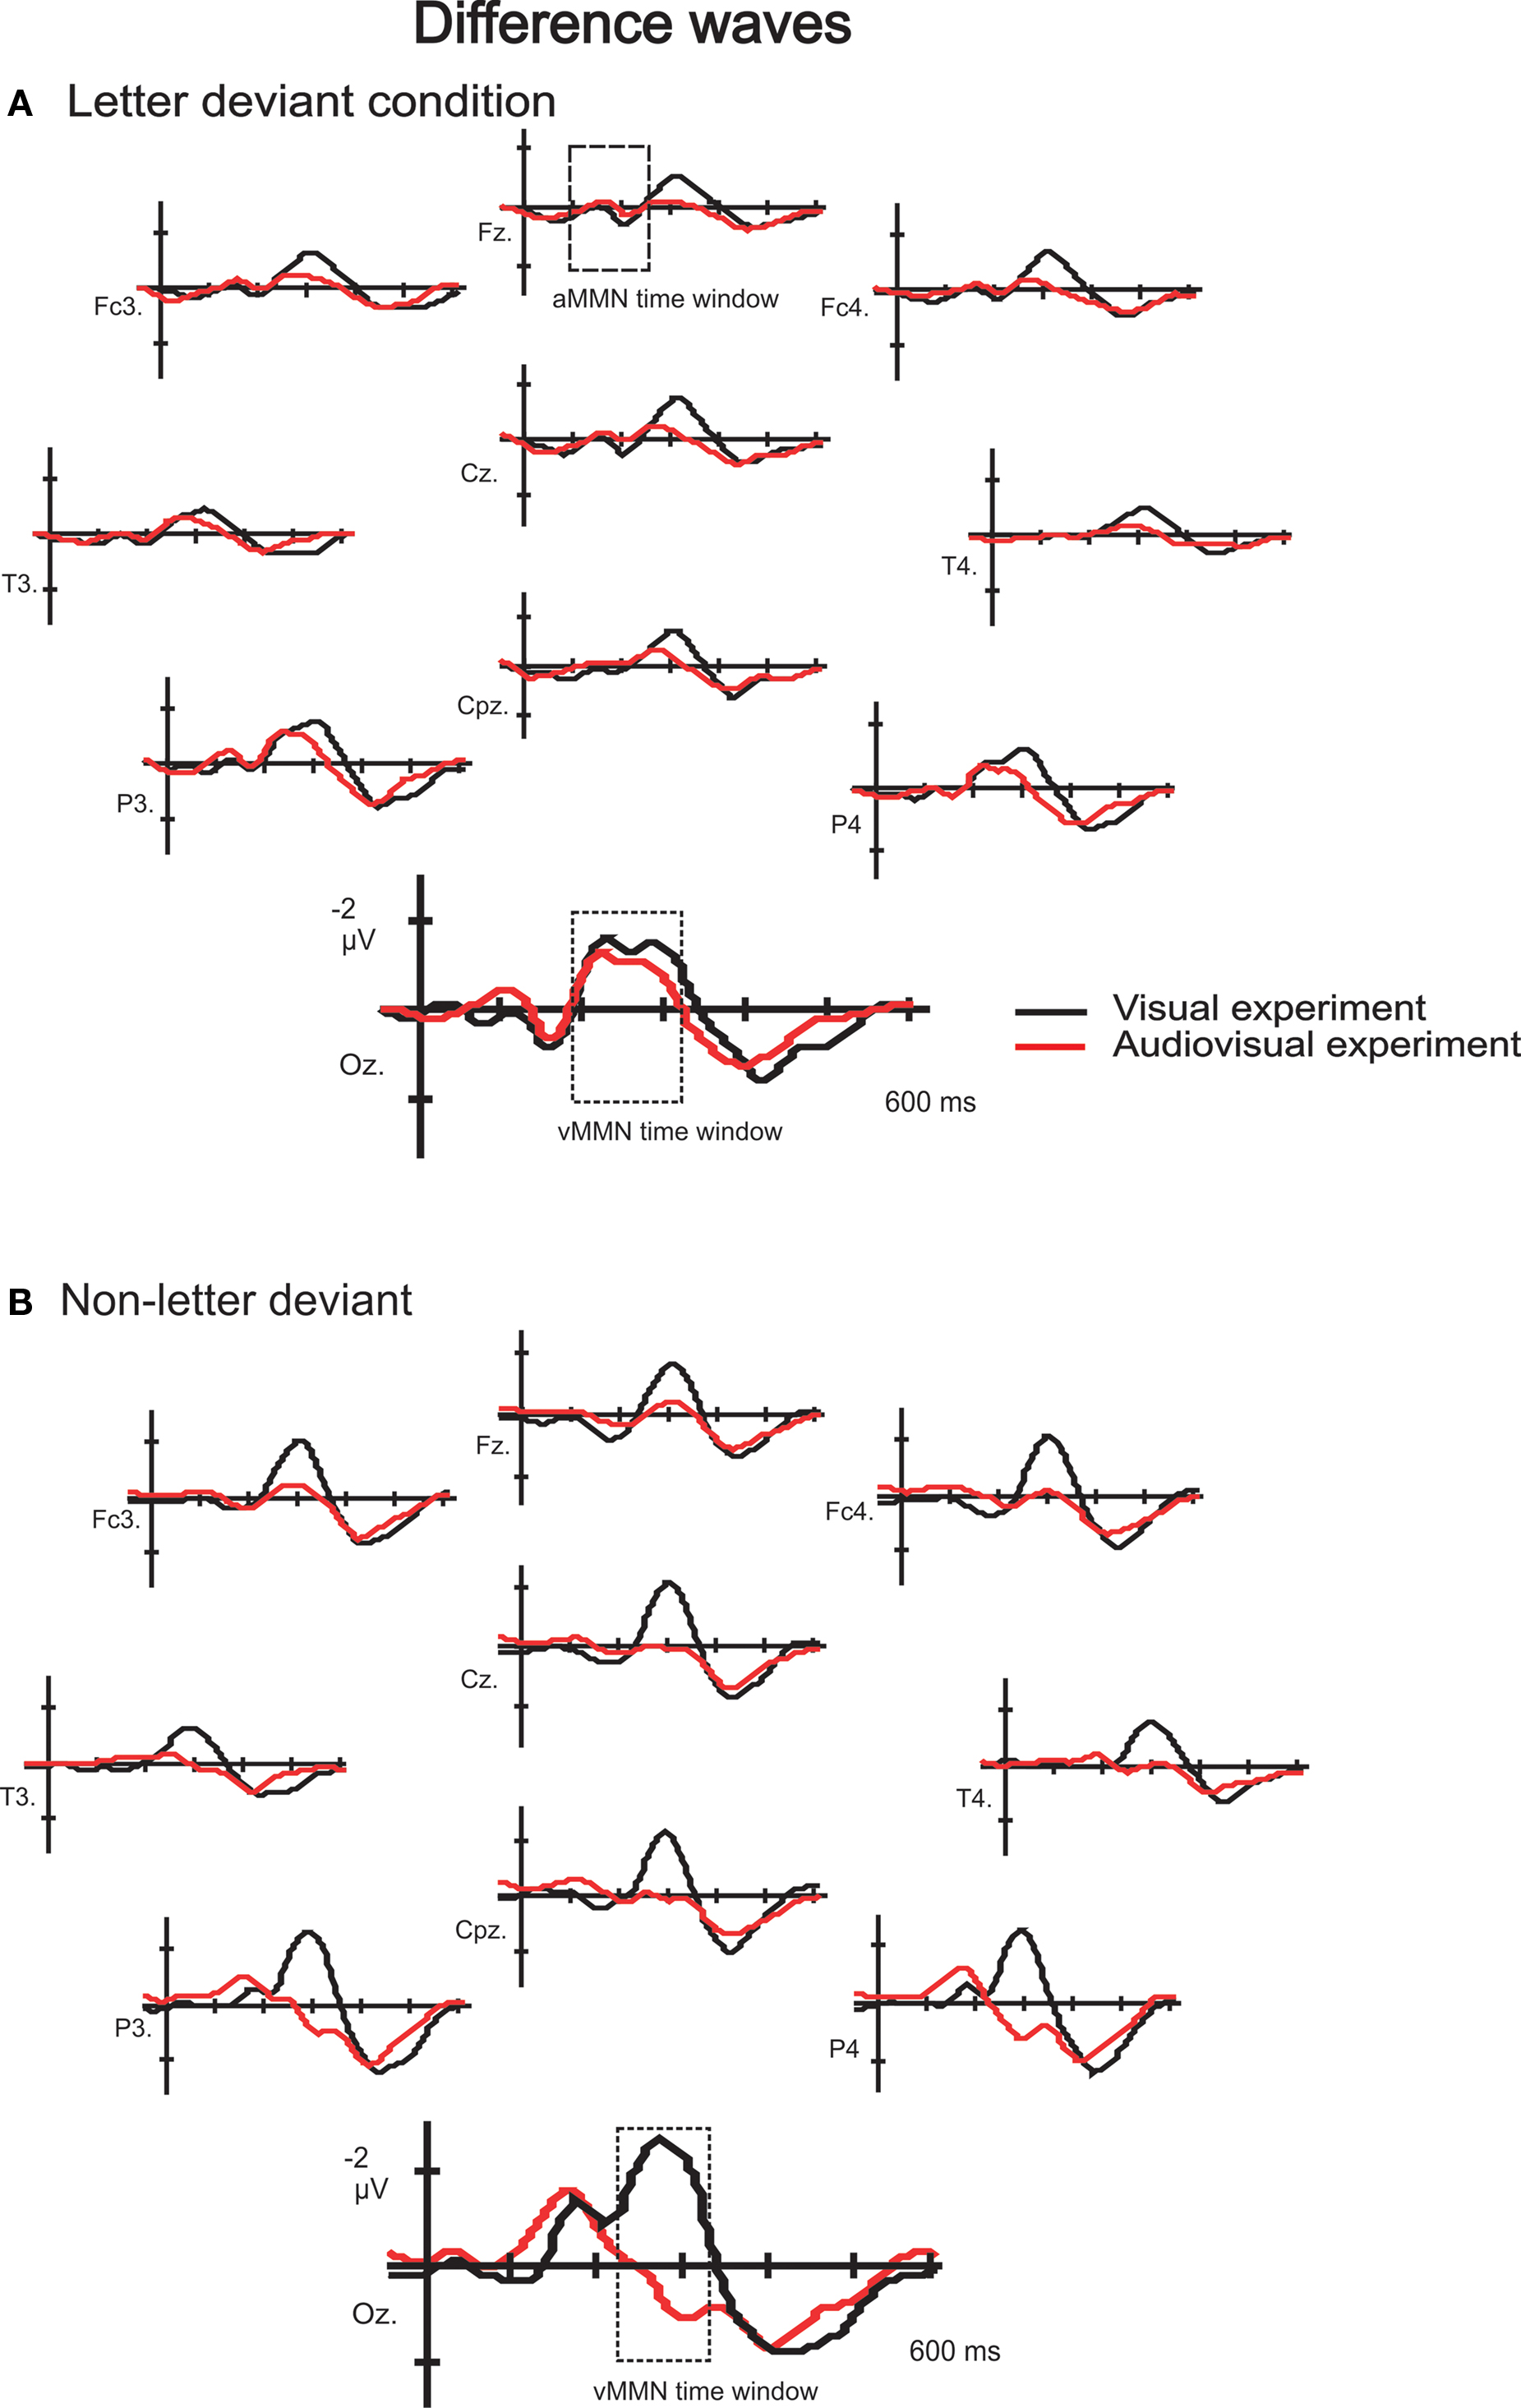
Figure 3. Difference waves to letter (A) and non-letter deviants (B) observed at 10 electrodes (Fz, Fc3, Fc4, Cz, T3, T4, Cpz, P3, P4 and Oz) in the visual experiment (black lines) and the audiovisual experiment (red lines). Besides the two time windows of interest, the assumed auditory MMN time window is indicated in electrode Fz in the letter condition (A).
In order to define the time window of interest in an objective manner and to minimize the likelihood of a Type I error (Guthrie and Buchwald, 1991
), in the visual experiment a t-test was calculated per condition (letter deviant and non-letter deviant) per time point of the middle occipital electrode (Oz), since in this electrode the vMMN was expected to be most prominent (Czigler et al., 2004
). In the letter deviant condition there was one large time window with at least 13 consecutive data points where the t-test exceeded the 0.05 alpha criterion (29 data points between 198 and 310 ms). In the non-letter deviant condition there was one large time window with at least 13 consecutive data points where the t-test exceeded the 0.05 alpha criterion (25 data points between 238 and 334 ms). In the non-letter condition there was also a second negative peak earlier in latency, however the number of data points of the time window around this peak did not fulfill our criterion (at least 13 consecutive data points where the t-test exceeded the 0.05 alpha criterion) to be included in further analysis (only 9 consecutive data points between 166 and 198 ms).
This exploratory analysis indicates large negativities in a time window that was expected based on the vMMN literature (Pazo-Alvarez et al., 2003
; Czigler, 2007
), which thus justifies a closer look at the data to check for an effect of speech sounds on the vMMN to letter deviants and/or non-letter deviants. Based on this exploratory analysis, we defined a time window of interest for a more detailed inspection of the data: between 198 and 310 ms for the letter condition, and between 238 and 334 ms for the non-letter condition.
Detailed Analysis within Time Window of Interest
Mean area amplitudes of the difference waves were first analyzed using repeated measures ANOVA (2 conditions × 11 electrode sites × 2 experiments). There was a significant three-way interaction, F(10, 300) = 3.37, p = .041. Since we expected an interaction with electrodes, further analysis was performed on only the three occipital electrodes were the effect is expected to be most prominent. This repeated measures ANOVA (2 conditions × 3 electrode sites × 2 experiments) revealed no three-way interaction, F(2, 60) < 1, and no two-way interaction between condition and electrode, F(2, 60) < 1, or between electrode and experiment, F(2, 60) < 1. But there was a two-way interaction between experiment and condition, F(1, 30) = 13.59, p < .001, indicating differential effects of the speech sound on letter versus non-letter processing. Consequently, we checked for an effect of experiment per condition:
In the letter deviant condition, this analysis revealed no interaction between electrode and experiment, F(2, 60) < 1. This allowed to check for a main effect of experiment, which appeared not to be present, F(1, 30) < 1, indicating no effect of speech sounds on letter deviant processing. In order to put this null-effect in perspective, effect sizes were calculated: the effect size of the difference between the visual only and audiovisual experiment in the letter condition is less then 0.001, which is small according to Cohen (1992)
, and explains less then 1% of all the variation in the data.
In the non-letter deviant condition, there was no interaction between electrode and experiment, F(2, 60) < 1, but a main effect of experiment, F(1, 30) = 21.68, p < .001, indicating an effect of speech sounds on non-letter deviant processing in this later time window. The amplitude to non-letter processing in the audiovisual experiment was decreased in comparison with its amplitude in the visual experiment (Table 1
). The effect size of the effect of experiment on non-letter processing is 0.42, which is between medium and large (Cohen, 1992
), and explains 18% of the variation in the data.
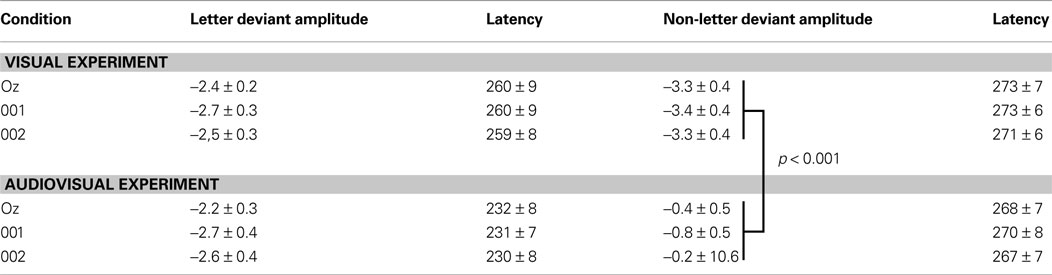
Table 1. Mean area amplitude and peak latency measures of the difference waves with standard errors of the mean averaged over the three occipital electrodes Oz, O1 and O2.
A repeated measures ANOVA (2 conditions × 11 electrodes × 2 experiments) of the peak latency revealed no three-way interaction, F(10, 300) = 1.28, p = 0.285, no significant two-way interactions, F(10, 300) = 1.10, p = 0.356, for condition × electrodes, F(10, 300) = 1.55, p = 0.192, for electrodes × experiment and F(1, 30) = 1.45, p = 0.238, for condition × experiment. This indicates that there are no differential effects of the speech sound on letter versus non-letter processing latency. There is however a significant main effect of condition, F(1, 30) = 7.65, p = 0.010, and of experiment, F(1, 30) = 5.21, p = 0.030. The peak latency in the letter condition was on average 25 ms earlier in comparison with its latency in the non-letter condition, which might indicate that familiar objects as letters are more rapidly processed. The peak latency in the audiovisual experiment was on average 16 ms earlier in comparison with its latency in the visual experiment, which might indicate a general crossmodal effect of the speech sound on visual processing speed.
Auditory MMN Evoked by Incongruent Visual Deviant?
The present design was at the same time also suitable to investigate a potential evocation of an auditory MMN by the letter deviant without changing the speech sound itself, similarly as the evocation of an auditory MMN by the McGurk effect (Sams et al., 1991
; Colin et al., 2002
; Möttönen et al., 2002
). In order to check for this we again calculated a t-test per time point of the difference waves in the audiovisual experiment measured at the frontal and the fronto-central electrodes Fz and Cz, were the auditory MMN is assumed to be most prominent (Näätänen, 1995
; Schröger, 1998
). In the letter deviant condition there was no time window (either at Fz or Cz) with at least 13 consecutive data points where the t-test exceeded the 0.05 alpha criterion, indicating no differential effect of the standard letter versus the deviant letter on speech sound processing. Although we did not hypothesize an evocation of an auditory MMN by the non-letter deviant, we also calculated t-tests per time point of the difference waves to the non-letter deviant condition. Again there was no time window with at least 13 consecutive data points where the t-test exceeded the 0.05 alpha criterion.
vMMN Modulation by Speech Sounds
To gain insight in the involvement of low level visual processing during letter–speech sound integration, we investigated the automaticity and time-course of the influence of speech sounds on letter processing. The visual counterpart of the auditory MMN was measured to letter and non-letter deviants presented either in isolation (visual only experiment) or simultaneously with speech sounds (audiovisual experiment). In the visual only experiment, a posterior negativity in both the letter and non-letter difference waves was observed between 150 and 350 ms, supporting the literature in favour of a deviance detection mechanism in the visual modality (Pazo-Alvarez et al., 2003
; Czigler, 2007
). We predicted an interaction between condition (letter versus non-letter deviant) and experiment (visual versus audiovisual). Results revealed a clear interaction, however not in the predicted direction: while the speech sound had no effect on deviant letter processing, the difference wave amplitude to non-letter processing decreased significantly if accompanied with a speech sound. The latency of the crossmodal effect, between 238 and 334 ms after stimulus onset, actually coincides with the latency of the letter–speech sound congruency effect, i.e. between 250 and 500 ms, reported in the MEG-study by Herdman et al. (2006)
. We therefore propose that the latency as well as the broad topographical distribution (Figure 3
) of this late negativity effect point to a content-related processing mechanism.
Additionally, the data of the subjects who participated both in the visual and in the audiovisual experiment is presented also separately in Figure 4
. The number of subjects (8) is too small to perform statistical analysis on this sample separately. However, this figure shows the potential effect of speech sounds on letter and non-letter processing while controlling for individual differences. We wanted to check whether the small (non significant) differences between the visual and the audiovisual experiment in letter deviant processing (see Figure 3
) was perhaps due to individual differences inherent in a between-subject design. Alternatively, this small difference might reflect a genuine effect of speech sounds on letter processing that was not significant due to a potential lack of sensitivity of the visual MMN design (see lower the discussion on this topic). Figure 4
, depicting only the data of subjects who participated in both the visual and the audiovisual experiment, clearly illustrates the similarity of the difference waves to the letter deviant in the visual and the audiovisual experiment. This indicates that the small (non significant) differences between the visual and the audiovisual experiment (Figure 3
) in letter deviant processing is not a genuine effect of speech sounds on letter processing, but rather due to individual differences inherent in the between-subject data.
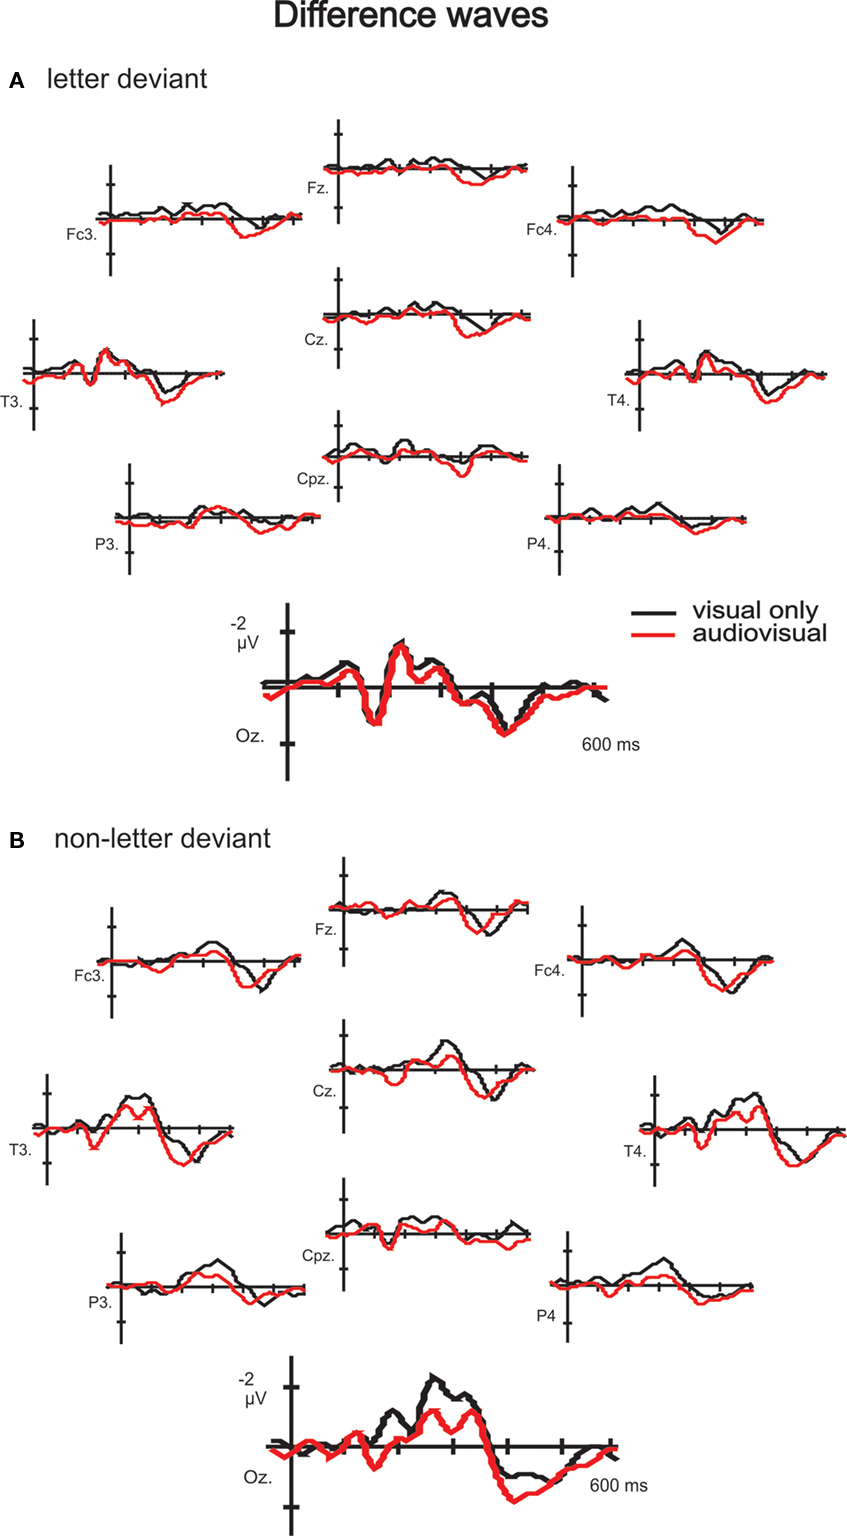
Figure 4. Difference waves to letter (A) and non-letter deviants (B) observed at ten electrodes (Fz, Fc3, Fc4, Cz, T3, T4, Cpz, P3, P4 and Oz) in the visual experiment (black lines) and the audiovisual experiment (red lines). Only for the eight within-subject participants.
Asymmetric Involvement Low Level Areas in Letter–Speech Sound Processing
No influence speech sound on letter processing
Although there is a general speeding up effect of vMMN latency to letter and non-letter processing, there is no specific effect of speech sounds on the vMMN amplitude to letter processing, and thus not a reversal of the effects of letters on speech sounds that we reported previously (Froyen et al., 2008
, 2009)
. In these studies, we found a significantly increased amplitude of the auditory MMN in the audiovisual experiments in response to the double, crossmodal violation of the deviant speech sound with respect to both the standard speech sound and the standard letter. In the present study, the grand average waves to the standard and deviant letter (Figure 2
) as well as the difference waves to the deviant letter (Figures 3 and 4
) did not differ between the visual and the audiovisual experiment. This indicates that speech sounds do not automatically influence standard or deviant letter processing in a way comparable to the automatic modulation of speech sound processing by letters. The present results therefore shed more light on the role of low level visual processing during letter–speech sound integration. Whereas low level auditory processing is automatically involved in letter–speech sound integration (Froyen et al., 2008
), this does not seem to hold for low level visual processing as was also indicated by previous fMRI studies using a passive task design (Van Atteveldt et al., 2004
, 2007a
). Despite the use of a high temporal resolution method in the present study no automatic influences of speech sounds on letter processing were found, thus supporting an asymmetry in the involvement of low level auditory and visual areas during letter–speech sound integration.
While the auditory MMN is a stable component with generally acknowledged properties, the visual MMN and its exact properties have been subject to some discussion. Therefore, a direct comparison of auditory and visual MMN studies might not be that straightforward. Recent review papers, however, have concluded that the visual MMN has similar properties as the auditory MMN (Pazo-Alvarez et al., 2003
; Czigler et al., 2004
). More importantly, in the present study we first assure that there is a stable vMMN in the unimodal condition, before we look for a potential crossmodal effect on the vMMN. On the other hand, the visual MMN is generally somewhat lower in amplitude. Consequently, an effect on the visual MMN has to be relatively large in order to become statistically significant. It might be argued that the visual MMN design is not as suitable to find crossmodal effects on letter processing as the auditory MMN design appeared to be for finding crossmodal effects on speech sound processing. We calculated that with the present number of subjects in each condition (16) and the present standard error (Table 1
), the average difference in vMMN amplitude would have to be at least 1.3 �V. If the average difference in visual MMN amplitude in the letter condition had been larger than it is now and approached the critical 1.3 �V, we would have to take into account the possible lack of sensitivity of the visual MMN design. However, the difference between the vMMN in the visual versus the audiovisual experiment is very small (Table 1
), with an effect size of less then 0.001, explaining less than 1% of all the variation in the data. Consequently, we argue that it is not due to a potential lack of sensitivity of the visual MMN design or power of the statistical test that there is no significant effect in the present data set.
It might be that only when subjects have to actively process letter–speech sound pairs, interaction effects in low level visual areas can be recorded with a high temporal resolution method (Herdman et al., 2006
). The task used in the MEG study by Herdman et al. required the subjects to make a congruency decision on the presented letters and speech sounds. This active task design promotes both congruent and incongruent letters to immediate relevance, thereby not only recruiting low level auditory areas, but also involving low level visual processing areas. Interestingly, in an ERP-study with newly learned audiovisual stimuli, similar task effects were reported (Fort and Giard, 2004
). During a stimulus identification task, requiring active processing of the auditory and the visual features of the stimulus, integration effects in visual areas were observed in three time windows, i.e. between 50–100, 100–150 and 150–200 ms. However, when subjects were asked to simply detect each stimulus, not requiring active processing of the stimulus properties, only early interactions (50–100 ms) were observed. Alternatively, attention might play a crucial role in evidencing crossmodal integration effects in the low level visual system. In an audiovisual ERP-study with, again, meaningless stimuli in which attention was systematically manipulated, integration effects on the early P1 component amplitude were strongly reduced during the unattended condition (Talsma et al., 2007
). A superadditive integration effect was observed when both auditory and visual stimuli were simultaneously attended, while in the unattended condition the audiovisual P1 was smaller than the sum of the two unimodal P1s. In sum, it seems that processing arbitrarily linked audiovisual stimuli does not automatically involve low level visual processing. Note that the above mentioned studies are either MEG (Herdman et al., 2006
) or EEG (Fort and Giard, 2004
; Talsma et al., 2007
) studies, supporting our suggestion that the usage of a high temporal resolution method might be critical for revealing the involvement of low level visual processing areas during audiovisual integration of arbitrarily related stimuli, like letters and speech sounds.
It is unlikely that the choice of stimuli has contributed to the observed null-effect. One could object that the deviant letter “o” is not perceived as a letter, but as a circle or even a zero. However, the letters “a” and “o” were presented in ARIAL. In this letter type the “o” is not round, but oval, thus diminishing the likelihood that the “o” is perceived as a circle. Furthermore, in the large majority of the trials during the audiovisual experiment, a congruent letter–speech sound pair (/a/ - “a”) is presented. This creates an obvious letter–speech sound context in which the “o” is not likely to be perceived as zero. All participants that were asked to describe the presented stimuli reported seeing the “o”, as was intended.
A null effect, as observed in the present study, is for obvious reasons somewhat less convincing in comparison with a clearly significant effect. Although we believe that the present results are valid, it is possible that with other designs early and automatic effects of speech sounds on letter processing can be observed. It would therefore be worthwhile to further investigate this issue with other experimental designs. In specific cases (e.g. clinical or developmental studies) the MMN-paradigm has clear advantages over other paradigms (see introduction). Nevertheless, a passive additive paradigm might be a possible alternative if it is well controlled for attention effects and if the risk of the double subtraction of common activity is circumvented (see for example (Stekelenburg and Vroomen, 2007
). The additive paradigm has the advantage that it can detect crossmodal interactions in more brain areas and over a larger time-course than can be done with the MMN paradigm.
No auditory MMN as a consequence of incongruent letter deviant
The present design furthermore allowed to investigate whether a letter has comparably strong influences on speech sound processing as lip movements have. If the incongruent deviant letter “o” would evoke an auditory MMN, despite the standard speech sound /a/ being unaltered, this would compare with the MMN evoked by the McGurk effect in which the deviant lip movements evoke an auditory MMN despite the standard speech sound being unaltered (Sams et al., 1991
; Colin et al., 2002
; Möttönen et al., 2002
).
In order to check for an auditory MMN evoked by a letter deviant we calculated a t-test per time point of the difference waves in the audiovisual experiment measured at the frontal and the fronto-central electrodes Fz and Cz, were the auditory MMN is assumed to be most prominent (Näätänen, 1995
; Schröger, 1998
). There was no time window (either at Fz or Cz) with at least 13 consecutive data points where the t-test exceeded the 0.05 alpha criterion, indicating no differential effect of the standard letter versus the deviant letter on speech sound processing. The similarities between the difference waves at the frontocentral electrodes in the aMMN time window evoked in both the visual and the audiovisual experiments indicate that the observed small negativities probably reflect visual evoked potentials from occipital generators, instead of visual influences on auditory processing. The letter deviants in the present experiment thus did not evoke an aMMN.
As pointed out by Besle and coauthors, all studies in which an aMMN was evoked by merely deviating the visual part of an audiovisual stimulus used an auditory illusion (Besle et al., 2005
). An aMMN has been evoked by the McGurk-illusion (Sams et al., 1991
; Colin et al., 2002
; Möttönen et al., 2002
), the ventriloquist-illusion (Stekelenburg et al., 2004
), and in a face-voice emotion identification study (de Gelder et al., 1999
). Our results support the suggestion that an illusion is necessary to evoke an aMMN by merely deviating the visual part in an audiovisual stimulus (Besle et al., 2005
) and suggest that letters do not have comparably strong influences on speech sound processing as lip movements do.
Comparison of letter–speech sound with audiovisual speech processing
These indications for an asymmetric involvement of low level sensory areas during letter–speech sound processing, and presumably also during audiovisual processing of other arbitrarily linked stimuli, are in contrast with the indications for a symmetric involvement of both low level sensory cortices during audiovisual speech processing (Calvert et al., 1999
, 2000
; Macaluso et al., 2004
). On the other hand, to our knowledge, no ERP/MEG studies on audiovisual speech processing have reported crossmodal integration effects in low level visual areas (Besle et al., 2004
; Van Wassenhove et al., 2005
; Stekelenburg and Vroomen, 2007
). While Stekelenburg and Vroomen (2007)
seemed to restrict their analysis to the central electrodes and also Van Wassenhove et al. (2005)
focused mainly on the effects of lip movements on auditory processing and not vice versa, Besle et al. (2004)
do explicitly investigate crossmodal effects in low level visual areas. It remains unclear why in this study no crossmodal effect in low level visual areas is reported. However, considering the convincing data of fMRI studies on audiovisual speech processing (Calvert et al., 1999
, 2000
; Macaluso et al., 2004
) we assume that low level visual cortex is involved during audiovisual speech processing.
A plausible explanation for the difference in the involvement of the low level visual areas is that audiovisual speech, but not letter–speech sound processing, is a natural product of phylogenetic and ontogenetic spoken language development. Consequently, a naturally evolved neural system for processing and integrating letters and speech sounds is unlikely to exist (Gleitman and Rozin, 1977
; Liberman, 1992
). It has been suggested that reading parasites on speech (Mattingly, 1972
), making it plausible that information from the parasitic mechanism, in this case visual letter information, travels to the speech processing system and not vice versa (see also Van Atteveldt et al., 2007a
). Alternatively, the nature of the link between the two modalities of a stimulus may be critical for the automaticity of the involvement of both low level sensory cortices (Calvert, 2001
). When we see and hear speech being spoken, the auditory speech signal shares time varying aspects with the concurrent lip movements (Calvert et al., 1998
; Munhall and Vatikiotis-Bateson, 1998
; Amedi et al., 2005
). These shared time varying aspects constitute a strong natural crossmodal binding factor. Letters, however, are culturally defined symbols without any natural relation with their corresponding speech sounds. A recent investigation of the development of letter–speech sound processing indicated that it takes years of reading instruction before letter–speech sound pairs are automatically integrated (Froyen et al., 2009
), which stands in sharp contrast with the indications for audiovisual speech integration very early in development (Burnham and Dodd, 2004
). The latter more general explanation hypothesizes that our neural system is well adapted to integrate naturally linked crossmodal properties of a stimulus, while arbitrarily linked audiovisual properties probably recruit a different neural mechanism.
The present findings, together with previous findings from our group, address the question posed by Naumer and colleagues in a study on the neural network involved in processing object familiarity and semantic congruency (Hein et al., 2007
). The authors wondered in their conclusions on p 7886 “…whether even sensory specific regions become involved in audiovisual integration of artificial object features if the respective associations are explicitly trained”. While low level visual processing seems not to be automatically involved during letter–speech sound processing (present study; Van Atteveldt et al., 2004
, 2007a
), low level auditory processing is automatically involved in fluent readers (Van Atteveldt et al., 2004
, 2007a
; Blau et al., 2008
; Froyen et al., 2008
), but requires many years of reading instruction to become adult-like (Froyen et al., 2009
).
The presently described difference in the involvement of low level visual areas during letter–speech sound processing is interesting for further exploration in the light of normal and abnormal reading development. In developmental dyslexia, for example, it is remarkable how specific reading and writing skills are deficient while other skills are largely unaffected (Vellutino et al., 2004
). The uniqueness of written language, considering its development and its arbitrary link with phonology, might contribute to the specificity of the reading and writing deficit in people with dyslexia. The auditory MMN has been shown to be a valuable tool to investigate, non-invasively and without the requirement of a task, auditory and phonological processing (Kujala and Naatanen, 2001
; Csépe, 2003
; Mitterer et al., 2006
; Bishop, 2007
; Bonte et al., 2007
) as well as letter–speech sound processing (Froyen et al., 2009
, in revision) in normal and reading impaired children. For the same reasons, the visual MMN might contribute to investigations of visual or crossmodal processing in normal or impaired reading adults and children.
Effect Speech Sound on Non-Letter Processing
While there was no direct effect of speech sounds on letter processing, the amplitude of the vMMN to non-letter deviant processing was strongly decreased when presented with a speech sound. Since it is known that the MMN amplitude varies with deviancy (Berti et al., 2004
; Pakarinen et al., 2007
), this decrease in amplitude might indicate that the non-letter deviant is perceived as less deviant from the standard letter when both are presented together with a speech sound. This would mean that speech sounds can have an effect on the perception of visual stimuli, but admittedly to our surprise only on non-letter processing. Interestingly, in another audiovisual MMN-study with meaningless stimuli, the visual deviant in the audiovisual experiment was also found to evoke a lower visual MMN amplitude in comparison with that same visual deviant in the visual only experiment (Besle et al., 2005
). This implies that auditory and visual information can interact before the occurrence of the visual MMN and re-assures that the visual MMN is an appropriate tool to investigate the involvement of lower level visual processing during passive audiovisual integration, therefore strengthening our conclusion that the null-result in the letter condition is a meaningful result.
It has been shown with the auditory MMN that the same deviant can evoke aMMNs with different amplitudes depending on the relevance of the deviant for ones native language. Deviants that are phonological irrelevant in Finnish but relevant in Estonian have been found to evoke an aMMN with a lower amplitude in a monolingual Fin than in an Estonian (Näätänen et al., 1997
). Even within a language the MMN amplitude is found to be sensitive to different phonotactic probabilities of phoneme combinations (Bonte et al., 2005
). Similarly, the visual MMN might be sensitive for the context in which a visual deviant is presented. In the audiovisual experiment the stimulus context existed almost entirely of letter–speech sound pairs. A mind-set might have been building up in which non-letter processing in the letter–speech sound context was considered less relevant and thus evoked a less negative vMMN.
An intuitively appealing neural mechanism underlying a context driven MMN effect is a content related feedback projection from higher order areas (Calvert, 2001
). STS, an heteromodal area repeatedly found to be involved in letter–speech sound processing (Raij et al., 2000
; Hashimoto and Sakai, 2004
; Van Atteveldt et al., 2004
, 2007a
; Blau et al., 2008
), might generate an mind-set in the audiovisual experiment because it is constantly evaluating the congruency of letter–speech sound pairs (90% of the trials). Whenever now an irrelevant non-letter is presented (10% of the trials), feedback from STS to low level visual areas may prevent the evocation of a strong vMMN. In fact, this would point to an indirect role for low level visual areas in letter–speech sound processing: the suppression of irrelevant information at the benefit of, in this context, relevant letter–speech sound processing capacity. Considering this hypothesis it might be that content related feedback from STS reaches the extrastriate cortex later than the evocation of the visual MMN (Raij et al., 2000
), which might explain why no letter–specific effect of the speech sound on the visual MMN to letter deviants was observed. However, also later in time no effect of the speech sound on letter deviant processing was observed. Previous letter–speech sound processing studies, in which we used the auditory MMN, have shown audiovisual effects later in time (650 ms) if no early effects were observed (Froyen et al., 2009
, in revision). Moreover, alternatively to the feedback model, a mechanism in which audiovisual stimuli interact via direct connections between low level sensory areas has been suggested (Besle et al., 2004
; Saint-Amour et al., 2007
). Electrophysiological studies with animals show direct connections between low level sensory areas (Schroeder et al., 2003
). Under the assumption that similar direct connections exist in the human brain, feedback projections from STS are not the only possible explanation for crossmodal interaction effects in low level sensory areas. Both mechanisms are not mutually exclusive, but may rather co-exist depending on the purpose of the crossmodal process.
Alternatively to the idea of a mind-set built up by the letter–speech sound context, the clear interaction between condition (letter versus non-letter deviant) and experiment (visual only versus audiovisual) might indirectly reflect a content related, letter specific crossmodal effect. In fact, in the introduction we predicted an interaction effect, however in the opposite direction: no effect of experiment on non-letter processing but a context effect on letter processing. Nonetheless, the presently observed interaction effect might indicate that the large modulation of non-letter deviant processing by the speech sound constitutes a baseline effect evoked when processing unrelated auditory and visual stimuli. This would fit with the results of another audiovisual MMN-study with meaningless stimuli that we discussed earlier (Besle et al., 2005
). In this study the vMMN to the visual deviant in the audiovisual experiment was also found to be modulated (also lower vMMN amplitude) in comparison with the vMMN to the same visual deviant in the visual only experiment (Besle et al., 2005
). Since in this study meaningless stimuli were used (ellipses and pure tones) it is not probable that the context modulation was content driven, indirectly supporting the suggestion that this modulation is part of a general baseline effect. It is therefore interesting to speculate on the differences between letter and non-letter processing, and their differential susceptibility to speech sound interactions. Obviously, letters are much more familiar to an experienced reader than the ‘*’ that was used as the control stimulus in our experiment. Consequently, the meaning and category of the letter is well known and unambiguous, regardless of the speech sound that is presented simultaneously. The neural network underlying the processing of familiar and unambiguous letter symbols might therefore be more robust and less susceptible to speech sound presentations in comparison with the neural network for processing the less familiar symbol ‘*’ which has more than one meaning. Our brain might react differently when this less familiar visual representation is presented together with an unrelated sound in an attempt to associate the visual representation with that sound. Temporal and spatial proximity are known to be strong crossmodal binding factors both on a neuronal level in animals (Stein and Wallace, 1996
) as well as in humans (Giard and Peronnet, 1999
; Molholm et al., 2002
). Even unrelated circles and pure tones have been found to evoke interaction effects in low level sensory areas between 0 and 200 ms after stimulus onset if both stimuli were presented in close temporal proximity (Giard and Peronnet, 1999
; Molholm et al., 2002
). Similarly, the simultaneous presentation of the non-letter and the speech sound might have been sufficient to evoke an interaction effect in low level visual areas. Interestingly, in the studies by Giard and Peronnet as well as Molholm and co-authors, the ERPs measured at the occipital electrodes while audiovisual stimuli were presented were less negative in comparison with the sum of the unisensory ERPs. Although it is hard to directly compare these results with our results, because of the differences in design (additive versus MMN), the same neural mechanism that is responsible for the audiovisual interaction effect in the studies by Giard and Peronnet and Molholm et al. might have contributed to the modulation that we observed in the non-letter condition: interaction effects between unrelated speech sounds and non-letters in the low level visual areas because both are presented simultaneously. This would imply that the fact that letter processing was not modulated by speech sounds reflects a letter–specific crossmodal effect, because the baseline effect for unrelated stimuli would be a modulation. However, further research is needed to shed more light on this speculation.
Since it remains unclear what exactly drives the effect of speech sounds on letter processing, it is important to evaluate some alternative explanations. Firstly, there are no differences in variability between the visual and audiovisual experiment (Table 1
), that might explain an effect in the data that is not actually present on a population level. Secondly, in the audiovisual experiment 12 participants were presented with an irrelevant deviant speech sound in 10% of the trials (see Materials and methods). It is possible that the context of auditory deviants might have contributed to the crossmodal effect on non-letter processing. However, in the 8 subjects that participated in both experiments we did not present the speech sound deviant in the audiovisual experiment. Interestingly, also in these eight subjects the non-letter processing is modulated in the audiovisual experiment (Figure 4
). Consequently, the context of a speech sound deviant cannot solely explain the modulation of non-letter processing. Thirdly, the effect of speech sounds on non-letter processing seems not restricted to the occipital electrodes alone, but is also present in frontal and parietal channels. One might wonder whether more general attention effects are involved that are reflected in a P3 which thus cause a decrease in the negativity of the vMMN amplitude. However, the differences between the audiovisual and visual experiment in ERPs measured at the frontal and parietal channels are restricted to the negative peak in the grand average waves evoked around 300 ms, identified as the N2 (Figure 2
). Later in time, around 400 ms, a positive peak is identified as the P3. Importantly, the positive peak (P3) seems not to differ between the different experiments, indicating similar attention states in both experiments. The distribution of the vMMN (especially the vMMN observed somewhat later in time) is repeatedly found to be less restricted to the occipital electrodes alone (Pazo-Alvarez et al., 2003
; Maekawa et al., 2005
; Kimura et al., 2009
). A crossmodal effect on vMMN amplitude will consequently also affect the amplitudes at all the other electrodes were the unimodal vMMN had an effect.
Independent of the exact nature of the effect of speech sounds on non-letter processing, our findings imply that whereas low level auditory processing seems to constitute a standard ingredient in letter–speech sound processing (Van Atteveldt et al., 2004
, 2007a
; Froyen et al., 2008
, 2009
), this does not hold for low level visual processing. This does not mean that speech sounds cannot influence letter processing indirectly as evidenced in the present effects on processing non-letters which are not relevant in the context of letter–speech sound processing, but emphasizes that speech sound processing does not automatically impact on letter processing and therefore does not seem to constitute an integral part of the letter–speech sound integration network.
Although previous research revealed systematic influences of letters on speech sound processing, we did not find the reverse pattern; i.e., influences of speech sounds on letter processing in a crossmodal context. The results revealed that in contrast to well established natural audiovisual association processes like audiovisual speech processing, the network for letter–speech sound integration is characterized by an asymmetric role of low level sensory areas; auditory areas are automatically recruited whereas low level visual processing is not directly involved. Only non-letter processing was affected, when simultaneously presented with speech sounds, possibly pointing to regulatory feedback from audiovisual integration sites to visual cortex. The fact that written language is not naturally related to speech, may account for the finding that only low level auditory, but not low level visual cortex is involved in the automatic integration of letters and speech sounds, a necessary prerequisite for developing reading fluency.
The authors declare that the research was conducted in the absence of any commercial or financial relationships that could be construed as a potential conflict of interest.
We thank Hanne Poelmans for assistance in data acquisition, Fren Smulders for helpful comments on data analysis and the reviewers for constructive comments that helped improving the manuscript.
Gleitman, L. R., and Rozin, P. (1977). “The structure and acquisition of reading I: relations between orthographies and the structure of language” in Towards a Psychology of Reading: The Proceedings of the CUNY Conferences, eds A. Reber & D. Scarborough (Hillsdale, N.J: Lawrence Erlbaum Associates).