Dynamics of circadian thalamocortical flow of information during a peripheral neuropathic pain condition
- 1 Departamento de Biologia Experimental, Faculdade de Medicina, Universidade do Porto, Porto, Portugal
- 2 Instituto de Biologia Molecular e Celular, Grupo de Morfofisiologia do Sistema Somatosensitivo, Universidade do Porto, Porto, Portugal
- 3 Departamento de Radiologia, Faculdade de Medicina, Universidade de São Paulo, São Paulo, SP, Brasil
It is known that the thalamocortical loop plays a crucial role in the encoding of sensory–discriminative features of painful stimuli. However, only a few studies have addressed the changes in thalamocortical dynamics that may occur after the onset of chronic pain. Our goal was to evaluate how the induction of chronic neuropathic pain affected the flow of information within the thalamocortical loop throughout the brain states of the sleep–wake cycle. To address this issue we recorded local field potentials (LFPs) – both before and after the establishment of neuropathic pain in awake freely moving adult rats chronically implanted with arrays of multielectrodes in the lateral thalamus and primary somatosensory cortex. Our results show that the neuropathic injury induced changes in the number of wake and slow-wave-sleep (SWS) state episodes, and especially in the total number of transitions between brain states. Moreover, partial directed coherence – analysis revealed that the amount of information flow between cortex and thalamus in neuropathic animals decreased significantly, indicating that the overall thalamic activity had less weight over the cortical activity. However, thalamocortical LFPs displayed higher phase-locking during awake and SWS episodes after the nerve lesion, suggesting faster transmission of relevant information along the thalamocortical loop. The observed changes are in agreement with the hypothesis of thalamic dysfunction after the onset of chronic pain, and may result from diminished inhibitory effect of the primary somatosensory cortex over the lateral thalamus.
Introduction
Although classically viewed as indicators of sleep–arousal transitions (McCormick and Bal, 1997), thalamocortical oscillations are now known to play an important role in the perception of visual, auditory, and somatosensory stimuli (Jones, 2001; Sherman and Guillery, 2002; Ribary, 2005; Massimini et al., 2009). Recent studies have shown that the disruption of this oscillatory activity in the thalamocortical loop impairs attentional control, affects the normal processing of sensory information, and disrupts the recall of previous sensory experiences (Lumer et al., 1997; Wiest and Nicolelis, 2003; de Labra et al., 2007; Meehan et al., 2008; Ray et al., 2009). In what concerns pain perception, the functional loop between neurons of the primary somatosensory cortex and lateral thalamic nuclei is known for a long time to be fundamental in the processing of the sensory–discriminative features of painful stimuli that are transmitted through the spinothalamic tract (Willis, 2007; Lima, 2008). However, recent studies have proposed a larger sensory role for thalamocortical oscillations by suggesting that disruption of their fine balance could be at the onset of neurogenic pain by a process known as thalamocortical dysrhythmia, in which slower brain rhythms are produced by a disruption of inhibitory feedback in thalamic neurons (Llinás et al., 1999). This hypothesis is supported by the clinical observation that chronic pain patients have a shift in their EEG spectrum toward lower dominant frequencies (Chen and Herrmann, 2001; Drewes et al., 2008; Walton et al., 2010). Moreover chronic pain patients display an increase in EEG power over theta frequency which also supports the neurogenic hypothesis of thalamocortical dysrhythmia (Sarnthein et al., 2006; Bjørk et al., 2009; Walton et al., 2010).
It is, however, difficult to assess how critically important are these thalamocortical changes to the onset of chronic pain symptoms, since they also occur in several non-painful neurological conditions such as epilepsy, Parkinson disease, essential tremor, tinnitus, and non-painful paraplegia (Jeanmonod et al., 2003; Hughes and Crunelli, 2005; Sarnthein and Jeanmonod, 2007; Boord et al., 2008; Kane et al., 2009). Furthermore, these human studies were based in short recording sessions, and have not taken into consideration how the disruption of the thalamocortical oscillations might affect the patient’s state of vigilance, which is highly relevant since chronic pain causes fragmentation of sleep patterns (Gudbjornsson et al., 1993; Drewes et al., 1995; Jones et al., 1996; Hagen et al., 1997; Tishler et al., 1997; Morin et al., 1998) while sleep deprivation exacerbates pain perception (Moldofsky et al., 1975; Drewes et al., 1997; Lentz et al., 1999; Onen et al., 2001; Kundermann et al., 2004; Edwards et al., 2008). More importantly, the human studies cannot solve the conundrum of determining if the chronic pain is a cause or a consequence of the thalamocortical dysrhythmia.
Chronic painful conditions are commonly associated with sleep disturbances (Lautenbacher et al., 2006; Tang et al., 2007). In fact, the relationship between pain and sleep appears to be reciprocal: while pain may interrupt or disturb sleep, poor sleep can also influence pain perception. However, the influence of sleep disturbances on pain processing is still poorly investigated. Previous neurophysiological studies describing changes in brain oscillations in animal models of chronic pain during sleep–wake cycle were commonly limited to only short periods or single sessions of recording (Andersen and Tufik, 2003; Kontinen et al., 2003; Monassi et al., 2003; Keay et al., 2004; Silva et al., 2008), and most of them were mainly focused in the changes in sleep patterns (Carli et al., 1987; Landis et al., 1988; Millecamps et al., 2005) without addressing the changes in brain activity.
On the other hand no animal studies have addressed the changes in thalamocortical dynamics after the onset of chronic pain across the sleep–wake cycle, although a few have described the changes occurring in the thalamocortical loop during acute painful stimulation or immediately following formalin injection (Wang et al., 2003, 2004; Huang et al., 2006). Therefore, our goal was to evaluate how the induction of prolonged neuropathic pain affected the thalamocortical dynamics. To pursue this goal we recorded the spontaneous neural activity of freely moving adult rats using multielectrodes chronically implanted in the primary somatosensory cortex and lateral thalamus, in long duration recording sessions – 24 h – performed before and after the induction of the spared nerve injury (SNI) – model of neuropathic pain (Decosterd and Woolf, 2000).
Materials and Methods
Ethics Statement
All procedures and experiments adhered to the guidelines of the Committee for Research and Ethical Issues of IASP (Zimmermann, 1983), with the Ethical Guidelines for Animal Experimentation of the European Community Directive Number 86/609/ECC of 24 November of 1986, and were locally approved by national regulatory office [Direcção Geral de Veterinária (DGV), Lisboa, Portugal].
Twelve adult male Sprague-Dawley rats weighing between 350 and 450 g were used in this study. The rats were maintained on a 12-h light/dark cycle (light period from 7 a.m. to 7 p.m.), and given ad libitum access to food and water during the habituation and the recording sessions. Both habituation and recording sessions started at approximately the same time each day (7 p.m.).
Surgical Methods
For the surgical implantation of the intracranial multielectrodes arrays the animals were anesthetized with a mixture of xylazine and ketamine (10 and 60 mg/kg, respectively, i.m.). Anesthesia was maintained with small additional injections of ketamine (one-third of the initial dosage). The depth of anesthesia and paralysis of the musculature was assessed by regularly testing the corneal blink, hindpaw withdrawal, and tail-pinch reflexes. After the anesthesia induction, each animal received a dose of atropine sulfate (0.02 mg/kg, s.c.), and 1 mL of serum (sucrose 2% p/v in NaCl 0.9% p/v, s.c.) every hour during the surgery. Core body temperature was measured with a rectal thermometer and maintained at 37°C by means of a homoeothermic blanket system.
The animal’s head was shaved and cleaned using a triple application of alcohol (70%, v/v) and betadine. A midline subcutaneous injection of 0.3 mL of 1% lignocaine (B Braun, Melsungen, Germany) was applied to the scalp for local analgesia. Anesthetized animals were secured in a stereotaxic frame using ear bars, and a midline incision was made caudally to the animal’s eyes and ending between ears. The connective tissue was blunt-dissected from the skull, and the top of the skull was exposed and cleaned using hydrogen peroxide. After the scalp was excised, holes were drilled in the skull for microelectrode passage and for implantation of four to five screws. These screws were used for securing probes and for grounding purposes. The skull was covered by mineral oil in order to avoid dehydration during surgical procedure.
Each microelectrode array included eight filaments (1 array/area) of isonel-coated tungsten wire (35 μm diameter; California Fine Wire Company, Grover Beach, CA, USA) with impedances varying between 0.5 and 0.7 MΩ at 1 kHz, and a reference silver wire (150 μm diameter; A-M Systems Inc., WA, USA) for connection with the cranial screws. The microelectrode arrays were constructed in 4 × 2 architecture (1–2; 3–4; 5–6; 7–8 channels), interspaced 250-μm between lines and 400-μm between columns (Figure 1A; Silva et al., 2010). Only two of the electrodes per array (channel #3 [medial] and channel #6 [lateral]) were used for the recording of low-frequency LFPs; all eight electrodes in each array were used for recording of high frequency spike activity (data not reported here). The choice of channels was consistent across the different recording sessions for each animal. We preferred to use only LFP data because it fits better the inner characteristics of the partial directed coherence (PDC) frequency-based methodology (see details in Partial Directed Coherence), and because LFPs reflect better the “average” neuronal activity in larger volumes of tissue which is the aim of the current study.

Figure 1. Electrode construction and location of recordings. (A) Architecture of a microelectrode array used to record local field potentials (LFPs). (B) Coronal diagram illustrating the location of the LFPs recording sites (dark squares) in ventro-posterior-lateral thalamic nuclei (VPL) (left side) and in primary somatosensory cortex (SI) (right side). Numbers represent the rostro-caudal distance (in millimeters) relative to bregma.
The arrays were oriented rostro-caudally and mounted in the holder of a hydraulic micropositioner (FHC Inc, Bowdoin, ME, USA) and subsequently slowly driven (50 μm/min) into the right primary somatosensory cortex (SI) and right ventro-posterior-lateral thalamic nucleus (VPL) after dura mater removal. The following coordinates in millimeters relative to bregma (Paxinos and Watson, 1998) were used to place the arrays: SI (−2.5 rostro-caudal, +2.5 medio-lateral, −1.6 dorso-ventral), and VPL (−3.1 rosto-caudal, +3.2 medio-lateral, −6.4 dorso-ventral). The location of the electrodes within SI and VPL was verified by mapping the neuronal responses elicited by tactile stimulation of the correspondent peripheral hindpaw digits receptive field. After the electrodes reached the correct position, the craniotomy was sealed with a layer of agar (4% in saline) and they were cemented to the skull screws by the use of dental acrylic. At the end of the surgery the animal was transferred to a recovery cage. The analgesic carprofen (5–10 mg/kg; Rimadyl, Pfizer Animal Health, Lisbon, Portugal) and the antibiotic amoxicillin (6 mg/kg; Clamoxyl, Pfizer Animal Health) were administered subcutaneously every 24-h during 2–3 days. Rats were allowed to recover for 1 week; after this week, animals were habituated to the recording chamber in five sessions of 90-min each in successive days. Behaviors were continuously recorded using a dedicated digital video-tracking system and synchronized with acquired neural data (CinePlex, Plexon Inc., Dallas, TX, USA).
Extracellular local field potentials (LFPs) – were recorded from the implanted microwire electrodes and processed by a 16-channel Multineuron Acquisition Processor system (16-MAP, Plexon Inc., Dallas, TX, USA). LFP signals recorded from the electrodes were pre-amplified (500×), band-pass filtered (0.5–400 Hz), and digitized at 500 Hz.
Spared Nerve Injury
Two animal groups were used: one group (n = 6) was recorded before and after the establishment of a peripheral nerve lesion (here afterward named as SNI-baseline and SNI-surgery sessions, respectively), while a second group (n = 6) was recorded before and after a SHAM surgery involving similar blunt dissection as the SNI-surgery but without any nerve lesion (here afterward named as SHAM-baseline and SHAM-surgery sessions, respectively). SNI and SHAM-surgery proceedings were implemented according to the published methodology (Decosterd and Woolf, 2000) in the left sciatic nerve contralateral to the hemisphere of electrodes implantation. Each recording session lasted 24-h (12/12-h in light/dark experimental conditions). The animals were placed in the recording chamber with cables connected 30-min before each 24-h session of LFPs continuous recording that were always initiated at 7 p.m. (start of dark phase). During the recording sessions the tethered animals were allowed to move freely in a 45-cm × 45-cm recording chamber with free access to food and water. Recordings were performed during two sessions in the baseline period (days-10 and -2 before surgery, pooled together as baseline recordings) and in two sessions after SHAM or SNI lesion (with recordings in day 2 and 10 after surgery. During the analysis of the experimental data it became clear that the two recordings done at 2 and 10 days after surgery (both after nerve lesion or sham surgery) did not significantly differ in any of our analysis; we have therefore used both recordings as coming from a single “post-surgery” period.
Sensory threshold for noxious stimulation was measured using von Frey filaments (Somedic, Sweden) as previously described (Chaplan et al., 1994). Von Frey testing was always performed during the light phase, 1 h before the beginning of each recording session. Testing was performed in an elevated chamber with a thin metallic mesh floor that allowed easy access to the plantar surface of the hindpaw. Filament series were run from the thinnest to the widest to detect the filament to which the animal withdraw the paw in at least 6 of 10 successive applications; we then performed another two series of 10 stimulations using the same filament (2-min intervals between sessions) and averaged the number of positive responses evoked by the three series.
StateMap
In order to identify wakefulness and sleep brain states of the rat circadian cycle, we used the method recently developed by Gervasoni, Lin, Ribeiro, and colleagues (Gervasoni et al., 2004; Lin et al., 2006). Briefly, this technique splits wakefulness and sleep states as distinct clusters into a two-dimensional state space map derived from two LFPs power spectral ratios. These ratios were heuristically established, and allowed for the best separation of each brain state based on their spectral features. Each point of the two-dimensional state space (example in Figure 2A) represents 1-s of ongoing brain activity. The density of points reflects the relative abundance of the different brain states, and the distance between two consecutive data points reflects the speed of spectral changes. Clustering was performed semi-automatically using the StateMap algorithm (Gervasoni et al., 2004). The slow-wave-sleep (SWS) cluster was always located on the upper right quadrant of the StateMap, whereas REM occupied the left quadrants, and the WK cluster occupied the lower right quadrant. The generated hypnograms (1-s bins of resolution) were used to calculate the frequency of episodes of each brain state, respective mean duration, and transitions between them (Figure 2C). The term “episode” was used to classify the occurrence of a brain state with duration in the hypnogram longer than 3 s.
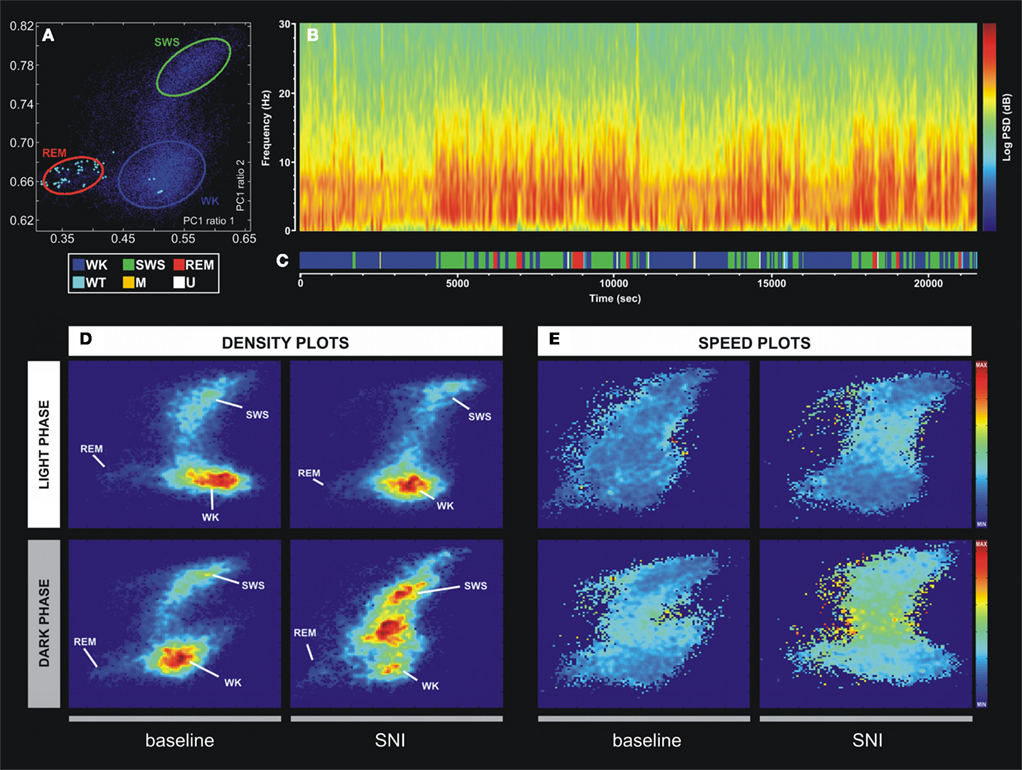
Figure 2. Example of the technique used for statistical classification of oscillatory patterns according to Principal Component Analysis of the LFP signals. (A) Two-dimension brain StateMap. Three major clusters were represented corresponding to waking state (WK), slow-wave-sleep (SWS) and rapid-eye-movement (REM) states. (B) Power spectrogram of a SI LFP channel showing the different patterns of signal power oscillations across brain state episodes transitions. (C) Brain states hypnogram obtained from two-dimensional state illustrated in panel A. Six different brain states were coded: WK, SWS, REM, whisker-twitching (WT), M (undefined movement), and U (transition states). (D) Density plots calculated from scatter plots [e.g., (A)], showing the conserved cluster topography and the relative abundance of the various brain states. Scale from dark-blue (low-density) to red (high-density). (E) Speed plots representing the average of spontaneous trajectories within the two-dimensional StateMap. Stationarity (low speed) can be observed in the three main clusters (WK, SWS, and REM), whereas a maximum speed is reached during transitions from one clusters to another. After SNI lesion the velocity between WK and SWS state episodes increased, suggesting also an increase of WK/SWS transitions during the neuropathic pain period.
Six different brain states were identified using the methodology described above. The WK state, characterized by theta (θ, 4–9 Hz) and gamma (γ, 30–55 Hz) LFPs spectral power (Steriade et al., 1993; Destexhe et al., 1999). During waking state the animals were involved in exploratory and stereotyped behaviors, such as locomotion, whisking, eating, drinking, etc. An additional transient waking state (WT) was characterized by synchronized rat whisker-twitching and corticothalamic LFPs oscillations at 7–12 Hz (Nicolelis et al., 1995; Fanselow and Nicolelis, 1999). These oscillations have been demonstrated to define a physiological state associated with normal sensory perception (Fanselow and Nicolelis, 1999; Wiest and Nicolelis, 2003). The REM was characterized by low cortical LFPs amplitude and high theta and gamma power state, and the animals were immobile with intermittent whisker and ear twitches (Vanderwolf, 1969; Steriade et al., 1993). In SWS state, the animals were immobile with eyes closed and had slow regular respiratory movements. The light SWS is characterized by sleep spindles (10–14 Hz) superimposed to delta waves (δ, 1–4 Hz), while in deep SWS the delta oscillations are more prominent (Achermann and Borbely, 1997; Destexhe et al., 1999). Furthermore, SWS state can be followed by a transient intermediate state of unstable oscillations named as U-transition state (Gottesmann, 1992; Mandile et al., 1996; Vescia et al., 1996). An additional M state was coded to include all unspecific patterns of oscillations that are exhibited by the rat. Examples of traces of the WK, SWS, and REM states are presented in Figure A2 in Appendix. In order to confirm and validate the brain states hypnogram generated by the StateMap, two different experimenters visually identified WK, SWS, and REM episodes in the video recordings using the behavioral characteristics and associated LFP spectral features as detailed above (see also Figure A1 in Appendix).
Rats spent more time in the awake state during the dark phase than during the light phase, and, conversely, the rat sleep states during the light phase are more frequent and longer than in the dark phase.
Spectral Analysis
Power spectral density and coherence
Power spectral density (PSD) of cortical and thalamic LFPs signals were calculated between 1 and 50 Hz using the Welch’s method (MATLAB function), with 512-points fast Fourier transform of non-overlapping 1-s epochs (Hanning-window). Data is shown as the percentage of total PSD within the frequency range considered (1–50 Hz). In order to determine the spectral coupling among signals from thalamocortical recorded regions, we have calculated the correlation coefficient or sometimes referred to as coherence in the signal engineering community. Coherence (Cxy) was measured applying the equation mathematically equivalent to Cxy = |Pxy|2/(PxPy) where the coherence from two signals, x and y, is equal to the average cross power spectral density (Pxy) normalized by the averaged power spectra of the two signals. Its value lies between 0 and 1, and it estimates the degree to which phases at the frequency (f ) of interest are dispersed. Cxy = 0 means that phases are dispersed, and high coherence (Cxy = 1) means phases of signals x and y are identical and the two signals are totally phase-locked at this frequency. Cross power spectral density was calculated using the default MATLAB function.
Phase–coherence
Phase–coherence (ϕxy) of simultaneously recorded thalamocortical LFPs was evaluated calculating the Hilbert transform of each LFP segment. The phase angles of each signal segment were extracted and wrapped between 0° and 360° and displayed as a rose plot histogram. The whole rose plot (360°) was divided in 60 bins of resolution (6° per bin), with each bin displaying the respective population percentage. The Rayleigh test of uniformity (P < 0.01) was used to assess the resulting phase distributions for deviations from the circular uniform distribution. The degree of phase-locking or phase–coherence was determined calculating the concentration around the preferred phase in the circular-distribution, with its value lying between 0 and 1, where ϕxy = 0 indicates that phase values at a particular frequency range are randomly distributed across the time interval, while ϕxy = 1 indicates that phase values are exactly the same across the time interval. Phase–coherence values are inversely related to the Rayleigh P-value, with ϕxy = 0 standing for uniform distribution. Circular statistics were calculated according to Fisher (1993).
Partial directed coherence
The PDC measure was used to identify and quantify the information flow interactions in the thalamocortical loop. The PDC method has been described in detail elsewhere (Sameshima and Baccalá, 1999; Baccala and Sameshima, 2001). Briefly, PDC is an alternative representation of Granger-causality involving multivariate processes to uncover direct influences in the frequency domain. The allied PDC from structure j-th to i-th at frequency λ is defined as:
where,
aij are multivariate autoregressive coefficients and p is the model order. Nullity of PDC [πij(λ) = 0] can be interpreted as absence of effective connectivity from the j-th structure to the i-th structure at frequency λ and high PDC, near one, indicates strong connectivity between the structures. This can be interpreted as existence of information flow from brain area j to i.
Statistical Analysis
Neural activity data was processed and validated by offline analysis using NeuroExplorer 4 (NEX, Plexon Inc., Dallas, TX, USA) and exported to MatLab R14 Version 2008a (MathWorks, Natick, MA, USA) for complementary analysis. The PSD, Cxy, ϕxy, and PDC parameters were calculated using the same 40 LFPs signal segments of 10-s per recording session for each of the three more frequent behaviors (WK, SWS, and REM). These signal segments were randomly selected based on brain states hypnogram generated by the two-dimensional StateMap, and were verified and validated by visual inspection of behavior states in the video recordings and LFP spectral features.
In all analyses the distribution of the data was initially checked for potential deviations from normality assumptions, in order to choose the appropriate statistical test to apply. Non-parametric statistics were used when the Kolmogorov–Smirnov test (with Dallal–Wilkinson–Lilliefor corrected P-value) revealed deviations from the normal distribution (P > 0.05, Kolmogorov–Smirnov test). In this case, we performed non-parametric Wilcoxon signed-rank test for paired samples, or non-parametric Mann–Whitney test for unpaired samples. To compare multiple groups, we relied on the Kruskal–Wallis analysis of ranks (with post hoc Dunn’s test), which is a non-parametric version of the classical one-way analysis of variance (ANOVA), and an extension of the Wilcoxon rank sum test to more than two groups. The level of significance was set as 5% (or P < 0.05).
Under normality assumptions, we used ANOVA to compare multiple groups. Statistical comparisons between frequency spectra were performed by a two-way ANOVA (groups × frequency bands) with post hoc Bonferroni test. In this case, and to facilitate interpretation of data, we performed separate comparisons for paired experimental groups [two-way ANOVA-repeated measures (RM); SHAM-baseline vs. SHAM-surgery and SNI-baseline vs. SNI-surgery] and for unpaired groups (two-way ANOVA non-matching; SHAM-baseline vs. SNI-baseline and SHAM-surgery vs. SNI-surgery). Thus, we are testing four separate comparisons on our dataset. We therefore need to take care in selecting our statistical significance level to account for the fact, by chance alone, we may encounter a favorable significance level simply because of the number of comparisons that we are conducting. In this case, we apply the Bonferroni correction. The Bonferroni correction states that if we test n comparisons on a set of data, then we should adjust our statistical significance level by a factor of 1/n. Choosing a standard significance level of P < 0.05 for a single comparison, our Bonferroni-corrected significance level in this work is P < 0.05/4, or P < 0.0125.
The results were expressed as mean ± SEM.
Histology
At the end of all experiments, the rats were deeply anesthetized with ketamine/xylazine mixture and the recording site was marked by injecting DC current (10–20 μA for 10–20 s) through one microwire per matrix group, marking the area below the electrode tips. Afterward animals were perfused through the heart with 0.01 M phosphate buffer (pH = 7.2) in 0.9% saline solution followed by 4% paraformaldehyde. Brains were removed and post-fixed in 4% paraformaldehyde during 4 h and stored in 30% sucrose before freeze-sectioning into 60 μm sections, and stained for site identification under the microscope. This technique, in conjunction with careful notation of electrodes movements during implantation, allowed for localization of all recording sites (Figure 1B).
Results
Mechanical Stimulation Thresholds
All SNI animals developed mechanical allodynia as indicated by the significant decrease in the mechanical withdrawal stimulus threshold in the hindpaw ipsilateral to the lesion, but not in the contralateral paw or in the SHAM-operated control group. In the SHAM group, no statistical difference was noted between the control period (SHAM-baseline) and after the surgery (SHAM-surgery; 16.6 ± 0.7 to 17.3 ± 0.8 g; NS; Wilcoxon test). In the SNI group, relative to baseline, a large decrease (83.9%) was observed in the threshold required to induce a paw response to stimulation with von Frey filaments (17.4 ± 1.2 to 2.8 ± 1.2 g; P < 0.05).
Brain States and Spectral Characteristics
In order to quantitatively distinguish stable oscillatory episodes and brain states, we have used the StateMap algorithm (Gervasoni et al., 2004; Lin et al., 2006) that maps wakefulness and sleep states as distinct clusters in a two-dimensional state space derived from two LFP spectral ratios (Figure 2A). This technique presents the advantage of clearly distinguishing brain states that shared common spectral features, such as the theta oscillations observed during WK and REM episodes (Figure 2B). The three spectral clusters were clearly visible in two-dimensional state maps, corresponding to WK, SWS, and REM 1-s segments (hypnogram of Figure 2C).
All LFPs data segments with amplitude saturation were discarded from the working dataset (5.86 ± 0.91% of the total data per rat). The inspection of intracranial LFP activity confirmed that large-power oscillations were present during all brain states. The spontaneous spectral trajectories (distance between two consecutive points in the state map per unit of time, 1-s) that govern transitions between brain states were characterized by specific duration patterns in the state maps. The most frequent transitions occurred between WK → SWS → WK and WK → SWS → REM → WK episodes (Figure 2C). The speed of the spontaneous spectral trajectories on the state map can identify the regions in which little spectral variation exists (light blue area in Figure 2E) that coincide with the accumulation of points of the states identified by the algorithm [delimitation on blue (WK), green (SWS), and red (REM) in Figure 2A and density plot of Figure 2D], and the regions with fast spectral oscillations (yellow area in Figure 2E) that correspond to segments of transitions between different brain states (e.g., transitions between WK and SWS state episodes). After the nerve lesion (SNI-surgery vs. SNI-baseline) the spontaneous spectral trajectories velocity showed an increase in the WK → SWS → WK transitions during the dark phase (Figure 2E), whereas in the SHAM animals no differences were observed (data not presented in the figure). This increase in velocity can be associated with the increase in the number of WK–SWS transitions observed after nerve injury.
Sleep–Wake Characteristics
Brain state episodes
As shown in Table 1 (panel above), there were statistical significant differences between experimental groups in the number of brain state episodes (Kruskal–Wallis test; WK-light phase: K–W = 15.01, P = 0.0018, and WK-dark phase: K–W = 9.64, P = 0.0219; SWS-dark phase: K–W = 9.94, P = 0.0191; U-light phase: K–W = 10.38, P = 0.0156, and U-dark phase: K–W = 17.97, P = 0.0004). The post hoc comparison of the SNI-baseline group to the SNI-surgery showed a significant increase in the number of WK state episodes during the light and dark phases (291.1 ± 19.7 to 383.7 ± 22.1, and 310.3 ± 13.3 to 491.9 ± 31.7, respectively; Dunn’s test, P < 0.05), while for SWS it was significant only during the dark phase (241.8 ± 26.2 to 376.5 ± 53.0; P < 0.05). In the case of U-transition state episodes, they also revealed an increase during both recording phases (258.2 ± 24.9 to 398.7 ± 16.9, and 318.4 ± 22.5 to 502.9 ± 23.3, respectively; P < 0.05). The post hoc comparison between SHAM-surgery/SNI-surgery groups revealed that the number of WK episodes in SNI-surgery was superior to SHAM-surgery during both light (383.7 ± 22.1 vs. 303.7 ± 29.9; Dunn’s test, P < 0.05) and dark phases (491.9 ± 31.7 vs. 312.9 ± 20.9; P < 0.05), while the number of SWS episodes was superior in SNI group only during the dark phase (376.5 ± 28.1 vs. 254.1 ± 23.4; P < 0.05). A similar result was obtained for U-transition episodes during both phases (398.7 ± 16.9 vs. 286.3 ± 26.9, and 502.9 ± 23.2 vs. 312.3 ± 40.2, respectively; P < 0.05). In addition, post hoc analysis revealed no significant differences between SHAM-baseline/SHAM-surgery, and SHAM-baseline/SNI-baseline sessions.
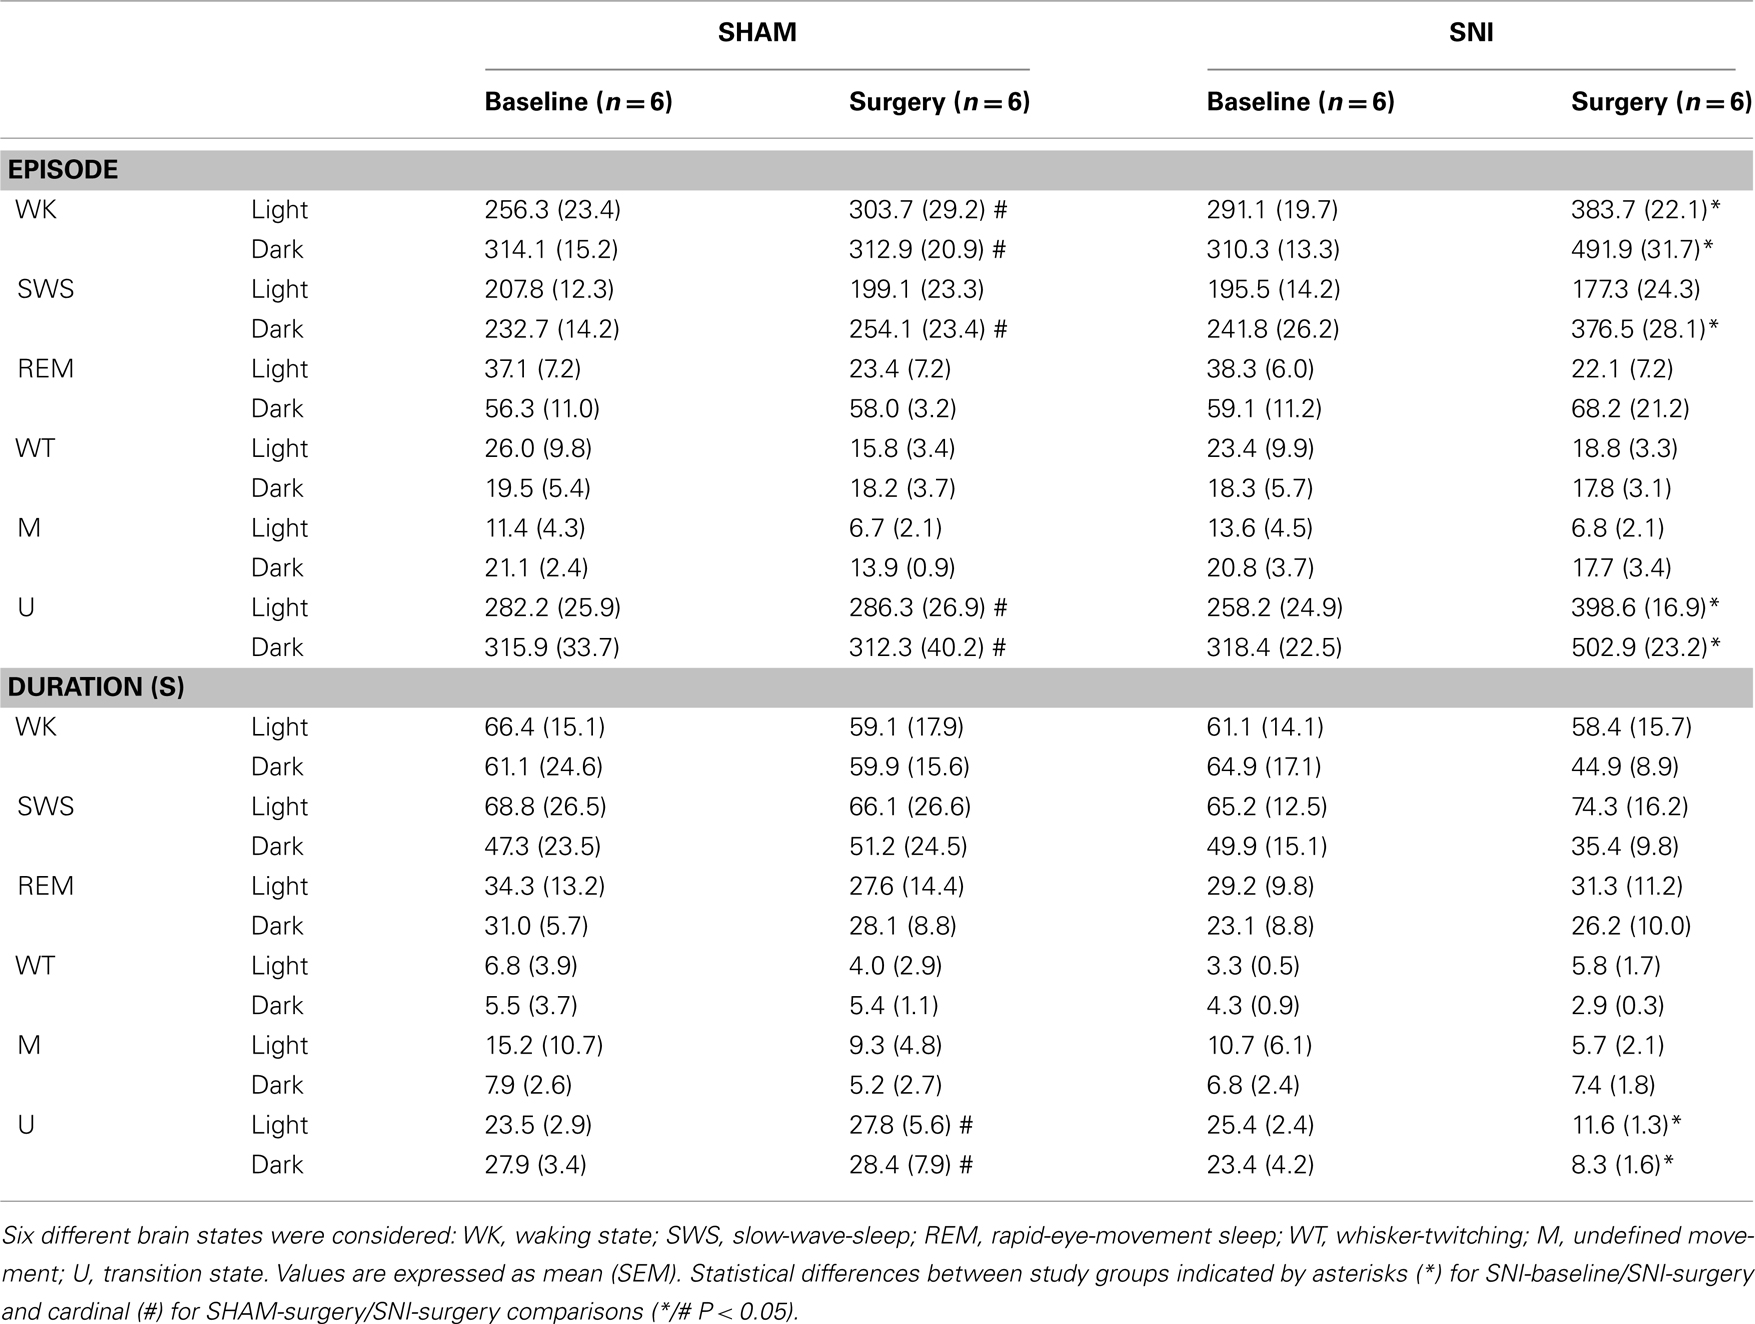
Table 1. The number and mean duration of episodes from the different sleep states to wakefulness are shown for the light and dark phases (expressed as mean value per period of 12-h).
In terms of the mean duration of each state episode (Table 1, panel below), there were statistical differences between experimental groups but only for the U-transition state (Kruskal–Wallis test; light phase: K–W = 18.98, P = 0.0003, and dark phase: K–W = 15.92, P = 0.0012). Post hoc analysis revealed a significant decrease of the U-transition state episodes mean duration for SNI-baseline/SNI-surgery (light phase: 25.4 ± 2.4 to 11.6 ± 1.3 s; and dark phase: 23.4 ± 4.2 to 8.3 ± 1.6; Dunn’s test, P < 0.05), and SHAM-surgery/SNI-surgery comparisons (light phase: 27.8 ± 5.6 to 11.6 ± 1.3 s; and dark phase: 28.4 ± 7.9 to 8.3 ± 1.6, P < 0.05). In addition, post hoc analysis revealed no significant differences between SHAM-baseline/SHAM-surgery, or SHAM-baseline/SNI-baseline sessions.
Brain state transitions
After the SNI nerve lesion, all rats showed an increase in the number of state transitions between the more representative brain states (WK, SWS, and REM), indicating an increase of circadian pattern fragmentation in these animals (Table 2). ANOVA revealed significant differences between all experimental groups for WK–SWS transitions (Kruskal–Wallis test; light phase: K–W = 9.98, P = 0.0188, and dark phase: K–W = 9.46, P = 0.0237), SWS–WK (dark phase: K–W = 13.46, P = 0.0037), SWS–REM (light phase: K–W = 9.99, P = 0.0187), REM–WK (light phase: K–W = 9.21, P = 0.0266), WK–U (light phase: K–W = 12.13, P = 0.0070), U–WK (light phase: K–W = 10.85, P = 0.0125, and dark phase: K–W = 11.57, P = 0.0090), and REM–U (light phase: K–W = 12.19, P = 0.0068).
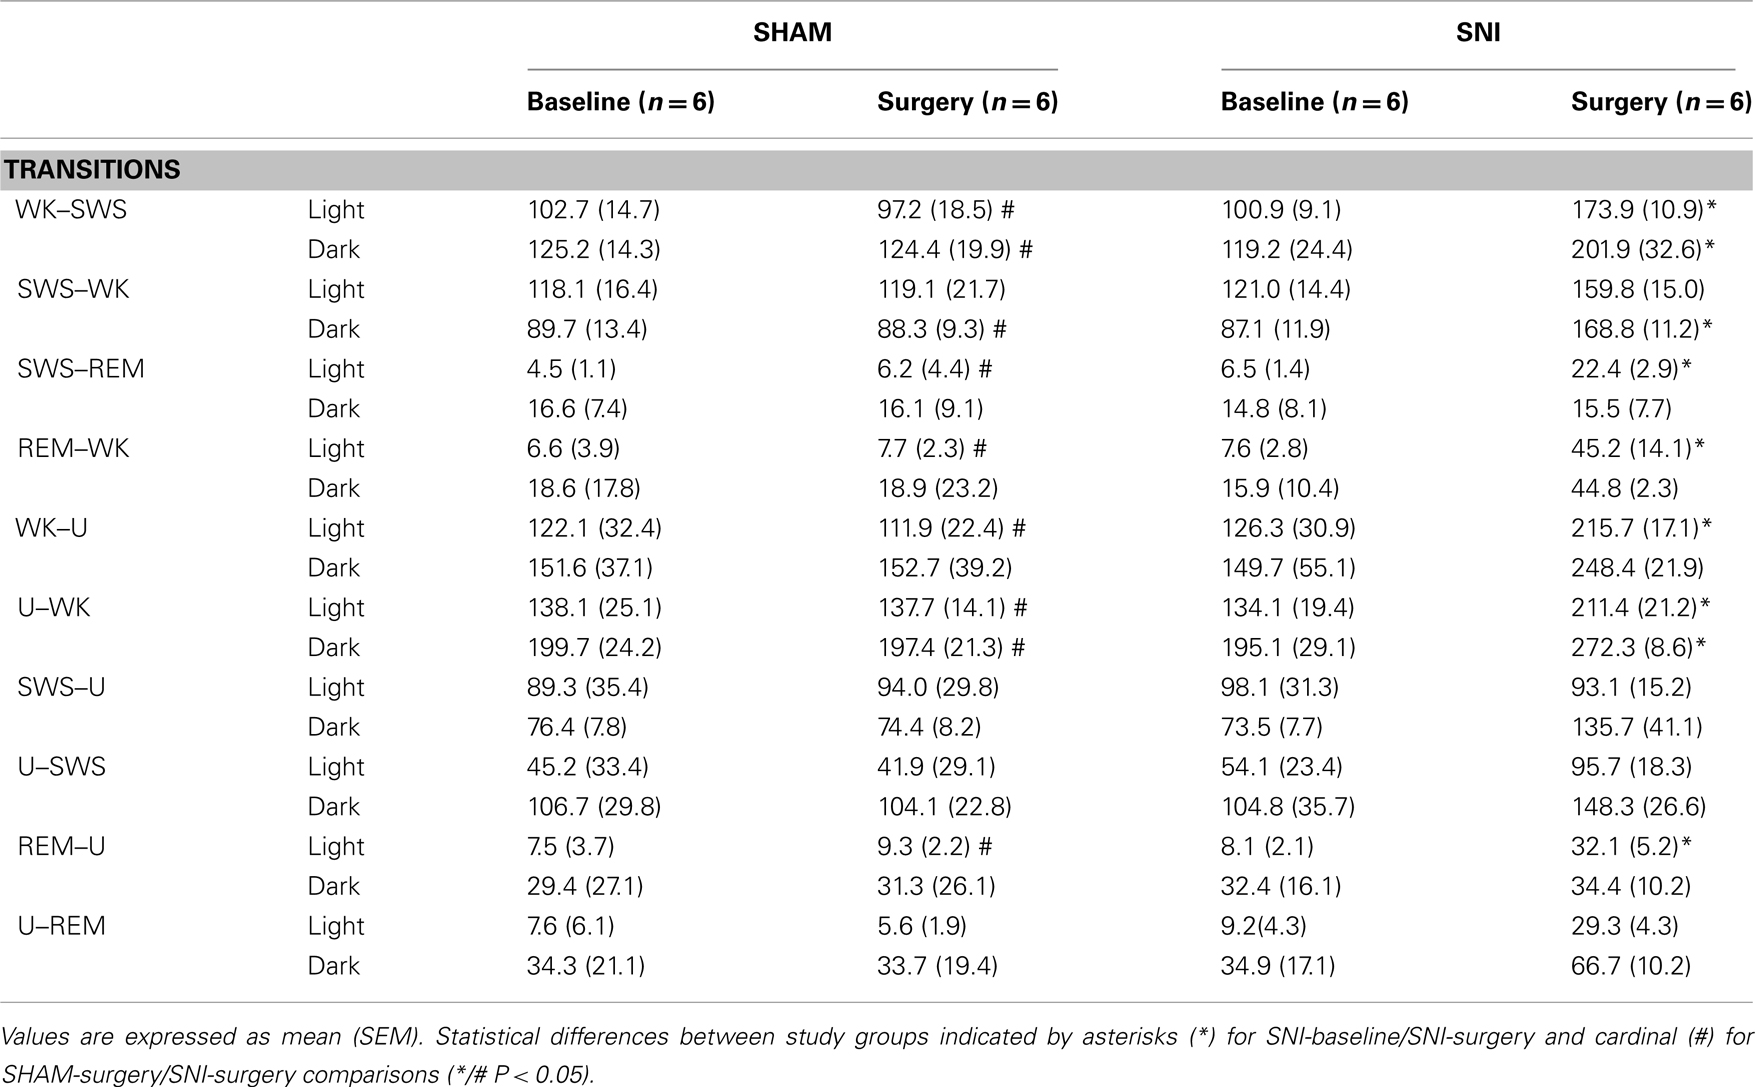
Table 2. The number of transitions from the different sleep states to wakefulness are shown for the light and dark phases (expressed as mean value per period of 12-h).
When compared SNI-baseline group to SNI-surgery (Table 2, significance indicated by asterisks symbols), post hoc analysis revealed an increase of the WK-to-SWS transitions during the light and dark phases (100.9 ± 9.1 to 173.9 ± 10.9, and 119.2 ± 24.4 to 201.9 ± 32.6, respectively; Dunn’s test, P < 0.05), and SWS-to-WK transitions but only during the dark phase (87.1 ± 11.9 to 168.9 ± 11.2; P < 0.05). Other low-frequency state transitions such as SWS-to-REM and REM-to-WK increased only during the light phase (6.5 ± 1.4 to 22.4 ± 2.9, and 7.6± to 45.2 ± 14.1, respectively; P < 0.05). In addition, all SNI rats showed a significant increase in the transitions mediated by U-state and WK states. For example, the WK-to-U transitions increased during the light phase (126.3 ± 30.9 to 215.7 ± 17.1; P < 0.05), while U-to-WK increased during both phases (134.1 ± 19.4 vs. 211.4 ± 21.2, and 195.1 ± 29.1 vs. 272.3 ± 8.6, respectively; P < 0.05), and the REM-to-U transitions increased during the light phase of the recordings (8.1 ± 2.1 vs. 32.1 ± 5.2; P < 0.05).
Post hoc statistical analysis of the SNI-surgery/SHAM-surgery groups showed similar differences to those observed when comparing SNI-surgery/SNI-baseline (Table 2, significance indicated by cardinal symbols). In SNI-surgery group, the number of WK-to-SWS transitions was superior to SHAM-surgery during the light (173.9 ± 10.9 vs. 97.2 ± 18.5; Dunn’s test, P < 0.05) and dark phases (201.9 ± 32.6 vs. 124.4 ± 19.9; P < 0.05), whereas for SWS-to-WK it was significant only during the dark phase (168.9 ± 11.2 vs. 88.3 ± 9.3; P < 0.05). Other low-frequency transitions such as SWS-to-REM and REM-to-WK increased only during light phase (22.4 ± 2.9 vs. 6.2 ± 4.4, and 45.2 ± 14.1 vs. 7.7 ± 2.3, respectively; P < 0.05). Transitions mediated by U-state also increased in SNI-surgery group: WK-to-U transitions during the light phase (215.21 ± 17.1 vs. 111.9 ± 22.4; P < 0.05); U-to-WK transitions during the light (211.4 ± 21.2 vs. 137.7 ± 14.1; P < 0.05) and dark phases (272.3 ± 8.6 vs. 197.4 ± 21.3; P < 0.05); and REM-to-U transitions during the light phase (32.1 ± 5.2 vs. 9.3 ± 2.2; P < 0.05).
In addition, post hoc analysis revealed no significant differences between SHAM-baseline/SHAM-surgery, or SHAM-baseline/SNI-baseline sessions across the considered state transitions.
Thalamocortical Power Spectral Density and Coherence
Power spectral density analysis was employed to visualize the power spectra of LFPs of WK, SWS, and REM brain states across the studied frequency range (1–50 Hz). A qualitative comparison of PSD measurements between the thalamocortical LFPs is shown in Figure 3A–D, comparing both SHAM-baseline and SNI-baseline with SHAM-surgery and SNI-surgery. The inspection of PSD confirmed that characteristic power oscillations were as expected, with a prominent high-power in theta frequency band (4–9 Hz) in WK and REM episodes, and a high-power in delta band (1–4 Hz) observed during SWS episodes.
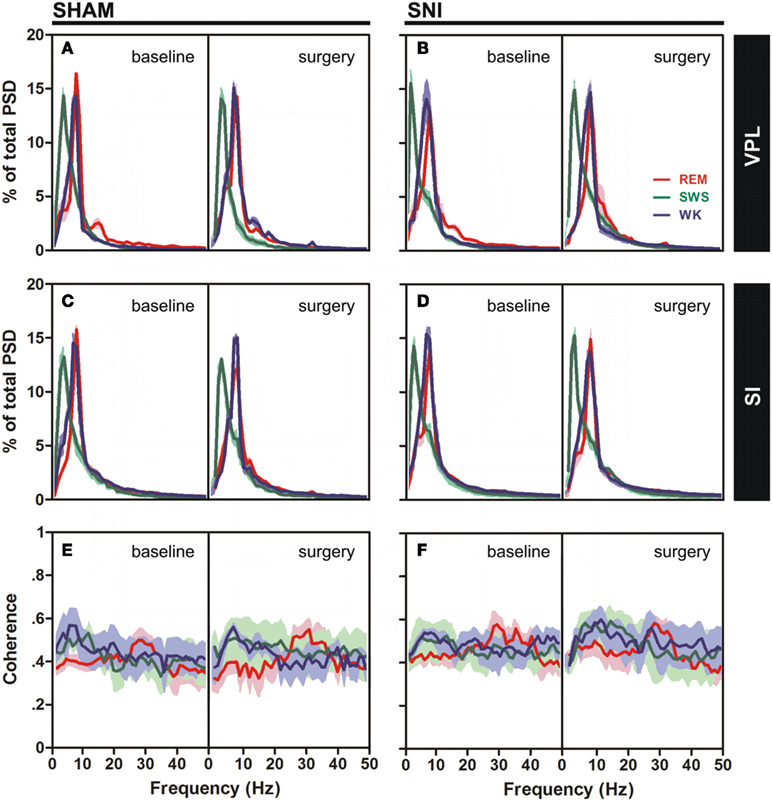
Figure 3. Spectral analysis of SI–VPL LFPs channels during WK (blue), SWS (green), and REM (red) states. Data were presented comparing the baseline (left side of each panel) and respective SHAM or SNI lesion (right side). Values are expressed for all animals as mean (±SEM). (A–D) Power spectral density (PSD) of LFPs normalized by the percentage of total power within the frequency range analyzed (1–50 Hz) for VPL (A,B) and SI (C,D) channels. PSD showed that spectral power patterns were conserved across the experimental groups. (E,F) Coherence between VPL and SI LFPs showed similar levels of coherence activity across all experimental groups.
The qualitative comparison of the coherence measurements between the thalamocortical LFPs clearly showed similar values of coherence activity across selected brain states (Figures 3E,F). Note however that REM revealed an increase of coherence activity across gamma frequency band (30–50 Hz) that was not observed in WK or SWS episodes. We present additional data (see Figure A3 in Appendix) of average PSD and coherence per frequency band. ANOVA (two-way ANOVA) revealed no differences in these measurements between experimental groups.
Thalamocortical Phase–Coherence
As shown in Figure 4A, there were statistical significant differences between experimental groups in SI–VPL phase–coherence (1–50 Hz frequency range) for WK and SWS brain states (Kruskal–Wallis test; K–W = 13.28, P = 0.0041; and K–W = 12.08, P = 0.0071; respectively), and no differences for REM state (K–W = 3.47, P = 0.3243). When compared SNI-baseline group to SNI-surgery, post hoc analysis revealed a significant enhancement of SI–VPL phase–coherence after nerve lesion (WK: from 0.52 ± 0.02 to 0.65 ± 0.04; SWS: from 0.61 ± 0.02 to 0.69 ± 0.03; Dunn’s test, P < 0.05), and also the comparison of SHAM-surgery/SNI-surgery groups (WK: from 0.55 ± 0.05 to 0.65 ± 0.04; SWS: from 0.58 ± 0.04 to 0.69 ± 0.03; P < 0.05; Figure 4A). In addition, post hoc analysis revealed no significant differences between SHAM-baseline/SHAM-surgery groups for WK, SWS, and REM brain states. As shown in Figure 4B, the rose plot histograms present a narrow range of phase–coherence in all three brain states, indicating a high degree of phase synchronization of SI–VPL LFPs activity; this suggests a broader coordination of thalamocortical activities after nerve lesion. Indeed, all phase distributions are significantly non-uniform (P < 0.01, Rayleigh test of uniformity).
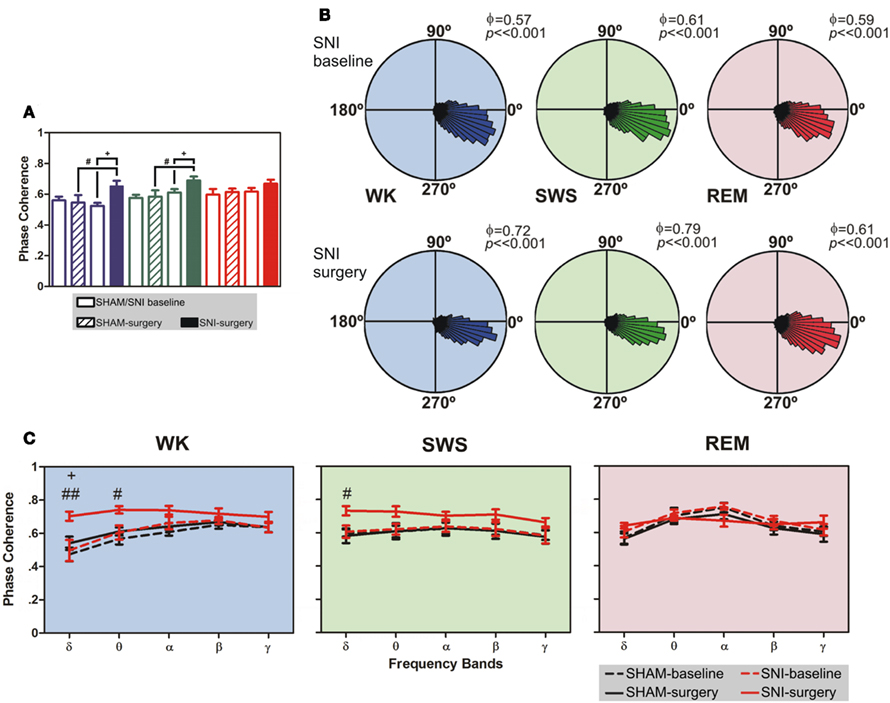
Figure 4. Phase-locking of cortical and thalamic local field potentials. (A) Comparison of mean phase–coherence of SI–VPL LFPs segments recorded during WK, SWS, and REM states. Data was calculated for a 1- to 50-Hz frequency range. A significant increase of phase–coherence was observed for WK and SWS episodes after nerve lesion. (B) Examples of LFPs phase distributions during WK, SWS, and REM episodes for one rat submitted to the nerve lesion protocol. The numbers in the upper right corner of each plot shows the value of the mean phase–coherence. All circular-concentration distributions are significantly non-uniform (Rayleigh test, P < 0.01) indicating a high degree of thalamocortical phase synchronization. (C) Average phase–coherence across frequency bands analyzed during the baseline and respective SHAM or SNI lesion (surgery). Frequency bands: delta (δ, 1–4 Hz), theta (θ, 4–9 Hz), alpha (α, 9–15 Hz), beta (β, 15–30 Hz), and slow-gamma (γ, 30–50 Hz). Comparison of SNI-surgery in respect to SNI-baseline (plus symbols), and to SHAM-surgery (cardinal symbols). Values are expressed as mean ± SEM. +/# P < 0.0125, ++/## P < 0.0025, +++/### P < 0.0002 (Bonferroni test with corrected P-value).
The analyses of mean phase–coherence across frequency bands are illustrated in Figure 4C. In the case of WK state, the comparison of SHAM-baseline/SHAM-surgery groups revealed no significant differences across experimental groups [two-way ANOVA-RM: F(1,25) = 1.73, P = 0.2182] and interaction [groups × frequency bands; F(4,25) = 0.48, P = 0.7479], and a significant effect across frequency bands [F(4,25) = 10.74, P < 0.0001]. In addition, the comparison of SHAM-baseline/SNI-baseline groups revealed also no significant differences across experimental groups [two-way ANOVA: F(1,50) = 1.56, P = 0.2173] and interaction [F(4,50) = 0.16, P = 0.9567], and a significant effect across frequency bands [F(4,50) = 7.65, P < 0.0001]. On the other hand, when comparing SNI-baseline/SNI-surgery groups significant effects were encountered across groups [two-way ANOVA-RM: F(1,25) = 19.30, P = 0.0002] and frequency bands [F(4,25) = 3.15, P = 0.0314], and no significant interaction effect between these two factors [F(4,25) = 1.55, P = 0.2180]. Post hoc analysis revealed a significant increase of the mean phase–coherence across delta frequency band in the SNI-surgery group (P < 0.0125, Bonferroni test with corrected P-value). In the case of the comparison of SHAM-surgery/SNI-surgery groups, ANOVA revealed significant differences across experimental groups [two-way ANOVA: F(1,50) = 32.49, P < 0.0001], and no differences across frequency bands [F(4,50) = 2.13, P = 0.0914] and interaction effect [F(4,50) = 1.40, P = 0.2475]. Post hoc analysis revealed a significant increase of mean phase–coherence across delta (P < 0.0025, Bonferroni test with corrected P-value) and theta (P < 0.0125) frequency bands after nerve lesion (Figure 4C). In the case of SWS state, the comparison of SHAM-baseline/SHAM-surgery groups revealed no significant differences across experimental groups [two-way ANOVA-RM: F(1,25) = 0.04, P = 0.8346], frequency bands [F(4,25) = 1.25, P = 0.3191], as well for the interaction effect [F(4,25) = 0.01, P = 0.9996]. A similar result were obtained for the comparison of SHAM-baseline/SNI-baseline groups [two-way ANOVA: groups F(1,50) = 0.08, P = 0.7822, frequency bands F(4,50) = 0.52, P = 0.7172, and interaction F(4,50) = 0.02, P = 0.9992]. On the other hand, when comparing SNI-baseline/SNI-surgery groups significant differences were encountered across groups [two-way ANOVA-RM: F(1,25) = 54.79, P < 0.0001], and no differences across frequency bands [F(4,25) = 0.48, P = 0.7485] and interaction effect [F(4,25) = 0.71, P = 0.5902]. In the case of the comparison of SHAM-surgery/SNI-surgery groups, ANOVA revealed significant differences across experimental groups [two-way ANOVA: F(1,50) = 21.97, P < 0.0001], and no differences across frequency bands [F(4,50) = 0.58, P = 0.6803] and interaction effect [F(4,50) = 0.34, P = 0.8475]. Post hoc analysis revealed a significant increase of mean phase–coherence across delta frequency band after nerve lesion (P < 0.0125, Bonferroni test with corrected P-value; Figure 4C).
In the case of REM state, the comparison of SHAM-baseline/ SHAM-surgery groups, SHAM-baseline/SNI-baseline, and SHAM-surgery/SNI-surgery revealed no significant differences across experimental groups [two-way ANOVA-RM: F(1,25) = 0.64, P = 0.4323; and two-way ANOVA: F(1,50) = 1.04, P = 0.3124; F(1,50) = 1.97, P = 0.1664; respectively] and interaction effect [groups × frequency bands, two-way ANOVA-RM: F(4,25) = 0.05, P = 0.9952; and two-way ANOVA: F(4,50) = 0.08, P = 0.9884; F(4,50) = 1.16, P = 0.3378; respectively], and a significant effect across frequency bands [two-way ANOVA-RM: F(4,25) = 9.51, P < 0.0001; and two-way ANOVA: F(4,50) = 9.40, P < 0.0001; F(4,50) = 2.85, P = 0.0330; respectively]. In addition, when comparing SNI-baseline/SNI-surgery groups no statistical differences were encountered across experimental groups [two-way ANOVA-RM: F(1,25) = 1.13, P = 0.2977], frequency bands [F(4,25) = 2.17, P = 0.1013], as well for the interaction effect [F(4,25) = 1.15, P = 0.3024].
Thalamocortical Partial Directed Coherence
The changes of thalamocortical information flow in SHAM and SNI animals before and after surgery were determined by PDC analysis. Figure 5A shows the averaged PDC between SI cortex and VPL thalamic nuclei during WK, SWS, and REM states selected using the two-dimensional cluster technique described above. The qualitative comparison of the data suggests that, in the SNI-surgery group, the amount of information flow from VPL-to-SI and from SI-to-VPL decreased in both directions indicating that less information was transmitted in the thalamocortical loop after peripheral sciatic nerve injury. In addition, the decrease in the descending direction (from cortex to thalamus) was smaller when compared to the ascending direction (from thalamus to cortex).
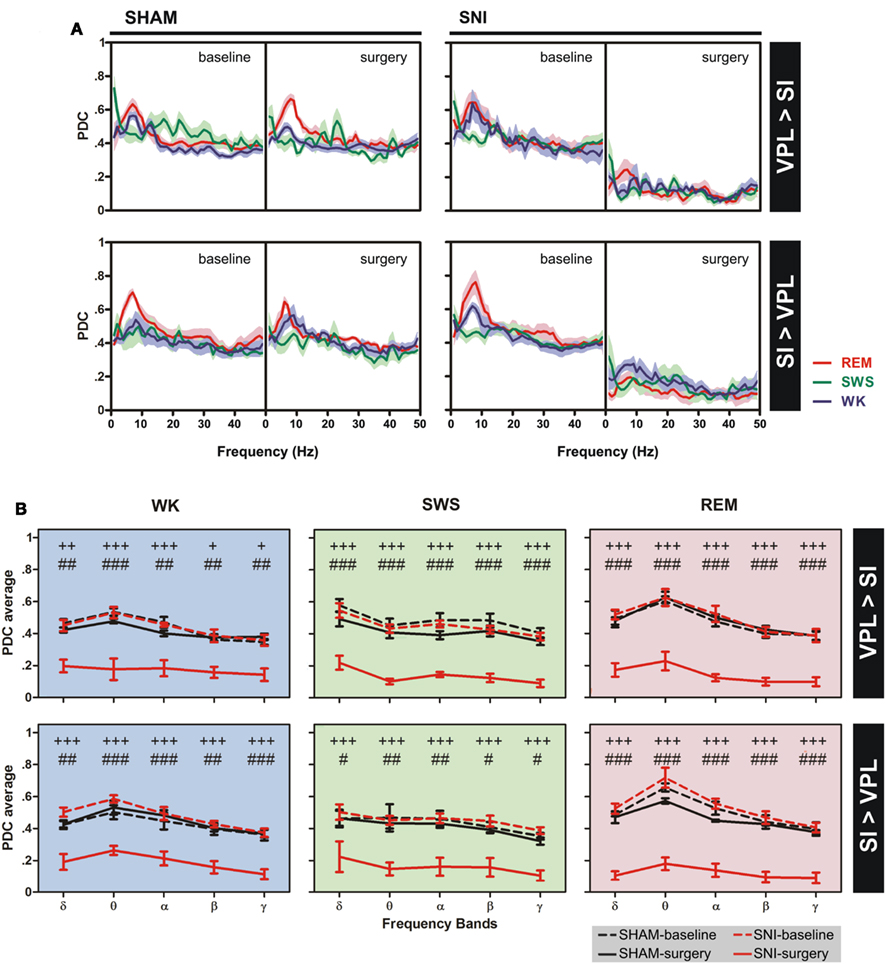
Figure 5. Information flow between the two recorded regions were determined by partial directed coherence (PDC) analysis during WK (blue), SWS (green), and REM (red) states. (A) The amount of information flow in ascending (VPL-to-SI) and descending (SI-to-VPL) directions did not show significant differences for SHAM-lesion animals, while decreased significantly for SNI group after peripheral nerve lesion, indicating that less information was processed in the thalamocortical circuit after lesion. (B) The averaged PDC across frequency bands revealed a significant decrease of information flow for both directions at all frequency bands. Frequency bands: delta (δ, 1–4 Hz), theta (θ, 4–9 Hz), alpha (α, 9–15 Hz), beta (β, 15–30 Hz), and slow-gamma (γ, 30–50 Hz). Comparison of SNI-surgery groups in respect to SNI-baseline (plus symbols), and to SHAM-surgery (cardinal symbols). Values are expressed as mean ± SEM. +/# P < 0.0125, ++/## P < 0.0025, +++/### P < 0.0002 (Bonferroni test with corrected P-value).
In order to detail the thalamocortical information flow across frequency bands, we calculated the averaged PDC per range of frequencies (Figure 5B). ANOVA was performed to measure the differences in the averaged PDC across experimental groups. In the case of the thalamocortical ascending direction (VPL-to-SI), the comparison of SHAM-baseline/SHAM-surgery groups, and SHAM-baseline/SNI-baseline revealed no significant differences across experimental groups [two-way ANOVA-RM: WK F(1,25) = 2.65, P = 0.0746; SWS F(1,25) = 2.67, P = 0.0691; REM F(1,25) = 0.73, P = 0.4006; and two-way ANOVA: WK F(1,50) = 0.01, P = 0.9706; SWS F(1,50) = 1.94, P = 0.1703; REM F(1,50) = 0.79, P = 0.3789; respectively] and interaction effect [groups × frequency bands; two-way ANOVA-RM: WK F(4,25) = 2.07, P = 0.3442; SWS F(4,25) = 0.50, P = 0.7290; REM F(4,25) = 0.36, P = 0.8356; and two-way ANOVA: WK F(4,50) = 0.17, P = 0.9526; SWS F(4,50) = 0.10, P = 0.9817; REM F(4,50) = 0.11, P = 0.9778; respectively], and as expected a significant effect across frequency bands [two-way ANOVA-RM: WK F(4,25) = 11.87, P < 0.0001; SWS F(4,25) = 24.66, P < 0.0001; REM F(4,25) = 10.85, P < 0.0001; and two-way ANOVA: WK F(4,50) = 12.09, P < 0.0001; SWS F(4,50) = 6.07, P = 0.0005; REM F(4,50) = 11.06, P < 0.0001; respectively]. On the other hand, when comparing SNI-baseline/SNI-surgery groups significant differences were encountered across experimental groups [two-way ANOVA-RM; WK F(1,25) = 85.33, P < 0.0001; SWS F(1,25) = 725.00, P < 0.0001; REM F(1,25) = 362.60, P < 0.0001], frequency bands [WK F(4,25) = 8.79, P < 0.0001; SWS F(4,25) = 4.78, P = 0.0053; REM F(4,25) = 4.72, P = 0.0056], and no interaction effect between these two factors [WK F(4,25) = 0.73, P = 0.5787; SWS F(4,25) = 0.39, P = 0.8168; REM F(4,25) = 1.48, P = 0.2378]. Post hoc analysis revealed a significant decrease of PDC activity across all frequency bands after nerve lesion [WK: delta (P < 0.0025), theta and alpha (P < 0.0002), beta and gamma (P < 0.0125); SWS and REM: all bands (P < 0.0002); Bonferroni test with corrected P-value; Figure 5B]. The comparison of SHAM-surgery/SNI-surgery groups revealed significant differences across experimental groups [two-way ANOVA; WK F(1,50) = 110.70, P < 0.0001; SWS F(1,50) = 202.30, P < 0.0001; REM F(1,50) = 273.50, P < 0.0001] and frequency bands but only for SWS and REM state [F(4,50) = 5.17, P = 0.0015; F(1,50) = 9.90, P < 0.0001; respectively], and no interaction effect between these two factors. Post hoc analysis revealed a significant decrease of PDC activity across all frequency bands after nerve lesion [WK: theta (P < 0.0002), delta, alpha, beta, and gamma (P < 0.0025); SWS and REM: all bands (P < 0.0002); Bonferroni test with corrected P-value; Figure 5B].
In the case of the thalamocortical descending direction (SI-to-VPL), the comparison of SHAM-baseline/SHAM-surgery groups, and SHAM-baseline/SNI-baseline revealed no significant differences across experimental groups [two-way ANOVA-RM: WK F(1,25) = 1.12, P = 0.3006; SWS F(1,25) = 0.76, P = 0.0620; REM F(1,25) = 1.93, P = 0.1704; and two-way ANOVA: WK F(1,50) = 2.20, P = 0.0701; SWS F(1,50) = 0.51, P = 0.4780; REM F(1,50) = 1.88, P = 0.1767; respectively] and interaction effect [two-way ANOVA-RM: WK F(4,25) = 0.21, P = 0.9319; SWS F(4,25) = 0.07, P = 0.9912; REM F(4,25) = 1.03, P = 0.4116; and two-way ANOVA: WK F(4,50) = 0.39, P = 0.8133; SWS F(4,50) = 0.16, P = 0.9559; REM F(4,50) = 0.12, P = 0.9731; respectively], and a significant effect across frequency bands but only for WK and REM states [two-way ANOVA-RM: WK F(4,25) = 3.54, P = 0.0203; REM F(4,25) = 7.20, P < 0.0001; and two-way ANOVA: WK F(4,50) = 7.17, P = 0.0001; REM F(4,50) = 16.36, P < 0.0001; respectively]. On the other hand, when comparing SNI-baseline/SNI-surgery groups significant differences were encountered across experimental groups [two-way ANOVA-RM; WK F(1,25) = 257.20, P < 0.0001; SWS F(1,25) = 158.90, P < 0.0001; REM F(1,25) = 304.10, P < 0.0001] and frequency bands but only for WK and REM state [F(4,25) = 5.98, P = 0.0016, and F(4,25) = 7.54, P < 0.0001, respectively], and no interaction effect between these two factors. Post hoc analysis revealed a significant decrease of PDC activity across all frequency bands after nerve lesion [WK, SWS, and REM: all bands (P < 0.0002); Bonferroni test with corrected P-value; Figure 5B]. In addition, the comparison of SHAM-surgery/SNI-surgery groups revealed significant differences across experimental groups [two-way ANOVA; WK F(1,50) = 133.60, P < 0.0001; SWS F(1,50) = 66.76, P < 0.0001; REM F(1,50) = 340.90, P < 0.0001] and frequency bands for WK and REM states [F(4,50) = 6.01, P = 0.0005, and F(4,50) = 6.79, P = 0.0002, respectively], and no interaction effect. Post hoc analysis revealed a significant decrease of PDC activity across all frequency bands after nerve lesion [WK: delta and beta (P < 0.0025), theta, alpha, and gamma (P < 0.0002); SWS: delta, beta, and gamma (P < 0.0125), theta and alpha (P < 0.0025); REM: all bands (P < 0.0002); Bonferroni test with corrected P-value; Figure 5B].
Discussion
In this study we report how the induction of chronic neuropathic pain affects the circadian patterns of thalamocortical oscillatory activity and the bidirectional flow of information between the cortical and thalamic somatosensory areas; for this we contrasted before- and after-pain sessions of 24 h of continuous recording of neurophysiological activity in freely moving rats chronically implanted with intracranial multielectrodes. The few previous neurophysiological studies describing changes in brain oscillations in animal models of chronic pain used whole-brain EEG scalp activity with poor spatial resolution; furthermore, they were commonly limited to only a few hours of recording (Landis et al., 1989; Palma et al., 2000; Tokunaga et al., 2007) or to a single session of 24 h of recording (Andersen and Tufik, 2003; Kontinen et al., 2003; Monassi et al., 2003; Keay et al., 2004; Silva et al., 2008). In fact, several studies dealing with pain-induced arousal changes focused on the description of behavioral alterations in the sleep cycle without any neurophysiological recording (Carli et al., 1987; Landis et al., 1988; Millecamps et al., 2005). Therefore, in contrast with the many clinical reports in humans that have used multichannel EEG, MEG, and intracranial recordings in an effort to address the spatial origins of brain oscillations (Sarnthein et al., 2006; Stern et al., 2006; Boord et al., 2008; Drewes et al., 2008; Sarnthein and Jeanmonod, 2008; Bjørk et al., 2009; Walton et al., 2010), almost no information exists from animal models on how chronic pain affects the functioning of the thalamocortical loop, since the only studies addressing this issue were limited to acute pain stimulation (Wang et al., 2003, 2004; Huang et al., 2006).
Chronic Pain Disrupts Thalamocortical Flow of Information
The most significant finding in the present study is that the onset of neuropathic pain causes a rapid and dramatic decrease in the thalamocortical flow of information as measured by PDC (Sameshima and Baccalá, 1999; Baccala and Sameshima, 2001); this decrease was observed across all the brain states of the wake–sleep cycle, in spite of the lack of alterations in other thalamocortical features such as the frequency power spectrum and spectral coherence. PDC is a bidirectional frequency domain representation of the concept of Granger-Causality that measures how a time series x(n) causes another series y(n), if knowledge of x(n)’s past significantly improves prediction of y(n). Hence, the thalamocortical PDC reflects how much of the cortical frequency space is temporally dependent on the thalamic LFP, and vice-versa.
The use of PDC analyses is growing in literature (Winterhalder et al., 2006; Sato et al., 2009); it has been validated in real neurophysiological data (Fanselow et al., 2001; Wang et al., 2003, 2004, 2008; Winterhalder et al., 2005; Huang et al., 2006) as well as in several theoretical studies using simulated data (Sameshima and Baccalá, 1999; Baccala and Sameshima, 2001; Schelter et al., 2006a,b; Takahashi et al., 2010), to demonstrate expected changes in brain networks that other less complex methods had failed to identify. As examples, PDC was able to uncover dopaminergic-dependent changes in connectivity between visual and motor areas in Parkinson patients that were undetectable by traditional spectral analysis (Tropini et al., 2011), and it was used to identify the directionality of widespread oscillatory brain interactions during visual object processing in the recognition of familiar vs. unfamiliar objects (Supp et al., 2007).
In what concerns thalamocortical processing of nociceptive information, PDCs have been calculated only in acute pain studies, in which it was shown that immediately after formalin injection the flow of information is maximal from cortex to the thalamus but that the direction of maximal information flow is reversed after 1 h (Huang et al., 2006); more recently, the same research group showed that noxious heat stimulation significantly increased the flow of information from SI cortex to ventral posterior thalamus, while in the ascending direction the flow of information decreased or remained unchanged, demonstrating for the first time that during pain processing the primary somatosensory cortex has a prominent role over the activity of thalamic neurons (Wang et al., 2007). This observation is in agreement with previous studies that have proposed that the descending corticothalamic projection could amplify noxious inputs of interest while simultaneously inhibiting other irrelevant information in order to improve input selectivity and detection (Rauschecker, 1997; Suga et al., 1997, 2000).
Our current results seem to suggest that the descending pathway remains functionally stronger than the ascending pathway raising the possibility that the cortex is still exerting an inhibitory role over the thalamus; this is in agreement with several studies indicating thalamic hypoactivity after prolonged pain conditions (Iadarola et al., 1995; Apkarian et al., 2004; Garcia-Larrea et al., 2006; Sorensen et al., 2008). Moreover, our calculation of information flow across states of the wake–sleep cycle is also in agreement with the observed disruption of default-mode network connectivity that is also observed in chronic pain patients (Baliki et al., 2008; Cauda et al., 2009).
Chronic Pain Changes Thalamocortical Phase–Coherence
Our results show that after nerve injury there was an increase in thalamocortical phase–coherence during episodes of awake – WK – and SWS, while at the same time there was a decrease in the flow of information between cortex and thalamus. Notably, all the differences that were observed at 48 h following the induction of chronic neuropathic pain were also observed in the recordings performed 10 days afterward, suggesting that these changes have fast onset and endure while the pain symptoms persist. In contrast to the change in thalamocortical phase–coherence, power spectrum, and spectral coherence were unaltered throughout all frequency bands which was not expected given that several human studies have shown an increase in spectral power and coherence in pain patients, specially at theta frequencies (Sarnthein and Jeanmonod, 2008; Ray et al., 2009; Walton et al., 2010). The most probable reason for this discrepancy between previous human studies and the present results is the fact that we have performed pre- vs. post-pain intracranial recordings of LFPs from the lateral thalamus and somatosensory cortex while similar human studies used non-invasive whole-brain recording techniques in which patients were compared to a control population. These human recordings comprise brain sources such as frontal areas that are known to be highly relevant to the increase in theta power and coherence (Sarnthein et al., 2006; Stern et al., 2006). In fact, when recorded simultaneously, the peaks of activity differ between EEG and LFPs with the EEG having maximal frequencies at the theta range and thalamic LFPs at the faster alpha range (Sarnthein and Jeanmonod, 2008). Moreover, the few human studies made with intracranial thalamic recordings are commonly based on medial areas and not on the lateral thalamus (Sarnthein et al., 2006; Sarnthein and Jeanmonod, 2008).
On the other hand, several studies have also shown evidence for not only a more desynchronized thalamic activity (Kane et al., 2009), but also reduced EEG power spectra in chronic pain patients (Boord et al., 2008). It is also interesting to note that other studies using animal models of pain have also failed to observe an increase in EEG power (Landis et al., 1989; Kontinen et al., 2003).
Chronic Pain Disrupts the Brain StateMaps
After the induction of the SNI model of neuropathic pain, the number of WK and SWS episodes increased whereas their mean duration remained the same; the increase in SWS occurred during both the dark and the light phases of recording, while the increase in WK episodes occurred only in the dark phase of the recording. Our observation of an increase in WK episodes is in agreement with published data from different chronic pain models that have also showed an increase in the percentage of time allocated to alertness episodes during the pain period (Carli et al., 1987; Landis et al., 1988, 1989; Andersen and Tufik, 2003; Monassi et al., 2003; Keay et al., 2004). However, our observation of an increase in SWS episodes is in contrast to previous observations that have reported either a decrease (Carli et al., 1987; Landis et al., 1988; Andersen and Tufik, 2003; Monassi et al., 2003; Silva et al., 2008), or no alteration in SWS episodes after induction of chronic pain (Millecamps et al., 2005). We also did not observe differences in REM episodes, which is in agreement with previous findings (Monassi et al., 2003), while other reports showed either a decrease (Carli et al., 1987; Landis et al., 1989) or an increase (Andersen and Tufik, 2003; Schutz et al., 2003) in the time spent in REM.
It must be noted that our statistically based classification of brain states according to intracranial LFPs (Gervasoni et al., 2004) is inherently distinct from traditional wake–sleep EEG/EMG classification, with increased sensitivity to short duration transitional episodes and the ability to discriminate brain states based on higher frequencies than what is typically possible using scalp EEG. Therefore, direct comparison with previous studies is not entirely possible, particularly because the literature differs widely on the duration of the recording periods.
Transitions between the three more frequent states (WK, SWS, and REM) also increased after peripheral nerve injury. Our data showed an increase of WK → SWS transitions (in light phase), SWS → WK (in light and dark phases), and of low-frequency transitions such as SWS → REM and REM → WK during the light phase. In literature, similar results were published in several clinical chronic pain studies (Drewes et al., 1998; Lentz et al., 1999; Peyron et al., 2004; Lautenbacher et al., 2006). Apart the more frequent transitions, also the U-transition episodes that mediate state transitions increased after nerve lesion, namely WK → U and U → WK. These changes are probably related to the significant increase in the amount of U episodes that occurs after nerve lesion. Some studies in the literature report a similar short duration transition state called TS that was firstly described in the rat (Gottesmann, 1992; Benington et al., 1994), and sporadically observed during the transition between SWS and REM episodes. Mandile and co-workers using high temporal resolution computational methods for the EEG pattern analyses also identified this type of oscillation during the transitions between SWS → TS → WK (Mandile et al., 1996; Vescia et al., 1996), however with a longer duration compared to the transition observed between SWS → TS → REM.
A final note should be given on the inherent impossibility of teasing apart the strictly somatosensory effects from the indirect effects of pain. However, it may be argued that the non-specific effects are also intrinsic to the full neuropathic syndrome, to the extent that teasing them is almost impossible, if not senseless. Although we cannot rule out that the observed changes in sleep patterns or in thalamocortical connectivity may result from physical or motivational changes in locomotion patterns, we cannot dismiss that even those changes were triggered by the neuropathic model.
In summary, our results showed that peripheral nerve injury (SNI) induces a clear reduction of the amount of information flow and an enhancement of phase synchronization between the lateral thalamus and the primary somatosensory cortex. Our findings also demonstrate wake–sleep cycle disturbances, namely in the number, duration and transitions between brain state episodes. As previously suggested (Llinás et al., 2005; Walton et al., 2010), one possible explanation is that these changes may be caused by the unmasking of cortical descending inhibitory mechanisms that regulate the thalamic balance between continuously amplification of nociceptive information and suppression of non-nociceptive information.
Conflict of Interest Statement
The authors declare that the research was conducted in the absence of any commercial or financial relationships that could be construed as a potential conflict of interest.
Acknowledgments
Special thanks to Dr. Shih-Chieh Lin for the StateMap toolbox for brain states classification. This work was supported by grants from Portuguese Foundation for Science and Technology (FCT; FCT-PTDC/SAU-NEU/100773/2008, PhD Grant FCT-SFRH/42500/2007), and BIAL Foundation (grant BIAL 126/08). The funders had no role in study design, data collection and analysis, decision to publish, or preparation of the manuscript.
References
Achermann, P., and Borbely, A. A. (1997). Low-frequency (<1 Hz) oscillations in the human sleep electroencephalogram. Neuroscience 81, 213–222.
Andersen, M. L., and Tufik, S. (2003). Sleep patterns over 21-day period in rats with chronic constriction of sciatic nerve. Brain Res. 984, 84–92.
Apkarian, A. V., Sosa, Y., Sonty, S., Levy, R. M., Harden, R. N., Parrish, T. B., and Gitelman, D. R. (2004). Chronic back pain is associated with decreased prefrontal and thalamic gray matter density. J. Neurosci. 24, 10410–10415.
Baccala, L. A., and Sameshima, K. (2001). Partial directed coherence: a new concept in neural structure determination. Biol. Cybern. 84, 463–474.
Baliki, M. N., Geha, P. Y., Apkarian, A. V., and Chialvo, D. R. (2008). Beyond feeling: chronic pain hurts the brain, disrupting the default-mode network dynamics. J. Neurosci. 28, 1398–1403.
Benington, J. H., Kodali, S. K., and Heller, H. C. (1994). Scoring transitions to Rem-sleep in rats based on the Eeg phenomena of Pre-Rem sleep – an improved analysis of sleep structure. Sleep 17, 28–36.
Bjørk, M., Stovner, L., Engstrøm, M., Stjern, M., Hagen, K., and Sand, T. (2009). Interictal quantitative EEG in migraine: a blinded controlled study. J. Headache Pain 10, 331–339.
Boord, P., Siddall, P., Tran, Y., Herbert, D., Middleton, J., and Craig, A. (2008). Electroencephalographic slowing and reduced reactivity in neuropathic pain following spinal cord injury. Spinal Cord 46, 118–123.
Carli, G., Montesano, A., Rapezzi, S., and Paluffi, G. (1987). Differential-effects of persistent nociceptive stimulation on sleep stages. Behav. Brain Res. 26, 89–98.
Cauda, F., Sacco, K., Duca, S., Cocito, D., D’agata, F., Geminiani, G. C., and Canavero, S. (2009). Altered resting state in diabetic neuropathic pain. PLoS ONE 4, e4542. doi: 10.1371/journal.pone.0004542
Chaplan, S. R., Bach, F. W., Pogrel, J. W., Chung, J. M., and Yaksh, T. L. (1994). Quantitative assessment of tactile allodynia in the rat paw. J. Neurosci. Methods 53, 55–63.
Chen, A., and Herrmann, C. (2001). Perception of pain coincides with the spatial expansion of electroencephalographic dynamics in human subjects. Neurosci. Lett. 297, 183–186.
de Labra, C., Rivadulla, C., Grieve, K., Mariño, J., Espinosa, N., and Cudeiro, J. (2007). Changes in visual responses in the feline dLGN: selective thalamic suppression induced by transcranial magnetic stimulation of V1. Cereb. Cortex 17, 1376–1385.
Decosterd, I., and Woolf, C. J. (2000). Spared nerve injury: an animal model of persistent peripheral neuropathic pain. Pain 87, 149–158.
Destexhe, A., Contreras, D., and Steriade, M. (1999). Spatiotemporal analysis of local field potentials and unit discharges in cat cerebral cortex during natural wake and sleep states. J. Neurosci. 19, 4595–4608.
Drewes, A., Gratkowski, M., Sami, S., Dimcevski, G., Funch-Jensen, P., and Arendt-Nielsen, L. (2008). Is the pain in chronic pancreatitis of neuropathic origin? Support from EEG studies during experimental pain. World J. Gastroenterol. 14, 4020–4027.
Drewes, A. M., Gade, K., Nielsen, K. D., Bjerregard, K., Taagholt, S. J., and Svendsen, L. (1995). Clustering of sleep electroencephalographic patterns in patients with the fibromyalgia syndrome. Br. J. Rheumatol. 34, 1151–1156.
Drewes, A. M., Nielsen, K. D., Arendt-Nielsen, L., Birket-Smith, L., and Hansen, L. M. (1997). The effect of cutaneous and deep pain on the electroencephalogram during sleep – an experimental study. Sleep 20, 632–640.
Drewes, A. M., Svendsen, L., Taagholt, S. J., Bjerregard, K., Nielsen, K. D., and Hansen, B. (1998). Sleep in rheumatoid arthritis: a comparison with healthy subjects and studies of sleep/wake interactions. Br. J. Rheumatol. 37, 71–81.
Edwards, R., Almeida, D., Klick, B., Haythornthwaite, J., and Smith, M. (2008). Duration of sleep contributes to next-day pain report in the general population. Pain 137, 202–207.
Fanselow, E. E., and Nicolelis, M. A. L. (1999). Behavioral modulation of tactile responses in the rat somatosensory system. J. Neurosci. 19, 7603–7616.
Fanselow, E. E., Sameshima, K., Baccala, L. A., and Nicolelis, M. A. (2001). Thalamic bursting in rats during different awake behavioral states. Proc. Natl. Acad. Sci. U.S.A. 98, 15330–15335.
Garcia-Larrea, L., Maarrawi, J., Peyron, R., Costes, N., Mertens, P., Magnin, M., and Laurent, B. (2006). On the relation between sensory deafferentation, pain and thalamic activity in Wallenberg’s syndrome: a PET-scan study before and after motor cortex stimulation. Eur. J. Pain 10, 677–688.
Gervasoni, D., Lin, S. C., Ribeiro, S., Soares, E. S., Pantoja, J., and Nicolelis, M. A. (2004). Global forebrain dynamics predict rat behavioral states and their transitions. J. Neurosci. 24, 11137–11147.
Gottesmann, C. (1992). Detection of 7 sleep-waking stages in the rat. Neurosci. Biobehav. Rev. 16, 31–38.
Gudbjornsson, B., Broman, J. E., Hetta, J., and Hallgren, R. (1993). Sleep disturbances in patients with primary Sjogrens-syndrome. Br. J. Rheumatol. 32, 1072–1076.
Hagen, K. B., Kvien, T. K., and Bjorndal, A. (1997). Musculoskeletal pain and quality of life in patients with noninflammatory joint pain compared to rheumatoid arthritis: a population survey. J. Rheumatol. 24, 1703–1709.
Huang, J., Chang, J., Woodward, D., Baccalá, L., Han, J., Wang, J., and Luo, F. (2006). Dynamic neuronal responses in cortical and thalamic areas during different phases of formalin test in rats. Exp. Neurol. 200, 124–134.
Hughes, S., and Crunelli, V. (2005). Thalamic mechanisms of EEG alpha rhythms and their pathological implications. Neuroscientist. 11, 357–372.
Iadarola, M. J., Max, M. B., Berman, K. F., Byas-Smith, M. G., Coghill, R. C., Gracely, R. H., and Bennett, G. J. (1995). Unilateral decrease in thalamic activity observed with positron emission tomography in patients with chronic neuropathic pain. Pain 63, 55–64.
Jeanmonod, D., Schulman, J., Ramirez, R., Cancro, R., Lanz, M., Morel, A., Magnin, M., Siegemund, M., Kronberg, E., Ribary, U., and Llinas, R. (2003). Neuropsychiatric thalamocortical dysrhythmia: surgical implications. Neurosurg. Clin. N. Am. 14, 251–265.
Jones, S. D., Koh, W. H., Steiner, A., Garret, S. L., and Calin, A. (1996). Fatigue in ankylosing spondylitis: Its prevalence and relationship to disease activity, sleep, and other factors. J. Rheumatol. 23, 487–490.
Kane, A., Hutchison, W., Hodaie, M., Lozano, A., and Dostrovsky, J. (2009). Enhanced synchronization of thalamic theta band local field potentials in patients with essential tremor. Exp. Neurol. 217, 171–176.
Keay, K. A., Monassi, C. R., Levison, D. B., and Bandler, R. (2004). Peripheral nerve injury evokes disabilities and sensory dysfunction in a subpopulation of rats: a closer model to human chronic neuropathic pain? Neurosci. Lett. 361, 188–191.
Kontinen, V. K., Ahnaou, A., Drinkenburg, W. H., and Meert, T. F. (2003). Sleep and EEG patterns in the chronic constriction injury model of neuropathic pain. Physiol. Behav. 78, 241–246.
Kundermann, B., Krieg, J. C., Schreiber, W., and Lautenbacher, S. (2004). The effect of sleep deprivation on pain. Pain Res. Manag. 9, 25–32.
Landis, C. A., Levine, J. D., and Robinson, C. R. (1989). Decreased slow-wave and paradoxical sleep in a rat chronic pain model. Sleep 12, 167–177.
Landis, C. A., Robinson, C. R., and Levine, J. D. (1988). Sleep fragmentation in the arthritic rat. Pain 34, 93–99.
Lautenbacher, S., Kundermann, B., and Krieg, J. C. (2006). Sleep deprivation and pain perception. Sleep Med. Rev. 10, 357–369.
Lentz, M. J., Landis, C. A., Rothermel, J., and Shaver, J. L. (1999). Effects of selective slow wave sleep disruption on musculoskeletal pain and fatigue in middle aged women. J. Rheumatol. 26, 1586–1592.
Lima, D. (2008). “Ascending pathways: anatomy and physiology,” in The Science of Pain, eds. A. Basbaum, and M. C. Bushnell (New York: Academic Press), 477–526.
Lin, S. C., Gervasoni, D., and Nicolelis, M. A. L. (2006). Fast modulation of prefrontal cortex activity by basal forebrain noncholinergic neuronal ensembles. J. Neurophysiol. 96, 3209–3219.
Llinás, R., Ribary, U., Jeanmonod, D., Kronberg, E., and Mitra, P. (1999). Thalamocortical dysrhythmia: a neurological and neuropsychiatric syndrome characterized by magnetoencephalography. Proc. Natl. Acad. Sci. U.S.A. 96, 15222–15227.
Llinás, R., Urbano, F. J., Leznik, E., Ramírez, R. R., and Van Marle, H. J. (2005). Rhythmic and dysrhythmic thalamocortical dynamics: GABA systems and the edge effect. Trends Neurosci. 28, 325–333.
Lumer, E., Edelman, G., and Tononi, G. (1997). Neural dynamics in a model of the thalamocortical system. II. The role of neural synchrony tested through perturbations of spike timing. Cereb. Cortex 7, 228–236.
Mandile, P., Vescia, S., Montagnese, P., Romano, F., and Giuditta, A. (1996). Characterization of transition sleep episodes in baseline EEG recordings of adult rats. Physiol. Behav. 60, 1435–1439.
Massimini, M., Boly, M., Casali, A., Rosanova, M., and Tononi, G. (2009). A perturbational approach for evaluating the brain’s capacity for consciousness. Prog. Brain Res. 177, 201–214.
McCormick, D. A., and Bal, T. (1997). Sleep and arousal: thalamocortical mechanisms. Annu. Rev. Neurosci. 20, 185–215.
Meehan, S., Legon, W., and Staines, W. (2008). Paired-pulse transcranial magnetic stimulation of primary somatosensory cortex differentially modulates perception and sensorimotor transformations. Neuroscience 157, 424–431.
Millecamps, M., Jourdan, D., Leger, S., Etienne, M., Eschalier, A., and Ardid, D. (2005). Circadian pattern of spontaneous behavior in monarthritic rats – a novel global approach to evaluation of chronic pain and treatment effectiveness. Arthritis Rheum. 52, 3470–3478.
Moldofsky, H., Scarisbrick, P., England, R., and Smythe, H. (1975). Musculosketal symptoms and non-REM sleep disturbance in patients with “fibrositis syndrome” and healthy subjects. Psychosom. Med. 37, 341–351.
Monassi, C. R., Bandler, R., and Keay, K. A. (2003). A subpopulation of rats show social and sleep-waking changes typical of chronic neuropathic pain following peripheral nerve injury. Eur. J. Neurosci. 17, 1907–1920.
Morin, C. M., Gibson, D., and Wade, J. (1998). Self-reported sleep and mood disturbance in chronic pain patients. Clin. J. Pain 14, 311–314.
Nicolelis, M. A. L., Baccala, L. A., Lin, R. C., and Chapin, J. K. (1995). Sensorimotor encoding by synchronous neural ensemble activity at multiple levels of the somatosensory system. Science 268, 1353–1358.
Onen, S. H., Alloui, A., Gross, A., Eschallier, A., and Dubray, C. (2001). The effects of total sleep deprivation, selective sleep interruption and sleep recovery on pain tolerance thresholds in healthy subjects. J. Sleep Res. 10, 35–42.
Palma, B. D., Suchecki, D., and Tufik, S. (2000). Differential effects of acute cold and footshock on the sleep of rats. Brain Res. 861, 97–104.
Paxinos, G., and Watson, C. (1998). The Rat Brain in Stereotaxic Coordinates. San Diego: Academic Press.
Peyron, R., Schneider, F., Faillenot, I., Convers, P., Barral, F. G., Garcia-Larrea, L., and Laurent, B. (2004). An fMRI study of cortical representation of mechanical allodynia in patients with neuropathic pain. Neurology 63, 1838–1846.
Rauschecker, J. P. (1997). Mechanisms of compensatory plasticity in the cerebral cortex. Brain Plast. 73, 137–146.
Ray, N., Jenkinson, N., Kringelbach, M., Hansen, P., Pereira, E., Brittain, J., Holland, P., Holliday, I., Owen, S., Stein, J., and Aziz, T. (2009). Abnormal thalamocortical dynamics may be altered by deep brain stimulation: using magnetoencephalography to study phantom limb pain. J. Clin. Neurosci. 16, 32–36.
Ribary, U. (2005). Dynamics of thalamo-cortical network oscillations and human perception. Prog. Brain Res. 150, 127–142.
Sameshima, K., and Baccalá, L. (1999). Using partial directed coherence to describe neuronal ensemble interactions. J. Neurosci. Methods 94, 93–103.
Sarnthein, J., and Jeanmonod, D. (2007). High thalamocortical theta coherence in patients with Parkinson’s disease. J. Neurosci. 27, 124–131.
Sarnthein, J., and Jeanmonod, D. (2008). High thalamocortical theta coherence in patients with neurogenic pain. Neuroimage 39, 1910–1917.
Sarnthein, J., Stern, J., Aufenberg, C., Rousson, V., and Jeanmonod, D. (2006). Increased EEG power and slowed dominant frequency in patients with neurogenic pain. Brain 129, 55–64.
Sato, J. R., Takahashi, D. Y., Arcuri, S. M., Sameshima, K., Morettin, P. A., and Baccalá, L. A. (2009). Frequency domain connectivity identification: an application of partial directed coherence in fMRI. Hum. Brain Mapp. 30, 452–461.
Schelter, B., Winterhalder, M., Eichler, M., Peifer, M., Hellwig, B., Guschlbauer, B., Lücking, C. H., Dahlhaus, R., and Timmer, J. (2006a). Testing for directed influences among neural signals using partial directed coherence. J. Neurosci. Methods 152, 210–219.
Schelter, B., Winterhalder, M., Hellwig, B., Guschlbauer, B., Lücking, C. H., and Timmer, J. (2006b). Direct or indirect? Graphical models for neural oscillators. J. Physiol. Paris 99, 37–46.
Schutz, T. C. B., Andersen, M. L., and Tufik, S. (2003). Sleep alterations in an experimental orofacial pain model in rats. Brain Res. 993, 164–171.
Sherman, S., and Guillery, R. (2002). The role of the thalamus in the flow of information to the cortex. Philos. Trans. R. Soc. Lond. B Biol. Sci. 357, 1695–1708.
Silva, A., Andersen, M. L., and Tufik, S. (2008). Sleep pattern in an experimental model of osteoarthritis. Pain 140, 446–455.
Silva, A., Cardoso-Cruz, H., Silva, F., Galhardo, V., and Antunes, L. (2010). Comparison of anesthetic depth indexes based on thalamocortical local field potentials in rats. Anesthesiology 112, 355–363.
Sorensen, L., Siddall, P., Trenell, M., and Yue, D. (2008). Differences in metabolites in pain-processing brain regions in patients with diabetes and painful neuropathy. Diabetes Care 31, 980–981.
Steriade, M., Mccormick, D. A., and Sejnowski, T. J. (1993). Thalamocortical oscillations in the sleeping and aroused brain. Science 262, 679–685.
Stern, J., Jeanmonod, D., and Sarnthein, J. (2006). Persistent EEG overactivation in the cortical pain matrix of neurogenic pain patients. Neuroimage 31, 721–731.
Suga, N., Gao, E. Q., Zhang, Y. F., Ma, X. F., and Olsen, J. F. (2000). The corticofugal system for hearing: Recent progress. Proc. Natl. Acad. Sci. U.S.A. 97, 11807–11814.
Suga, N., Zhang, Y. F., and Yan, J. (1997). Sharpening of frequency tuning by inhibition in the thalamic auditory nucleus of the mustached bat. J. Neurophysiol. 77, 2098–2114.
Supp, G. G., Schlögl, A., Trujillo-Barreto, N., Müller, M. M., and Gruber, T. (2007). Directed cortical information flow during human object recognition: analyzing induced EEG gamma-band responses in brain’s source space. PLoS ONE 2, e684. doi: 10.1371/journal.pone.0000684
Takahashi, D. Y., Baccala, L. A., and Sameshima, K. (2010). Frequency domain connectivity: an information theoretic perspective. Conf. Proc. IEEE Eng. Med. Biol. Soc. 2010, 1726–1729.
Tang, N. K., Wright, K. J., and Salkovskis, P. M. (2007). Prevalence and correlates of clinical insomnia co-occurring with chronic back pain. J. Sleep Res. 16, 85–95.
Tishler, M., Barak, Y., Paran, D., and Yaron, M. (1997). Sleep disturbances, fibromyalgia and primary Sjogren’s syndrome. Clin. Exp. Rheumatol. 15, 71–74.
Tokunaga, S., Takeda, Y., Shinomiya, K., Yamamoto, W., Utsu, Y., Toide, K., and Kamei, C. (2007). Changes of sleep patterns in rats with chronic constriction injury under aversive conditions. Biol. Pharm. Bull. 30, 2088–2090.
Tropini, G., Chiang, J., Wang, Z. J., Ty, E., and Mckeown, M. J. (2011). Altered directional connectivity in Parkinson’s disease during performance of a visually guided task. Neuroimage 56, 2144–2156.
Vanderwolf, C. H. (1969). Hippocampal electrical acitvity and voluntary movement in rat. Electroencephalogr Clin. Neurophysiol. 26, 407–418.
Vescia, S., Mandile, P., Montagnese, P., Romano, F., Cataldo, G., Cotugno, M., and Giuditta, A. (1996). Baseline transition sleep and associated sleep episodes are related to the learning ability of rats. Physiol. and Behav. 60, 1513–1525.
Walton, K., Dubois, M., and Llinás, R. (2010). Abnormal thalamocortical activity in patients with complex regional pain syndrome (CRPS) type I. Pain 150, 41–51.
Wang, J., Chang, J., Woodward, D., Baccalá, L., Han, J., and Luo, F. (2007). Corticofugal influences on thalamic neurons during nociceptive transmission in awake rats. Synapse 61, 335–342.
Wang, J., Luo, F., Chang, J., Woodward, D., and Han, J. (2003). Parallel pain processing in freely moving rats revealed by distributed neuron recording. Brain Res. 992, 263–271.
Wang, J., Zhang, H., Han, J., Chang, J., Woodward, D., and Luo, F. (2004). Differential modulation of nociceptive neural responses in medial and lateral pain pathways by peripheral electrical stimulation: a multichannel recording study. Brain Res. 1014, 197–208.
Wang, J. Y., Zhang, H. T., Chang, J. Y., Woodward, D. J., Baccalá, L. A., and Luo, F. (2008). Anticipation of pain enhances the nociceptive transmission and functional connectivity within pain network in rats. Mol. Pain 4, 34.
Wiest, M. C., and Nicolelis, M. A. L. (2003). Behavioral detection of tactile stimuli during 7-12 Hz cortical oscillations in awake rats. Nat. Neurosci. 6, 913–914.
Willis, W. J. (2007). The somatosensory system, with emphasis on structures important for pain. Brain Res. Rev. 55, 297–313.
Winterhalder, M., Schelter, B., Hesse, W., Schwab, K., Leistritz, L., Klan, D., Bauer, R., Timmer, J., and Witte, H. (2005). Comparison of linear signal processing techniques to infer directed interactions in multivariate neural systems. Signal Processing 85, 2137–2160.
Winterhalder, M., Schelter, B., Hesse, W., Schwab, K., Leistritz, L., Timmer, J., and Witte, H. (2006). Detection of directed information flow in biosignals. Biomed. Tech. (Berl.) 51, 281–287. doi: 10.1515/bmt.2006.058, 01/12/2006
Keywords: spared nerve injury model, intracranial recordings, thalamocortical, partial directed coherence, rat
Citation: Cardoso-Cruz H, Sameshima K, Lima D and Galhardo V (2011) Dynamics of circadian thalamocortical flow of information during a peripheral neuropathic pain condition. Front. Integr. Neurosci. 5:43. doi: 10.3389/fnint.2011.00043
Received: 02 June 2011; Accepted: 04 August 2011;
Published online: 23 August 2011.
Edited by:
Elizabeth B. Torres, Rutgers University, USAReviewed by:
Albino J. Oliveira-Maia, Champalimaud Foundation, PortugalJohn F. Araujo, Federal University of Rio Grande do Norte, Brazil
Copyright: © 2011 Cardoso-Cruz, Sameshima, Lima and Galhardo. This is an open-access article subject to a non-exclusive license between the authors and Frontiers Media SA, which permits use, distribution and reproduction in other forums, provided the original authors and source are credited and other Frontiers conditions are complied with.
*Correspondence: Vasco Galhardo, Instituto de Biologia Molecular e Celular, Rua do Campo Alegre, 823, 4150-180 Porto, Portugal. e-mail: galhardo@med.up.pt