RobOKoD: microbial strain design for (over)production of target compounds
 Natalie J. Stanford
 Pierre Millard
 Neil Swainston
- 1Manchester Institute of Biotechnology, University of Manchester, Manchester, UK
- 2School of Computer Science, University of Manchester, Manchester, UK
- 3INSA, UPS, INP, LISBP, Université de Toulouse, Toulouse, France
- 4INRA, UMR792, Ingénierie des Systèmes Biologiques et des Procédés, Toulouse, France
- 5Centre National de la Recherche Scientifique, UMR5504, Toulouse, France
Sustainable production of target compounds such as biofuels and high-value chemicals for pharmaceutical, agrochemical, and chemical industries is becoming an increasing priority given their current dependency upon diminishing petrochemical resources. Designing these strains is difficult, with current methods focusing primarily on knocking-out genes, dismissing other vital steps of strain design including the overexpression and dampening of genes. The design predictions from current methods also do not translate well-into successful strains in the laboratory. Here, we introduce RobOKoD (Robust, Overexpression, Knockout and Dampening), a method for predicting strain designs for overproduction of targets. The method uses flux variability analysis to profile each reaction within the system under differing production percentages of target-compound and biomass. Using these profiles, reactions are identified as potential knockout, overexpression, or dampening targets. The identified reactions are ranked according to their suitability, providing flexibility in strain design for users. The software was tested by designing a butanol-producing Escherichia coli strain, and was compared against the popular OptKnock and RobustKnock methods. RobOKoD shows favorable design predictions, when predictions from these methods are compared to a successful butanol-producing experimentally-validated strain. Overall RobOKoD provides users with rankings of predicted beneficial genetic interventions with which to support optimized strain design.
Introduction
The sustainable production of target compounds such as biofuels and high-value chemicals for pharmaceutical, agrochemical, and chemical industries is becoming an increasing priority given their current dependency upon diminishing petrochemical resources. The challenge of producing such compounds from microbial cells straddles both systems and synthetic biology. The development of microbial cell factories first requires a comprehensive understanding of host cell metabolic functions through metabolic model construction, and subsequent in silico experimentation, using systems biology methods. This in silico experimentation can suggest host cell manipulations that can be applied in vitro using synthetic biology techniques, leading to increased production of the target compound (Koide et al., 2009).
Target producing microbial strains are typically designed using combinations of gene manipulations. These manipulations include gene additions (often recombinant genes from other organisms) and removal of genes via knockouts. Furthermore, over-expression or inhibition of host genes can either increase or dampen metabolic flux through the reactions that their expressed proteins catalyze. Successful application of such strategies can be used to overproduce host-native targets (Ng et al., 2012; Li et al., 2014) or produce non-host-native targets (Atsumi et al., 2009; Angermayr et al., 2014; Yuan et al., 2014). Identifying successful gene manipulation combinations has traditionally relied on static network inspection, and experimental trial and error to test the strategies (Varman et al., 2011). This approach is not optimal as it limits the amount of network information that can be used, discounts metabolic complexity, and therefore prevents predictions of less intuitive metabolic modifications (Kitano, 2002).
Through modeling approaches, strain predictions can be improved by taking into account full metabolic complexity during the design phase. Designed strains can also be screened in silico before they are engineered and tested in the laboratory. The process involves iterative application of the following steps: (i) characterization of the host metabolic network; (ii) identification of gene additions to bridge native metabolism to the target; (iii) optimization of the modified metabolic network through gene addition, deletion, overexpression or dampening; (iv) trialing successful predictions in the laboratory. This process affords the potential to develop successful strains more cost effectively, and time efficiently. This work focuses on step (iii), which involves elements of network characterization in order to identify suitable optimization strategies.
To characterize the metabolic network, genome-scale models (GEMs) can be used in conjunction with constraint-based techniques. GEMs are computer-analyzable, structured knowledge bases of genes, proteins, and metabolites present within a given organism (Thiele and Palsson, 2010). GEMs therefore encode the complexity of host cell metabolism and are available for an increasingly large number of organisms (Büchel et al., 2013). Constraint based techniques, including flux balance analysis (FBA) and flux variability analysis (FVA), provide quantitative predictions of cellular behavior such as metabolic flux patterns and cellular growth rates. These are computed by applying constraints, which can be assigned from experimentally measured nutrient uptake rates (Orth et al., 2010) and intracellular fluxes (Sauer, 2006), or inferred through interpretation of gene expression data (Lee et al., 2012). These predictions provide insights into the metabolic pathways active under different growth conditions (Liao et al., 2011), gene essentiality (Joyce and Palsson, 2008; Dobson et al., 2010; Heavner et al., 2012), and as a result, the fitness optimality of a given strain (Harcombe et al., 2013). More detailed introductions to these techniques can be found in Boxes 1, 2.
Box 1
Flux Balance Analysis (FBA) allows the computation of fluxes, and cellular growth, by using a set of constraints. FBA uses the stoichiometric matrix (S), which is a matrix consisting of rows of metabolites (m), and columns of reactions (n). An example based on the toy network in Figure B1a can be seen in Table B1a. The matrix is usually sparse and filled with positive (negative) coefficients for metabolites produced (consumed) by a reaction. Linear programming is used to compute feasible fluxes (v) through the network ensuring that a steady state is satisfied (Equation i), subject to a set of constraints (Equation ii) and optimizing (Z) a specific function (Equation iii, where c is a vector of weights, typically a vector of zeros with biomass production set to 1). The minimum solutions of Equation (i) are elementary modes, which are minimal sets of enzymes that can operate at steady state, also known as minimal functional units (de Figueiredo et al., 2009). If Equation (i) cannot be satisfied, then FBA cannot be computed on the system.
In the example network below (Figure B1a), c is given as an uptake rate of 10 units of metabolite a. In the center network Z = Target, and in the right-hand network Z = Biomass. Reaction bounds are all assigned as lbi = 0, ubi = 1000. Meaning that each reaction through the network is irreversible. Computing FBA for Z = Target we get 10 units of flux flowing through v2 and v3, producing v_Target = 10 units. For Z = Biomass we get 10 units of flux flowing through v3, v7, and v9, producing v_Biomass = 10 units.
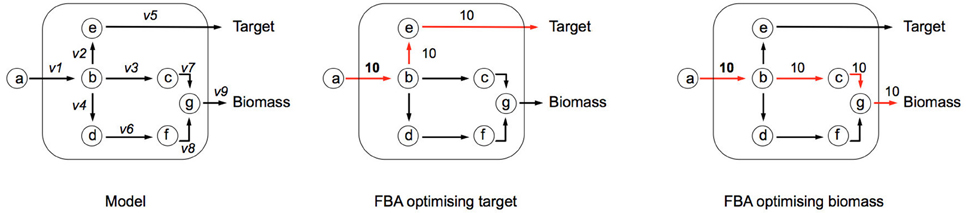
Figure B1a. Illustrating FBA for independent optimisation of target and biomass.
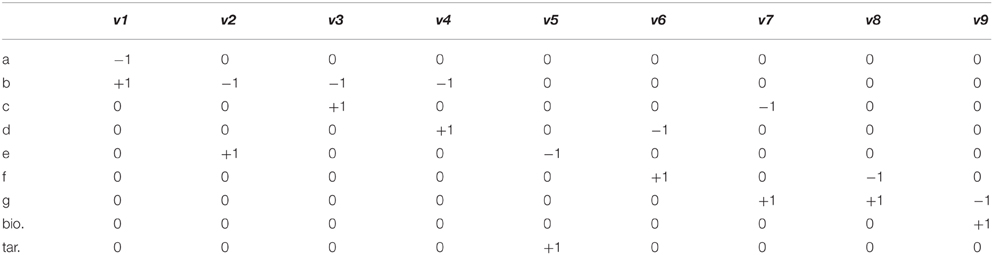
Table B1a. Stoichiometric matrix (S).
Box 2
Flux Variability Analysis (FVA). Box 1 showed an example of FBA, where a single set of fluxes was identified, which can maximize biomass production (Z). It can be seen in the central network of Figure B2a, that this set of fluxes was just one of two possible solutions that could be selected to maximize Z—route A and route B. FVA allows us to garner this additional information by identifying the minimum and maximum flux that each reaction can carry (Equation i). FVA can be implemented at the optimal state whereby y = 1 (Equation ii), subject to flux constraints for each reaction (Equation iii) as demonstrated in the right-hand network in Figure B2a (Gudmundsson and Thiele, 2010). Here the main information identified is which reactions are interchangeable. It is also common to compute FVA under suboptimal conditions (i.e., y = 0.95 as used in RobOKoD), which introduces a small amount of flexibility in the system and reduces the chances of optimal pathways being unrealistic when compared in vivo.
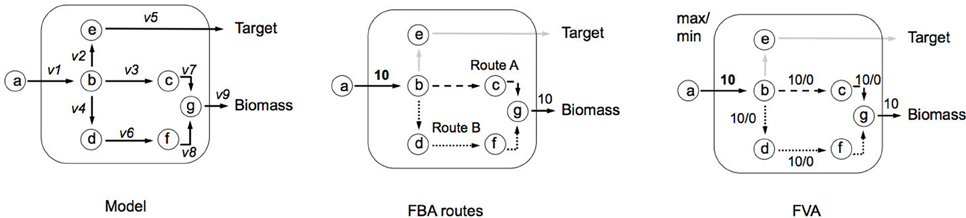
Figure B2a. Illustrating implementation of FVA and how it can be used to identify alternative flux optima.
Optimization of microbial strains is complex, requiring a balance between target production and cell viability (Lo et al., 2013). This makes the problem a multi-objective optimization problem, whereby metabolic flux of cellular growth and target production must be considered simultaneously. Successful optimization strategies therefore include gene modifications (knockouts, overexpression, dampening) which re-route flux toward the target product whilst minimizing the effect on flux toward synthesis of metabolites required for cellular maintenance.
Amongst the more prominent methods used for identifying knockout targets are OptKnock (Burgard et al., 2003) and RobustKnock (Tepper and Shlomi, 2010). OptKnock aims to optimize the maximum flux toward the target product whilst retaining cell viability, using up to five reactions knockouts to generate the strain solution. The method does not take into consideration flux variability, and therefore whilst there may be a reasonable maximal flux yield toward to target product, it is possible that the minimal flux toward the target product could be zero. RobustKnock was developed to improve on this shortcoming, by optimizing the minimal flux toward the target product, again by applying up to five reaction knockouts. Limitations of these methods include the prediction of only a single gene knockout strategy, and also no consideration of over-expression or dampening targets, which are key aspects of successful strain design (Dellomonaco et al., 2011). A complementary method, optGene (later updated to optFlux (Rocha et al., 2010)), can be used for overexpression analysis. Flux Variability Analysis has been used in a number of studies for identifying overexpression targets (Choi et al., 2010; Park et al., 2012), as well as more comprehensive strategies (Pharkya and Maranas, 2006; Feist et al., 2010), although these have not been extensively used. Elementary modes have also been used to identify suitable knockout targets (Ballerstein et al., 2012; von Kamp and Klamt, 2014).
To integrate the requirements of predicting both knockouts and over-/under-expressions, we introduce RobOKoD (Robust Overexpression, Knockout and Dampening). RobOKoD takes into consideration metabolite centrality and flux variability in order to comprehensively identify potential knockouts and gene over-/under-expressions, ranked by significance, and follow the schematic presented in Figure 1. This ranking is a strength, as it allows for further, manual analysis of the system to be used for strain design.
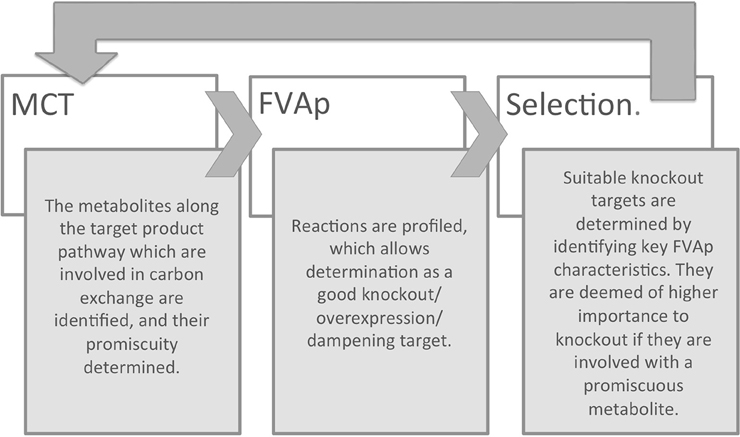
Figure 1. Workflow of RobOKoD, illustrating the iterative application of the methods MCT and FVAp.
The performance of RobOKoD was tested against that of OptKnock and RobustKnock in their ability to predict an engineering strategy for production of butanol from Escherichia coli using the reverse β-oxidation cycle. The predictions were validated against a successful, experimentally-validated butanol producing strain developed by Dellomonaco et al. (2011).
Materials and Methods
Escherichia coli model
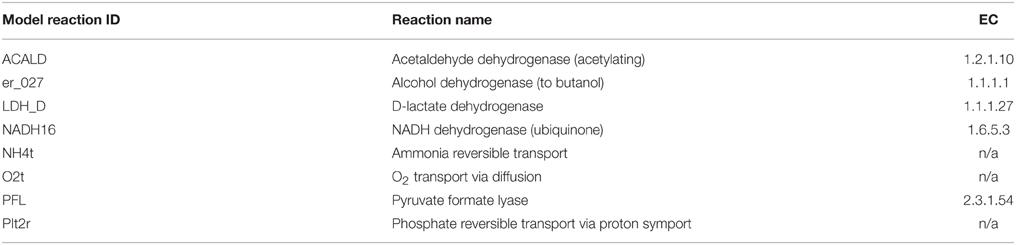
The model used in this study is a derivation of a core metabolism model derived from the iAF1260 reconstruction of E. coli metabolism proposed by Feist et al. (2007). The core metabolism model of 95 native reactions was modified to include the β-oxidation pathway—a total of eight genes catalyzing 30 additional reactions—to produce the model iNS142 (see Table 1). This model contains 142 genes, 125 reactions, and 93 metabolites (Figure 2). The model is available in Supplementary Folder 1 in SBML format (Hucka et al., 2003).
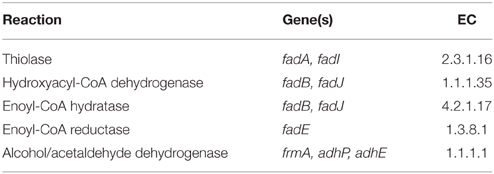
Table 1. Reactions and genes added to the core iAF1260 model to implement the β-oxidation cycle.
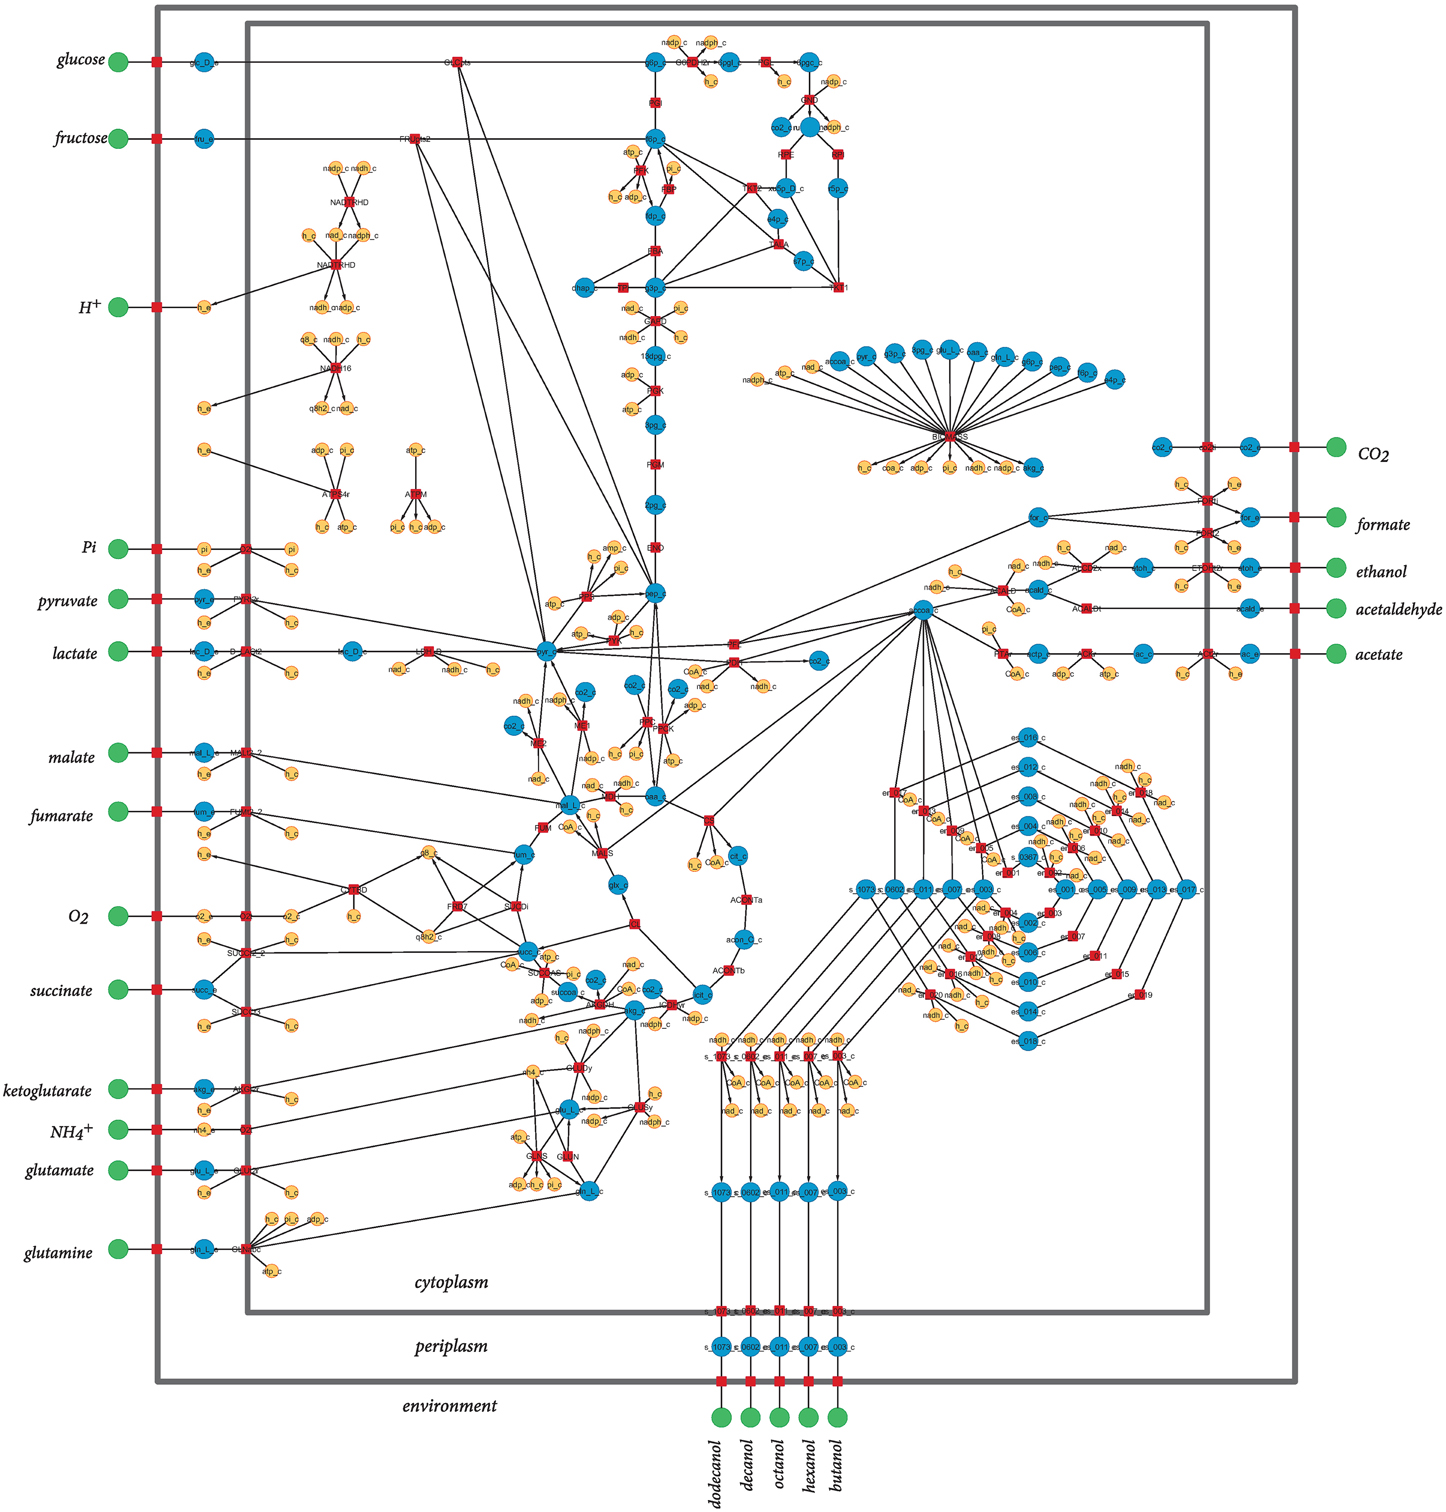
Figure 2. Graphical representation of the metabolic network of Escherichia coli included in iNS142. Red squares represent reactions, and green, blue, and orange circles represent extracellular metabolites, intracellular metabolites involved in carbon transfers, and intracellular metabolites not involved in carbon transfers, respectively. Directed arcs show irreversible reactions, whereas undirected arcs show reversible reactions. Water is not shown for clarity of the layout.
RobOKoD
The RobOKoD method is based on the two following assumptions:
1. To achieve target production, carbon transfer within the network has to be oriented toward pathways that favor the target. Therefore, changes within the network should aim to reduce carbon loss to peripheral pathways.
2. Flux variability of each reaction will differ depending on whether the reaction is important for growth, generating the desired product, both, or neither. Therefore, the functionality of each reaction can be inferred by analyzing its variability.
A simplified schematic of the method based on these two assumptions can be seen in Figure 1 and additional details are given in the next sections. First, a metabolite consumption test (MCT) is applied which computes whether a given metabolite in the target production pathway demonstrates flux loss to biomass production. If flux loss is identified, all reactions that consume that metabolite are flagged as potentially favored targets. Second, flux variability analysis profiling (FVAp) is performed to determine the flux variability of each reaction, at increments of maximum biomass flux and then at increments of maximum target product flux. The profiles of each reaction are used to calculate a score from which the importance of each reaction for growth and target production can be estimated. Finally, MCT and FVAp results are combined to rank potential modifications. Modifications can consist of (i) gene deletions; (ii) changes of environmental conditions; (iii) gene over-expressions; and (iv) gene dampenings.
This strategy ensures that reactions that are vital for either growth or target product production, or those that produce key metabolites, are not selected as potential knockouts. Conversely, reactions that (i) significantly divert carbon away from target production; and (ii) consume a metabolite known to promote flux loss from target production; are selected preferentially. Once the first knockout is predicted, the model is modified to block this reaction, and the same selection process is used to select the second reaction to delete. This method can be applied iteratively to predict a number of modifications that should enhance target production whilst maintaining growth.
All code was developed in Matlab to maintain compatibility with the COBRA Toolbox (Schellenberger et al., 2011), and is available in Supplementary Folder 1.
Metabolite Consumption Test (MCT)
Metabolite Consumption Test (MCT) identifies metabolites within the optimal target production pathway that are also consumed to produce biomass. The MCT score is given in a two-step process. First flux change (Xm) per metabolite (m) is calculated, then an MCT-value of 1 is given to all reactions that consume metabolites, denoted by a negative Xm. Xm is calculated according to Equation (1). For each metabolite that is featured in the optimal target producing pathway, for the example network in Figure 3, that would be metabolites a, b, e, all producing and consuming reactions are identified. Then per identified reaction, a unitary constant c is calculated which identifies the reaction as a producer (+1) or consumer (−1) of the metabolite during biomass production, thereby indicating whether there is a potential flux loss or gain from that reaction. Each reaction is then weighted (w) according to whether it is vital for both target and biomass (0); or potentially used (1), or not used (0) for biomass production. v is the maximum flux through the reaction during biomass production. All reactions that consume a metabolite m with a negative Xm-value are flagged with a 1 in the corresponding column (see MCT column in Table 2).
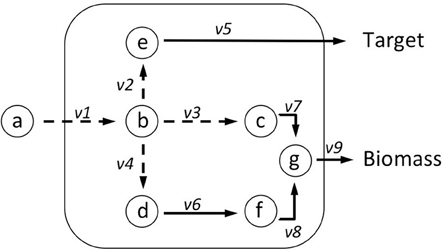
Figure 3. Metabolite Consumption Test (MCT) identifies metabolites that are in the optimal target production pathway. The test has two parts, first a flux change (Xm) score is computed using Equation (1). Taking metabolite b as an example: v1 produces b but is needed for both target and biomass production so weight (w1) = 0; v2 consumes b but is needed for producing the target so w2 = 0; v3 consumes b, so w3 = 1; v4 consumes b, so w4 = 1. These values are multiplied by the absolute value of maximum flux calculated using FVA (vimax), and by a constant (c) = ±1 according to whether the reaction produces or consumes the metabolite. Where Xm < 0 MCT = 1, where Xm ≥ 0 MCT = 0. Reactions identified as suitable knockout targets using RobOKoD are sorted firstly by RiKOr and secondly by their MCT flag. This means that reactions with an equal RiKOr can be differentiated by a secondary sorting against whether they directly consume a metabolite that is important for the target production (see Table 2).
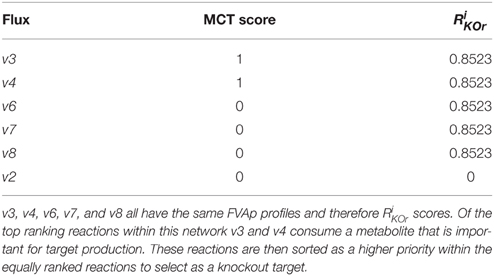
Table 2. Using the toy network presented in Figures 3, 4 we computed the MCT score and RiKOr of the intracellular reactions.
FVA Reaction Profile (FVAp)
Prior to FVAp, FBA is applied to predict the maximal theoretical yield of both biomass (ybm) and target product (ytarget). FVAp is then performed which computes the flux variability of each reaction: (1) at different percentage (0–100%) of ybm whilst optimizing target product; and (2) at different percentage (0–100%) of ytarget, whilst optimizing biomass. By computing FVAp the flux capacity of each reaction is profiled over a range of target constraints. The key areas of interest are the extremes of target production, and biomass production. It can be seen in Figure 5 that the first and last quartile of the x axis for all examples holds the key information from which beneficial genetic interventions can be inferred.
Knockout Scoring
Knockouts were selected by computing a knockout ranking score. The ranking score is calculated for each reaction using FVAp at different percentage (0–100%) of ybm whilst optimizing target product (red shaded area). Let us denote with (vmax)target|p and (vmin)target|p the maximal and minimal flux, respectively of reaction i obtained through FVAp when requiring a percentage p of ybm to be produced while maximizing for product. Likewise let the maximal and minimal flux of reaction i obtained through FVAp when requiring a percentage p of ytarget to be produced while maximizing for biomass be defined as (vmax)biomass|p and (vmin)biomass|p, respectively. It must be noted that the percentage p refers to either biomass or target product production requirement depending on the objective function.
A suitable knockout target displays the key characteristics shown in Figure 5A, where the first quartile of x axis 0-25% of ybm (red shaded area) carries a lower v(i)max|target, than 75-100% of ybm, which shows that the reaction is required to carry a higher flux to sustain optimal biomass production. This characteristic is captured in Equation (2) (biomass reaction activation). A reduced variability in the fourth quartile also demonstrates a stronger constraint on the flux to produce ybm, this is captured in Equation (3) (product variability area). The final knockout scoring RiKOr for each reaction was computed according to Equation (4), which takes into account the features of both the biomass reaction activation and product variability area.
Biomass reaction activation:
Product variability area:
Reactions that obtain a high RiKOr, are identified as a putative target for knocking out providing it is not a lethal target for the cell. Identified target reactions for knocking out are first ordered by RiKOr, before secondary sorting by MCT flags. An example of this sorting can be seen in Table 2 based on the toy network presented in Figures 3, 4.
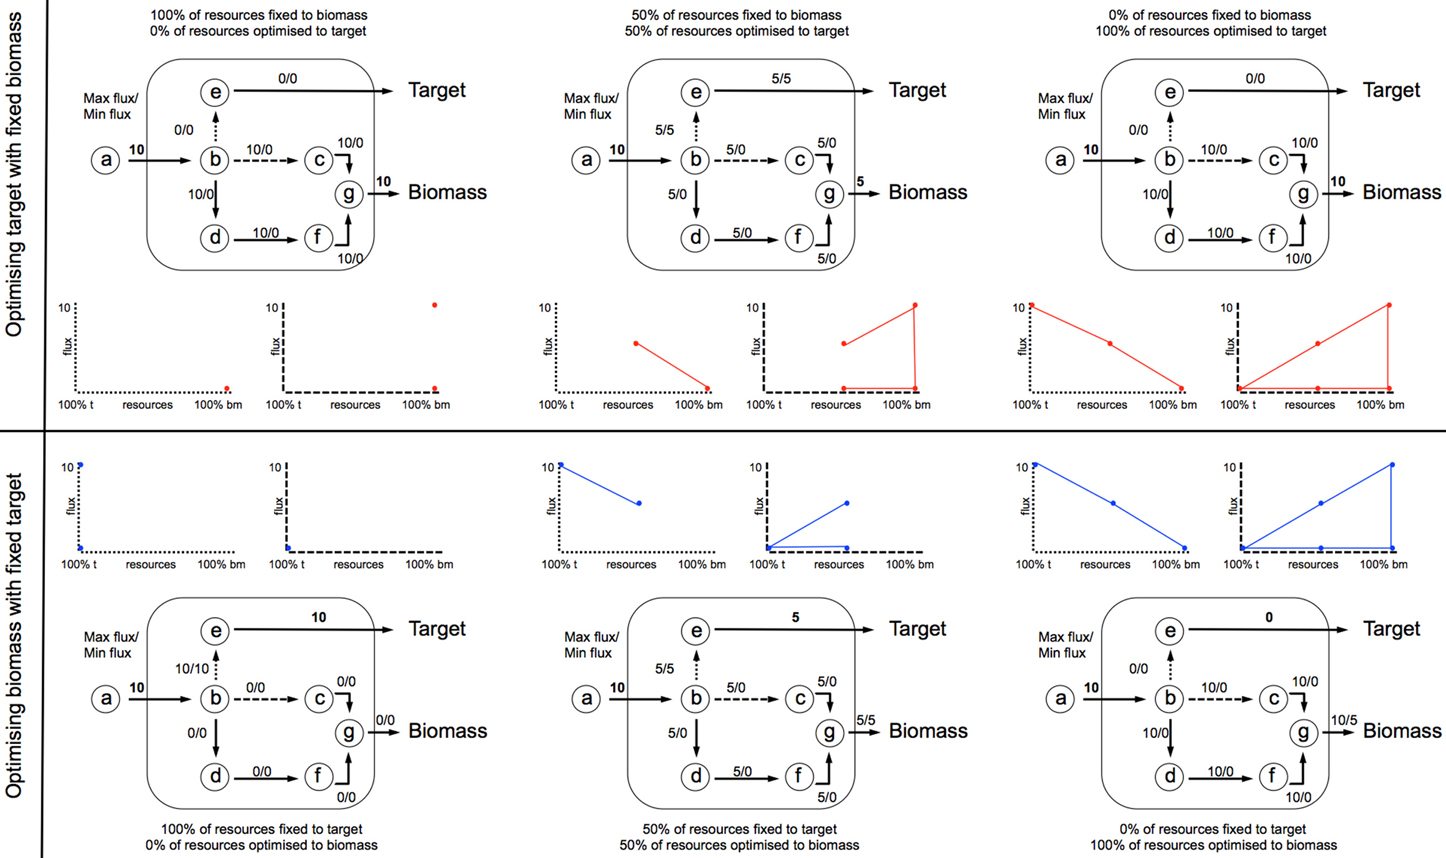
Figure 4. FVA is performed to compute the flux variability of each reaction: (1) at different percentage (0–100%) of ybm whilst optimizing target product; and (2) at different percentage (0–100%) of ytarget, whilst optimizing biomass. Each iteration develops a profile of v(i)min and v(i)max across the range of flux space. In this example an input flux of 10 units through v1 is fixed, and the network optimized to situation 1 (top profile), or 2 (bottom profile).
Over-Expression Ranking
The characteristics of a strong over-expression target can be seen in the lower quartile of x axis in Figure 5B, where at 0-25% of ybm (red shaded area) v(i)min|target has a higher flux capacity than 75-100% of ytarget (blue shaded area), v(i)min|biomass (target extra flux, see Equation 5). A lower variability is also desirable for optimizing target subject to 0-25% of ybm (target variability, Equation 6) as it ensures that the minimum flux the reaction can carry is close to optimum. The final ranking (RiOEx) is determined using Equation (7), where reactions with the highest RiOex are the most likely over-expression targets. An example of a weaker over-expression target (corresponding to a lower RiOEx) is shown in Figure 5C, which illustrates an over-expression that will increase flux to both target and biomass. Negative RiOEx represent potential dampening targets (see Figure 5D), which display the opposite characteristics.
Target extra flux:
Target variability:
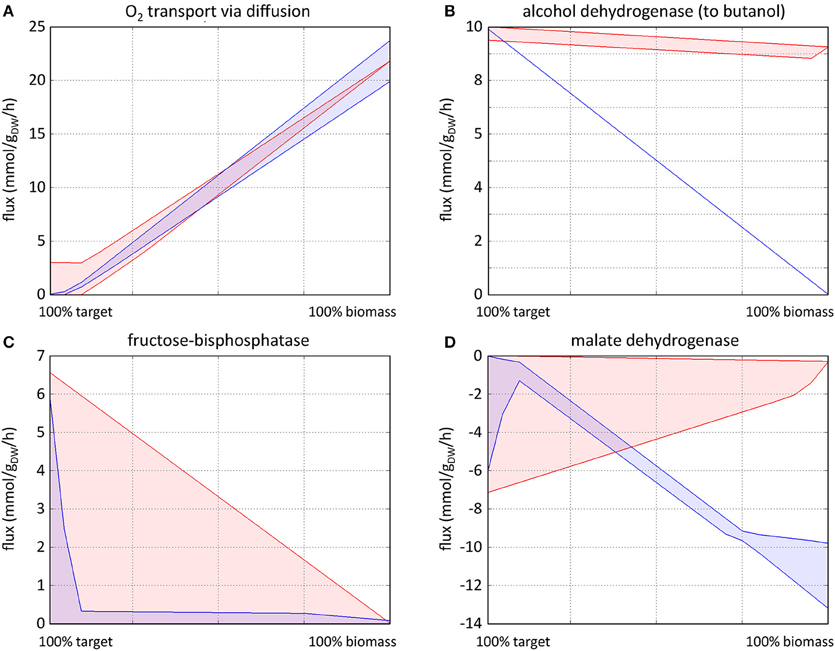
Figure 5. Typical FVA profiles characteristic of knockout targets (A), strong overexpression targets (B), weak overexpression targets (C), and dampening targets (D). The red profiles show FVAp of each reaction at different percentages of (0–100%) of ybm whilst optimizing target product. The blue profiles show FVAp at different percentages of (0–100%) of ytarget whilst optimizing biomass. Knockout targets (A) are identified using (75–100%) of ybm (corresponding to the fourth quartile of x axis) with target optimization: where v(i)max|target increases as ybm increases, coupled with a reduced variability between v(i)max|target and v(i)min|target. Strong overexpression targets (B) are identified using (0–25%) of ybm optimizing target, and (75–100%) of ytarget optimizing biomass (corresponding to the first quartile of x axis), where v(i)max|target (red) has a higher flux carrying capacity than v(i)max|biomass (blue), again with reduced variability between v(i)max|target and v(i)min|target. Weak overexpression targets (C) show similar characteristics, with a smaller difference between v(i)min|target and v(i)min|biomass and a larger variability between v(i)min|target and v(i)min|target. Profiles of dampening targets (D) are the reverse of overexpression targets.
OptKnock and RobustKnock
The OptKnock algorithm (Burgard et al., 2003) is available in the COBRA Toolbox for Matlab, and RobustKnock algorithm is available as a Matlab script from the original paper (Tepper and Shlomi, 2010). Both are repackaged in Supplementary File 1 allowing for reproduction of the following results.
Results
As a case study, RobOKoD was applied to design an E. coli strain with a reverse β-oxidation cycle for butanol production. These results can be recreated by unzipping the code in Supplementary File 1, and running the test script iNS142_butanol.m in Matlab [requires the COBRA Toolbox (Schellenberger et al., 2011), and if RobustKnock is to be tested, the Tomlab solver (Tomlab Optimization Inc., Västerås, Sweden)]. This test script runs RobOKoD over a maximum of five iterations of knockout scoring, implementing the highest scoring knockout, generating a results document and reaction FVA profile plots for each iteration in the directory iNS142_butanol_results, and outputting an updated SBML model in which the knockouts have been implemented. It subsequently runs over-expression ranking, again generating output in the iNS142_butanol_results directory. OptKnock and RobustKnock are then run in order to compare predictions from each method. Knockout scoring, over-expression rankings, and FVA profiles for all relevant reactions (such as those illustrated in Figure 3) can then be inspected manually.
MCT allows the identification of reactions which consume metabolites present in the optimal target production pathway that demonstrate flux loss toward biomass. These reactions are flagged in the listing of potential knockouts with a value of 1, allowing these reactions to be identified preferentially, out a set of reactions with the same knockout score. In this network, pyruvate was identified as a key metabolite where flux loss to biomass production could occur, 11 reactions were then identified that consume pyruvate.
FVA profiles representative of the different situations commonly encountered are shown in Figure 5. Knockout targets (Figure 5A) are identified based on fixed biomass optimal target FVAp (red profile). As the percentage of fixed biomass increases, the flux through the reaction increases to accommodate a higher biomass requirement, and the variability of the flux narrows. Strong overexpression targets (Figure 5B) show the opposite behavior of knockouts, whereby the flux through the reaction reduces as the percentage of fixed target is reduced as biomass is optimized (blue profile). Weak overexpression targets (Figure 5C) show similar characteristics, but are not required to carry a flux for the target to be optimized. Dampening targets (Figure 5D) are characterized by their ability to carry higher flux through a reactions at low percentage of fixed target with optimized biomass, than at both a high percent of fixed target and optimized biomass, and a low percent of fixed biomass and optimized target.
It is noted that some reactions obtain identical scores, hence their deletion are predicted to have the same impact on the system. This is for instance the case for two consecutive reactions of an unbranched, linear pathway. More generally, this is observed for the subsets of reactions that carry perfectly correlated fluxes (Heiner, 2009; Feist et al., 2010). A feature of RobOKoD is therefore its ability to identify such subsets of reactions. The corresponding knockouts are expected to result in a similar phenotype, hence the modification to perform for such subsets of reactions should be evaluated in the light of technical considerations. The most practical modifications should be selected, whilst the resulting strain should still be amongst the optimal producers.
For comparison purpose, the well-established algorithms OptKnock and RobustKnock were applied on the same model to predict the optimal strain for butanol production. For each method, the maximum number of modifications was fixed to five, since constructing such a strain can still be managed experimentally. The optimal producer strains predicted by each method are listed in Table 3 and are compared to the most efficient producer strain which has been experimentally validated (Dellomonaco et al., 2011). OptKnock and RobustKnock predicted strains that were theoretically unable to produce butanol during growth, and in the case of OptKnock, not viable for growth.
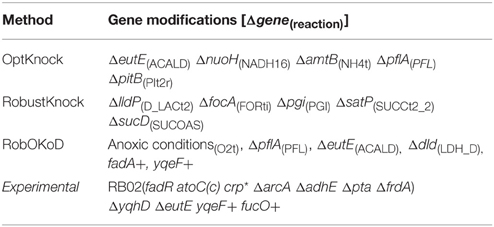
Table 3. Gene modifications, based on the reactions predicted by the three computational methods, and their comparison with those successfully applied experimentally (Dellomonaco et al., 2011).
Table 4 compares the functionality modifications of the predicted in silico cells, and the experimental strain. It appears that RobOKoD automatically captures most of the functional modifications experimentally carried out. In particular, it predicted that fermentation pathways (pfl, ldhA) should be knocked out to avoid diversion of carbon and reduced cofactors toward by-products of poor interest. Moreover, by highlighting the competing interests of oxygen uptake pathway between the production of biomass and butanol, RobOKoD was able to indicate an anoxic condition change, similar to the experimental strain which knocked-out fumarate reductase and was grown under microaerobic conditions.
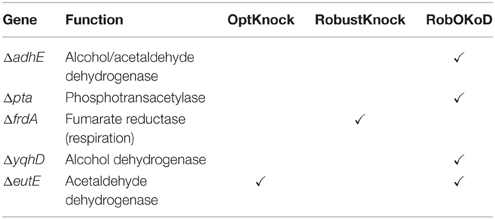
Table 4. Functional similarities captured in the gene manipulations predicted by each method.
In addition to the knockout predictions, RobOKoD was also able to predict over-expression and dampening targets. It predicted that enzymes catalyzing the reactions associated with the reverse β-oxidation cycle should be over-expressed, consistent with the experimental strain where the activity of transcriptional inhibitors of this pathway are dampened (fadR, atoC(c), crp*, and ΔarcA strains). Moreover, RobOKoD also predicts that a number of transport reactions (or rather genes encoding the relevant transport proteins) should be dampened, hence providing additional modifications that could enhance butanol production. These dampening predictions, less intuitive, were not carried out in the experimental strain and have not been experimentally verified.
Table 5 compares the molar production of butanol per mole of glucose uptake, when the objective of the cell is to optimize biomass. It shows that RobOKoD predicted the most successful butanol strain design, with molar ratio values similar to that achieved in the experimental strain. Neither OptKnock or RobustKnock predicted successful strains, and in the case of OptKnock, the strain was predicted to be no longer viable.
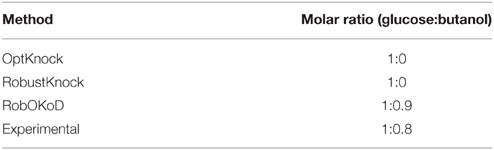
Table 5. Molar ratio of glucose:butanol produced in predicted strains.
The strain predicted by RobOKoD was developed iteratively by automatically knocking out the highest ranked suggested knockout target, that also was flagged by MCT as a potential route for flux loss from the butanol production pathway. This was to prevent selection bias for trialing its validity. It is strongly recommended to use the method more flexibly, looking at the FVAp graphs that are produced for the reactions, knowledge of the organism, and the scorings in order to decide on suitable knockouts.
Discussion
These results illustrate two limitations of OptKnock and RobustKnock. First, the knockout predictions are deterministic, not ranked, and a unique set of knockouts is predicted. As shown by these results, different knockouts which may give similar phenotypes cannot be identified by these algorithms. With RobOKoD, a score is attributed to each modification, and one can readily check whether some modifications are expected to result in similar phenotypes and select those that can be more easily implemented experimentally. Secondly, OptKnock and RobustKnock are unable to predict over-expression or dampening strategies, which are of prime interest to increasing or decreasing flux down key pathways, respectively. However, it is argued that using a range of available techniques may help to build up a more comprehensive understanding of the system, and comparing the results obtained by different methods (e.g., Burgard et al., 2003; Choi et al., 2010; Tepper and Shlomi, 2010; Park et al., 2012) would be the most valuable strategy for designing producing strains.
It is also important to note that constraint-based modeling is not appropriate in all instances for prediction of suitable strains for target molecule production. FBA, a key method of assessing the functionality of a given strain, has the flaw whereby side reactions are not predicted to be carrying flux in silico as this would reduce the optimal resources that are routed to growth. An example being FBA run on yeast not producing ethanol under an intuitively appealing set of constraints (Westerhoff et al., 2009). This means that only solutions for target production pathways which are heavily coupled with growth can be identified. This is not an issue in most cases since a viable strain is desired but limits the applicability of this framework in particular cases, for example, when there is a need to decouple production from growth. It also means that the false negative rate for in silico strain predictions is high, with many successful laboratory strains not appearing so when translated to an in silico model. In future the field needs to look more toward different ways of predicting metabolic fluxes. Combining kinetic and stoichiometric models of the metabolic system (Chowdry et al., 2014) provides additional levels of constraints (including enzyme inhibition and activation) and is expected to improve the prediction of effective interventions. A longer term goal is therefore the production of detailed, large-scale kinetic models of the whole metabolic system (Stanford et al., 2013).
When running OptKnock and RobustKnock, it was clear that OptKnock was more user friendly, owing to it being made available in the COBRA Toolbox for Matlab and therefore applicable to a number of MILP (mixed integer linear programming) solvers. This was not the case for RobustKnock, which required a non-standardized model structure and the use of a specific solver, Tomlab, which has limited free access. An additional goal of designing RobOKoD was therefore to ensure its accessibility and robustness by reusing freely-accessible solvers, extensively validated COBRA Toolbox methods, and standardized model formats such as SBML.
A necessary future direction for both RobOKoD and existing tools such as OptKnock and RobustKnock will be to move to making predictions regarding knockouts, over-expressions, etc. at the level of the gene, rather than, as currently, at the level of the reaction. Due to the presence of both isoenzymes and promiscuous enzymes, it is clear that there is not a 1:1 mapping between gene and reaction. Consequently, manipulation of a given gene is likely to affect a number of reactions. Modification of this method to consider the gene-protein-reaction (GPR) relationships that are present in many genome-scale metabolic models will be a priority for future development.
To summarize, RobOKoD provides an additional tool to aid the task of designing strains for the (over)production of target products. It is able to predict and rank knockouts, over-expressions, and dampening targets. While predicting an optimized set of gene modifications to implement, unlike other methods, RobOKoD also provides lists of candidate modifications, along with graphical flux variability profiles, allowing the user to manually validate the set of predictions. Such a flexible approach—particularly when used in conjunction with other analysis methods mentioned previously—will allow for sensible gene manipulation approaches to be taken into the laboratory.
Author Contributions
NJS conceived the study, led the project, developed the method and the code, and wrote and led the writing of the manuscript. PM contributed to the method conception and development, and writing of the manuscript. NS contributed to the code development and the writing of the manuscript.
Conflict of Interest Statement
The authors declare that the research was conducted in the absence of any commercial or financial relationships that could be construed as a potential conflict of interest.
Acknowledgments
NJS is grateful for funding under grant code BB/M013189/1, and the European Union under the Preparatory Phase Projects in the framework of FP7 (project reference 312455). PM received the support of the INRA (program CJS) and of the European Union in the framework of the Marie-Curie FP7 COFUND People Program, through the award of an AgreenSkills fellowship (under grant agreement n° 267196). NS is grateful to the BBSRC for funding under grant code BB/K019783/1. All authors thank both Ettore Murabito and Michael Howard for useful discussions whilst developing this work.
Supplementary Material
The Supplementary Material for this article can be found online at: http://www.frontiersin.org/journal/10.3389/fcell.2015.00017/abstract
References
Angermayr, S. A., van der Woude, A. D., Correddu, D., Vreugdenhil, A., Verrone, V., and Hellingwerf, K. J. (2014). Exploring metabolic engineering design principles for the photosynthetic production of lactic acid by Synechocystis sp. PCC6803. Biotechnol. Biofuels 7:99. doi: 10.1186/1754-6834-7-99
PubMed Abstract | Full Text | CrossRef Full Text | Google Scholar
Atsumi, S., Higashide, W., and Liao, J. C. (2009). Direct photosynthetic recycling of carbon dioxide to isobutyraldehyde. Nat. Biotechnol. 27, 1177–1180. doi: 10.1038/nbt.1586
PubMed Abstract | Full Text | CrossRef Full Text | Google Scholar
Ballerstein, K., von Kamp, A., Klamt, S., and Haus, U. U. (2012). Minimal cut sets in a metabolic network are elementary modes in a dual network. Bioinformatics 28, 381–387. doi: 10.1093/bioinformatics/btr674
PubMed Abstract | Full Text | CrossRef Full Text | Google Scholar
Büchel, F., Rodriguez, N., Swainston, N., Wrzodek, C., Czauderna, T., Keller, R., et al. (2013). Path2Models: large-scale generation of computational models from biochemical pathway maps. BMC Syst. Biol. 7:116. doi: 10.1186/1752-0509-7-116
PubMed Abstract | Full Text | CrossRef Full Text | Google Scholar
Burgard, A. P., Pharkya, P., and Maranas, C. D. (2003). Optknock: a bilevel programming framework for identifying gene knockout strategies for microbial strain optimization. Biotechnol. Bioeng. 84, 647–657. doi: 10.1002/bit.10803
PubMed Abstract | Full Text | CrossRef Full Text | Google Scholar
Choi, H. S., Lee, S. Y., Kim, T. Y., and Woo, H. M. (2010). In silico identification of gene amplification targets for improvement of lycopene production. Appl. Environ. Microbiol. 76, 3097–3105. doi: 10.1128/AEM.00115-10
PubMed Abstract | Full Text | CrossRef Full Text | Google Scholar
Chowdry, A., Zomorrodi, A. R., and Maranas, C. D. (2014). k-OptForce: integrating kinetics with flux balance analysis for strain design. PLoS Comput. Biol. 10:e1003487. doi: 10.1371/journal.pcbi.1003487
PubMed Abstract | Full Text | CrossRef Full Text | Google Scholar
de Figueiredo, L. F., Podhorski, A., Rubio, A., Kaleta, C., Beasley, J. E., Schuster, S., et al. (2009). Computing the shortest elementary flux modes in genome-scale metabolic networks. Bioinformatics 25, 3158–3165. doi: 10.1093/bioinformatics/btp564
PubMed Abstract | Full Text | CrossRef Full Text | Google Scholar
Dellomonaco, C., Clomburg, J. M., Miller, E. N., and Gonzalez, R. (2011). Engineered reversal of the β-oxidation cycle for the synthesis of fuels and chemicals. Nature 476, 355–359. doi: 10.1038/nature10333
PubMed Abstract | Full Text | CrossRef Full Text | Google Scholar
Dobson, P. D., Smallbone, K., Jameson, D., Simeonidis, E., Lanthaler, K., Pir, P., et al. (2010). Further developments towards a genome-scale metabolic model of yeast. BMC Syst. Biol. 4:145. doi: 10.1186/1752-0509-4-145
PubMed Abstract | Full Text | CrossRef Full Text | Google Scholar
Feist, A. M., Henry, C. S., Reed, J. L., Krummenacker, M., Joyce, A. R., Karp, P. D., et al. (2007). A genome-scale metabolic reconstruction for Escherichia coli K-12 MG1655 that accounts for 1260 ORFs and thermodynamic information. Mol. Syst. Biol. 3:121. doi: 10.1038/msb4100155
PubMed Abstract | Full Text | CrossRef Full Text | Google Scholar
Feist, A. M., Zielinski, D. C., Orth, J. D., Schellenberger, J., Herrgard, M. J., and Palsson, B. Ø. (2010). Model-driven evaluation of the production potential for growth-coupled products of Escherichia coli. Metab. Eng. 12, 173–186. doi: 10.1016/j.ymben.2009.10.003
PubMed Abstract | Full Text | CrossRef Full Text | Google Scholar
Gudmundsson, S., and Thiele, I. (2010). Computationally efficient flux variability analysis. BMC Bioinformatics 11:489. doi: 10.1186/1471-2105-11-489
PubMed Abstract | Full Text | CrossRef Full Text | Google Scholar
Harcombe, W. R., Delaney, N. F., Leiby, N., Klitgord, N., and Marx, C. J. (2013). The ability of flux balance analysis to predict evolution of central metabolism scales with the initial distance to the optimum. PLoS Comput. Biol. 9:e1003091. doi: 10.1371/journal.pcbi.1003091
PubMed Abstract | Full Text | CrossRef Full Text | Google Scholar
Heavner, B. D., Smallbone, K., Barker, B., Mendes, P., and Walker, L. P. (2012). Yeast 5 – an expanded reconstruction of the Saccharomyces cerevisiae metabolic network. BMC Syst. Biol. 6:55. doi: 10.1186/1752-0509-6-55
PubMed Abstract | Full Text | CrossRef Full Text | Google Scholar
Heiner, M. (2009). “Understanding network behavior by structured representations of transition invariants,” in Algorithmic Bioprocesses: Natural Computing Series, eds A. Condon, D. Harel, J. N. Kok, A. Salomaa, and E. Winfree (Berlin; Heidelberg: Springer-Verlag), 367–389.
Hucka, M., Finney, A., Sauro, H. M., Bolouri, H., Doyle, J. C., Kitano, H., et al. (2003). The systems biology markup language (SBML): a medium for representation and exchange of biochemical network models. Bioinformatics 19, 524–531. doi: 10.1093/bioinformatics/btg015
PubMed Abstract | Full Text | CrossRef Full Text | Google Scholar
Joyce, A. R., and Palsson, B. Ø. (2008). Predicting gene essentiality using genome-scale in silico models. Methods Mol. Biol. 416, 433–457. doi: 10.1007/978-1-59745-321-9_30
PubMed Abstract | Full Text | CrossRef Full Text | Google Scholar
Kitano, H. (2002). Systems biology: a brief overview. Science 295, 1662–1664. doi: 10.1126/science.1069492
PubMed Abstract | Full Text | CrossRef Full Text | Google Scholar
Koide, T., Pang, W. L., and Baliga, N. S. (2009). The role of predictive modelling in rationally re-engineering biological systems. Nat. Rev. Microbiol. 7, 297–305. doi: 10.1038/nrmicro2107
PubMed Abstract | Full Text | CrossRef Full Text | Google Scholar
Lee, D., Smallbone, K., Dunn, W. B., Murabito, E., Winder, C. L., Kell, D. B., et al. (2012). Improving metabolic flux predictions using absolute gene expression data. BMC Syst. Biol. 6:73. doi: 10.1186/1752-0509-6-73
PubMed Abstract | Full Text | CrossRef Full Text | Google Scholar
Li, X., Guo, D., Cheng, Y., Zhu, F., Deng, Z., and Liu, T. (2014). Overproduction of fatty acids in engineered Saccharomyces cerevisiae. Biotechnol. Bioeng. 111, 1841–1852. doi: 10.1002/bit.25239
PubMed Abstract | Full Text | CrossRef Full Text | Google Scholar
Liao, Y. C., Huang, T. W., Chen, F. C., Charusanti, P., Hong, J. S., Chang, H. Y., et al. (2011). An experimentally validated genome-scale metabolic reconstruction of Klebsiella pneumoniae MGH 78578, iYL1228. J. Bacteriol. 193, 1710–1717. doi: 10.1128/JB.01218-10
PubMed Abstract | Full Text | CrossRef Full Text | Google Scholar
Lo, T. M., Teo, W. S., Ling, H., Chen, B., Kang, A., and Chang, M. W. (2013). Microbial engineering strategies to improve cell viability for biochemical production. Biotechnol. Adv. 31, 903–914. doi: 10.1016/j.biotechadv.2013.02.001
PubMed Abstract | Full Text | CrossRef Full Text | Google Scholar
Ng, C. Y., Jung, M.-Y., Lee, J., and Oh, M.-K. (2012). Production of 2,3-butanediol in Saccharomyces cerevisiae by in silico aided metabolic engineering. Microb. Cell Fact. 11:68. doi: 10.1186/1475-2859-11-68
PubMed Abstract | Full Text | CrossRef Full Text | Google Scholar
Orth, J. D., Thiele, I., and Palsson, B. Ø. (2010). What is flux balance analysis? Nat. Biotechnol. 28, 245–248. doi: 10.1038/nbt.1614
PubMed Abstract | Full Text | CrossRef Full Text | Google Scholar
Park, J. M., Park, H. M., Kim, W. J., Kim, H. U., Kim, T. Y., and Lee, S. Y. (2012). Flux variability scanning based on enforced objective flux for identifying gene amplification targets. BMC Syst. Biol. 6:106. doi: 10.1186/1752-0509-6-106
PubMed Abstract | Full Text | CrossRef Full Text | Google Scholar
Pharkya, P., and Maranas, C. D. (2006). An optimization framework for identifying reaction activation/inhibition or elimination candidates for overproduction in microbial systems. Metab. Eng. 8, 1–13. doi: 10.1016/j.ymben.2005.08.003
PubMed Abstract | Full Text | CrossRef Full Text | Google Scholar
Rocha, I., Maia, P., Evangelista, P., Vilaça, P., Soares, S., Pinto, J. P., et al. (2010). OptFlux: an open-source software platform for in silico metabolic engineering. BMC Syst. Biol. 4:45. doi: 10.1186/1752-0509-4-45
PubMed Abstract | Full Text | CrossRef Full Text | Google Scholar
Sauer, U. (2006). Metabolic networks in motion: 13C-based flux analysis. Mol. Syst. Biol. 2, 62. doi: 10.1038/msb4100109
PubMed Abstract | Full Text | CrossRef Full Text | Google Scholar
Schellenberger, J., Que, R., Fleming, R. M., Thiele, I., Orth, J. D., Feist, A. M., et al. (2011). Quantitative prediction of cellular metabolism with constraint-based models: the COBRA Toolbox v2.0. Nat. Protoc. 6, 1290–1307. doi: 10.1038/nprot.2011.308
PubMed Abstract | Full Text | CrossRef Full Text | Google Scholar
Stanford, N. J., Lubitz, T., Smallbone, K., Klipp, E., Mendes, P., and Liebermeister, W. (2013). Systematic construction of kinetic models from genome-scale metabolic networks. PLoS ONE 8:e79195. doi: 10.1371/journal.pone.0079195
PubMed Abstract | Full Text | CrossRef Full Text | Google Scholar
Tepper, N., and Shlomi, T. (2010). Predicting metabolic engineering knockout strategies for chemical production: accounting for competing pathways. Bioinformatics 26, 536–543. doi: 10.1093/bioinformatics/btp704
PubMed Abstract | Full Text | CrossRef Full Text | Google Scholar
Thiele, I., and Palsson, B. Ø. (2010). A protocol for generating a high-quality genome-scale metabolic reconstruction. Nat. Protoc. 5, 93–121. doi: 10.1038/nprot.2009.203
PubMed Abstract | Full Text | CrossRef Full Text | Google Scholar
Varman, A. M., Xiao, Y., Leonard, E., and Tang, Y. J. (2011). Statistics-based model for prediction of chemical biosynthesis yield from Saccharomyces cerevisiae. Microb. Cell Fact. 10:45. doi: 10.1186/1475-2859-10-45
PubMed Abstract | Full Text | CrossRef Full Text | Google Scholar
von Kamp, A., and Klamt, S. (2014). Enumeration of smallest intervention strategies in genome-scale metabolic networks. PLoS Comput. Biol. 10:e1003378. doi: 10.1371/journal.pcbi.1003378
PubMed Abstract | Full Text | CrossRef Full Text | Google Scholar
Westerhoff, H. V., Winder, C., Messiha, H., Simeonidis, E., Adamczyk, M., Verma, M., et al. (2009). Systems biology: the elements and principles of life. FEBS Lett. 583, 3882–3890. doi: 10.1016/j.febslet.2009.11.018
PubMed Abstract | Full Text | CrossRef Full Text | Google Scholar
Yuan, Y., Bi, C., Nicolaou, S. A., Zingaro, K. A., Ralston, M., and Papoutsakis, E. T. (2014). Overexpression of the Lactobacillus plantarum peptidoglycan biosynthesis murA2 gene increases the tolerance of Escherichia coli to alcohols and enhances ethanol production. Appl. Microbiol. Biotechnol. 98, 8399–8411. doi: 10.1007/s00253-014-6004-0
PubMed Abstract | Full Text | CrossRef Full Text | Google Scholar
Reaction Abbreviations
Keywords: synthetic biology, systems biology, metabolic engineering, strain design, constraint-based modeling
Citation: Stanford NJ, Millard P and Swainston N (2015) RobOKoD: microbial strain design for (over)production of target compounds. Front. Cell Dev. Biol. 3:17. doi: 10.3389/fcell.2015.00017
Received: 03 November 2014; Accepted: 25 February 2015;
Published: 24 March 2015.
Edited by:
Markus J. Herrgard, Technical University of Denmark, DenmarkReviewed by:
Monika Heiner, Brandenburg University of Technology Cottbus-Senftenberg, GermanyOsbaldo Resendis-Antonio, Instituto Nacional de Medicina Genomica, Mexico
Copyright © 2015 Stanford, Millard and Swainston. This is an open-access article distributed under the terms of the Creative Commons Attribution License (CC BY). The use, distribution or reproduction in other forums is permitted, provided the original author(s) or licensor are credited and that the original publication in this journal is cited, in accordance with accepted academic practice. No use, distribution or reproduction is permitted which does not comply with these terms.
*Correspondence: Natalie J. Stanford, School of Computer Science, University of Manchester, Oxford Road, Manchester M13 9PL, UK natalie.stanford@manchester.ac.uk