 David John Coe
 Madhav Kishore
 Federica Marelli-Berg
- Department of Biochemical Pharmacology, William Harvey Research Institute, Queen Mary University, London, UK
It is now well established that the effector T cell (Teff) response is regulated by a series of metabolic switches. Quiescent T cells predominantly require adenosine triphosphate-generating processes, whereas proliferating Teff require high metabolic flux through growth-promoting pathways, such as glycolysis. Pathways that control metabolism and immune cell function are intimately linked, and changes in cell metabolism at both the cell and system levels have been shown to enhance or suppress specific T cell effector functions. Furthermore, functionally distinct T cell subsets require distinct energetic and biosynthetic pathways to support their specific functional needs. In particular, naturally occurring regulatory T cells (Treg) are characterized by a unique metabolic signature distinct to that of conventional Teff cells. We here briefly review the signaling pathways that control Treg metabolism and how this metabolic phenotype integrates their differentiation and function. Ultimately, these metabolic features may provide new opportunities for the therapeutic modulation of unwanted immune responses.
Metabolic Features of Regulatory T Cells
T cell differentiation and fate are orchestrated by signaling events involving the T cell receptor (TCR), co-stimulatory or co-inhibitory receptor stimulation, and cytokines. In addition, a variety of other environmental factors can also contribute to this decision. T cells switch between highly proliferative states (i.e., developing thymocytes and activated proliferating T cells) and quiescent states (i.e., naive, memory, and anergic T cells), characterized by the activation of different intracellular metabolic pathways (1). T cells use glucose as their primary fuel source for generation of adenosine triphosphate (ATP) and it is necessary for cell survival, growth, activation, proliferation, and cytokine production (2, 3).
T cell receptor stimulation is accompanied by signals from growth factors and cytokines such as interleukin (IL)-2 or IL-7, and co-stimulatory molecules, such as CD28, which lead to an increase in glucose uptake and glycolysis through induction of phosphoinositide-3-kinase (PI3K)-dependent activation of Akt (4). Akt induces glucose metabolism by facilitating glucose uptake via the upregulation of glucose transporter 1 (Glut1) on the T cell membrane (5). Failure of T cells to up-regulate glucose metabolism results in decreased cytokine production, proliferation, and ultimately to apoptosis (6–8) or anergy (9). An increase in the rate of protein synthesis also occurs following T cell activation and is regulated via Akt, which controls the activation of the mammalian target of rapamycin (mTOR), which is a key regulator of protein synthesis in T cells (10, 11).
Naturally occurring regulatory T cells (Treg), defined as CD4+CD25+Foxp3+ T cells, play a non-redundant role in the maintenance of physiological tolerance to self-antigens and prevention of autoimmune responses (12, 13). Treg generation in the thymus is promoted by recognition of self-peptides with intermediate affinity (14). Treg cells are characterized by a specific metabolic signature regulating their responsiveness to antigenic stimulations when compared to other CD4+ T cell subsets (15–18). Specifically, Th1, Th2, and Th17 cells express high surface levels of Glut1 and are highly glycolytic. Treg, in contrast, express low levels of Glut1 and have high lipid oxidation rates in vitro (19). Furthermore, blocking glycolysis promotes Treg cell generation through the transcription factor hypoxia-inducible factor 1α (HIF1α), whose induction required mTOR pathway activation (20). In turn, HIF1α enhances Th17 development through direct transcriptional activation of RORγt, and concurrently, it attenuates Treg development, by binding FoxP3 and targeting it for proteasomal degradation.
Collectively, these observations underscore the key role of metabolic cues and regulatory pathways in defining T cell differentiation and function (Figure 1).
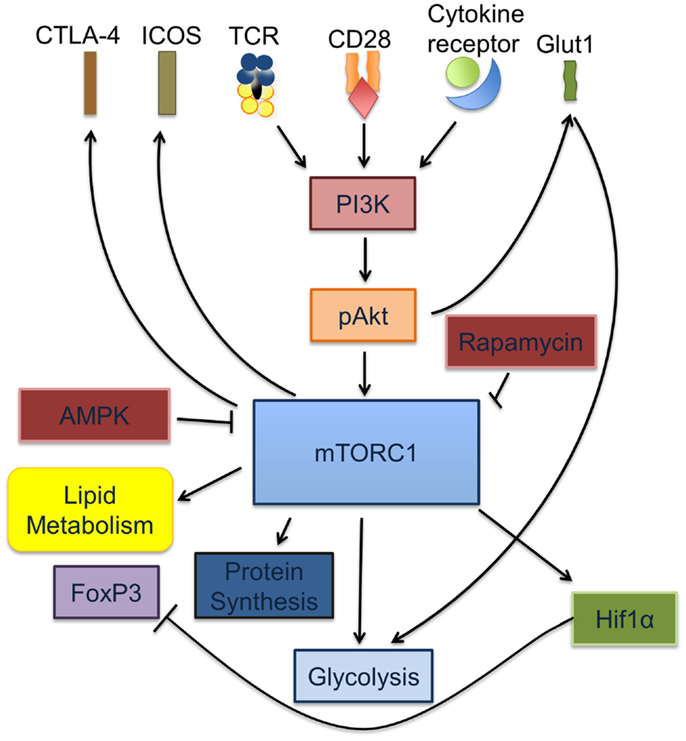
Figure 1. mTORC1 is a key regulator of Treg and Teff activation and differentiation. Signaling through the TCR is accompanied by cytokine signals from IL-2, IL-7, and leptin as well as co-stimulation via CD28. Together, these signals cause increased glycolysis through the induction of PI3K-dependent activation of Akt, which in turn increases glucose transport via the upregulation of Glut1 on the T cell surface. Activated pAkt increases the rate of protein synthesis via activation of mTORC1. Activated mTORC1 activates HIF1α, regulates lipid metabolism and glycolysis.
mTOR Inhibition and Treg Differentiation
The mTOR is a key regulator of T cell metabolism, that serves to integrate nutrient sensing pathways with signaling pathways involved in differentiation, growth, survival, and proliferation (21). TCR and co-stimulatory signals along with cytokines tweak the mTOR pathway via the upstream PI3K/Akt signaling networks to match the energy requirements associated with T cell activation (22, 23). Conventional CD4+ and CD8+ T cells, upon stimulation, utilize the mTOR pathway to meet the increased metabolic demands of T cell activation by switching from primarily oxidative phosphorylation, seen in resting T cells, toward a state of enhanced aerobic glycolysis, a phenomenon popularly described as the Warburg effect (3, 24, 25). The importance of this phenomenon in determining T cell fate was first noticed using the selective inhibitor of mTOR, rapamycin, which prevented the generation of Teff responses and promoted the generation of Treg cells (9, 26–28). Additionally, T cell-specific mTOR knockouts were shown to have poor Teff responses and defaulted toward a more Treg phenotype (29). These studies not only revealed the importance of mTOR as a critical regulator in the differentiation of Treg, but also highlighted the importance of the metabolic pathways that predominate within functionally different T cell subsets.
Consistent with the above findings, Treg display higher levels of AMP kinase activity and preferential lipid oxidation for their energy requirements (19). The AMP-activated kinase acts as a sensor of the AMP/ATP ratio, which is increased during hypoxia and inhibits mTOR kinase to promote mitochondrial oxidative metabolism rather than glycolysis (30, 31). Interestingly, activation of AMP kinase via Metformin, a drug used to treat diabetes mellitus, increased the Treg population in the CD4+ T cell compartment in an in vivo murine model of asthma (19). In this study, mice sensitized by aerosol to ovalbumin in the presence of metformin, and challenged 21 days later showed an increase in the frequency and number of CD4+Foxp3+ T cells in the draining lymph nodes as compared to mice immunized in the absence of metformin. However, no change in airway responsiveness was noted even though there were fewer lymphocytes recovered in the bronchial alveolar lavage in the metformin treated animals. Additionally, inhibition of mitochondrial lipid uptake and oxidation pathways by Etomoxir, an inhibitor that prevents long chain fatty acid uptake to the inner mitochondrial membrane for beta oxidation, abrogated the generation of Treg without altering Teff differentiation (19). Furthermore, Treg were shown to express lower levels of the glucose transporter Glut1 as compared to Teff, and transgenic CD4+ T cells overexpressing Glut1 were shown to develop fewer Treg. Overall, these studies indicate that fatty acid oxidation is the dominant metabolic process utilized for the generation of energy in Treg.
mTOR and Treg Function
While inhibition of mTOR enhances Treg generation during an immune response, mTOR activity is known to be required to maintain their suppressive capabilities. In this section, we review recent findings that investigated this apparent dichotomy in the function of mTOR in Treg biology. mTOR exists as two structurally distinct complexes (mTORC1 and mTORC2). Both complexes localize within different subcellular compartments and have different functions in the cell; rapamycin-sensitive mTORC1 forms the fundamental nutrient sensing complex that is activated by Akt kinase downstream of PI3K signaling induction (via the TCR, co-stimulatory receptors, and cytokines) whereas the rapamycin-insensitive mTORC2 controls spatial aspects of cell growth through activation of cytoskeletal components (32, 33). The mTORC2 complex also, in turn, activates the kinase Akt (34, 35). Thus, Akt lies both upstream and downstream of mTOR. In mice, CD4+ T cells lacking both mTORC1 and mTORC2 complexes fail to differentiate into any Teff lineage (Th1, Th2, or Th17) and instead differentiate toward the Treg cell phenotype, consistent with the CD4+ population of mTOR null mice (36). However, recent findings by Hu Zheng et al. indicate a crucial role of the mTORC1 complex to the suppressive activity of Treg (29). Indeed, mTORC1 activity was shown to be higher in Treg than naive T cells under steady state conditions. Impairment of the mTORC1 pathway in Treg via selective genetic deletion of Raptor, an obligatory component of mTORC1, in the CD4+ FOXP3+ compartment, led to the early onset of a fatal autoimmune disease in mice (29). Moreover, the disease mimicked the autoimmune disease seen in Scurfy mice that bear a loss-of-function mutation in the FoxP3 transcription factor, indicating impaired Treg function. Mechanistically, the mTORC1 pathway in Treg was shown to be necessary to initiate the upregulation of surface CTLA-4 and ICOS, key intrinsic receptors for Treg-mediated suppression. In addition, mTORC1 was shown to induce cholesterol and lipid metabolism as well as proliferation in the Treg population (29). Finally, recent investigations have revealed a non-redundant role of mTORC1 in mitochondrial metabolism (37). Collectively, these investigations imply a differential use of mTOR in Treg as compared to conventional effector cells.
A Model of Treg Differentiation Based on mTOR Activation
From the aforementioned studies, it is clear that the metabolic cues from the environment and subsequent mTOR activity play a key role in Treg differentiation. Powell et al. have proposed a model of Treg differentiation based on mTOR activity that mimics that seen in conventional T cell differentiation. Briefly, naïve T cells, receiving strong mTOR activation upon antigen recognition (through environmental cues, TCR, cytokine, and co-stimulatory stimulation), differentiated into short-lived Teff cells exhibiting high glycolytic activity, while those receiving weak mTOR activation developed into long-lived memory T cells dependent on oxidative phosphorylation to meet their energy needs (38). One can suggest that the high level of mTOR activity in Teff cells would be necessary to sustain higher demand for energy via glycolytic pathways while the opposite would hold true for quiescent memory T cells. A similar model can be applied to induced Treg where naïve T cells in the presence of TGF-β receiving either high or low mTOR activating signals could result in the differentiation of “effector” and “memory” Foxp3+ Treg respectively. As such, CD4+ Foxp3+ T cells that traffic to activating lymph nodes and become robustly stimulated (mTORhi) generate short-lived “effector” Treg. These effector Treg would then home to the tissues and control immune responses. This model can explain why T cells stimulated in vitro with high doses of peptide in the presence of exogenous TGF-β develop into Treg. These mTORhi Treg exhibit high glycolytic activity similar to that of conventional Teff cells (Figure 2). Consequently, this model can also be applied to natural Treg cells differentiation into effector or memory Treg arising through associated mTOR hi or low activity upon antigen recognition (38).
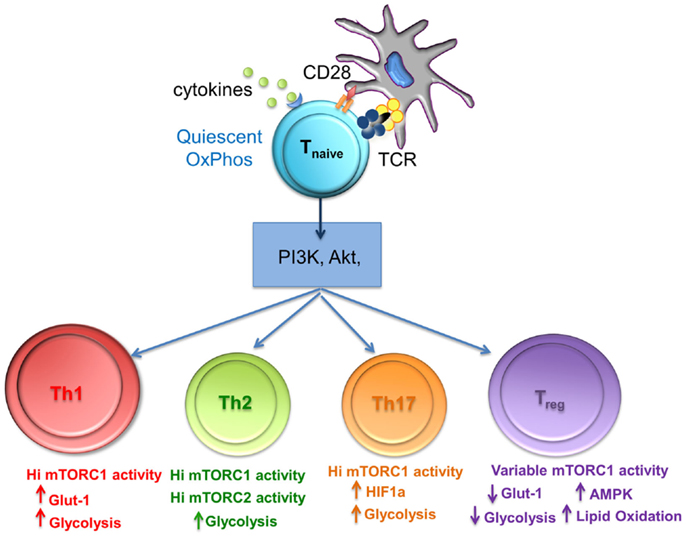
Figure 2. The level of mTORC1 activity and glycolysis is important for differentiation of T cell subsets. mTORC1 integrates nutrient sensing and signaling pathways to match the energy requirements of activated T cells. Th1, Th2, and Th17 cells require high levels of glycolysis that is mediated by high mTORC1 activity, whereas Treg differentiation requires variable mTorc activity, reduced glycolysis, and lipid oxidation.
Oscillating mTOR Activity Promotes Proliferation in Treg
A hallmark feature of Treg cells is their ability to proliferate abundantly in vivo while remaining anergic and poorly proliferative in vitro (39, 40). This anergic in vitro state was shown to be reversible via activation in the presence of supra-physiologic concentrations of IL-2 (41). In addition, short-term treatment of Treg with rapamycin preceding activation in the presence of supra-physiologic quantities of IL-2 was shown to promote proliferation in vitro at much higher levels than those induced by IL-2 alone. This posed a conundrum as to how two signals having opposite effects on mTOR activity can converge to enhance proliferation of Treg. To explain this phenomenon, a model was put forward (18), which postulates that mTOR activity in Treg is highly dynamic, oscillating between low and high activation states. As mentioned before, mTOR activity in Treg was shown to be higher at resting states when compared to naïve Teff. According to this model, the intermittent reduction in mTOR signaling followed by its enhanced activation by means of TCR triggering and IL-2 stimulation promotes Treg proliferation. However, Treg requirement for down-regulation of mTOR signaling was shown to be short-lived as protracted incubation with rapamycin ablated their proliferation. This model also identified the adipocyte hormone leptin as a key signal that regulates mTOR activity in vivo, promoting Treg proliferation. Within the immune system, leptin has been seen to activate pro-inflammatory cells while diminished leptin levels can lead to immunosuppression (42). Leptin produced by Treg cells was shown to contribute to the activation of the mTOR pathway in an autocrine manner. Other mechanisms through which mTOR activity is maintained in its oscillating state to overcome their hypo-responsiveness and enter the cell cycle continue to be investigated.
Metabolic Regulation of Treg and Th17 Differentiation
Interleukin-17 (Th17) producing and induced regulatory T cells (iTreg) differentiate from naïve CD4+ T cells and mediate diverse and often opposing effects in lymphoid and peripheral tissues. Under the influence of TGFβ and IL-2, naive T cells are induced to express the transcription factor FoxP3, and differentiate into tissue-resident iTreg, which support a suppressive environment. However, in the presence of IL-6, naive T cells stimulated with TGFβ express the transcription factors STAT3 and Rorγt, secrete IL-17, and produce an inflammatory environment.
It has recently emerged that metabolic factors can modulate the balance of Th17 and iTreg cells resulting in inflammation or actively maintained tolerance.
Commitment to the Th17 lineage, like other Teff, requires increased mTORC1 activity to sustain differentiation and function. As the presence of TGFβ is required for the development of both Th17 and Treg cell subsets, the relative differentiation of each cell type can be influenced by the level of mTORC1 activation. This interconnectivity is especially significant because of the opposing functions of the two cells types. The metabolic regulation and influence on the Th17:Treg ratio has been articulately reviewed by Barbi, Pardoll, and Fan-Pan (43) and so is briefly summarized here.
The activation of mTOR, and the subsequent switch to aerobic glycolysis, is essential for Th17 development; IL-1 enhances Th17 cell differentiation and proliferation via mTOR activation (44) whereas mTOR inhibition prevents Th17 differentiation (45, 46) and ameliorates Th17-dependent symptoms in a murine EAE model (47). Concomitantly, in these experiments, mTOR inactivation increases Treg cell numbers and function and sensitizes Treg to TGFβ (45, 48).
As well as mTOR, hypoxia-inducible factor (HIF1α), a transcription factor activated during inflammation and in response to low oxygen levels, is a critical regulator of metabolism. In T cells, HIF1α plays a role in inducing aerobic glycolysis even in the presence of plentiful oxygen (49). Elevated glycolysis in Th17 cells is dependent on HIF1α, and indeed, the transcription factor is essential for their differentiation and function (20). HIF1α activation, under aerobic conditions, is modulated by mTORC1 and therefore the concerted actions of HIF1α and mTORC1 preferentially guide Th17 cell development and effector functions. Furthermore, HIF1α directly binds to FoxP3 and targets it for proteosomal degradation while also increasing the transcription of the Th17-related transcription factor Rorγt. Mice with HIF1α-deficient T cells are resistant to Th17-dependent EAE with a response that is characterized by a decrease in Th17 cells and an increase in Treg cells (50). Thus, HIF1α and mTOR represent important mediators of the Th17:Treg balance in hypoxic and inflamed tissues, and as such are potentially important targets for clinical interventions.
Visceral Adipose Tissue-Associated Treg
Metabolic stress is also known to influence the development of Treg, and specifically to affect adipose-tissue-resident Treg cells. This population of Treg produces high levels of IL-10 and is characterized by the expression of GATA3, CCR2, KLRG1, and lack of CD103 expression (51). Visceral adipose tissue (VAT) Treg are thought to be important for the maintenance of responsiveness to insulin, by regulating adipokine release. In obese humans and mice, VAT Treg are progressively replaced by a pro-inflammatory Teff cell infiltrate, which accumulates in adipose tissue and produces cytokines that causes systemic low grade chronic inflammation (52–54), subsequently leading to insulin resistance and other obesity-related morbidities. VAT resident Treg negatively regulate inflammation and represent a tissue specific Treg population that express a distinct T cell repertoire (52) and a unique transcription factor, peroxisome-proliferator-activated receptor γ (PPARγ) (51). Obesity in mice and humans causes a reduction in VAT-associated Treg differentiation (55). Moreover, removal of VAT resident Treg by conditional knock-out of PPARγ, or activation, by treatment with pioglitazone, modulates levels of inflammatory cell subsets and insulin sensitivity (51). Leptin, a class I cytokine, is produced in higher amounts by adipocytes in obese individuals and inhibits rapamycin-induced proliferation of Treg via increased activation of mTORC1 (18, 56). Leptin, secreted in the VAT, therefore, represents a potential regulator of the function of adipose-tissue-resident Treg. In contrast to leptin, adiponectin, an anti-inflammatory adipokine, retains insulin-sensitizing properties and negatively correlates with body mass index while positively correlating with Treg cell representation in VAT (57).
Amino Acid Concentration Regulates Treg Differentiation and Function
Regulatory T cell differentiation and function are also controlled by the availability of amino acids in the local milieu. The essential amino acids arginine, glutamine, and tryptophan are essential for T cell activation (58–61) and their depletion from the local microenvironment results in Treg generation. For example, Tryptophan is catabolized by indoleamine 2,3-dioxygenase (IDO) and tryptophan 2,3-dioxygenase (TDO), which are present on many suppressive cell types including regulatory dendritic cells (DC) and some tumors. Low concentrations of tryptophan inhibits T cell growth but enhances Treg generation (62–64) through an mTOR-dependent mechanism (65). The depletion of arginine by arginase (ARG1) and nitric oxide synthase (iNOS) also inhibits T cell activation via mTor inhibition. ARG1, iNOS, and IDO can be induced by Treg in actively tolerant skin grafts in vivo (66) providing a feed-back loop by which Treg can influence amino acid availability via autocrine mTOR activation and subsequently control Teff activation and function. The influence of amino acid metabolism on Treg differentiation and function has been reviewed elsewhere (67).
Therapeutic Implications
The metabolic pathways influencing Treg differentiation and function are amenable for modulation in therapeutic settings, thus providing the clinician with potentially valuable tools in the fight against immune-mediated diseases. As the mechanisms by which Rapamycin affects Treg function are elucidated, more areas of clinical intervention will be opened for this FDA approved, well tolerated, and bio-available drug. To this end, it has recently been demonstrated by Makki et al. (68) that the metabolic effects of Rapamycin can protect against insulin resistance, increase energy expenditure, and reduce weight gain in diet-dependent obese mice. These phenotypic effects correlate with an increase of Treg and myeloid derived suppressor cells in the adipose tissue (68). These finding will certainly fuel the debate over the use of Rapamycin beyond organ transplantation.
Proglisterone, which is currently licensed as a drug for the treatment of Type II diabetes, provides another potential target to modulate Treg metabolism. Proglisterone is known to stimulate PPARγ and when used to treat mice fed a high fat diet, it restores the number and function of visceral adipose specific Treg and this effect appears to be PPARγ specific (51). Therefore, Proglisterone can potentially target pathologies related to VAT Treg with no bystander effects on other Treg populations. The regulation of accumulation and function of PPARγ+ Treg by leptin and adiponectin represents a potentially valuable therapeutic pathway that may, in the future, be targeted in order to regulate obesity-related pathologies. Moreover, the role of leptin and Treg in the progression of obesity-related diabetes is yet to be fully elucidated and may provide even more targets for future drug research.
On another note, and potentially related to Treg dependence on fatty acid metabolism, short-chain fatty acids (scFA), of bacterial origin (i.e., propionate, butyrate, and acetate), can restore the Treg compartment in the gut of germ-free mice that had been treated with irradiation or antibiotics. This re-population is partially dependent on the expression of free fatty acid receptor 2 (FFAR2) on colonic Treg, which physiologically express higher levels of FFAR2 than other Treg sub-populations. This observation opens up the tantalizing possibility that colonic Treg may be specifically targeted, in clinical settings, using synthetic scFA to treat gut-related problems in immunocompromised individuals (69).
Concluding Remarks and Perspectives
The recent ground breaking research in how metabolism effects Treg biology has provided the scientific and medical community with a plethora of novel mechanistic insights that will inevitably lead to a better understanding of disease and a host of therapeutic targets. However, we still need to understand how the varying tissue-specific transcription factors found in Treg sub-populations are influenced by their environment, external and internal metabolic factors. The expression of PPAR-γ by VAT Treg suggests that the metabolic environment can influence the expression of transcription factors not only in resident cells but also in new migrants to the tissue. A future challenge will involve extending this concept to establish whether the metabolic microenvironment, which characterizes different tissues, can determine the balance of regulation versus inflammation in situ. If true, this possibility will pave the way for organ-selective immune-metabolic therapy.
Conflict of Interest Statement
The authors declare that the research was conducted in the absence of any commercial or financial relationships that could be construed as a potential conflict of interest.
Acknowledgments
The authors would like to thank the British Heart Foundation for their funding under the BHF programme grant RG/14/2/30616.
References
1. Jones RG, Thompson CB. Revving the engine: signal transduction fuels T cell activation. Immunity (2007) 27:173–8. doi: 10.1016/j.immuni.2007.07.008
Pubmed Abstract | Pubmed Full Text | CrossRef Full Text | Google Scholar
2. Bental M, Deutsch C. Metabolic changes in activated T cells: an NMR study of human peripheral blood lymphocytes. Magn Reson Med (1993) 29:317–26. doi:10.1002/mrm.1910290307
Pubmed Abstract | Pubmed Full Text | CrossRef Full Text | Google Scholar
3. Fox CJ, Hammerman PS, Thompson CB. Fuel feeds function: energy metabolism and the T-cell response. Nat Rev Immunol (2005) 5:844–52. doi:10.1038/nri1710
Pubmed Abstract | Pubmed Full Text | CrossRef Full Text | Google Scholar
4. Frauwirth KA, Riley JL, Harris MH, Parry RV, Rathmell JC, Plas DR, et al. The CD28 signaling pathway regulates glucose metabolism. Immunity (2002) 16:769–77. doi:10.1016/S1074-7613(02)00323-0
Pubmed Abstract | Pubmed Full Text | CrossRef Full Text | Google Scholar
5. Jacobs SR, Herman CE, Maciver NJ, Wofford JA, Wieman HL, Hammen JJ, et al. Glucose uptake is limiting in T cell activation and requires CD28-mediated Akt-dependent and independent pathways. J Immunol (2008) 180:4476–86. doi:10.4049/jimmunol.180.7.4476
Pubmed Abstract | Pubmed Full Text | CrossRef Full Text | Google Scholar
6. Alves NL, Derks IA, Berk E, Spijker R, van Lier RA, Eldering E. The Noxa/Mcl-1 axis regulates susceptibility to apoptosis under glucose limitation in dividing T cells. Immunity (2006) 24:703–16. doi:10.1016/j.immuni.2006.03.018
Pubmed Abstract | Pubmed Full Text | CrossRef Full Text | Google Scholar
7. Coloff JL, Mason EF, Altman BJ, Gerriets VA, Liu T, Nichols AN, et al. Akt requires glucose metabolism to suppress puma expression and prevent apoptosis of leukemic T cells. J Biol Chem (2011) 286:5921–33. doi:10.1074/jbc.M110.179101
Pubmed Abstract | Pubmed Full Text | CrossRef Full Text | Google Scholar
8. Greiner EF, Guppy M, Brand K. Glucose is essential for proliferation and the glycolytic enzyme induction that provokes a transition to glycolytic energy production. J Biol Chem (1994) 269:31484–90.
9. Zheng Y, Collins SL, Lutz MA, Allen AN, Kole TP, Zarek PE, et al. A role for mammalian target of rapamycin in regulating T cell activation versus anergy. J Immunol (2007) 178:2163–70. doi:10.4049/jimmunol.178.4.2163
Pubmed Abstract | Pubmed Full Text | CrossRef Full Text | Google Scholar
10. Peter C, Waldmann H, Cobbold SP. mTOR signalling and metabolic regulation of T cell differentiation. Curr Opin Immunol (2010) 22:655–61. doi:10.1016/j.coi.2010.08.010
Pubmed Abstract | Pubmed Full Text | CrossRef Full Text | Google Scholar
11. Powell JD, Delgoffe GM. The mammalian target of rapamycin: linking T cell differentiation, function, and metabolism. Immunity (2010) 33:301–11. doi:10.1016/j.immuni.2010.09.002
Pubmed Abstract | Pubmed Full Text | CrossRef Full Text | Google Scholar
12. Sakaguchi S. Regulatory T cells: key controllers of immunologic self-tolerance. Cell (2000) 101:455–8. doi:10.1016/S0092-8674(00)80856-9
13. Shevach EM. Regulatory T cells in autoimmmunity*. Annu Rev Immunol (2000) 18:423–49. doi:10.1146/annurev.immunol.18.1.423
Pubmed Abstract | Pubmed Full Text | CrossRef Full Text | Google Scholar
14. Jordan MS, Boesteanu A, Reed AJ, Petrone AL, Holenbeck AE, Lerman MA, et al. Thymic selection of CD4+CD25+ regulatory T cells induced by an agonist self-peptide. Nat Immunol (2001) 2:301–6. doi:10.1038/86302
Pubmed Abstract | Pubmed Full Text | CrossRef Full Text | Google Scholar
15. Borsellino G, Kleinewietfeld M, Di Mitri D, Sternjak A, Diamantini A, Giometto R, et al. Expression of ectonucleotidase CD39 by Foxp3+ Treg cells: hydrolysis of extracellular ATP and immune suppression. Blood (2007) 110:1225–32. doi:10.1182/blood-2006-12-064527
Pubmed Abstract | Pubmed Full Text | CrossRef Full Text | Google Scholar
16. Delgoffe GM, Kole TP, Zheng Y, Zarek PE, Matthews KL, Xiao B, et al. The mTOR kinase differentially regulates effector and regulatory T cell lineage commitment. Immunity (2009) 30:832–44. doi:10.1016/j.immuni.2009.04.014
Pubmed Abstract | Pubmed Full Text | CrossRef Full Text | Google Scholar
17. Lee K, Gudapati P, Dragovic S, Spencer C, Joyce S, Killeen N, et al. Mammalian target of rapamycin protein complex 2 regulates differentiation of Th1 and Th2 cell subsets via distinct signaling pathways. Immunity (2010) 32:743–53. doi:10.1016/j.immuni.2010.06.002
Pubmed Abstract | Pubmed Full Text | CrossRef Full Text | Google Scholar
18. Procaccini C, De Rosa V, Galgani M, Abanni L, Cali G, Porcellini A, et al. An oscillatory switch in mTOR kinase activity sets regulatory T cell responsiveness. Immunity (2010) 33:929–41. doi:10.1016/j.immuni.2010.11.024
Pubmed Abstract | Pubmed Full Text | CrossRef Full Text | Google Scholar
19. Michalek RD, Gerriets VA, Jacobs SR, Macintyre AN, MacIver NJ, Mason EF, et al. Cutting edge: distinct glycolytic and lipid oxidative metabolic programs are essential for effector and regulatory CD4+ T cell subsets. J Immunol (2011) 186:3299–303. doi:10.4049/jimmunol.1003613
Pubmed Abstract | Pubmed Full Text | CrossRef Full Text | Google Scholar
20. Shi LZ, Wang R, Huang G, Vogel P, Neale G, Green DR, et al. HIF1alpha-dependent glycolytic pathway orchestrates a metabolic checkpoint for the differentiation of TH17 and Treg cells. J Exp Med (2011) 208:1367–76. doi:10.1084/jem.20110278
Pubmed Abstract | Pubmed Full Text | CrossRef Full Text | Google Scholar
21. Guertin DA, Sabatini DM. Defining the role of mTOR in cancer. Cancer Cell (2007) 12:9–22. doi:10.1016/j.ccr.2007.05.008
22. Kane LP, Weiss A. The PI-3 kinase/Akt pathway and T cell activation: pleiotropic pathways downstream of PIP3. Immunol Rev (2003) 192:7–20. doi:10.1034/j.1600-065X.2003.00008.x
Pubmed Abstract | Pubmed Full Text | CrossRef Full Text | Google Scholar
23. Wieman HL, Wofford JA, Rathmell JC. Cytokine stimulation promotes glucose uptake via phosphatidylinositol-3 kinase/Akt regulation of Glut1 activity and trafficking. Mol Biol Cell (2007) 18:1437–46. doi:10.1091/mbc.E06-07-0593
Pubmed Abstract | Pubmed Full Text | CrossRef Full Text | Google Scholar
24. Vander Heiden MG, Cantley LC, Thompson CB. Understanding the Warburg effect: the metabolic requirements of cell proliferation. Science (2009) 324:1029–33. doi:10.1126/science.1160809
Pubmed Abstract | Pubmed Full Text | CrossRef Full Text | Google Scholar
25. Yang K, Chi H. mTOR and metabolic pathways in T cell quiescence and functional activation. Semin Immunol (2012) 24:421–8. doi:10.1016/j.smim.2012.12.004
Pubmed Abstract | Pubmed Full Text | CrossRef Full Text | Google Scholar
26. Battaglia M, Stabilini A, Roncarolo MG. Rapamycin selectively expands CD4+CD25+FoxP3+ regulatory T cells. Blood (2005) 105:4743–8. doi:10.1182/blood-2004-10-3932
Pubmed Abstract | Pubmed Full Text | CrossRef Full Text | Google Scholar
27. Powell JD, Lerner CG, Schwartz RH. Inhibition of cell cycle progression by rapamycin induces T cell clonal anergy even in the presence of costimulation. J Immunol (1999) 162:2775–84.
28. Vanasek TL, Khoruts A, Zell T, Mueller DL. Antagonistic roles for CTLA-4 and the mammalian target of rapamycin in the regulation of clonal anergy: enhanced cell cycle progression promotes recall antigen responsiveness. J Immunol (2001) 167:5636–44. doi:10.4049/jimmunol.167.10.5636
Pubmed Abstract | Pubmed Full Text | CrossRef Full Text | Google Scholar
29. Zeng H, Yang K, Cloer C, Neale G, Vogel P, Chi H. mTORC1 couples immune signals and metabolic programming to establish T(reg)-cell function. Nature (2013) 499:485–90. doi:10.1038/nature12297
Pubmed Abstract | Pubmed Full Text | CrossRef Full Text | Google Scholar
30. Hardie DG. AMP-activated protein kinase: an energy sensor that regulates all aspects of cell function. Genes Dev (2011) 25:1895–908. doi:10.1101/gad.17420111
Pubmed Abstract | Pubmed Full Text | CrossRef Full Text | Google Scholar
31. Hardie DG, Hawley SA, Scott JW. AMP-activated protein kinase – development of the energy sensor concept. J Physiol (2006) 574:7–15. doi:10.1113/jphysiol.2006.108944
Pubmed Abstract | Pubmed Full Text | CrossRef Full Text | Google Scholar
32. Cybulski N, Hall MN. TOR complex 2: a signaling pathway of its own. Trends Biochem Sci (2009) 34:620–7. doi:10.1016/j.tibs.2009.09.004
Pubmed Abstract | Pubmed Full Text | CrossRef Full Text | Google Scholar
33. Oh WJ, Jacinto E. mTOR complex 2 signaling and functions. Cell Cycle (2011) 10:2305–16. doi:10.4161/cc.10.14.16586
Pubmed Abstract | Pubmed Full Text | CrossRef Full Text | Google Scholar
34. Guertin DA, Stevens DM, Thoreen CC, Burds AA, Kalaany NY, Moffat J, et al. Ablation in mice of the mTORC components raptor, rictor, or mLST8 reveals that mTORC2 is required for signaling to Akt-FOXO and PKCalpha, but not S6K1. Dev Cell (2006) 11:859–71. doi:10.1016/j.devcel.2006.10.007
Pubmed Abstract | Pubmed Full Text | CrossRef Full Text | Google Scholar
35. Sarbassov DD, Guertin DA, Ali SM, Sabatini DM. Phosphorylation and regulation of Akt/PKB by the rictor-mTOR complex. Science (2005) 307:1098–101. doi:10.1126/science.1106148
Pubmed Abstract | Pubmed Full Text | CrossRef Full Text | Google Scholar
36. Matarese G, Colamatteo A, De Rosa V. Metabolic fuelling of proper T cell functions. Immunol Lett (2014) 161:174–8. doi:10.1016/j.imlet.2013.12.012
Pubmed Abstract | Pubmed Full Text | CrossRef Full Text | Google Scholar
37. Cunningham JT, Rodgers JT, Arlow DH, Vazquez F, Mootha VK, Puigserver P. mTOR controls mitochondrial oxidative function through a YY1-PGC-1alpha transcriptional complex. Nature (2007) 450:736–40. doi:10.1038/nature06322
Pubmed Abstract | Pubmed Full Text | CrossRef Full Text | Google Scholar
38. Powell JD, Heikamp EB, Pollizzi KN, Waickman AT. A modified model of T-cell differentiation based on mTOR activity and metabolism. Cold Spring Harb Symp Quant Biol (2013) 78:125–30. doi:10.1101/sqb.2013.78.020214
Pubmed Abstract | Pubmed Full Text | CrossRef Full Text | Google Scholar
39. Fisson S, Darrasse-Jèze G, Litvinova E, Septier F, Klatzmann D, Liblau R, et al. Continuous activation of autoreactive CD4+ CD25+ regulatory T cells in the steady state. J Exp Med (2003) 198:737–46. doi:10.1084/jem.20030686
Pubmed Abstract | Pubmed Full Text | CrossRef Full Text | Google Scholar
40. Vukmanovic-Stejic M, Zhang Y, Cook JE, Fletcher JM, McQuaid A, Masters JE, et al. Human CD4+ CD25hi Foxp3+ regulatory T cells are derived by rapid turnover of memory populations in vivo. J Clin Invest (2006) 116:2423–33. doi:10.1172/JCI28941
Pubmed Abstract | Pubmed Full Text | CrossRef Full Text | Google Scholar
41. Thornton AM, Shevach EM. CD4+CD25+ immunoregulatory T cells suppress polyclonal T cell activation in vitro by inhibiting interleukin 2 production. J Exp Med (1998) 188:287–96. doi:10.1084/jem.188.2.287
42. Lord GM, Matarese G, Howard JK, Baker RJ, Bloom SR, Lechler RI. Leptin modulates the T-cell immune response and reverses starvation-induced immunosuppression. Nature (1998) 394:897–901. doi:10.1038/29795
Pubmed Abstract | Pubmed Full Text | CrossRef Full Text | Google Scholar
43. Barbi J, Pardoll D, Pan F. Metabolic control of the Treg/Th17 axis. Immunol Rev (2013) 252:52–77. doi:10.1111/imr.12029
Pubmed Abstract | Pubmed Full Text | CrossRef Full Text | Google Scholar
44. Gulen MF, Kang Z, Bulek K, Youzhong W, Kim TW, Chen Y, et al. The receptor SIGIRR suppresses Th17 cell proliferation via inhibition of the interleukin-1 receptor pathway and mTOR kinase activation. Immunity (2010) 32:54–66. doi:10.1016/j.immuni.2009.12.003
Pubmed Abstract | Pubmed Full Text | CrossRef Full Text | Google Scholar
45. Powell JD, Pollizzi KN, Heikamp EB, Horton MR. Regulation of immune responses by mTOR. Annu Rev Immunol (2012) 30:39–68. doi:10.1146/annurev-immunol-020711-075024
Pubmed Abstract | Pubmed Full Text | CrossRef Full Text | Google Scholar
46. Waickman AT, Powell JD. mTOR, metabolism, and the regulation of T-cell differentiation and function. Immunol Rev (2012) 249:43–58. doi:10.1111/j.1600-065X.2012.01152.x
Pubmed Abstract | Pubmed Full Text | CrossRef Full Text | Google Scholar
47. Delgoffe GM, Pollizzi KN, Waickman AT, Heikamp E, Meyers DJ, Horton MR, et al. The kinase mTOR regulates the differentiation of helper T cells through the selective activation of signaling by mTORC1 and mTORC2. Nat Immunol (2011) 12:295–303. doi:10.1038/ni.2005
Pubmed Abstract | Pubmed Full Text | CrossRef Full Text | Google Scholar
48. Gabryšová L, Christensen JR, Wu X, Kissenpfennig A, Malissen B, O’Garra A. Integrated T-cell receptor and costimulatory signals determine TGF-β-dependent differentiation and maintenance of Foxp3+ regulatory T cells. Eur J Immunol (2011) 41:1242–8. doi:10.1002/eji.201041073
Pubmed Abstract | Pubmed Full Text | CrossRef Full Text | Google Scholar
49. Sitkovsky M, Lukashev D. Regulation of immune cells by local-tissue oxygen tension: HIF1 alpha and adenosine receptors. Nat Rev Immunol (2005) 5:712–21. doi:10.1038/nri1685
Pubmed Abstract | Pubmed Full Text | CrossRef Full Text | Google Scholar
50. Dang EV, Barbi J, Yang HY, Jinasena D, Yu H, Zheng Y, et al. Control of T(H)17/T(reg) balance by hypoxia-inducible factor 1. Cell (2011) 146:772–84. doi:10.1016/j.cell.2011.07.033
Pubmed Abstract | Pubmed Full Text | CrossRef Full Text | Google Scholar
51. Cipolletta D, Feuerer M, Li A, Kamei N, Lee J, Shoelson SE, et al. PPAR-γ is a major driver of the accumulation and phenotype of adipose tissue Treg cells. Nature (2012) 486:549–53. doi:10.1038/nature11132
Pubmed Abstract | Pubmed Full Text | CrossRef Full Text | Google Scholar
52. Feuerer M, Herrero L, Cipolletta D, Naaz A, Wong J, Nayer A, et al. Lean, but not obese, fat is enriched for a unique population of regulatory T cells that affect metabolic parameters. Nat Med (2009) 15:930–9. doi:10.1038/nm.2002
Pubmed Abstract | Pubmed Full Text | CrossRef Full Text | Google Scholar
53. Olefsky JM, Glass CK. Macrophages, inflammation, and insulin resistance. Annu Rev Physiol (2010) 72:219–46. doi:10.1146/annurev-physiol-021909-135846
Pubmed Abstract | Pubmed Full Text | CrossRef Full Text | Google Scholar
54. Winer S, Chan Y, Paltser G, Truong D, Tsui H, Bahrami J, et al. Normalization of obesity-associated insulin resistance through immunotherapy. Nat Med (2009) 15:921–9. doi:10.1038/nm.2001
Pubmed Abstract | Pubmed Full Text | CrossRef Full Text | Google Scholar
55. Deiuliis J, Shah Z, Shah N, Needleman B, Mikami D, Narula V, et al. Visceral adipose inflammation in obesity is associated with critical alterations in T regulatory cell numbers. PLoS One (2011) 6:e16376. doi:10.1371/journal.pone.0016376
Pubmed Abstract | Pubmed Full Text | CrossRef Full Text | Google Scholar
56. Procaccini C, Galgani M, De Rosa V, Matarese G. Intracellular metabolic pathways control immune tolerance. Trends Immunol (2012) 33:1–7. doi:10.1016/j.it.2011.09.002
57. Ouchi N, Parker JL, Lugus JJ, Walsh K. Adipokines in inflammation and metabolic disease. Nat Rev Immunol (2011) 11:85–97. doi:10.1038/nri2921
58. Carr EL, Kelman A, Wu GS, Gopaul R, Senkevitch E, Aghvanyan A, et al. Glutamine uptake and metabolism are coordinately regulated by ERK/MAPK during T lymphocyte activation. J Immunol (2010) 185:1037–44. doi:10.4049/jimmunol.0903586
Pubmed Abstract | Pubmed Full Text | CrossRef Full Text | Google Scholar
59. Hörig H, Spagnoli GC, Filgueira L, Babst R, Gallati H, Harder F, et al. Exogenous glutamine requirement is confined to late events of T cell activation. J Cell Biochem (1993) 53:343–51. doi:10.1002/jcb.240530412
Pubmed Abstract | Pubmed Full Text | CrossRef Full Text | Google Scholar
60. Munder M, Eichmann K, Modolell M. Alternative metabolic states in murine macrophages reflected by the nitric oxide synthase/arginase balance: competitive regulation by CD4+ T cells correlates with Th1/Th2 phenotype. J Immunol (1998) 160:5347–54.
61. Munder M, Schneider H, Luckner C, Giese T, Langhans CD, Fuentes JM, et al. Suppression of T-cell functions by human granulocyte arginase. Blood (2006) 108:1627–34. doi:10.1182/blood-2006-11-010389
Pubmed Abstract | Pubmed Full Text | CrossRef Full Text | Google Scholar
62. Curti A, Trabanelli S, Salvestrini V, Baccarani M, Lemoli RM. The role of indoleamine 2,3-dioxygenase in the induction of immune tolerance: focus on hematology. Blood (2009) 113:2394–401. doi:10.1182/blood-2008-07-144485
Pubmed Abstract | Pubmed Full Text | CrossRef Full Text | Google Scholar
63. Matteoli G, Mazzini E, Iliev ID, Mileti E, Fallarino F, Puccetti P, et al. Gut CD103+ dendritic cells express indoleamine 2,3-dioxygenase which influences T regulatory/T effector cell balance and oral tolerance induction. Gut (2010) 59:595–604. doi:10.1136/gut.2009.185108
Pubmed Abstract | Pubmed Full Text | CrossRef Full Text | Google Scholar
64. Mellor AL, Keskin DB, Johnson T, Chandler P, Munn DH. Cells expressing indoleamine 2,3-dioxygenase inhibit T cell responses. J Immunol (2002) 168:3771–6. doi:10.4049/jimmunol.168.8.3771
Pubmed Abstract | Pubmed Full Text | CrossRef Full Text | Google Scholar
65. Metz R, Rust S, Duhadaway JB, Mautino MR, Munn DH, Vahanian NN, et al. IDO inhibits a tryptophan sufficiency signal that stimulates mTOR: a novel IDO effector pathway targeted by d-1-methyl-tryptophan. Oncoimmunology (2012) 1:1460–8. doi:10.4161/onci.21716
Pubmed Abstract | Pubmed Full Text | CrossRef Full Text | Google Scholar
66. Cobbold SP, Adams E, Farquhar CA, Nolan KF, Howie D, Lui KO, et al. Infectious tolerance via the consumption of essential amino acids and mTOR signaling. Proc Natl Acad Sci U S A (2009) 106:12055–60. doi:10.1073/pnas.0903919106
Pubmed Abstract | Pubmed Full Text | CrossRef Full Text | Google Scholar
67. Howie D, Waldmann H, Cobbold S. Nutrient sensing via mTOR in T Cells maintains a tolerogenic microenvironment. Front Immunol (2014) 5:409. doi:10.3389/fimmu.2014.00409
Pubmed Abstract | Pubmed Full Text | CrossRef Full Text | Google Scholar
68. Makki K, Taront S, Molendi-Coste O, Bouchaert E, Neve B, Eury E, et al. Beneficial metabolic effects of rapamycin are associated with enhanced regulatory cells in diet-induced obese mice. PLoS One (2014) 9:e92684. doi:10.1371/journal.pone.0092684
Pubmed Abstract | Pubmed Full Text | CrossRef Full Text | Google Scholar
69. Smith PM, Howitt MR, Panikov N, Michaud M, Gallini CA, Bohlooly-Y M, et al. The microbial metabolites, short-chain fatty acids, regulate colonic Treg cell homeostasis. Science (2013) 341:569–73. doi:10.1126/science.1241165
Pubmed Abstract | Pubmed Full Text | CrossRef Full Text | Google Scholar
Keywords: metabolism, regulatory T cells, T cell differentiation, T cell function, mTOR pathway
Citation: Coe DJ, Kishore M and Marelli-Berg F (2014) Metabolic regulation of regulatory T cell development and function. Front. Immunol. 5:590. doi: 10.3389/fimmu.2014.00590
Received: 30 September 2014; Accepted: 04 November 2014;
Published online: 18 November 2014.
Edited by:
Christian Frezza, University of Cambridge, UKReviewed by:
Giamila Fantuzzi, University of Illinois at Chicago, USAStephen Paul Cobbold, University of Oxford, UK
Copyright: © 2014 Coe, Kishore and Marelli-Berg. This is an open-access article distributed under the terms of the Creative Commons Attribution License (CC BY). The use, distribution or reproduction in other forums is permitted, provided the original author(s) or licensor are credited and that the original publication in this journal is cited, in accordance with accepted academic practice. No use, distribution or reproduction is permitted which does not comply with these terms.
*Correspondence: David John Coe, Department of Biochemical Pharmacology, William Harvey Research Institute, Charterhouse Square, Queen Mary University, London EC1M 6BQ, UK e-mail: d.coe@qmul.ac.uk
†David John Coe and Madhav Kishore have contributed equally to this work.