Unsaturated and saturated permeabilities of fiber reinforcement: critics and suggestions
 Chung Hae Park
 Patricia Krawczak
- Polymers and Composites Technology and Mechanical Engineering Department, Ecole Nationale Supérieure des Mines de Douai, Douai, France
In general, permeability measurement results show a strong scattering according to the measurement method, the type of test fluid and the fluid injection condition, even though permeability is regarded as a unique property of porous medium. In particular, the discrepancy between the unsaturated and saturated permeabilities for the same fabric has been widely reported. In the literature, relative permeability has been adopted to model the unsaturated flow. This approach has some limits in the modeling of double-scale porosity medium. We address this issue of permeability measurement by rigorously examining the mass conservation condition. Finally, we identify that the pressure gradient is non-linear with positive curvature in the unsaturated flow and a misinterpretation of pressure gradient is the main reason for the difference between the saturated and unsaturated permeabilities of the same fiber reinforcement. We propose to use a fixed value of permeability and to modify the mass conservation equation if there are air voids, which are entrapped inside the fiber tow. Finally, we also suggest some guidelines and future perspectives to obtain more consistent permeability measurement results.
Introduction
The most effective way to obtain polymer composites is to impregnate fiber reinforcement by liquid resin. This principle is employed in many composites manufacturing techniques, for example, liquid composite molding where liquid resin permeates into the dry fabric preplaced in a closed mold. Therefore, the analysis of resin flow in fibrous medium is an important phase in the process optimization. It has been general to use Darcy’s law, which is an empirical constitutive relation between flow rate and pressure gradient, regarding the fiber reinforcement as porous medium (Darcy, 1856).
where is the volume-averaged fluid velocity, Q is the flow rate, A is the flow cross-section, is the permeability tensor of fiber reinforcement, μ is the fluid viscosity, and P is the fluid pressure. Hence, permeability is a hydraulic conductivity for the fluid motion through porous medium.
Darcy’s law can be integrated into the mass conservation equation for incompressible fluid to obtain the pressure field.
It is noticeable that the pressure gradient becomes linear in the case of rectilinear flow if the permeability and the viscosity are constant.
Generally, permeability is considered to be a unique property of fiber reinforcement and it is independent of fluid property such as viscosity as well as of fluid pressure as long as inertial effect is negligible compared with viscous force. Thus, permeability can be determined from the microstructure of porous medium, such as pore size and connectivity, irrespective of fluid type. Currently, there is no standard method for permeability measurement and each laboratory uses its own experimental set-up and method. It has been reported that the experimental results for a same reinforcement can be different according to measurement method, device, and condition (Dungun and Sastry, 2002; Pillai, 2004; Arbter et al., 2011; Naik et al., 2014; Vernet et al., 2014).
The focus of this paper is to investigate a principal reason for the inconsistency of permeability measurement results, especially the dependence on the measurement method. We also propose some remedies and perspectives for this subject.
Permeability Measurement Methods
Many different experimental set-ups and methods for permeability measurement have been proposed during the last several decades (Arbter et al., 2011; Naik et al., 2014; Vernet et al., 2014). We classify permeability measurement methods into two categories according to the flow condition. The one is the saturated permeability (a.k.a. steady-state permeability) method where fiber reinforcement is impregnated by a test liquid, which is introduced into the mold under a constant flow rate. Once the reinforcement is fully saturated and the flow in the mold reaches a steady state, pressure values are measured at two distant points, usually liquid inlet and outlet. Then, the pressure gradient is obtained from the ratio of the pressure drop to the distance between the two pressure sensors assuming the pressure gradient in the mold is linear.
where Ksat is the saturated permeability. L and ΔP are the distance and the pressure difference between the two pressure sensors, respectively.
The other is the unsaturated permeability (a.k.a. unsteady-state or transient permeability) method where the fiber reinforcement in the mold is progressively impregnated by a test liquid injected under a constant pressure at the inlet. During the mold filling process, the flow front position is recorded as a function of time. In general, pressure is monitored only at the liquid inlet assuming that the pressure at the flow front is the atmospheric pressure. According to Darcy’s law, we can obtain the relations between flow front position and time in the case of rectilinear flow as following.
where lf(t) is the distance between the liquid inlet and the flow front, Kunsat is the unsaturated permeability, Vf is the fiber volume fraction and Pin is the inlet pressure. Generally, square of flow front position is plotted against time in a graphical form. Then, unsaturated permeability value is evaluated from the slope of the straight line by least square fitting of data set.
Issues and Critics
As stated previously, permeability is regarded as an intrinsic property of porous medium. In the literature, however, we can find a strong scatter of permeability measurement results even for a same fiber reinforcement, which depends on the measurement method (saturated permeability vs. unsaturated permeability), the test conditions (injection pressure or flow rate), and the test fluid (Dungun and Sastry, 2002; Pillai, 2004; Arbter et al., 2011; Naik et al., 2014; Vernet et al., 2014). To address this issue of inconsistency, there have been two benchmark exercises of permeability measurement (Arbter et al., 2011; Vernet et al., 2014). At the first benchmark exercise, the permeabilities of two fabrics were measured by different research teams using their own devices and methods (Arbter et al., 2011). A large dispersion of permeability values were observed even for the same reinforcement. Measurement error from human factors was assumed to be the main source for this great variation. At the second benchmark exercise, 12 research teams employed the same measurement procedure to obtain the permeability values for the same carbon fabric (Vernet et al., 2014). Contrary to the first benchmark exercise, a small scatter was observed and the influence from human factors was not significant. Hence, it was proven that the permeability measurement was reproducible if the same procedure and condition were used. However, a large dispersion was observed if different parameters such as injection pressure and test fluid were employed even for the same set-up and procedure.
We can summarize some representative observations from permeability measurement results in the literature as following.
• The ratio of unsaturated to saturated permeabilities varies from 1/4 to 4 (Dungun and Sastry, 2002; Pillai, 2004). In many cases, however, the unsaturated permeability is smaller than the saturated permeability (Dungun and Sastry, 2002; Pillai, 2004; Arbter et al., 2011; Naik et al., 2014; Vernet et al., 2014).
• The test fluid viscosity has been found to have insignificant influence on saturated permeability measurements if it is as low as that of thermoset resin used in the RTM process.
• Many technical sources causing measurement errors and corresponding remedies have been identified: mold deflection (wrong estimation of fiber volume fraction), fluid viscosity variation (strong dependence on temperature), number of fabrics (nesting effect), race-tracking effect, variation of injection pressure or flow rate (especially at the early stage of mold filling), deviation of fabric direction from the principal flow direction in the mold (in the case of rectilinear injection), uncertainty in the flow front tracking in the case of visual observation, etc.
• The role of capillary pressure in the unsaturated permeability method is controversial. Some researchers corrected the unsaturated permeability considering the surface tension effect at the flow front (Ahn et al., 1991; Amico and Lekakou, 2001). On the contrary, some researchers argue that the influence on the capillary pressure is insignificant because the capillary pressure estimated from the characteristic pore size is much smaller than the inlet pressure (Masoodi et al., 2012).
In a subsequent section, we focus on the difference between the unsaturated and saturated permeabilities for the same fabric by investigating the flow physics in the porous medium.
Relative Permeability and Degree of Saturation
Many researchers have proposed a hypothesis that air void formation during the unsaturated flow is a major source for the discrepancy between saturated and unsaturated permeabilities. The microstructure of textile reinforcement is highly heterogeneous showing dual scale porosity distribution, viz., micropore, which is a tiny space between fiber filaments inside the fiber tow and macropore, which is an open gap between fiber tows. Hence, the liquid flow advancement during the mold filling process is non-uniform and air is entrapped at the flow front. Subsequently, air voids remaining inside the fiber reinforcement create partially impregnated zone and the overall hydraulic conductivity may be altered. This phenomenon has been well described in the soil mechanics where Darcy’s law had been first proposed. In the experiment where Darcy’s law was derived, the volumetric rate of water flowing through a vertical column of soil with a known height was measured to determine the hydraulic conductivity of soil. Therefore, the experimental condition of the original Darcy’s experiment corresponds to the saturated permeability measurement method. In the progressive permeation of liquid into porous medium such as sand, however, we can also observe the generation of partially impregnated zone, which is known as “fingering” phenomenon. If there are partially impregnated zones in the soil, the flow rate is decreased for a given height of soil column. To consider this change of overall hydraulic conductivity, relative permeability is frequently adopted which is a ratio of the flow rate in a fully saturated soil to that in partially saturated soil (Van Genuchten, 1980). Thus, relative permeability, kr can also be considered as a ratio of unsaturated to saturated permeabilities.
Generally, relative permeability is defined by degree of saturation, Sw, which is a ratio of liquid volume, Vl to pore volume, Vp in the porous medium.
As relative permeability varies between the zero and the unity, unsaturated permeability is always smaller than saturated permeability.
The concept of relative permeability has also been adopted to model the unsaturated resin flow for composites manufacturing (De Parseval et al., 1997; Breard et al., 2003; Garcia et al., 2010). Some researchers described the pressure profile in the unsaturated flow by introducing in the governing equation the relative permeability which varies according to degree of saturation (De Parseval et al., 1997; Breard et al., 2003; Garcia et al., 2010).
Generally, the degree of saturation is greater at the upstream than at the downstream. Thus, the relative permeability is greater at the upstream than at the downstream (Figure 1A). In this modeling result, therefore, the local negative pressure gradient is smaller at the upstream than at the downstream because negative pressure gradient is inversely proportional to permeability from Darcy’s law. Subsequently, the pressure profile should be a non-linear curve with negative curvature (Figure 1A) (De Parseval et al., 1997; Breard et al., 2003; Garcia et al., 2010).
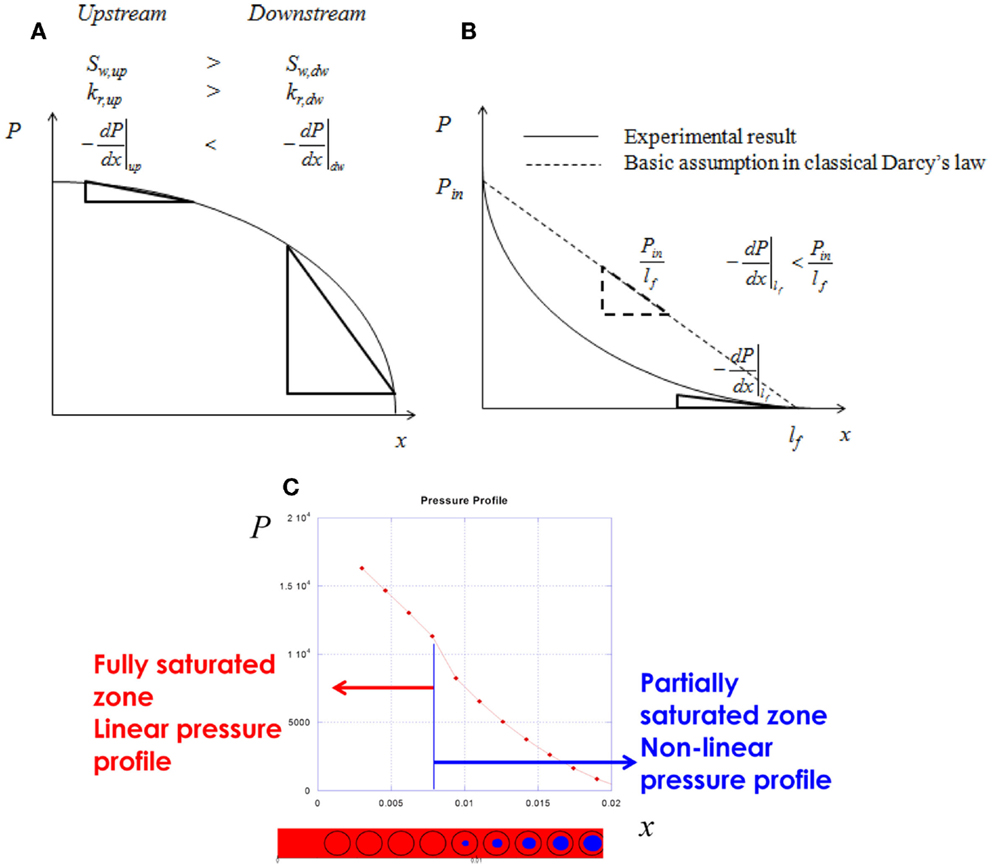
Figure 1. Comparison of pressure gradient between the conventional modeling approach (relative permeability) and the experimental/simulation result. (A) Conventional modeling result by relative permeability approach in terms of degree of saturation (non-linear profile with negative curvature). (B) Experimental result of pressure gradient in the unsaturated flow (non-linear profile with positive curvature). (C) Transient Stokes–Brinkman simulation result (Jung et al., 2010).
Non-Linear Pressure Gradient in the Unsaturated Flow
The relative permeability model suggests that the pressure profile in unsaturated flow with air voids is a non-linear curve with negative curvature. Jung et al. (2010) performed mold filling experiments to study the influences from air voids on the unsaturated flow behavior. It has been widely reported that the type and content of air voids generated during the mold filling process depend on the flow rate (Park and Lee, 2011). In their experiments, test liquid was injected under a pre-assigned constant flow rate into the mold containing a unidirectional stitched fabric to generate a uniform void content at the flow front. This test was repeated for different values of constant flow rate and the pressure profile was observed during the mold filling process. At the high flow rate cases where intra-bundle voids were generated, the pressure profiles were always non-linear as represented in Figure 1B, which were deviated from the prediction of classical Darcy’s law. Moreover, it should be noted that the curvature of non-linear pressure profile in the experiment was positive whereas it has been always negative in the modeling results using relative permeability approach in the literature. At the low flow rate injection case where inter-bundle voids were formed also resulted in a non-linear pressure profile with positive curvature. Meanwhile, a linear pressure gradient was observed in the case of the intermediate flow rate where neither inter-bundle void nor intra-bundle void was generated. This result can also be confirmed by numerical simulation of transient Stokes–Brinkman equation (Figure 1C) (Jung et al., 2010). Near the flow front where fiber tows are partially impregnated, the pressure gradient is non-linear showing positive curvature whereas it is linear at the vicinity of injection gate where the preform is fully saturated (Jung et al., 2010).
These results imply a very important clue to understand the difference between the unsaturated and saturated permeabilities. The basic assumption to evaluate both the saturated and unsaturated permeabilities by Darcy’s law is that the pressure gradient is linear (see also Eqs 3 and 4).
As can be seen in the experimental results, however, the pressure gradient is no more linear and cannot be obtained by dividing the pressure difference by the distance between the inlet and outlet (as represented by Eq. 9) if there are air voids.
Especially, it should be kept in mind that the unsaturated permeability is determined by monitoring the flow front advancement with time. During the unsaturated flow experiment, it is the negative pressure gradient at the flow front that decides the flow front advancing velocity. In the case of unsaturated flow, the actual negative pressure gradient at the flow front is smaller than the prediction from the assumption of linear pressure gradient (Figure 1B).
Subsequently, the negative pressure gradient is overestimated and the permeability value is underestimated if Eqs 4 and 5 are used to evaluate unsaturated permeability values.
Mass Conservation Equation Considering Mass Sink Effect
Pillai (2004) proposed to reformulate the mass conservation equation using the same permeability value regardless of flow type. In the case of saturated flow, the inlet liquid flow (Qin) and the outlet liquid flow (Qout) in the control volume are identical and the governing equation represented by Eq. 2 still holds good (Figure 2A). If fiber tows behind the global flow front are not fully saturated, however, some portion of liquid flows from the macropore into the fiber tow as represented by leakage flow (QT) in Figure 2B. Hence, the flow rate is not constant in the flow domain. For example, Darcy’s velocity is greater at the upstream than at the downstream where some portion of liquid from the upstream has already been leaked into partially saturated fiber tows. Eventually, the mass continuity equation should be modified by considering this leakage flow, which is represented as a mass sink term.
where is the mass sink term which is the volumetric flow rate entering the fiber tow per unit control volume. We can see that the governing equation for pressure field is Poisson equation with a sourced term in the right hand side. Subsequently, the pressure gradient becomes non-linear in the case of rectilinear flow if this source term is non-zero. If there is no void inside the tow, this mass sink term is zero and the governing equation for pressure becomes Laplace equation where a linear pressure gradient is obtained in the case of rectilinear flow. It should be noted that a fixed value for permeability can be used to model both the saturated and unsaturated flows.
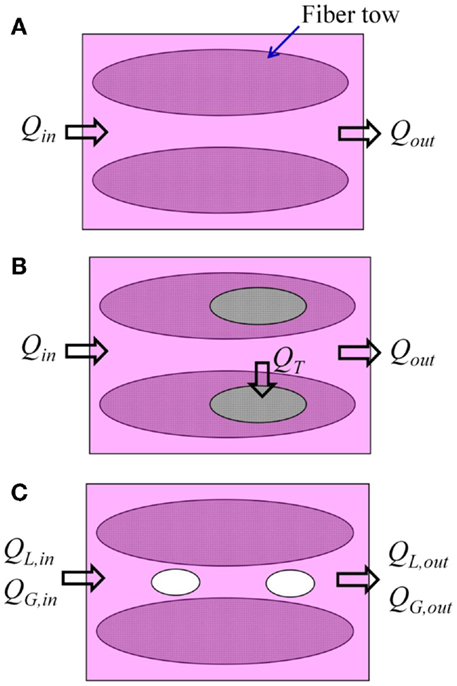
Figure 2. Schematic of liquid (L) and air (G) flows for the investigation of mass conservation condition. (A) Saturated flow. (B) Unsaturated flow with intra-bundle voids. (C) Unsaturated flow with inter-bundle voids.
This new governing equation can be converted into a dimensionless form in the case of rectilinear flow.
where are dimensionless pressure and position, respectively. We can see that the non-linearity of pressure profile increases as the flow front position increases and the inlet pressure decreases. Hence, there are significant influences from the mold size and the liquid injection condition upon unsaturated permeability measurement results. The liquid type also affects the unsaturated permeability measurement because the mass sink term is proportional to the test liquid viscosity. Moreover, wetting properties such as surface tension and contact angle play an important role to determine the mass sink effect because the capillary wicking is dominant in the flow inside the fiber tow.
As previously mentioned, the relative permeability model leads to negative curvature of pressure profile whereas positive curvature is obtained in the experiment. This contradictory issue can be addressed by considering the mass sink effect in the mass conservation even if a fixed value of permeability is employed. The curvature of pressure profile is proportional to the mass sink term on the right hand side of Eq. 13. In the case of intra-bundle void formation, the liquid first fills the open gap between the fiber tows and then enters the fiber tows. Thus, the mass sink term is always positive and the curvature of pressure profile should also be positive. It should be reminded that in the soil mechanics, relative permeability has been adopted to predict the flow rate under a given pressure drop in the soil. Therefore, relative permeability should be interpreted as a measure of overall flow rate for a pre-assigned global pressure drop and it may be misleading to employ relative permeability for the prediction of local pressure gradient under the assumption of constant flow rate or flow velocity across the entire flow distance.
Conclusion and Perspectives
We investigated the discrepancy between the saturated and unsaturated permeabilities for the same fabric in terms of air void formation during the resin flow. The overestimation of negative pressure gradient in the unsaturated permeability measurement has been identified as the main reason for this inconsistency. The limits of relative permeability model were discussed and some contradictions were demonstrated for the unsaturated flow behavior. To address this issue, the mass conservation equation should be modified by considering the mass sink effect. Subsequently, the non-linear pressure profile with positive curvature can be modeled even if a fixed value of permeability is employed regardless of flow condition. By the dimensionless analysis, we can estimate the influences from the liquid type, the injection pressure, the mold size and the void content upon the unsaturated permeability measurement.
To sum up, we can propose some guidelines and perspectives to improve the reliability of permeability characterization as following.
• It is crucial to correctly obtain the pressure gradient at the flow front in the case of transient mold filling experiment. It is recommended to use a number of pressure transducers in the mold, instead of single (or two) pressure sensor(s), in order to obtain the local pressure gradient at different positions and time instants. It should be kept in mind that the pressure gradient is no more linear if there are air voids in the preform.
• Permeability should be evaluated not by the overall negative pressure gradient but by the local negative pressure gradient at the flow front in the case of unsaturated permeability measurement.
• Air void migration in the macropore is an important parameter to influence the unsaturated flow behavior. If air voids move along the resin flow, the mass conservation equation for incompressible fluid is no more valid. The mass conservation should be revisited considering both the liquid and air flows (Figure 2C).
Furthermore, some air bubbles move faster than the resin flow whereas some bubbles are stationary being blocked between fiber tows. Hence, the air void distribution is not uniform and air voids are usually concentrated at the downstream. This non-uniform air void distribution can make a significant influence on the local pressure gradient. Even though the unsaturated permeability is lower than the saturated permeability in many cases, there are some results reported in the literature where the saturated permeability is greater than the unsaturated permeability (Dungun and Sastry, 2002; Pillai, 2004). To address this issue, the migration velocity and distribution of air voids during the mold filling process should be considered in two-phase flow modeling.
Conflict of Interest Statement
The authors declare that the research was conducted in the absence of any commercial or financial relationships that could be construed as a potential conflict of interest.
References
Ahn, K. J., Seferis, J. C., and Berg, J. C. (1991). Simultaneous measurements of permeability and capillary pressure of thermosetting matrices in woven fabric reinforcements. Polym. Compos. 12, 146–152. doi: 10.1002/pc.750120303
Amico, S., and Lekakou, C. (2001). An experimental study of the permeability and capillary pressure in resin-transfer moulding. Compos. Sci. Technol. 61, 1945–1959. doi:10.1016/S0266-3538(01)00104-X
Arbter, R., Beraud, J. M., Binetruy, C., Bizet, L., Bréard, J., Comas-Cardona, S., et al. (2011). Experimental determination of the permeability of textiles: a benchmark exercise. Compos. A 42, 1157–1168. doi:10.1016/j.compositesa.2011.04.021
Breard, J., Henzel, Y., Trochu, F., and Gauvin, R. (2003). Analysis of dynamic flows through porous media. Part I: comparison between saturated and unsaturated flows in fibrous reinforcement. Polym. Compos. 24, 391–408. doi:10.1002/pc.10039
De Parseval, Y., Pillai, K. M., and Advani, S. G. (1997). A simple model for the variation of permeability due to partial saturation in dual scale porous media. Transp. Porous Med. 27, 243–264. doi:10.1023/A:1006544107324
Dungun, F. D., and Sastry, A. M. (2002). Saturated and unsaturated polymer flows: microphenomena and modeling. J. Compos. Mater. 36, 1581–1603. doi:10.1177/0021998302036013179
Garcia, J. A., Gascon, L., Chinesta, F., Ruiz, E., and Trochu, F. (2010). An efficient solver of the saturation equation in liquid composite molding. Int. J. Mater. Form. 3, 1295–1302. doi:10.1007/s12289-010-0681-8
Jung, J. W., Hwang, I. J., Park, C. H., Um, M. K., and Lee, W. I. (2010). “Simulation and experimental study on unsaturated flow behavior and void minimization in liquid composite molding process,” in The 7th Asian-Australian Conference on Composite Materials, Taipei.
Masoodi, R., Pillai, K. M., Grahl, N., and Tan, H. (2012). Numerical simulation of LCM mold-filling during the manufacture of natural fiber composites. J. Reinf. Plast. Compos. 31, 363–378. doi:10.1177/0731684412438629
Naik, N. K., Sirisha, M., and Inani, A. (2014). Permeability characterization of polymer matrix composites by RTM/VARTM. Prog. Aerosp. Sci. 65, 22–40. doi:10.1016/j.paerosci.2013.09.002
Park, C. H., and Lee, W. I. (2011). Modeling void formation and unsaturated flow in liquid composite molding processes: a survey and review. J. Reinf. Plast. Compos. 30, 957–977. doi:10.1177/0731684411411338
Pillai, K. (2004). Modeling the unsaturated flow in liquid composite molding processes: a review and some thoughts. J. Compos. Mater. 38, 2097–2118. doi:10.1177/0021998304045585
Van Genuchten, M. T. (1980). A closed-form equation for predicting the hydraulic conductivity of unsaturated soils. Soil Sci. Am. J. 44, 892–898. doi:10.2136/sssaj1980.03615995004400050002x
Pubmed Abstract | Pubmed Full Text | CrossRef Full Text | Google Scholar
Keywords: composites manufacturing, permeability, Darcy’s law, air voids, pressure gradient, unsaturated flow
Citation: Park CH and Krawczak P (2015) Unsaturated and saturated permeabilities of fiber reinforcement: critics and suggestions. Front. Mater. 2:38. doi: 10.3389/fmats.2015.00038
Received: 05 January 2015; Accepted: 12 April 2015;
Published: 28 April 2015
Edited by:
Masaki Hojo, Kyoto University, JapanReviewed by:
Ralf Schledjewski, Montanuniversität Leoben, AustriaRyosuke Matsuzaki, Tokyo University of Science, Japan
Woo Il Lee, Seoul National University, South Korea
Copyright: © 2015 Park and Krawczak. This is an open-access article distributed under the terms of the Creative Commons Attribution License (CC BY). The use, distribution or reproduction in other forums is permitted, provided the original author(s) or licensor are credited and that the original publication in this journal is cited, in accordance with accepted academic practice. No use, distribution or reproduction is permitted which does not comply with these terms.
*Correspondence: Patricia Krawczak, Polymers and Composites Technology and Mechanical Engineering Department, Mines Douai, 941 rue Charles Bourseul, Douai 59508, France, patricia.krawczak@mines-douai.fr