 Hiroko Iijima1
 Masami Yokota Hirai
 Takashi Osanai
- 1RIKEN Center for Sustainable Resource Science, Yokohama, Japan
- 2Advanced Low Carbon Technology Research and Development Program (ALCA), Japan Science and Technology Agency, Kawaguchi, Japan
- 3School of Agriculture, Meiji University, Tokyo, Japan
Water use assessment is important for bioproduction using cyanobacteria. For eco-friendly reasons, seawater should preferably be used for cyanobacteria cultivation instead of freshwater. In this study, we demonstrated that the freshwater unicellular cyanobacterium Synechocystis sp. PCC 6803 could be grown in a medium based on seawater. The Synechocystis wild-type strain grew well in an artificial seawater (ASW) medium supplemented with nitrogen and phosphorus sources. The addition of HEPES buffer improved cell growth overall, although the growth in ASW medium was inferior to that in the synthetic BG-11 medium. The levels of proteins involved in sugar metabolism changed depending on the culture conditions. The biosynthesis of several amino acids including aspartate, glutamine, glycine, proline, ornithine, and lysine, was highly up-regulated by cultivation in ASW. Two types of natural seawater (NSW) were also made available for the cultivation of Synechocystis cells, with supplementation of both nitrogen and phosphorus sources. These results revealed the potential use of seawater for the cultivation of freshwater cyanobacteria, which would help to reduce freshwater consumption during biorefinery using cyanobacteria.
Introduction
The use of oxygenic photosynthetic prokaryotes as cell factories to directly convert CO2 and water into compounds of interests by light is required for the sustainable development of the society (Branco dos Santos et al., 2014). Cyanobacteria are a group of photosynthetic bacteria that undergo oxygenic photosynthesis and fix CO2 via the Calvin-Benson cycle. The freshwater cyanobacterium Synechocystis sp. PCC 6803 (hereafter Synechocystis 6803) is the most widely studied species among cyanobacteria, owing to their abilities of natural transformation and fast growth (Yu et al., 2013). The production of valuable products such as alcohols, alkanes, bioplastics, fatty acids, and hydrogen has been achieved by genetically engineering Synechocystis 6803, indicating the potential use of this bacterium as a biocatalyst (Savakis and Hellingwerf, 2014). Recent advances in the metabolome analysis of Synechocystis 6803 support this idea to promote the metabolic engineering of cyanobacteria (Osanai et al., 2011, 2014b).
A life cycle assessment concluded that algal cultivation requires a much larger amount of freshwater than do conventional crops, leading to high environmental impacts with algal biorefineries (Clarens et al., 2010). The utilization of seawater and/or wastewater as alternatives would reduce the freshwater requirement of algae and cyanobacteria cultivation. Another life cycle assessment indicated, however, that wastewater-based microalgal bioproduction also has large environmental impacts, due to the need to process the wastewater for algae growth (Mu et al., 2014). Thus, growth in seawater is preferable for bioproduction using microalgae and cyanobacteria (Savakis and Hellingwerf, 2014). However, there are not many studies on the use of seawater for cultivating model cyanobacteria except marine species.
Synechocystis 6803 is known to be a freshwater cyanobacterium that is able to grow under high salt (NaCl) conditions and a near-costal area in biofilms (Reed et al., 1985; Gram et al., 2002). An increase in NaCl induces the influx of Na+ and Cl− into the cells. This activates the Na+/H+ antiporter, which decreases the intracellular Na+ concentration, and results in an increase in the K+ concentration to compensate (Reed et al., 1985; Hagemann, 2011). Synechocystis 6803 cells then accumulate compatible solutes such as glucosylglycerol and sucrose to acclimate to the high salt conditions (Reed et al., 1985; Hagemann, 2011). These compatible solutes could be imported directly from the surrounding environment into the Synechocystis 6803 cells (Mikkat et al., 1996, 1997). The expression of genes encoding ribosomal proteins, chaperones, and enzymes for glucosylglycerol synthesis are up-regulated by 500 mM NaCl within 30 min, while the gene expression levels related to phycobilisomes, Photosystem I subunits, and desaturases are decreased (Kanesaki et al., 2002; Marin et al., 2004). Proteomic analysis has also demonstrated increased protein levels of glucosylglycerol biosynthesis, glucosylglycerol-phosphate synthase (GgpS) and glucosylglycerol-phosphate phosphatase (GgpP or StpA), chaperones (GroEL1, DnaK2, and GrpE), elongation factors, and general stress proteins (Fulda et al., 2006). Nevertheless, the relationship between salt conditions and metabolite levels in primary metabolism has not been studied in detail. Recent metabolomic analyses have indicated that the growth of Synechocystis 6803 is closely associated with sugar and amino acid metabolism (Osanai et al., 2014a,d).
In this study, we revealed that Synechocystis 6803 cells could grow in a seawater-based medium supplemented with nitrogen and phosphorus sources, and that the addition of HEPES buffer improved cell proliferation. Several amino acids were accumulated in high amounts in the artificial seawater (ASW) medium, revealing the altered primary metabolism that occurs during seawater cultivation.
Materials and Methods
Bacterial Strains and Culture Conditions
The glucose-tolerant (GT) strain of Synechocystis sp. PCC 6803, isolated by Williams (1988) and the GT-I strain among GT strains was used in this study (Kanesaki et al., 2012). For preculture, the GT cells were grown in modified BG-11 medium, which is BG-110 liquid medium containing 5 mM NH4Cl [buffered with 20 mM 4-(2-hydroxyethyl)piperazine-1-ethanesulfonic acid (HEPES)-KOH, pH 7.8] (Rippka, 1988). Marine Art SF-1 (Osaka Yakken, Osaka, Japan) was used as the ASW medium and contained 22.1 g/L NaCl, 9.9 g/L MgCl2•6H2O, 1.5 g/L CaCl2•2H2O, 3.9 g/L Na2SO4, 0.61 g/L KCl, 0.19 g/L NaHCO3, 96 mg/L KBr, 78 mg/L Na2B4O7•10H2O, 13 mg/L SrCl2, 3 mg/L NaF, 1 mg/L LiCl, 81 μg/L KI, 0.6 μg/L MnCl2•4H2O, 2 μg/L CoCl2•6H2O, 8 μg/L AlCl3•6H2O, 5 μg/L FeCl3•6H2O, 2 μg/L Na2WO4•2H2O, and 18 μg/L (NH4)6Mo7O24•4H2O. Two natural seawater samples were used as cultivation media, designated as NSWS (Shimano-Tennensui, seawater around Ohshima, south island of Tokyo; provided by NIHON AQUARIUM, Tokyo, Japan) and NSWN (NAGEME10, seawater around Izu Peninsula; provided by Bluelab Co. Ltd., Shizuoka, Japan). Liquid cultures were bubbled with 1% (v/v) CO2 in air and incubated at 30°C under continuous white light (~50–70 μmol photons m−2·s−1). Cell growth and densities were measured at OD730 with a Hitachi U-3310 spectrophotometer (Hitachi High-Tech., Tokyo, Japan). The pH values of the media were measured with the pH meter F-52 (HORIBA, Kyoto, Japan), using the supernatant of the cultures after centrifugation (5800 × g for 2 min).
Glycogen Measurement
Glycogen was quantified by the Biotechnology Center of Akita Prefectural University, Japan. Cells cultivated for 3 days were concentrated to an OD730 value of 6.0 in 1 mL of methanol, mixed for 10 min using a vortex mixer and then pelleted by centrifugation. The supernatant was transferred to a 1.5-mL tube and dried at 65°C. Cells were resuspended in 1 mL distilled water and incubated at 100°C for 40 min. 200 μL of cell suspension was transferred to a 1.5-mL tube and the resultant monosaccharides were enzymatically degraded with 100 μL glucoamylase solution (75 U/mL), and the resultant glucose was measured by estimating the changes in OD340 during hexokinase and glucose-6-phosphate dehydrogenase (G6PD) reactions.
Chlorophyll Measurement
Chlorophyll contents of the cells grown for 3 days were measured using a methanol extraction method (Grimme and Boardman, 1972). 1 mL of cell culture was transferred to a 1.5-mL tube and centrifuged (20500 × g for 2 min) and the supernatant was removed. Cells were suspended in 1 mL methanol and vortexed for 5 min. After placing 5 min, the cell suspensions were centrifuged (20500 × g for 2 min) and OD665 of the supernatants were quantified with a Hitachi U-3310 spectrophotometer.
Quantification of Intracellular Protein Levels
5 mL of cell culture was transferred to a 15-mL tube after cultivation for 3 days. The cell cultures were centrifuged (9000 × g for 2 min) and the supernatant was removed. Cells were suspended in 500 μL PBS-T (3.2 mM Na2HPO4, 0.5 mM KH2PO4, 1.3 mM KCl, 135 mM NaCl, and 0.05% Tween-20, pH 7.4) supplemented with the protease inhibitor Complete Mini (Roche Diagnostics, Rotkreuz, Switzerland; one tablet/30 mL and disrupted by sonication using VC-750 instrument (EYELA, Tokyo, Japan). After centrifugation at 9000 × g for 5 min at 4°C, the protein concentration in the soluble fraction was measured using BCA Protein Assay Reagent (Thermo Scientific Hudson, NH, USA) and bovine serum albumin as a standard.
Antisera Production and Immunoblotting
We previously produced antisera against isoamylases [GlgX(slr0237), GlgX(slr1857)], glycogen phosphorylases [GlgP(sll1356), GlgP(slr1367)], glyceraldehyde-3-phosphate dehydrogenase (Gap2), G6PD, 6-phosphogluconate dehydrogenase (6PGD), and an RNA polymerase sigma factor SigE (Azuma et al., 2011; Osanai et al., 2011, 2013b). Antiserum against transaldolase (Tal) was produced by Sigma-Aldrich (St. Louis, Missouri, USA) using synthetic peptide NH2-CHAYDLDGDGFITREEWAG-COOH. Antiserum against fructose-1,6-bisphosphate aldolase (FbaI, slr0943) was commercially produced by Tampaku Seisei Kogyo (Gunma, Japan). To produce anti-FbaI, glutathione S-transferase (GST)-fused FbaI proteins were first purified. The fbaI DNA fragment was amplified by PCR with KOD polymerase (Toyobo, Osaka, Japan) and the specific primers; 5′-ATGGGATCCCCATGATGACTCTCGAACCA-3′ and 5′-TGAGTCGACCTACGTAATCGATGCCTG-3′. The resultant DNA fragments were digested with BamHI and XhoI (Takara Bio, Shiga, Japan) and cloned into the BamHI-XhoI site of pGEX5X-1 (GE Healthcare Japan, Tokyo, Japan) using DNA Ligation Mix (Takara Bio). The integrity of the sequence was confirmed by sequencing. The plasmids were introduced into Escherichia coli BL21 Codon Plus(DE3)-RIPL cells (Agilent Technologies, Santa Clara, CA, USA) by transformation. The transformed cells were added to 2 L of Luria-Bertani medium and the cells were cultured overnight at 30°C in the presence of 10 μM isopropyl-β-D-thiogalactopyranoside (Wako Chemicals, Osaka, Japan). Purification of the GST-fused FbaI was performed as previously described (Osanai et al., 2009). Immunoblotting was performed according to the method described by Osanai et al. (2014c).
GC-MS Analysis for Amino Acids
Equal amounts of cells (50 mL of cell culture with OD730 = 1.0) were harvested by rapid filtration using a previously described method (Osanai et al., 2014c). Amino acids were quantified using a GCMS-QP2010Plus apparatus (Shimadzu, Kyoto, Japan) equipped with a 10-m × 0.25-mm ZB-AAA capillary gas chromatography column. The protocol used was as described previously (Osanai et al., 2014b).
Scanning Probe Microscopy
Cells grown in liquid medium were collected by centrifugation and the supernatants were discarded. The cells were resuspended in 1 mL of sterilized water and centrifuged (20,500 × g for 1 min) and the supernatant was again discarded. This process was repeated two more times and the cells were then resuspended in 1 mL of sterilized water. The cell suspension was spotted onto a metal plate and dried at 96°C for 1 min. The cells were observed with a scanning probe microscope (SPM-9700; Shimadzu) according to the manufacturer's instructions.
Results
Synechocystis 6803 Cultivation with Artificial Seawater Containing Nitrogen and Phosphorus Sources
Marine Art SF-1, a widely used ASW medium for the cultivation of marine bacteria and microalgae isolated from seawater (Yamane et al., 2013), was used for Synechocystis 6803 cultivation. The cultivation of wild-type cells was started with a the cell concentration of OD730 = 0.2. Cells in ASW without a nitrogen source (5 mM NH4Cl) hardly grew (Figure 1). Cells in the presence of the nitrogen source but in the absence of a phosphorus source (0.22 mM K2HPO4) grew partially, reaching an OD730 value of 1.4 for 3 days of cultivation, showing a yellow-green color (Figure 1). In the presence of both nitrogen and phosphorus sources, the cell concentration reached an OD730 value of 2.0 by 3 days of cultivation, showing a green color (Figure 1).
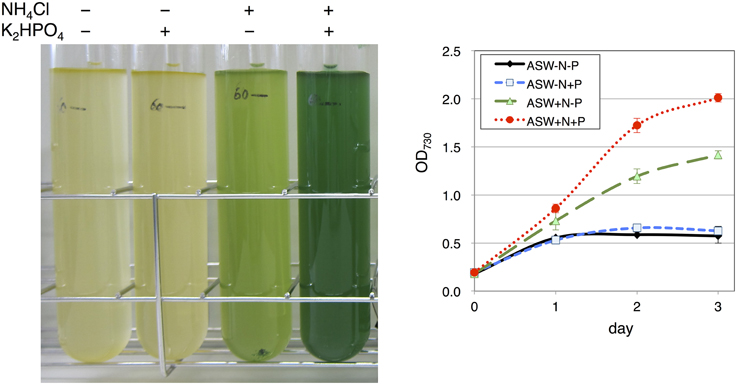
Figure 1. Growth of wild-type glucose-tolerant (GT) Synechocystis sp. PCC 6803 cells in artificial seawater (ASW) medium. (Left) Cell cultures were photographed after cultivation for 3 days. (Right) Growth curve of the cells in ASW with/without nitrogen and phosphorus sources. N and P designate NH4Cl and K2HPO4, respectively. Data represent means ± SD from three independent experiments.
Because 20 mM HEPES-KOH (pH 7.8) is usually added to the medium for cyanobacterial cultivation, we next tested the effect of this buffer on cell grown in the ASW medium. Unlike the cell growth in the ASW medium without HEPES buffer, which started to decrease after 2 days, the cells grew continuously in the presence of HEPES buffer (Figure 2A). We also compared the cell growth in ASW medium with that in a synthetic medium, BG-11. The cell density reached an OD730 value of 3.7 in the BG-11 medium after 3 days of cultivation, but reached only to a value of ~2.5 in ASW containing nitrogen and phosphorus sources and HEPES buffer (Figures 2B,C). The pH values were around 7.0 in the BG-11 medium and in ASW with HEPES buffer, whereas the pH value was 5.0 in ASW without HEPES buffer (Figure 2D). Chlorophyll levels in the cells grown in ASW with HEPES buffer were higher than those in the other two conditions (Figure 2E). The soluble protein levels in the cells were quantified and both the protein levels of the cells grown under ASW conditions were 1.6 times of that in the cells grown in BG-11 medium (Figure 2F). Hereafter, cultivation in ASW medium indicates ASW medium containing both nitrogen and phosphorus sources.
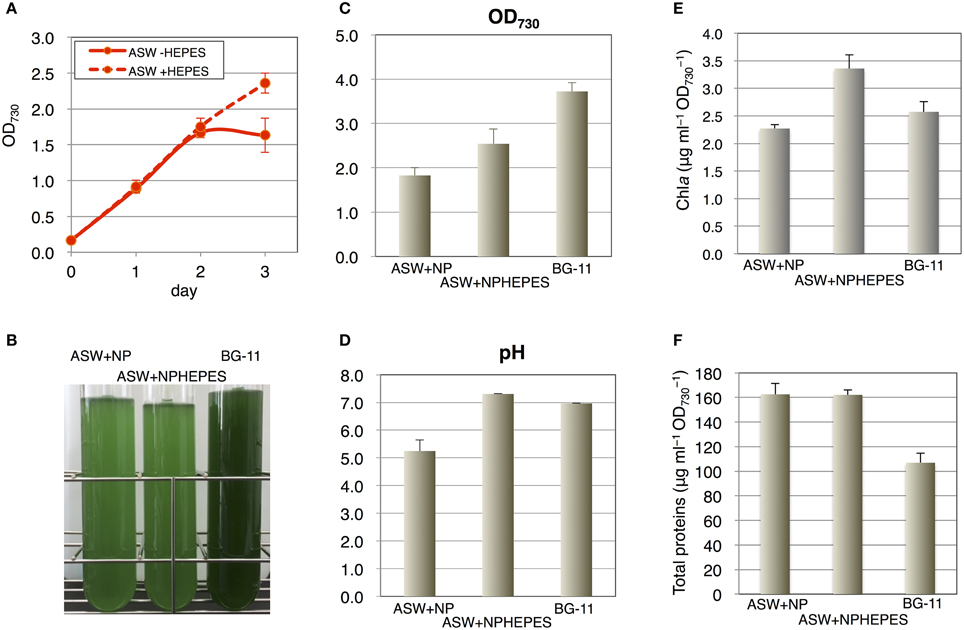
Figure 2. Effect of HEPES buffer on the growth of wild-type glucose-tolerant (GT) Synechocystis sp. PCC 6803 cells in artificial seawater (ASW) medium. (A) Growth curve of the cells in ASW with nitrogen and phosphorus sources with/without 20 mM HEPES buffer (pH 7.8). Data represent means ± SD from three independent experiments. (B) Cell cultures were photographed after cultivation for 3 days. BG-11, BG-11 medium; NPHEPES, HEPES buffer with the nitrogen and phosphorous source in the form of NH4Cl and K2HPO4, respectively. (C) OD730 of cell cultures after cultivation for 3 days. Data represent means ± SD from three independent experiments. (D) pH of cell cultures after cultivation for 3 days. Data represent means ± SD from three independent experiments. (E) Chlorophyll a levels of cell cultures after cultivation for 3 days. Data represent means ± SD from four independent experiments. (F) Intracellular soluble protein levels from the cells cultured for 3 days. Proteins were extracted by sonication and debris were removed by centrifugation. Total protein levels in the soluble fractions were quantified by BCA method. Data represent means ± SD from four independent experiments.
Glycogen Content and Immunoblotting
Since the ASW and BG-11 media were found to produce a difference in cell growth, we estimated the difference of primary carbon metabolism according to growth conditions. Glycogen levels were first determined using the cells cultivated for 3 days in ASW with/without HEPES buffer or in BG-11 medium (Table 1). Glycogen levels in the cells grown in the ASW medium were similar irrespective of the presence of HEPES buffer (Table 1). Glycogen levels in the cells grown in BG-11 medium was 1.7 times of that in the cells grown in ASW medium (Table 1).
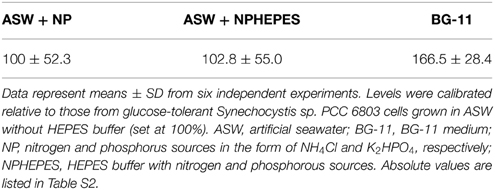
Table 1. Levels of glycogen after cultivation for 3 days.
The protein levels of glycogen catabolic enzymes, GlgP(sll1356), GlgP(slr1367), GlgX(slr0237), and GlgX(slr1857), were quantified in the cells grown for 3 days under the three medium conditions. GlgP(sll1356) protein levels in ASW with HEPES buffer and in BG-11 medium were almost 1.5–1.8 times the levels in ASW without HEPES buffer, whereas the levels of GlgP(slr1367) were similar among the three media (Figure 3). The levels of the GlgXs were fairly different among the three medium conditions. GlgX(slr0237) levels were higher in the ASW-based medium, particularly with HEPES buffer (Figure 3). On the contrary, GlgX(slr1857) level was more abundant in BG-11 medium (Figure 3).
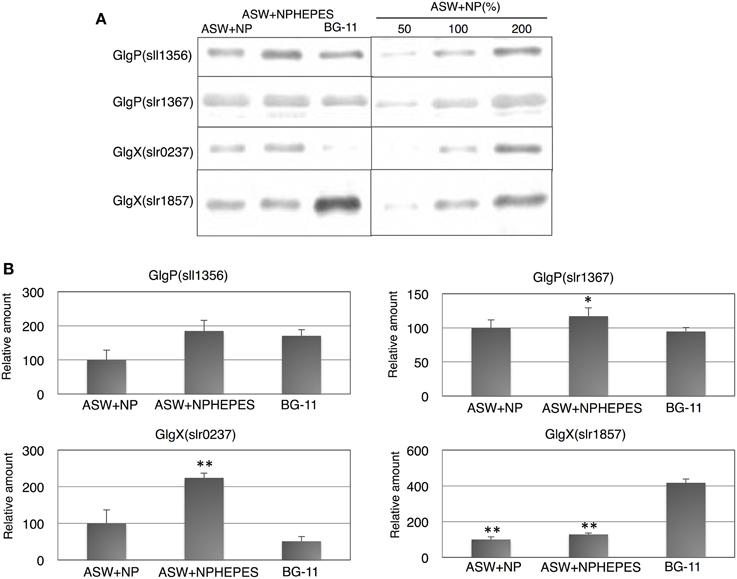
Figure 3. Protein levels of four glycogen catabolic enzymes. Immunoblotting was performed with total protein from cells grown under three different medium conditions for 3 days. (A) One of representative data was shown. (B) Data represent means ± SD from three independent experiments. Levels were calibrated relative to those of the glucose-tolerant strain grown in artificial seawater (ASW) without HEPES buffer (set at 100%). N and P designate NH4Cl and K2HPO4, respectively. BG-11, BG-11 medium. Asterisks (* or **) indicate that differences between proteins in the cells grown in ASW and BG-11 media using Student's t-test were statistically significant at P < 0.05 or P < 0.005, respectively.
The five enzymes of glycolysis and the oxidative pentose phosphate (OPP) pathway and SigE [an RNA polymerase sigma factor activating sugar catabolism (Osanai et al., 2011)] were subsequently quantified. The protein levels of FbaI, Gap2 and 6PGD were similar among the three medium conditions tested (Figure 4). On the other hand, the G6PD levels was lower in ASW without HEPES buffer than under the other two conditions (Figure 4). The protein levels of Tal were higher in the cells grown in ASW with/without HEPES buffer than in BG-11 medium (Figure 4). SigE protein levels were higher in the order of BG-11 > ASW with HEPES buffer > ASW without HEPES buffer (Figure 4).
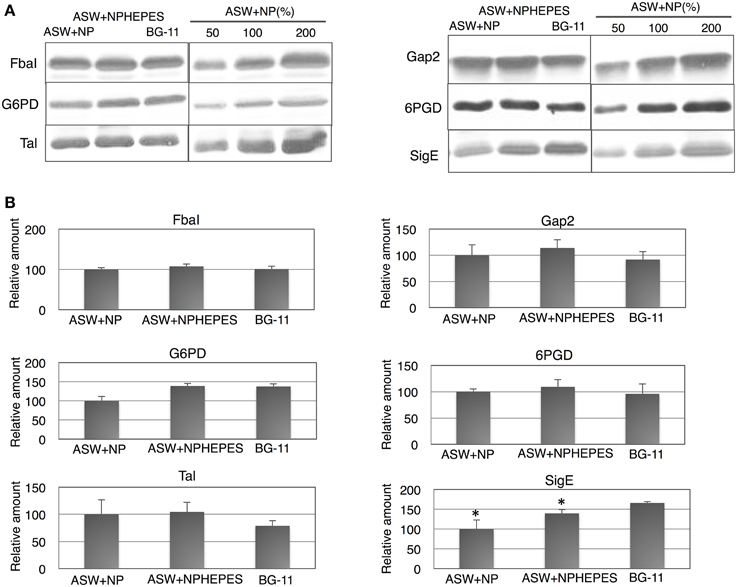
Figure 4. Protein levels of for glucose catabolic enzymes and SigE. Immunoblotting was performed with total protein from cells grown under three different medium conditions for 3 days. (A) One of representative data was shown. (B) Data represent means ± SD from three independent experiments. Levels were calibrated relative to those of the glucose-tolerant strain grown in artificial seawater (ASW) without HEPES buffer (set at 100%). N and P designate NH4Cl and K2HPO4, respectively. BG-11, BG-11 medium; FbaI, fructose-1,6-bisphosphate aldolase; Gap2, glyceraldehyde-3-phosphate aldolase catalyzing the anabolic reaction; G6PD, glucose-6-phosphate dehydrogenase; 6PGD, 6-phosphogluconate dehydrogenase; Tal, transaldolase; SigE, RNA polymerase group 2 sigma factor. Asterisks (*) indicate that differences between proteins in the cells grown in ASW and BG-11 media using Student's t-test were statistically significant at P < 0.05, respectively.
Amino Acid Profiles in the Different Media
To further clarify the effect of ASW on primary metabolism, the amino acid levels in the cells cultivated for 3 days under the three medium conditions were determined by GC-MS. The levels of proline, asparagine, aspartate, methionine, glutathione, glutamate, and glutamine in the cell grown in ASW with HEPES buffer were higher than those in the cells grown in BG-11 medium, whereas the levels of alanine, valine, leucine, isoleucine, threonine, serine, phenylalanine, and tyrosine were lower (Figure 5 and Table S1). The levels of alanine, glycine, proline, asparagine, aspartate, methionine, glutamine, ornithine, lysine, histidine, and tryptophan in cells grown in ASW without HEPES buffer were higher than those in the cells grown in BG-11 medium, whereas the levels of valine, leucine, isoleucine, serine, glutathione, phenylalanine, and tyrosine were lower (Figure 5).
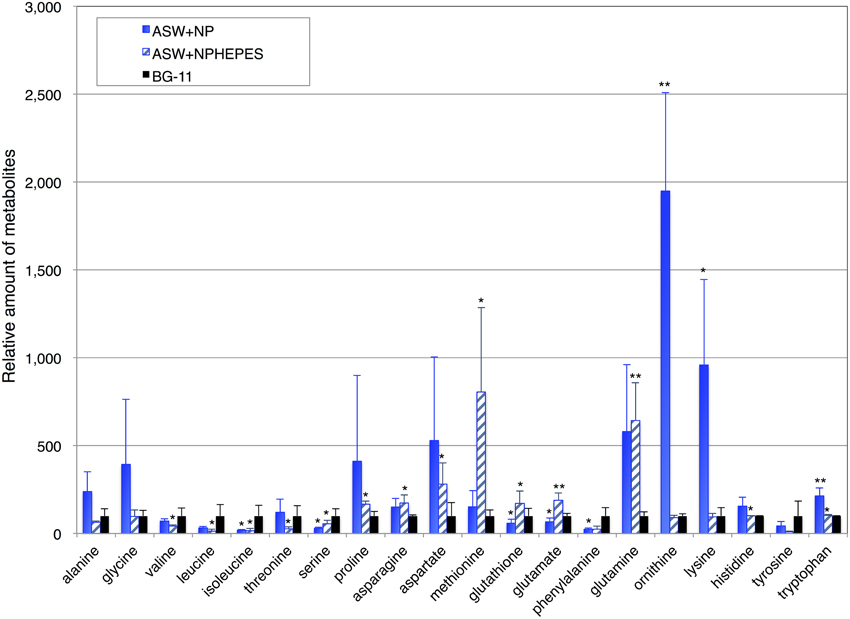
Figure 5. Levels of 18 amino acids, and ornithine and glutathione. Data represent means ± SD from five independent experiments. Levels were calibrated relative to that in cells grown in BG-11 medium (set at 100%). BG-11, BG-11 medium; ASW, artificial seawater medium; NPHEPES, HEPES buffer with the nitrogen and phosphorous source in the form of NH4Cl and K2HPO4, respectively. Student's t-test was performed and asterisks indicate statistically significant differences between BG-11 and artificial seawater with or without HEPES buffer (ASWNP or ASW NPHEPES, respectively) (*P < 0.05, **P < 0.005).
Morphological Changes in Artificial Seawater
Cell morphologies were observed by scanning probe microscopy to clarify the physiological phenotypes elicited by ASW cultivation. Whereas the cell structure and surface appearance were similar among the three medium conditions, the cell diameters were altered by ASW cultivation (Figure 6). Most of the wild-type cells in BG-11 medium were within 1.0–2.0 μm diameters (Figure 6). The majority of the cells grown in ASW with HEPES buffer had a diameter of 1.5–2.0 μm diameters but the distribution of cell diameters shifted to the 2.0–2.5 μm range (Figure 6). Many of the cells grown in ASW without HEPES buffer were also 1.5–2.0 μm in diameters, and showed a wider distribution of cell diameters from 1.0 to 3.0 μm (Figure 6).
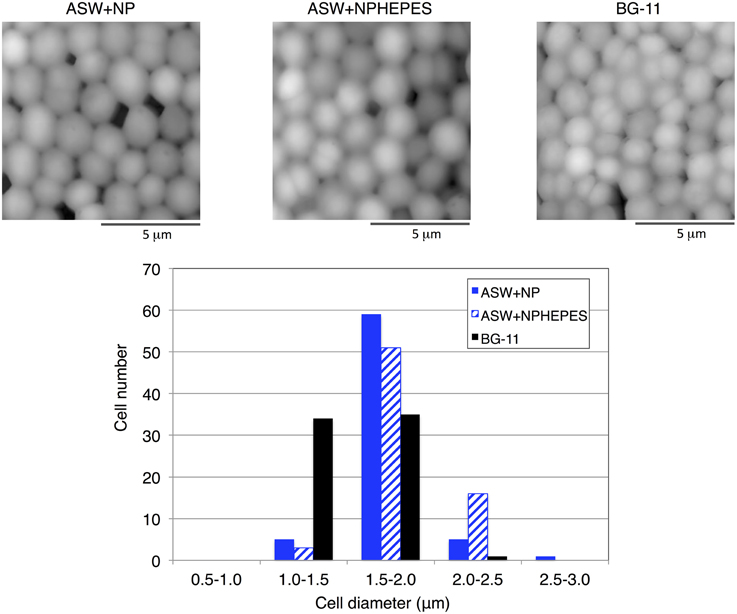
Figure 6. Scanning probe micrographs of the wild-type glucose-tolerant Synechocystis sp. PCC 6803 cells after cultivation for 3 days under three medium conditions. The diameter of each of 70 cells was measured.
Growth in Natural Seawater
Finally, the growth of the cells using natural seawater was tested. Two types of natural seawater, NSWS (from Ohshima, Japan) and NSWN (from Izu Peninsula, Japan), were purchased and tested for the effect of nitrogen and phosphorus sources. Similar to ASW, with both NSW samples, the cells grew only partially in the presence of the nitrogen sources, but they grew well when both nitrogen and phosphorus sources were present (Figures 7A,B). The cell density reached an OD730 value of ~1.8 in NSWN, but only reached the value of 1.3 in NSWS after 3 days of cultivation (Figures 7A,B). The addition of HEPES buffer hardly improved the growth in NSWN medium supplemented with nitrogen and phosphorus sources (Figure 7C).
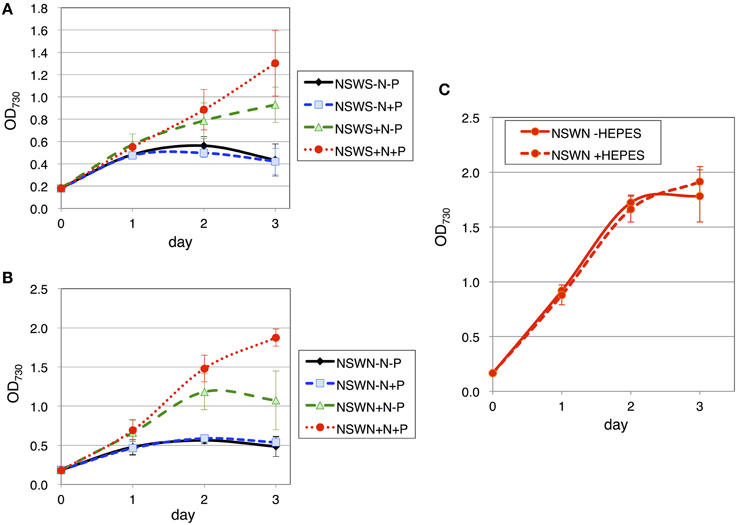
Figure 7. Growth of wild-type glucose-tolerant Synechocystis sp. PCC 6803 cells in two natural seawater (NSW) media. Growth curve of the cells in (A) NSWS (Shimano-Tennensui, seawater from Oshimo, Japan) and (B) NSWN (NAGEME10, seawater from the Izu Peninsula, Japan) with/without nitrogen and phosphorus sources. N and P designate NH4Cl and K2HPO4, respectively. Data represent means ± SD from three independent experiments. (C) Growth curve of the cells in NSWN supplemented with nitrogen and phosphorus sources, with/without 20 mM HEPES buffer (pH 7.8). Data represent means ± SD from three independent experiments.
Discussion
The current results indicate the potential of seawater usage for cultivation of the freshwater cyanobacterium Synechocystis 6803. Although the cell growth in the seawater-based medium was still inferior to that in synthetic medium, the levels of several amino acids were highly up-regulated by ASW, demonstrating the advantage of seawater cultivation of cyanobacteria for bioproduction.
It has been revealed that Synechocystis 6803 cells are able to grow in an ASW medium with anaerobic digestion effluent (ADE) (Cai et al., 2013). The addition of 3% ADE to ASW gave the highest biomass productivity, but increased addition of ADE lowered the biomass and lipid productivities of Synechocystis 6803 (Cai et al., 2013). Other microalga such as Nannochloropsis salina also grew in ASW medium with ADE, but they could not grow in ASW supplemented with commercial medium containing nitrate, phosphate, and trace metals (Sheets et al., 2014). Here, we succeeded in cultivating Synechocystis 6803 in a seawater-based medium by adding nitrogen and phosphorus sources derived from purified chemicals (Figures 1, 7). Nitrogen was particularly indispensable for Synechocystis 6803 culture in both ASW and NSW media (Figures 1, 7). Furthermore, the addition of HEPES buffer improved the cell growth in ASW (Figure 2), revealing the importance of pH control for the growth of cyanobacteria in a seawater-based medium. Synechocystis 6803 growth in ASW was inferior to that in BG-11 medium (Figures 2B,C). Previous study revealed that Synechocystis cells can proliferate under 450 mM NaCl, but the growth retarded 60~70% of the cells under low salt conditions (Ferjani et al., 2003). This result is consistent with the data of Figure 2C. Our analysis demonstrated that the protein and metabolite profiles were completely different between these two medium conditions (Figures 3–5). Chlorophyll levels in the cells grown in ASW were similar to or rather higher than those in the cells grown in BG-11 (Figure 2E). These results indicate that decrease in chlorophyll levels is not the cause of poor growth in ASW. Intracellular soluble protein and glycogen levels exhibited negative correlation in our experimental conditions (Figure 2F and Table 1). NSW experiment indicates not only pH but also unknown factors limited the Synechocystis growth in the NSW medium (Figure 7), and further analysis is required to reveal the physiological impacts by seawater cultivation.
Immunoblotting analysis revealed that enzymes involved in the primary metabolism switch were associated with the culture conditions (Figures 3, 4), emphasizing a variety of metabolic enzymes encoded in the Synechocystis 6803 genome. The levels of the two GlgXs were particularly different between ASW-based and BG-11 media (Figure 3), indicating that GlgX(slr0237) may be a major isoamylase under high salt conditions. Recent omics analyses have revealed that transcript and protein levels related to primary sugar metabolism are widely altered by salt stress (Pandhal et al., 2009a; Hagemann, 2011). Transcriptome analysis has shown that the expression levels of three genes coding for proteins in sugar metabolism (viz., pfkA, encoding phosphofructokinase; fbaII, encoding fructose-1,6-bisphosphate aldolase class II; and rpe, encoding pentose-5-phosphate-3-epimerase) were up-regulated after salt acclimation for 24 h (Marin et al., 2004). Protein levels of glycogen phosphorylase (GlgP, slr1367), phosphoglucomutase (Pgm, sll0726), Rpe, Tal, FbaII, glucose-1-phosphate adenylyltransferase (GlgC, slr1176), and phosphoglycerate kinase (Pgk, slr0394) increased more than two-fold in cells salt-acclimated for 5 days (Fulda et al., 2006). A system biology approach based on proteomic data suggested that glycogen catabolism and glycolysis are up-regulated in salt-adapted cells, while the OPP pathway is down-regulated (Pandhal et al., 2009a,b). Thus, primary metabolism, particularly sugar metabolism, is important for salt acclimation by Synechocystis 6803. The protein levels of SigE, an activator of gene expression of glycogen catabolic and the OPP pathway enzymes, were higher in BG-11 than in ASW media (Figure 4). However, only G6PD protein levels were positively correlated with the SigE protein levels (Figure 4). The glycogen levels were also not correlated with SigE protein levels (Table 1). These results suggest the complicated regulatory mechanism determining the protein and metabolite levels under ASW conditions. Previous studies showed that mutation of sugar metabolism altered cell sizes and structures (Singh and Sherman, 2005; Osanai et al., 2013a), and therefore, the wide distribution of cell diameters under ASW cultivation (Figure 6) may be caused by changes in primary metabolism, aside from the salt concentration in the medium.
Amino acids are classified into six families according to their biosynthetic pathways (Umbarger, 1978). Glycine is a precursor of glycine-betaine, one of the compatible solutes accumulated under high salt conditions, and proline is a probable compatible solute in cyanobacteria (Hagemann, 2011). Proline accumulation in ASW with/without HEPES buffer may be due to the increase in salt concentration in the medium (Figure 5). The levels of four pyruvate family amino acids (isoleucine, valine, leucine, and alanine) were lower in cells grown in ASW with HEPES buffer than those in BG-11 medium, indicating that pyruvate biosynthesis may be altered by ASW cultivation. Previous metabolomic analysis showed that pyruvate in Synechocystis 6803 was exhausted under dark conditions (Osanai et al., 2014d), suggesting that the pyruvate pool size in this cyanobacterium is small and easily exhausted under stress conditions. Metabolomic analysis showed a negative correlation between salt stress and serine, valine, threonine, isoleucine, and tyrosine (Wang et al., 2014). That correlation study agreed well with our results, in that lower levels of serine, valine, threonine, isoleucine, and tyrosine were found in the cells grown in ASW with HEPES buffer than those in BG-11 medium (Figure 5). Alanine and glutamine were found to correlate positively with salt stress (Wang et al., 2014), a finding consistent with our results (Figure 5). Therefore, the differences in amino acid profiles among three medium conditions can be partly explained by the salt conditions. However, there were large differences in amino acid profiles between ASW with and ASW without HEPES buffer, suggesting that other factors, such as pH and cell growth, may affect the amino acid profiles. Poly-lysine production in Streptomyces sp. M-Z18 increased by acidic pH shock (Ren et al., 2015), and thus, decrease in pH may be cause of increase in lysine in the cells grown in ASW without HEPES buffer. The values of standard deviation of amino acid levels in the cells cultivated in ASW without HEPES were larger than the other two conditions (Figure 5), which may reflect less growth in ASW without HEPES buffer after 3-day cultivation. Future study to reveal the cause–result effect in seawater-based media will explain the changes in primary metabolism and growth of cyanobacteria.
Conflict of Interest Statement
The authors declare that the research was conducted in the absence of any commercial or financial relationships that could be construed as a potential conflict of interest.
Acknowledgments
This work was supported by the Ministry of Education, Culture, Sports, Science, and Technology, Japan; by a grant to TO by funds from ALCA (Project name “Production of cyanobacterial succinate by the genetic engineering of transcriptional regulators and circadian clocks”) from the Japan Science and Technology Agency, and CREST from the Japan Science and Technology Agency.
Supplementary Material
The Supplementary Material for this article can be found online at: http://journal.frontiersin.org/article/10.3389/fmicb.2015.00326/abstract
References
Azuma, M., Osanai, T., Hirai, M. Y., and Tanaka, K. (2011). A response regulator Rre37 and an RNA polymerase sigma factor SigE represent two parallel pathways to activate sugar catabolism in a cyanobacterium Synechocystis sp. PCC 6803. Plant Cell Physiol. 52, 404–412. doi: 10.1093/pcp/pcq204
PubMed Abstract | Full Text | CrossRef Full Text | Google Scholar
Branco dos Santos, F., Du, W., and Hellingwerf, K. J. (2014). Synechocystis: not just a plug-bug for CO2, but a green E. coli. Front. Bioeng. Biotecchnol. 2:36. doi: 10.3389/fbioe.2014.00036
PubMed Abstract | Full Text | CrossRef Full Text | Google Scholar
Cai, T., Ge, X., Park, S. Y., and Li, Y. (2013). Comparison of Synechocystis sp. PCC6803 and Nannochloropsis salina for lipid production using artificial seawater and nutrients from anaerobic digestion effluent. Bioresour. Technol. 144, 255–260. doi: 10.1016/j.biortech.2013.06.101
PubMed Abstract | Full Text | CrossRef Full Text | Google Scholar
Clarens, A. F., Resurreccion, E. P., White, M. A., and Colosi, L. M. (2010). Environmental life cycle comparison of algae to other bioenergy feedstocks. Environ. Sci. Technol. 44, 1813–1819. doi: 10.1021/es902838n
PubMed Abstract | Full Text | CrossRef Full Text | Google Scholar
Ferjani, A., Mustardy, L., Sulpice, R., Marin, K., Suzuki, I., Hagemann, M., et al. (2003). Glucosylglycerol, a compatible solute, sustains cell division under salt stress. Plant Physiol. 131, 1628–1637. doi: 10.1104/pp.102.017277
PubMed Abstract | Full Text | CrossRef Full Text | Google Scholar
Fulda, S., Mikkat, S., Huang, F., Huckauf, J., Marin, K., Norling, B., et al. (2006). Proteome analysis of salt stress response in the cyanobacterium Synechocystis sp. strain PCC 6803. Proteomics 6, 2733–2745. doi: 10.1002/pmic.200500538
PubMed Abstract | Full Text | CrossRef Full Text | Google Scholar
Gram, L., Grossart, H.-P., Schlingloff, A., and Kiorboe, T. (2002). Possible quorum sensing in marine snow bacteria: production of acylated homoserine lactones by Roseobacter strains isolated from marine snow. Appl. Environ. Microbiol. 68, 4111–4116. doi: 10.1128/AEM.68.8.4111-4116.2002
PubMed Abstract | Full Text | CrossRef Full Text | Google Scholar
Grimme, L. H., and Boardman, N. K. (1972). Photochemical activities of a particle fraction P1 obtained from the green alga Chlorella fusca. Biochem. Biophys. Res. Commun. 49, 1617–1623. doi: 10.1016/0006-291X(72)90527-X
PubMed Abstract | Full Text | CrossRef Full Text | Google Scholar
Hagemann, M. (2011). Molecular biology of cyanobacterial salt acclimation. FEMS Microbiol. Rev. 35, 87–123. doi: 10.1111/j.1574-6976.2010.00234.x
PubMed Abstract | Full Text | CrossRef Full Text | Google Scholar
Kanesaki, Y., Shiwa, Y., Tajima, N., Suzuki, M., Watanabe, S., Sato, N., et al. (2012). Identification of substrain-specific mutations by massively parallel whole-genome resequencing of Synechocystis sp. PCC 6803. DNA Res. 19, 67–79. doi: 10.1093/dnares/dsr042
PubMed Abstract | Full Text | CrossRef Full Text | Google Scholar
Kanesaki, Y., Suzuki, I., Allakhverdiev, S. I., Mikami, K., and Murata, N. (2002). Salt stress and hyperosmotic stress regulate the expression of different sets of genes in Synechocystis sp. PCC 6803. Biochem. Biophys. Res. Commun. 290, 339–348. doi: 10.1006/bbrc.2001.6201
PubMed Abstract | Full Text | CrossRef Full Text | Google Scholar
Marin, K., Kanesaki, Y., Los, D. A., Murata, N., Suzuki, I., and Hagemann, M. (2004). Gene expression profiling reflects physiological processes in salt acclimation of Synechocystis sp. strain PCC 6803. Plant Physiol. 136, 3290–3300. doi: 10.1104/pp.104.045047
PubMed Abstract | Full Text | CrossRef Full Text | Google Scholar
Mikkat, S., Effmert, U., and Hagemann, M. (1997). Uptake and use of the osmoprotective compounds trehalose, glucosylglycerol, and sucrose by the cyanobacterium Synechocystis sp. PCC6803. Arch. Microbiol. 167, 112–118. doi: 10.1007/s002030050423
PubMed Abstract | Full Text | CrossRef Full Text | Google Scholar
Mikkat, S., Hagemann, M., and Schoor, A. (1996). Active transport of glucosylglycerol is involved in salt adaptation of the cyanobacterium Synechocystis sp. strain PCC 6803. Microbiology 142, 1725–1732. doi: 10.1099/13500872-142-7-1725
PubMed Abstract | Full Text | CrossRef Full Text | Google Scholar
Mu, D., Min, M., Krohn, B., Mullins, K. A., Ruan, R., and Hill, J. (2014). Life cycle environmental impacts of wastewater-based algal biofuels. Environ. Sci. Technol. 48, 11696–11704. doi: 10.1021/es5027689
PubMed Abstract | Full Text | CrossRef Full Text | Google Scholar
Osanai, T., Imashimizu, M., Seki, A., Sato, S., Tabata, S., Imamura, S., et al. (2009). ChlH, the H subunit of the Mg-chelatase, is an anti-sigma factor for SigE in Synechocystis sp. PCC 6803. Proc. Natl. Acad. Sci. USA 106, 6860–6865. doi: 10.1073/pnas.0810040106
Osanai, T., Kuwahara, A., Iijima, H., Toyooka, K., Sato, M., Tanaka, K., et al. (2013a). Pleiotropic effect of sigE over-expression on cell morphology, photosynthesis and hydrogen production in Synechocystis sp. PCC 6803. Plant J. 76, 456–465. doi: 10.1111/tpj.12310
PubMed Abstract | Full Text | CrossRef Full Text | Google Scholar
Osanai, T., Numata, K., Oikawa, A., Kuwahara, A., Iijima, H., Doi, Y., et al. (2013b). Increased bioplastic production with an RNA polymerase sigma factor SigE during nitrogen starvation in Synechocystis sp. PCC 6803. DNA Res. 20, 525–535. doi: 10.1093/dnares/dst028
PubMed Abstract | Full Text | CrossRef Full Text | Google Scholar
Osanai, T., Oikawa, A., Azuma, M., Tanaka, K., Saito, K., Hirai, M. Y., et al. (2011). Genetic engineering of group 2 sigma factor SigE widely activates expression of sugar catabolic genes in Synechocystis species PCC 6803. J. Biol. Chem. 286, 30962–30971. doi: 10.1074/jbc.M111.231183
PubMed Abstract | Full Text | CrossRef Full Text | Google Scholar
Osanai, T., Oikawa, A., Iijima, H., Kuwahara, A., Asayama, M., Tanaka, K., et al. (2014a). Metabolomic analysis reveals rewiring of Synechocystis sp. PCC 6803 primary metabolism by ntcA overexpression. Environ. Microbiol. 16, 3304–3317. doi: 10.1111/1462-2920.12554
PubMed Abstract | Full Text | CrossRef Full Text | Google Scholar
Osanai, T., Oikawa, A., Numata, K., Kuwahara, A., Iijima, H., Doi, Y., et al. (2014b). Pathway-level acceleration of glycogen catabolism by a response regulator in the cyanobacterium Synechocystis species PCC 6803. Plant Physiol. 164, 1831–1841. doi: 10.1104/pp.113.232025
PubMed Abstract | Full Text | CrossRef Full Text | Google Scholar
Osanai, T., Oikawa, A., Shirai, T., Kuwahara, A., Iijima, H., Tanaka, K., et al. (2014c). Capillary electrophoresis-mass spectrometry reveals the distribution of carbon metabolites during nitrogen starvation in Synechocystis sp. PCC 6803. Environ. Microbiol. 16, 512–524. doi: 10.1111/1462-2920.12170
PubMed Abstract | Full Text | CrossRef Full Text | Google Scholar
Osanai, T., Shirai, T., Iijima, H., Kuwahara, A., Suzuki, I., Kondo, A., et al. (2014d). Alteration of cyanobacterial sugar and amino acid metabolism by overexpression hik8, encoding a KaiC-associated histidine kinase. Environ. Microbiol. doi: 10.1111/1462-2920.12715. [Epub ahead of print].
PubMed Abstract | Full Text | CrossRef Full Text | Google Scholar
Pandhal, J., Noirel, J., Wright, P. C., and Biggs, C. A. (2009a). A systems biology approach to investigate the response of Synechocystis sp. PCC 6803 to a high salt environment. Saline Syst. 5:8. doi: 10.1186/1746-1448-5-8
PubMed Abstract | Full Text | CrossRef Full Text | Google Scholar
Pandhal, J., Ow, S. Y., Wright, P. C., and Biggs, C. A. (2009b). Comparative proteomics study of salt tolerance between a nonsequenced extremely halotolerant cyanobacterium and its mildly halotolerant relative using in vivo metabolic labeling and in vitro isobaric labeling. J. Proteome. Res. 8, 818–828. doi: 10.1021/pr800283q
PubMed Abstract | Full Text | CrossRef Full Text | Google Scholar
Reed, H. R., Warr, S. R. C., Richardson, D. L., Moor, D. J., and Swewart, W. D. P. (1985). Multiphasic osmotic adjustment in a euryhaline cyanobacterium. FEMS Microbiol. Lett. 28, 225–229. doi: 10.1111/j.1574-6968.1985.tb00796.x
Ren, X. D., Chen, X. S., Zeng, X., Wang, L., Tang, L., and Mao, Z. G. (2015). Acidic pH shock induced overproduction of ε-poly-L-lysine in fed-batch fermentation by Streptomyces sp. M-Z18 from agro-industrial by-products. Bioprocess Biosyst. Eng. doi: 10.1007/s00449-015-1354-2. [Epub ahead of print].
PubMed Abstract | Full Text | CrossRef Full Text | Google Scholar
Rippka, R. (1988). Isolation and purification of cyanobacteria. Meth. Enzymol. 167, 3–27. doi: 10.1016/0076-6879(88)67004-2
PubMed Abstract | Full Text | CrossRef Full Text | Google Scholar
Savakis, P., and Hellingwerf, K. J. (2014). Engineering cyanobacteria for direct biofuel production from CO2. Curr. Opin. Biotechnol. 33, 8–14. doi: 10.1016/j.copbio.2014.09.007
PubMed Abstract | Full Text | CrossRef Full Text | Google Scholar
Sheets, J. P., Ge, X., Park, S. Y., and Li, Y. (2014). Effect of outdoor conditions on Nannochloropsis salina cultivation in artificial seawater using nutrients from anaerobic digestion effluent. Bioresour. Technol. 152, 154–161. doi: 10.1016/j.biortech.2013.10.115
PubMed Abstract | Full Text | CrossRef Full Text | Google Scholar
Singh, A. K., and Sherman, L. A. (2005). Pleiotropic effect of a histidine kinase on carbohydrate metabolism in Synechocystis sp. strain PCC 6803 and its requirement for heterotrophic growth. J. Bacteriol. 187, 2368–2376. doi: 10.1128/JB.187.7.2368-2376.2005
PubMed Abstract | Full Text | CrossRef Full Text | Google Scholar
Umbarger, H. E. (1978). Amino acid biosynthesis and its regulation. Ann. Rev. Biochem. 47, 533–606. doi: 10.1146/annurev.bi.47.070178.002533
PubMed Abstract | Full Text | CrossRef Full Text | Google Scholar
Wang, J., Zhang, X., Shi, M., Gao, L., Niu, X., Te, R., et al. (2014). Metabolomic analysis of the salt-sensitive mutants reveals changes in amino acid and fatty acid composition important to long-term salt stress in Synechocystis sp. PCC 6803. Funct. Integr. Genomics 14, 431–440. doi: 10.1007/s10142-014-0370-7
PubMed Abstract | Full Text | CrossRef Full Text | Google Scholar
Williams, J. G. K. (1988). Construction of specific mutations in photosystem II photosynthetic reaction center by genetic engineering methods in Synechocystis 6803. Methods Enzymol. 167, 766–778.
Yamane, K., Matsuyama, S., Igarashi, K., and Kuwabara, T. (2013). Pyrolytic generation of petroleum crude oils from the marine phytomicroalgal Coccolithophore Emiliania huxleyi (Haptophyta) and preparation of n-alkane-rich biofuel. Energy Fuels 27, 7470–7479. doi: 10.1021/ef401618t
Yu, Y., You, L., Liu, D., Hollinshead, W., Tang, Y. J., and Zhang, F. (2013). Development of Synechocystis sp. PCC 6803 as a phototrophic cell factory. Mar. Drugs 11, 2894–2916. doi: 10.3390/md11082894
PubMed Abstract | Full Text | CrossRef Full Text | Google Scholar
Keywords: amino acids, artificial seawater, cyanobacteria, natural seawater, Synechocystis
Citation: Iijima H, Nakaya Y, Kuwahara A, Hirai MY and Osanai T (2015) Seawater cultivation of freshwater cyanobacterium Synechocystis sp. PCC 6803 drastically alters amino acid composition and glycogen metabolism. Front. Microbiol. 6:326. doi: 10.3389/fmicb.2015.00326
Received: 19 February 2015; Accepted: 01 April 2015;
Published: 22 April 2015.
Edited by:
Youn-Il Park, Chungnam National University, South KoreaReviewed by:
Gopal K. Pattanayak, The University of Chicago, USAReinhard Korbinian Proels, Technische Universität München, Germany
Copyright © 2015 Iijima, Nakaya, Kuwahara, Hirai and Osanai. This is an open-access article distributed under the terms of the Creative Commons Attribution License (CC BY). The use, distribution or reproduction in other forums is permitted, provided the original author(s) or licensor are credited and that the original publication in this journal is cited, in accordance with accepted academic practice. No use, distribution or reproduction is permitted which does not comply with these terms.
*Correspondence: Takashi Osanai, RIKEN Center for Sustainable Resource Science, 1-7-22 Suehiro-cho, Tsurumi-ku, Yokohama, Kanagawa 230-0045, Japan takashi.osanai.aa@riken.jp