 Giovanni Sandrini
 Serena Cunsolo
 J. Merijn Schuurmans
 Hans C. P. Matthijs1
 Jef Huisman
- 1Department of Aquatic Microbiology, Institute for Biodiversity and Ecosystem Dynamics, University of Amsterdam, Amsterdam, Netherlands
- 2Department of Aquatic Ecology, Netherlands Institute of Ecology, Wageningen, Netherlands
Rising CO2 concentrations may have large effects on aquatic microorganisms. In this study, we investigated how elevated pCO2 affects the harmful freshwater cyanobacterium Microcystis aeruginosa. This species is capable of producing dense blooms and hepatotoxins called microcystins. Strain PCC 7806 was cultured in chemostats that were shifted from low to high pCO2 conditions. This resulted in a transition from a C-limited to a light-limited steady state, with a ~2.7-fold increase of the cyanobacterial biomass and ~2.5-fold more microcystin per cell. Cells increased their chlorophyll a and phycocyanin content, and raised their PSI/PSII ratio at high pCO2. Surprisingly, cells had a lower dry weight and contained less carbohydrates, which might be an adaptation to improve the buoyancy of Microcystis when light becomes more limiting at high pCO2. Only 234 of the 4691 genes responded to elevated pCO2. For instance, expression of the carboxysome, RuBisCO, photosystem and C metabolism genes did not change significantly, and only a few N assimilation genes were expressed differently. The lack of large-scale changes in the transcriptome could suit a buoyant species that lives in eutrophic lakes with strong CO2 fluctuations very well. However, we found major responses in inorganic carbon uptake. At low pCO2, cells were mainly dependent on bicarbonate uptake, whereas at high pCO2 gene expression of the bicarbonate uptake systems was down-regulated and cells shifted to CO2 and low-affinity bicarbonate uptake. These results show that the need for high-affinity bicarbonate uptake systems ceases at elevated CO2. Moreover, the combination of an increased cyanobacterial abundance, improved buoyancy, and higher toxin content per cell indicates that rising atmospheric CO2 levels may increase the problems associated with the harmful cyanobacterium Microcystis in eutrophic lakes.
Introduction
Cyanobacterial blooms are a well-known cause of nuisance in eutrophic lakes (Chorus and Bartram, 1999; Huisman et al., 2005; Merel et al., 2013). They may increase the turbidity of the water column, suppressing the growth of submerged water plants (Scheffer, 1998), and can produce considerable odor and taste problems (Watson et al., 2008). Moreover, cyanobacteria can produce a variety of potent toxins, including microcystins and anatoxins, which cause liver, digestive, and neurological disease in birds, mammals, and humans (Jochimsen et al., 1998; Carmichael, 2001; Codd et al., 2005). This has led to the closure of lakes and reservoirs for recreational use, aquaculture, drinking water, and irrigation water, often with considerable economic damage as a result (Verspagen et al., 2006; Dodds et al., 2008; Qin et al., 2010).
Several studies warn of an intensification of cyanobacterial blooms in eutrophic waters, due to the combination of global warming (Jöhnk et al., 2008; Paerl and Huisman, 2008; O'Neil et al., 2012) and rising CO2 concentrations in the atmosphere (Verschoor et al., 2013; Verspagen et al., 2014a,b). The dissolved inorganic carbon (Ci) concentration in eutrophic lakes can vary strongly. Many lakes are supersaturated with dissolved CO2 (dCO2) with concentrations that can go up to 10,000 ppm (Cole et al., 1994; Sobek et al., 2005; Lazzarino et al., 2009), but lakes with high photosynthetic activities of dense cyanobacterial blooms have often undersaturating dCO2 concentrations (Ibelings and Maberly, 1998; Balmer and Downing, 2011; Verspagen et al., 2014b). Depletion of dCO2 during cyanobacterial blooms is accompanied by a strong increase in pH (Talling, 1976; Jeppesen et al., 1990; López-Archilla et al., 2004). With increasing pH, the speciation of dissolved inorganic carbon shifts from dCO2 toward bicarbonate (HCO−3) and carbonate (CO2−3). Because phytoplankton species differ in their uptake rates of dCO2 and bicarbonate (Rost et al., 2003; Price et al., 2008; Maberly et al., 2009), these changes in carbon speciation may strongly affect competitive interactions between the species (Tortell et al., 2002; Rost et al., 2008; Verschoor et al., 2013). In particular, cyanobacteria are believed to be very efficient competitors at low CO2 conditions (Shapiro, 1997).
Many cyanobacteria have evolved a highly efficient CO2-concentrating mechanism (CCM) to proliferate at low ambient dCO2 levels and to overcome the low affinity of the primary CO2 fixing enzyme, RuBisCO (Giordano et al., 2005; Price et al., 2008; Raven et al., 2012). The CCM of cyanobacteria works quite differently from CCMs found in eukaryotic algae. In the latter, a pH gradient across the chloroplast thylakoid membrane in the light secures Ci accumulation in the cytosol (Moroney and Ynalvez, 2007). In cyanobacteria, the CCM is based on accumulation of bicarbonate in specialized compartments, called carboxysomes, that contain the RuBisCO enzyme. Conversion of bicarbonate inside the carboxysomes by carbonic anhydrases raises the local CO2 concentration, near RuBisCO, which can then efficiently fix CO2 (Price et al., 2008). However, photorespiration and Mehler-like reactions have also been identified in cyanobacteria, signifying that cyanobacterial photosynthesis can still be limited by a low Ci availability despite their CCM (Helman et al., 2005; Zhang et al., 2009; Hackenberg et al., 2012). Up to four flavodiiron proteins (Flv1-4) are involved in the low Ci adaptation process, acting as an electron sink at photosystem I (PSI, for Flv1,3) and photosystem II (PSII, for Flv2,4) (Allahverdiyeva et al., 2011; Zhang et al., 2012; Bersanini et al., 2014).
The CCMs of fully sequenced cyanobacteria, like Synechocystis PCC 6803 and several Synechococcus strains, have been studied in detail (Omata et al., 1999; Price et al., 2004; Schwarz et al., 2011). This has revealed that cyanobacteria have several different Ci uptake systems: three systems for bicarbonate uptake have been identified and two systems for CO2 uptake (Price, 2011). BicA and SbtA are both sodium-dependent bicarbonate symporters. BicA has a low affinity and high flux rate, whereas SbtA has a high affinity and low flux rate (Price et al., 2004). The third bicarbonate uptake system, BCT1, has direct ATP-dependent functionality and consists of four subunits (CmpABCD). BCT1 has a relatively high affinity for bicarbonate and low flux rate, although its affinity is slightly lower than that of SbtA (Omata et al., 1999, 2002; Price et al., 2008). The two CO2 uptake systems, NDH-13 and NDH14, convert CO2 that passively diffuses into the cell to bicarbonate, and consist of multiple subunits (Price, 2011). The two CO2 uptake systems are likely NADPH-dependent (Price et al., 2002). Functionally, NDH-13 has a high substrate affinity and low flux rate, whereas NDH-I4 combines a lower substrate affinity with a higher flux rate (Maeda et al., 2002; Price et al., 2002).
From an environmental and ecological perspective, the harmful cyanobacterium Microcystis aeruginosa (hereafter called Microcystis) is of great interest. Microcystis is one of the more notorious cyanobacterial species, producing dense and often toxic blooms in eutrophic lakes all over the world (Chen et al., 2003; Verspagen et al., 2006; Michalak et al., 2013). Now that full genome analysis has been completed for a range of different Microcystis strains (e.g., Kaneko et al., 2007; Frangeul et al., 2008; Humbert et al., 2013), knowledge on carbon acquisition is available, which enables detailed study of the response of Microcystis to rising CO2 levels. Selection experiments have shown that rising CO2 levels may shift the competitive balance between toxic and nontoxic Microcystis strains (Van de Waal et al., 2011). Furthermore, the genetic diversity of the CCM in different Microcystis strains was recently elucidated (Sandrini et al., 2014). This revealed that all investigated Microcystis strains contained genes encoding the two CO2 uptake systems, the bicarbonate uptake system BCT1 and several carbonic anhydrases, but the strains differ in the presence of the bicarbonate uptake genes bicA and sbtA.
In this study, we investigate the response of the toxic Microcystis strain PCC 7806 to rising CO2 levels, and how its gene expression and cell physiology, including the presence of its toxin microcystin, change at elevated pCO2. For this purpose, Microcystis was cultivated in controlled laboratory chemostats that were shifted from low to high pCO2 conditions. We provided the chemostats with a low CO2 partial pressure (pCO2) of 200 ppm to create Ci-limited conditions. After 36 days, we raised the pCO2 level to 1450 ppm pCO2, which is a representative level for many supersaturated lakes (Sobek et al., 2005). Our results show that elevated CO2 leads to a highly specific transcriptome response of Microcystis, and affects the Ci uptake, biomass, cellular composition, and toxicity of Microcystis cells.
Materials and Methods
Chemostat Experiment
The axenic strain Microcystis strain PCC 7806 was obtained from the Pasteur Culture Collection (Paris, France). The strain was originally isolated from the Braakman reservoir, The Netherlands in 1972. It contains genes for the two CO2 uptake systems, the bicarbonate uptake systems BCT1 (high affinity) and BicA (low affinity), but lacks the high-affinity bicarbonate uptake system SbtA (Sandrini et al., 2014). The Microcystis strain was pre-cultured in four 2-L Erlenmeyer flasks using modified BG11 medium (Rippka et al., 1979) with 10 mmol L−1 NaNO3 and without Na2CO3 or NaHCO3, at an incident light intensity of 15 μmol photons m−2 s−1, 400 ppm CO2, and a temperature of 25°C. Regular microscopy did not reveal contaminations.
The experiment was carried out in four replicate chemostats designed for phytoplankton growth (Huisman et al., 2002) using the same modified BG11 medium. Each chemostat consisted of a flat culture vessel that was illuminated from one side (the front surface) to obtain a unidirectional light gradient. We applied a constant incident irradiance (Iin) of 50 μmol photons m−2 s−1 using white fluorescent tubes (Philips Master TL-D 90 De Luxe 18 W/965, Philips Lighting, Eindhoven, The Netherlands). The chemostats had an optical path length of 5 cm and an effective working volume of 1.8 L. The temperature in the chemostats was maintained at 25°C using a stainless steel cooling finger connected to a water bath (Haake A28F/AC200; Thermo Fisher Scientific, Pittsburgh, PA, USA). The dilution rate was set at 0.01 h−1.
The chemostats were bubbled with CO2-enriched air at a flow rate of 25 L h−1. The CO2-enriched air was based on pressurized air (21% O2, 78% N2), from which the CO2 was removed by a CO2 adsorption air dryer (Ecodry K-MT6; Parker Zander, Lancaster, NY, USA) and four 1 m high columns filled with NaOH pellets. Subsequently, different amounts of pure CO2 gas were added using GT 1355R-2-15-A 316 SS Flow Controllers and 5850S Mass Flow Controllers (Brooks Instrument, Hatfield, PA, USA) to obtain the desired CO2 concentration. The gas mixture was moistened with 25°C water to suppress evaporation and led through a 0.20 μm Midisart 2000 filter (Sartorius Stedim Biotech GmbH, Göttingen, Germany) to sterilize the air, before it entered the chemostats. The CO2 concentration in the gas mixture was checked regularly with an Environmental Gas Monitor for CO2 (EGM-4; PP Systems, Amesbury, MA, USA).
Prior to the experiment, the four chemostats were inoculated with Microcystis from exponentially growing pre-cultures. The cultures were allowed to acclimate to the new chemostat conditions for 10 days. Subsequently, the cultures were diluted to an initial cyanobacterial abundance of ~60 mm3 L−1 to start the experiment. The CO2 concentration in the gas mixture was 200 ± 10 ppm CO2 during the first 36 days of the experiment (and also during the preceding acclimation phase). After 36 days, the CO2 concentration was raised to 1450 ± 50 ppm CO2. The experiment was run for 50 days, during which the chemostats were sampled 3–5 times per week.
Light and Cyanobacterial Abundance
The incident irradiance (Iin) and the irradiance penetrating through the chemostat vessel (Iout) were measured with a LI-COR LI-250 quantum photometer (LI-COR Biosciences, Lincoln, NE, USA) at ten positions on the front and back surface of the chemostat vessels, respectively. Cell numbers, biovolumes and average cell size of samples were determined in triplicate using a Casy 1 TTC cell counter with a 60 μm capillary (Schärfe System GmbH, Reutlingen, Germany). Dry weight was determined in duplicate by filtering 0.75–10 mL of sample over pre-weighted 1.2 μm pore size 25 mm GF/C glass filters (Whatman GmbH, Dassel, Germany). Filters with cells were dried for 2 days in a 60°C oven, transferred to a desiccator to cool to room temperature, and subsequently weighted again.
Aquatic Chemistry
The pH of the samples was measured immediately after sample collection with a Lab 860 pH meter in combination with a BlueLine 28 Gel pH electrode (SCHOTT Instruments GmbH, Mainz, Germany). For dissolved inorganic carbon (DIC) concentration, alkalinity, and nitrate measurements, samples of 40 mL were immediately centrifuged (5 min at 4000 g and 20°C). The pellets were used for cellular C and N analysis, whereas the supernatant was filtered over 0.45 μm pore size 47 mm polyethersulfone membrane filters (Sartorius AG, Goettingen, Germany). The filtrate was transferred to sterile plastic urine tubes (VF-109SURI; Terumo Europe N.V., Leuven, Belgium). The tubes were filled completely and stored at 4°C until further analysis. DIC (three to five technical replicates) was measured with a TOC-VCPH TOC analyzer (Shimadzu, Kyoto, Japan). Concentrations of dCO2, bicarbonate, and carbonate were calculated from DIC and pH (Stumm and Morgan, 1996). Alkalinity was determined with a 716 DMS Titrino titrator (Metrohm Applikon B.V., Schiedam, The Netherlands), based on the amount of 0.01 or 0.1 mol L−1 HCl added to reach pH 4.5 (ISO 9963-1:1994). The nitrate concentration was measured with a TNM-1 nitrogen detector (Shimadzu, Kyoto, Japan) attached to the TOC-VCPH TOC analyzer.
Cellular Composition
Cellular C and N contents were determined by gently washing the pellets obtained from the previous centrifugation twice (5 min at 4000 g and 20°C) with a C- and N-free solution (10 mmol L−1 NaCl and 10 mmol L−1 K2HPO4 pH 8.0). The washed pellets were stored at −20°C until further analysis. Subsequently, the pellets were freeze dried, and the C and N content of 5 mg homogenized freeze-dried powder was analyzed using a Vario EL Elemental Analyzer (Elementar Analysensysteme GmbH, Hanau, Germany).
To determine the cellular carbohydrate, lipid, protein, and phosphate content, 2 mL samples were centrifuged and the pellets were stored at −20°C until further analysis. Carbohydrate was quantified using the phenol-sulphuric acid method, with D-glucose (Merck Millipore, Darmstadt, Germany) as standard (Dubois et al., 1956). Lipids were extracted with methanol and chloroform, and subsequently the lipid content was quantified using the sulphuric acid-vanillin-phosphoric acid method, with Triolein (>99%, Sigma-Aldrich Co, St Louis, MO, USA) as standard (Izard and Limberger, 2003). Proteins were quantified with the Bradford assay, using Brilliant Blue G-250 and bovine serum albumin as standard (Bradford, 1976). Cellular P was obtained by oxidizing cells with potassium persulfate for 1 h at 100°C (Wetzel and Likens, 2000), after which the phosphate concentration was measured colorimetrically according to Murphy and Riley (1962).
In vivo Absorption Spectra
Light absorption spectra of the samples were scanned from 400 to 750 nm with a bandwidth of 0.4 nm using an Aminco DW-2000 double-beam spectrophotometer (Olis Inc., Bogart, GA, USA). BG11 medium without cells was used as baseline and the spectra were normalized based on the absorbance at 750 nm.
Low Temperature Fluorescence
Relative amounts of PSI and PSII were determined using an Olis DM 45 77 K spectrofluorometer connected to an Olis photon counter (Olis Inc., Bogart, GA, USA). Glycerol (30% final concentration) was added to the samples, which were transferred to 3 mL polystyrene cuvettes (Sigma-Aldrich Co, St Louis, MO, USA) and frozen in liquid nitrogen. The excitation wavelength was 440 nm for chlorophyll a. Emission spectra of the samples were measured in triplicate at 600–750 nm, and normalized based on the mean emission at 600–660 nm.
Microcystin Analysis
Microcystis PCC 7806 produces two microcystin variants, [Asp3]MC-LR and MC-LR (Tonk et al., 2009). To determine the intracellular unbound microcystin content (cf. Meissner et al., 2013), 1–5 mL samples were filtered over 1.2 μm pore size 25 mm GF/C filters (Whatman GmbH, Dassel, Germany). The filters were stored at −20°C and subsequently freeze dried. Microcystins were extracted with 75% MeOH and analyzed with HPLC according to Van de Waal et al. (2011), using a Shimadzu LC-20AD HPLC system with a SPD-M20A photodiode array detector (Shimadzu, Kyoto, Japan). Peaks of [Asp3]MC-LR and MC-LR could not be completely separated. Therefore, both peaks were summed and are referred to as total microcystin. Earlier chemostat experiments showed that extracellular microcystin concentrations in the water phase were negligible (e.g., Van de Waal et al., 2011).
RNA Extraction
RNA samples for transcriptome analysis were taken from all four chemostats, at 0 h (just before increasing the pCO2) and at 0.75, 2, 4, 8, 24, 72, and 336 h after increasing the pCO2 from 200 to 1450 ppm. Fresh culture samples of ~40 mL were immediately cooled on ice and centrifuged for 5 min at 4000 g and 4°C in a pre-cooled centrifuge. The pellets were immediately resuspended in 1 mL TRIzol (Life Technologies, Grand Island, NY, USA), frozen in liquid nitrogen and stored at −80°C. Subsequently, RNA was extracted with TRIzol (Invitrogen) according to the supplier's instructions, using beads (0.5 mm BashingBeads; Zymo Research, Orange, CA, USA) to facilitate cell disruption. After the phase separation steps, the Direct-Zol™ RNA MiniPrep kit (Zymo Research) was used for RNA purification. The in-column DNase I digestion was included as well. RNA concentrations were quantified using a Nanodrop 1000 spectrophotometer (Thermo Scientific, San Jose, CA, USA), and all RNA samples had A260/A280 and A260/A230 values above 1.8. The quality of the RNA extracts was checked using an Agilent 2100 Bioanalyzer (Agilent Technologies, Amstelveen, the Netherlands).
cDNA Synthesis for Microarray Analysis
The cDNA library was prepared using the Superscript III Reverse Transcriptase kit (Invitrogen, Carlsbad, CA, USA) according to Eisenhut et al. (2007), with incorporation of Cy3-dUTP or Cy5-dUTP (Amersham Biosciences Benelux, Roosendaal, the Netherlands) in the cDNA. Non-incorporated fluorescent nucleotides were removed with the QIAquick PCR purification kit (Qiagen, Venlo, the Netherlands). The reverse transcription and fluorescent dye incorporation efficiency were monitored with a Nanodrop 1000 spectrophotometer (Thermo Scientific, San Jose, CA, USA).
Microarray Design
The transcriptome study was performed on two Agilent 8 × 60 K two-color microarray chips (Agilent Technologies, Amstelveen, the Netherlands). The microarray design and probe library of Microcystis PCC 7806 was based on Makower et al. (2015), which was partly derived from Straub et al. (2011). The sequence-specific oligonucleotide probes (60-mers) targeted 4691 protein-coding genes, which corresponds to 88.6% of the total predicted protein-coding genes in the annotated genome of Microcystis PCC 7806 (Frangeul et al., 2008). On average, five different probes per gene were used. Cy3- and Cy5-labeled cDNA probe samples from just before and at specific time points after increasing the pCO2 in the four chemostats were combined. A loop design was used, in which samples from the same chemostat but different time points were compared (Supplementary Table 1). The hybridization, washing and array reading were performed as described by Eisenhut et al. (2007).
Microarray Data Analysis
The array data were analyzed with the R package Limma version 3.18.13 (Smyth, 2005; www.bioconductor.org; www.R-project.org). After background correction (“minimal method”), within-array normalization was applied using global loess normalization. Subsequently, the data was log2 transformed. Between-array normalization was applied using A-quantile normalization (Bolstad et al., 2003). Log2 expression values for the different time points (after increasing the pCO2) were calculated with respect to the reference value at t = 0 (just before increasing the pCO2). Expression values of multiple probes per gene were averaged. Hence, for each gene we obtained four expression values per time point, based on the four replicate chemostats. For each time point, p-values were calculated from the moderated t-statistic, and were adjusted for multiple hypothesis testing by controlling the false discovery rate (Storey and Tibshirani, 2003). Log2 gene expression values of < -0.9 or > 0.9 (similar to Nodop et al., 2008; Schwarz et al., 2011), and p < 0.01 were considered differentially expressed. Visual representation was done using hierarchical clustering and heatmaps with the hclust and heatmap.2 functions of the R gplots package version 2.13.0. The expression values, corresponding p-values and gene function according to CyanoBase (http://genome.microbedb.jp/cyanobase/Synechocystis/genes/category) of all investigated genes are listed in Supplementary Table 2.
RT-qPCR Gene Expression Analysis
To validate the microarray results, we also investigated changes in gene expression of several CCM genes and the mcyB gene using RT-qPCR. We designed gene-specific primers (Supplementary Table 3). Secondary structure analysis of the primers was checked with OligoAnalyzer 3.1 (Integrated DNA Technologies, Coralville, IA, USA) and the in silico specificity was assessed using Primer-BLAST (Ye et al., 2012). The specificity of the primers was confirmed with normal PCR on genomic DNA using the GoTaq® Hot Start DNA polymerase kit (Promega GmbH, Mannheim, Germany) combined with gel electrophoresis.
For the RT-qPCR gene expression analysis, we used the same RNA samples as for the microarray analysis at the time points 0, 4, and 336 h (2 weeks) after increasing the pCO2. cDNA was synthesized by reverse transcription of the RNA samples with Superscript III (Invitrogen) according to the supplier's instructions, using 250 ng random hexamers (Amersham Biosciences Benelux, Roosendaal, the Netherlands) and 5 μg of pure RNA in a total reaction volume of 20 μL. Next, the RNase H treatment (New England Biolabs, Ipswich, MA, USA) was applied to remove any RNA complementary to the cDNA. Subsequently, the qPCR Maxima® SYBR Green Master Mix (2x) (Thermo Fisher Scientific, Pittsburgh, PA, USA) was applied on the cDNA samples according to the supplier's instructions, in an ABI 7500 Real-Time PCR system (Applied Biosystems, Foster City, CA, USA). The two step cycling protocol was used, with a denaturation temperature of 95°C (15 s) and a combined annealing/extension temperature of 60°C (60 s) during 40 cycles. The reactions contained 0.3 μmol L−1 primers and 1 μL of 10 times diluted cDNA from the RT reaction in a total reaction volume of 25 μL. Other reaction components were added as instructed by the supplier. ROX solution was used to correct for any well-to-well variation and melting curve analysis was performed on all measured samples to rule out non-specific PCR products.
Amplification efficiencies of individual runs (E) were calculated with LinRegPCR (version 2012.3; Ramakers et al., 2003; Ruijter et al., 2009) and were between 1.8 and 2.0 (Supplementary Table 3). Time point 0 (just before the pCO2 was increased) was used as reference sample, and 16S rRNA was used as reference gene. Each RT-qPCR plate contained a reference sample and samples with primers targeting 16S rRNA to overcome plate effects. For each individual sample, two technical replicates were measured and the average of the two measurements was used in the data analysis. The data were baseline corrected using LinRegPCR, and the same software was used to calculate quantification cycle (Cq) values. LinRegPCR did not detect samples without amplification, without a plateau, with a baseline error or noise error, or with deviating amplification efficiencies. Negative control samples did not show significant amplification. For each gene, we calculated the relative gene expression with respect to time point 0 using 16S rRNA as reference gene according to the 2−ΔΔCt method (Livak and Schmittgen, 2001). MS Excel version 2010 and SPSS version 20.0 were used for the statistical analyses. A one-tailed t-test was used to assess whether the change in gene expression with respect to time point 0 was significant (again with n = 4 expression values per time point, based on the four replicate chemostats). An independent samples t-test was used to detect differences between the 4 h and 2 week samples. The false discovery rate (FDR) was used to correct for multiple hypothesis testing (Benjamini and Yekutieli, 2001; FDR adjusted p < 0.05).
O2 Optode Experiments
In mineral medium without nitrate, the O2 evolution rate of cyanobacterial cells exposed to saturating light provides a good proxy of their Ci uptake rate (Miller et al., 1988). We therefore measured O2 evolution with an Oxy-4 mini O2 optode (PreSens GmbH, Regensburg, Germany) to study the Ci uptake of samples from the steady-state chemostats at 200 and 1450 ppm pCO2. External carbonic anhydrase activity in Microcystis was previously shown to be negligible (Song and Qiu, 2007). Fresh cell samples were pelleted (4000 g for 5 min at 20°C), washed 1x and then resuspended in Ci- and nitrate-depleted modified BG11 medium (no added NaNO3 and NaCO3/NaHCO3, but with 25 mmol L−1 NaCl and 10 mmol L−1 CAPSO-NaOH added at pH 9.8; the medium was aerated with N2 gas for 4 h before usage). The absorbance at 750 nm (A750) of washed and resuspended samples was 0.300. Three mL of sample was inserted into custom-made glass incubation chambers (four measurements were done at the same time), each connected to an O2 optode. The glass chambers were connected to a RM6 water bath (Lauda, Lauda-Königshofen, Germany) to keep the temperature of the samples at 20.3°C. Magnetic stirring was used for mixing. The O2 optode sensors were calibrated with N2 gas (“0%”) and air (“100%”). A saturating amount of light (500 μmol photons m−2 s−1) was used, which was provided by KL1500 compact Schott lamps (Schott AG, Mainz, Germany). Subsequently, specific amounts of NaHCO3 were added (5, 20, 100, 300, 1000, or 10,000 μmol L−1), after which the rate of O2 evolution (μmol L−1 min−1) was measured. The evolution was expressed per mg of chlorophyll a. Photosynthetic pigments were extracted with 90% acetone and analyzed using HPLC with photodiode array detection (LC-20AD liquid chromatographs, SIL-20A auto sampler, CTO-20AC column oven, SPD-M20A diode array detector, RF-10AXL fluorescence detector; Shimadzu, Kyoto, Japan). Identification of chlorophyll a was based on the characteristic absorbance at 664 nm and the specific retention time compared with a standard obtained from DHI Group (Copenhagen, Denmark).
To evaluate the activity of the different Ci uptake systems, we investigated O2 evolution in the presence and absence of 25 mmol L−1 LiCl. Lithium ions are known to inhibit the activity of the sodium-dependent bicarbonate uptake systems (e.g., Espie et al., 1988). The experiments were performed at pH 7.8 (using 10 mmol L−1 TES-KOH pH 7.8 buffer) and pH 9.8 (using 10 mmol L−1 CAPSO-KOH pH 9.8 buffer) to vary the relative availability of CO2 and HCO−3, using Ci and N depleted modified BG11 medium containing 25 mmol L−1 NaCl to which 200 μmol L−1 KHCO3 was added after initial Ci depletion. To test if O2 evolution rates differed significantly between the treatments, one-way analysis of variance was used with post-hoc comparison of the means based on Tukey's test (n = 4 replicates per treatment).
Results
Population Dynamics and Inorganic Carbon Chemistry
During the first phase of the experiment, we used a low pCO2 concentration in the gas flow of 200 ppm to create Ci-limited conditions. In all four replicate chemostats, the cyanobacterial abundance gradually increased over time and approached a steady state after ~17 days (Figure 1A). Cell growth in the chemostats attenuated the light passing through, so that the light penetration Iout at this first steady state was reduced to ~6 μmol photons m−2 s−1 (Figure 1A). The dCO2 concentration was depleted to the nano-molar range (Figure 1B). This was accompanied by a rise in pH to ~11, a strong decrease in bicarbonate concentration to ~60 μmol L−1 and a strong increase in carbonate concentration to ~300 μmol L−1 (Figures 1B,C). The total DIC concentration was not much affected during this first phase of the experiment (Figure 1C).
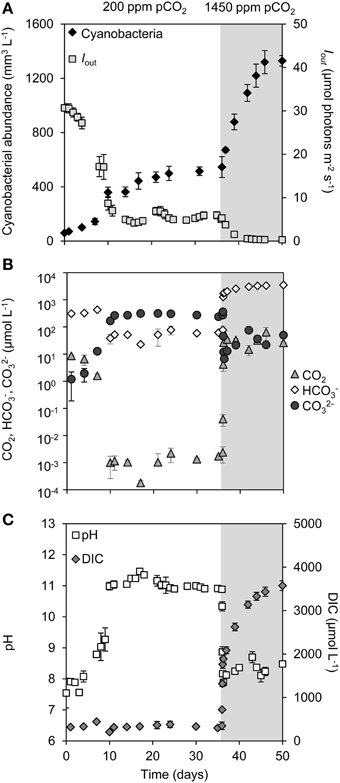
Figure 1. Changes in cyanobacterial abundance, light, dissolved inorganic carbon (DIC) and pH during a shift from low pCO2 (200 ppm, white area) to high pCO2 (1450 ppm, shaded area). (A) Cyanobacterial abundance (expressed as biovolume) and light intensity penetrating through the chemostat (Iout). (B) Dissolved CO2 (dCO2), bicarbonate (HCO−3) and carbonate (CO2−3) concentrations (logarithmic scale). (C) Dissolved inorganic carbon (DIC) and pH. Error bars indicate standard deviations (n = 4).
After 36 days, we raised the pCO2 level in the gas flow to 1450 ppm pCO2. The transition from 200 to 1450 ppm led to major changes in pH and inorganic carbon chemistry (Figures 1B,C; Supplementary Figure 1). Within 24 h, the dCO2 concentration increased over more than four orders of magnitude to ~30 μmol L−1, while the pH dropped back from 11 to 8 and the bicarbonate concentration increased to ~2000 μmol L−1 (Supplementary Figure 1). The enhanced CO2 availability alleviated the cyanobacteria from Ci limitation, thus enabling a strong increase in cyanobacterial abundance (Figure 1A). The resultant high biomass effectively absorbed all incident light, reducing light penetration through the chemostats to Iout < 0.1 μmol photons m−2 s−1 (Figure 1A). Nitrate uptake by the growing cyanobacterial population increased alkalinity (Supplementary Figure 2), which initiated a progressive further increase of the DIC concentration (Figure 1C). After 46 days a new steady state was attained, with a ~2.7-fold higher cyanobacterial abundance than the previous steady state, a DIC concentration of ~3500 μmol L−1 consisting largely of bicarbonate and CO2, but low light conditions (Figures 1A–C).
Cell Volume, Cell Weight, and Cellular Composition
Although the cell volume of Microcystis was hardly affected by the elevated pCO2, the average dry weight of the cells decreased by 50%, from 12 to 6 pg celL−1 (Figure 2A). This was accompanied by a decrease of the C and N content of the cells at elevated pCO2 (Figure 2B). Remarkably, the molar C/N ratio of the cells also slightly decreased at elevated pCO2 (Figure 2C), despite the strong increase in Ci availability.
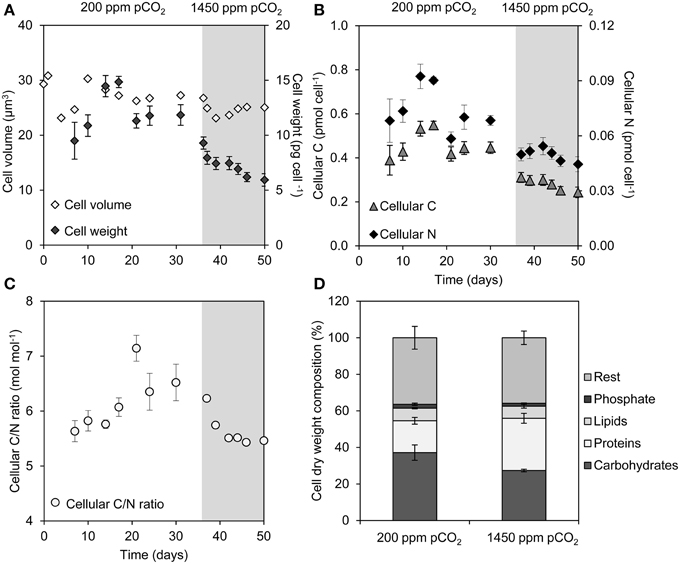
Figure 2. Changes in cell properties during a shift from low pCO2 (200 ppm, white area) to high pCO2 (1450 ppm, shaded area). (A) Average cell volume and cell weight. (B) Cellular elemental C and N content. (C) Molar C/N ratio of the cells. (D) Dry weight composition of cells from the steady states at 200 and 1450 ppm pCO2. Error bars indicate standard deviations (n = 4).
Major macromolecules (carbohydrates, proteins, and lipids) and phosphate stored in the cells were quantified just before and 2 weeks after raising the pCO2 level (Figure 2D). The carbohydrate content (expressed as % dry weight) decreased significantly (Student t-test: t6 = 4.6, p < 0.01), whereas the protein content increased significantly at elevated pCO2 (Student t-test: t6 = -6.8, p < 0.001) (Figure 2D), which is consistent with the decrease of the cellular C/N ratio (Figure 2C). Lipids and phosphate contributed less to the total average cell weight than carbohydrates. Genes involved in carbohydrate storage and polyhydroxyalkanoate (PHA) storage showed no large changes in expression during the experiment, although minor upregulation of the pha genes was noticeable 8 h after the switch to high pCO2 (Table 1).
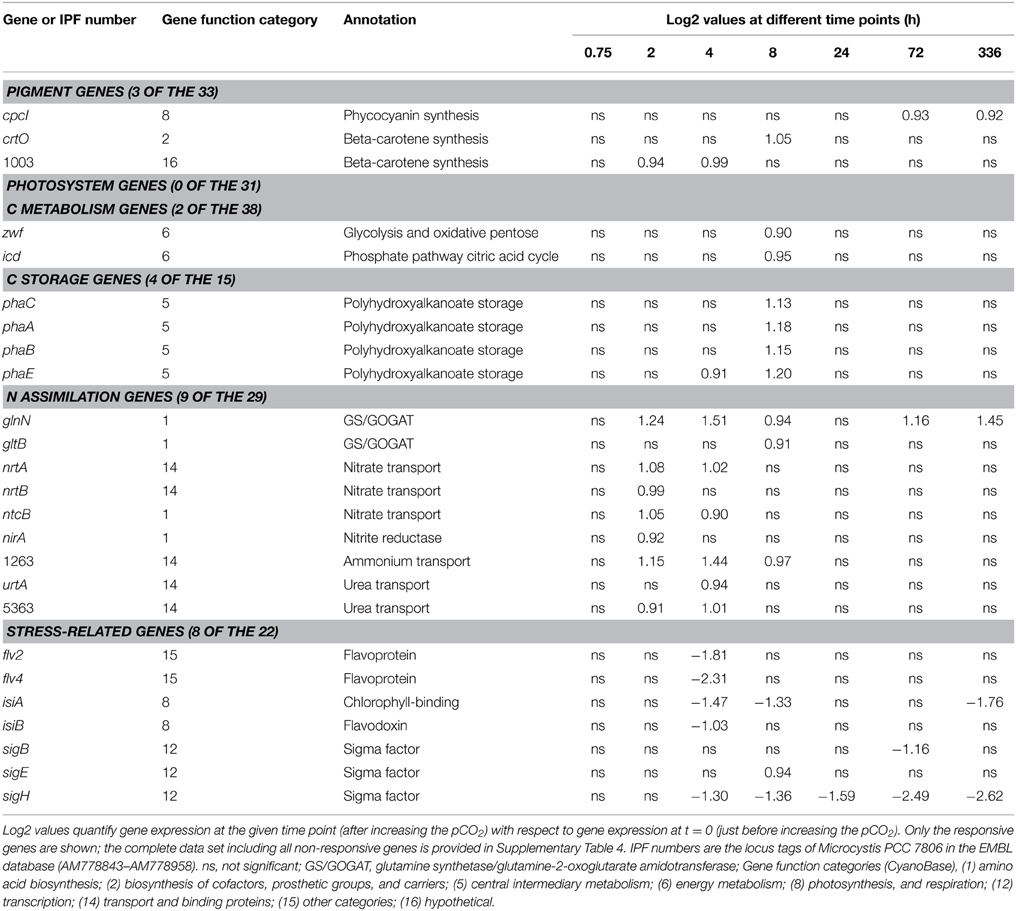
Table 1. Genes responding to rising pCO2 and involved in pigment synthesis, photosystems, C metabolism, C storage, N assimilation, and stress response.
Pigments and Photosystems
Light absorption spectra normalized at 750 nm indicated that the cellular contents of the pigments chlorophyll a, phycocyanin, and β-carotene increased at elevated pCO2 (Figure 3A). The phycocyanin peak (at 626 nm) increased slightly more than the chlorophyll a peak (at 678 nm). The ratio of PSI to PSII changed, with less PSII and more PSI at elevated pCO2 (Figure 3B). Yet, only a few genes involved in pigment synthesis and none of the photosystem genes changed expression significantly after exposure to high pCO2 (Table 1).
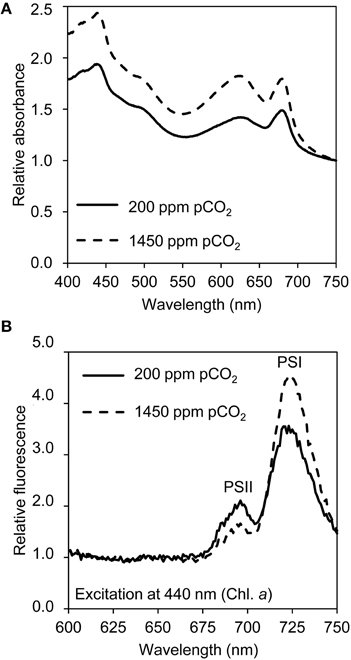
Figure 3. Light absorption and emission spectra of cells grown at low pCO2 (200 ppm) and high pCO2 (1450 ppm). (A) Light absorption spectra normalized at 750 nm, with peaks of chlorophyll a (436 and 678 nm), β-carotene (shoulder at 490 nm) and phycocyanin (626 nm). (B) 77 K fluorescence emission spectra normalized based on the mean emission at 600–660 nm, with peaks of PSI (720 nm) and PSII (695 nm). The spectra are the average of four biological replicates.
Secondary Metabolites Including Toxins
The microcystin concentration stabilized at ~300 μg L−1 at low pCO2 and increased 6-fold to ~2000 μg L−1 at high pCO2 (Figure 4A). The microcystin content per cell was ~15 fg celL−1 at the steady state at low pCO2, and increased to ~38 fg celL−1 at high pCO2. Other secondary metabolites produced by Microcystis PCC 7806 include aeruginosin, microcyclamide, cyanopeptolin, and polyketides. However, expression of the microcystin, aeruginosin, microcyclamide, and cyanopeptolin operons did not change significantly (Figure 4B). In contrast, the expression of two polyketide synthase operons (PKS I/III) increased strongly 72 and 336 h after increasing the pCO2.
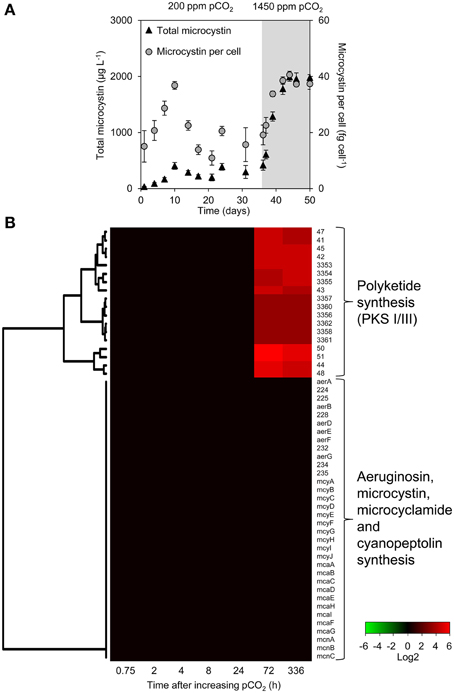
Figure 4. Changes in microcystin concentration and gene expression of secondary metabolite genes. (A) Total microcystin concentration and microcystin content per cell, during the shift from low pCO2 (200 ppm, white area) to high pCO2 (1450 ppm, shaded area). Error bars indicate standard deviations (n = 4). (B) Changes in expression of the secondary metabolite genes after the increase of pCO2 to 1450 ppm. Expression changes are quantified as log2 values. Red indicates significant upregulation and green significant downregulation; non-significant changes are in black. Hierarchical clustering was used to order the genes. The underlying data are presented in Supplementary Table 4.
Carbon, Nitrogen and Stress-Related Genes
Several but not all genes involved in the CCM of Microcystis responded to elevated CO2 (Figure 5). Expression of the cmpABCD operon encoding the BCT1 bicarbonate uptake system and the bicA-nhaS3 operon encoding the BicA bicarbonate uptake system was strongly reduced after 2 h at high pCO2 and remained low during the next 2 weeks. Expression levels of the transcriptional regulators ccmR (upstream of the high-affinity CO2 uptake operon) and ccmR2 (upstream of the bicA-nhaS3 operon) were also downregulated at elevated pCO2. In contrast, expression of the CO2 uptake system genes remained unchanged, except for a slight downregulation of the ndhF3 gene involved in high-affinity CO2 uptake. Expression of genes for carboxysome formation (ccmK2-4, ccmL, cmmM, ccmN, and ccmO), RuBisCO (rbcL, rbcS, and rbcX) and carbonic anhydrases (ccaA, ecaA, and ecaB) remained constant as well (Figure 5). Results of the microarray experiments were validated with RT-qPCR for selected CCM genes, which gave similar results (Supplementary Figure 3).
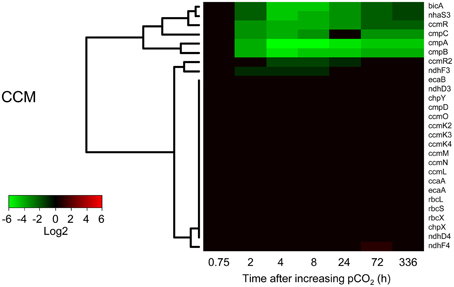
Figure 5. Changes in expression of the CO2-concentrating mechanism (CCM) genes after the increase of pCO2 to 1450 ppm. Expression changes are quantified as log2 values. Red indicates significant upregulation and green significant downregulation; non-significant changes are in black. Hierarchical clustering was used to order the genes. The underlying data are presented in Supplementary Table 4.
Only a few genes involved in C metabolism and N assimilation showed significant changes in expression at elevated pCO2 (Table 1). Expression of glnN, encoding for a glutamine synthetase, was upregulated at elevated pCO2. The genes nrtA and nrtB involved in nitrate uptake, nirA involved in nitrite reduction, and ntcB involved in the control of N assimilation were slightly upregulated shortly after increasing the pCO2.
Several stress-related genes were downregulated at elevated pCO2, including the flavodiiron protein genes flv2 and flv4, the iron-stress chlorophyll-binding protein gene isiA and the sigma factor sigH (Table 1).
Physiological Assay of Ci Uptake
To assess the activity of the bicarbonate uptake systems BicA and BCT1, O2 evolution was studied as a function of bicarbonate availability (Figure 6A). We added 25 mmol L−1 NaCl to enable sodium-dependent bicarbonate uptake by BicA. The experiments were performed at pH 9.8, at which DIC contains only ~0.03% dCO2. Without DIC in the medium the samples did not evolve O2, but their O2 evolution resumed after addition of NaHCO3. Cells from the chemostats at 200 ppm pCO2 had a higher affinity at low NaHCO3 concentrations (5–100 μmol L−1) than cells from the chemostats at 1450 ppm pCO2. At higher NaHCO3 concentrations (300–10,000 μmol L−1), cells from both pCO2 conditions reached a plateau in O2 evolution (Figure 6A). These results suggest that the high-affinity bicarbonate uptake system BCT1 was active in the chemostats at low pCO2 (200 ppm) but not at elevated pCO2 (1450 ppm), while the low-affinity bicarbonate uptake system BicA was active at both pCO2 levels.
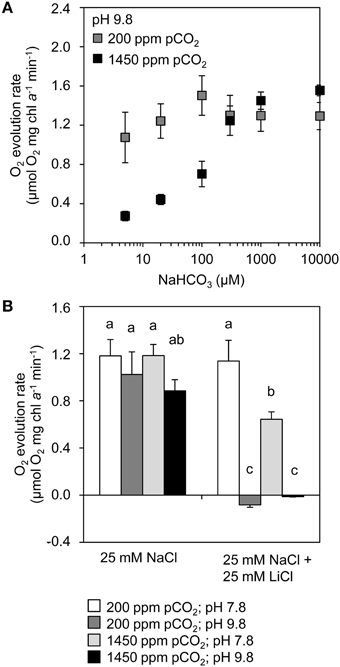
Figure 6. Inorganic carbon uptake kinetics of cells grown at low pCO2 (200 ppm) and high pCO2 (1450 ppm). (A) Bicarbonate response curves (O2 evolution rates) of cells grown at low vs. high pCO2 after addition of different concentrations of NaHCO3 at pH 9.8. (B) O2 evolution rates in the presence and absence of LiCl, at pH 7.8 and pH 9.8. The cells were provided with 200 μmol L−1 KHCO3. Lithium ions block sodium-dependent bicarbonate uptake, while differences in pH produce different concentrations of dCO2 and bicarbonate. Error bars indicate standard deviations (n = 4). Bars with different letters were significantly different, as tested by a one-way analysis of variance with post-hoc comparison of the means (α = 0.05).
To further explore the involvement of the Ci uptake systems, we added lithium ions to inhibit the sodium-dependent bicarbonate uptake of BicA (Figure 6B). These experiments were performed at pH 7.8 and pH 9.8, at which DIC contains 3.7% and 0.03% dCO2, respectively. For cells taken from both low and high pCO2 chemostats, we found high activity at pH 7.8 and at pH 9.8. However, addition of 25 mmol L−1 LiCl resulted in high activity at pH 7.8 but not at pH 9.8. At pH 7.8, the conversion of bicarbonate to CO2 and subsequent uptake by the CO2 uptake systems likely compensated for the inactivation of BicA by lithium ions. In contrast, at pH 9.8, when dCO2 is negligible and Ci uptake relies on bicarbonate, the inactivation of BicA by lithium ions was not compensated and drastically reduced Ci uptake. These results suggest that, in the chemostats, both BicA and the CO2 uptake systems were active at both pCO2 conditions.
Discussion
Alleviation from Ci Limitation
During dense blooms in eutrophic and hypertrophic lakes, cyanobacterial growth can become limited by a low Ci availability (Ibelings and Maberly, 1998; Balmer and Downing, 2011; Verspagen et al., 2014b). Our experiments show that at low atmospheric pCO2 levels, the photosynthetic activity of the cyanobacteria depleted the dCO2 concentration to the nanomolar range, while the bicarbonate and carbonate concentrations were orders of magnitude higher, which forced cells to primarily use bicarbonate as carbon source. An increase in pCO2 shifted the growth conditions from very low dCO2 concentrations and modest light availability to higher dCO2 concentrations but lower light levels (Figure 1). The Microcystis population in our experiments benefited strongly from the increased dCO2 availability, and accelerated cell division during the subsequent transient phase. This demonstrates that growth was indeed Ci limited at low pCO2 levels. The increased cyanobacterial abundance reduced light availability, until the cyanobacterial population settled at a new steady state. Hence, our experiments support the prediction (Verspagen et al., 2014b) that rising CO2 levels will alleviate cyanobacteria from Ci limitation, and are likely to increase the cyanobacterial abundance in eutrophic and hypertrophic lakes.
Surprisingly, the increase in pCO2 induced changes in the expression of only 234 genes of Microcystis PCC 7806 (Supplementary Figure 4). This is only ~5% of the total number of protein-encoding genes investigated in this study, and many of these showed differential expression at only a few time points. For instance, only 0.6% of the genes were differentially expressed at the time point of 24 h after the rise in CO2. In contrast, in other studies, 20–25% of the genes of Synechocystis PCC 6803 (Eisenhut et al., 2007) and 50–55% of the genes of Synechococcus elongatus PCC 7942 (Schwarz et al., 2011) were differentially expressed after 24 h of Ci limitation.
The much stronger transcriptome response in these two latter studies than in our results might be explained by differences in experimental design. (Eisenhut et al., 2007; Schwarz et al., 2011) exposed the cells to Ci starvation, which ceased cell growth and induced a large stress response. In contrast, the growth rate in our chemostat experiments was kept relatively high, which resulted in a milder response to elevated CO2. An alternative explanation might be that the cyanobacterium Microcystis shows a much more specific transcriptome response to changing Ci conditions than Synechocystis and Synechococcus. Microcystis is a buoyant cyanobacterium that can develop dense blooms in eutrophic lakes, where it is typically exposed to a wide range of different CO2 conditions (Verspagen et al., 2014b). A highly specific transcriptome response that mainly targets the Ci uptake systems could preserve energy and offer a robust strategy for a species that often experiences strongly fluctuating Ci conditions.
Changes in Expression of CCM Genes
Our results show that the bicarbonate uptake genes encoding for BCT1 and BicA were downregulated at elevated pCO2 (Figure 5). Additionally, expression of the transcriptional regulator ccmR2, located upstream of the bicA-nhaS3 operon, was lowered.
BCT1 has a relatively high affinity for bicarbonate (K0.5 ~10–15 μmol L−1) and a low flux rate (Omata et al., 2002). In line with expectation, expression of the genes cmpABCD encoding BCT1 was highest at the low pCO2 condition. This is further supported by the bicarbonate response curves of the O2 optode experiments, which showed high-affinity bicarbonate uptake at low pCO2 but not at high pCO2 (Figure 6A). The high activity of BCT1 in low pCO2 conditions is consistent with previous studies with other cyanobacteria, which showed enhanced expression of the cmpABCD genes upon induction of Ci limitation (Woodger et al., 2003; Eisenhut et al., 2007; Schwarz et al., 2011).
Conversely, BicA has a relatively low affinity for bicarbonate (K0.5 ~70–350 μmol L−1) while it has a high flux rate (Price et al., 2004). Contrary to expectation, the bicA expression was highest at low pCO2, where the bicarbonate concentration was only ~60 μmol L−1 (Figure 1B). This was also observed in a study of Synechococcus PCC 7002, where the expression of bicA was enhanced by Ci limitation (Woodger et al., 2007). However, it differs from studies of Synechocystis PCC 6803, which found that the expression of bicA was not much affected by the pCO2 level (Wang et al., 2004; Eisenhut et al., 2007). Our results show that, even though the bicA gene of Microcystis PCC 7806 was less expressed at high pCO2, the BicA enzyme was still active at high pCO2. This is apparent from the O2 optode experiments in which we blocked BicA activity with lithium ions (Figure 6). Hence, BicA appears active at a relatively wide range of bicarbonate concentrations.
Compared to several other Microcystis strains, Microcystis PCC 7806 lacks the bicarbonate uptake system SbtA (Sandrini et al., 2014), which has an even higher affinity for bicarbonate (K0.5 < 2 μmol L−1) than BCT1 (Price et al., 2004). Therefore, Microcystis PCC 7806 seems less adapted to very low bicarbonate conditions than SbtA-containing Microcystis strains, and was likely trying to take up as much bicarbonate as possible by expressing both BCT1 and BicA at the low pCO2 condition, even though the BicA uptake system did not operate very efficiently at that stage.
In contrast to the strong response of the bicarbonate uptake genes, gene expression of the CO2 uptake systems was not affected by elevated pCO2 (Figure 5). For instance, the chpX and chpY genes, encoding for the CO2 hydration subunit of the low-affinity and high-affinity CO2 uptake systems, respectively, were constitutively expressed in Microcystis PCC 7806. The constitutive expression of chpX is consistent with studies of other cyanobacteria (Woodger et al., 2003; Wang et al., 2004; Schwarz et al., 2011). However, the constitutive expression of chpY contrasts with studies of other cyanobacteria, which found that chpY was highly inducible when cells were exposed to Ci limitation (Price et al., 2004; Wang et al., 2004; Schwarz et al., 2011). Constitutive expression of the CO2 uptake systems indicates that at low dCO2 concentrations the Microcystis cells were still capable of CO2 uptake. This was confirmed by the O2 optode experiments, which showed that CO2 uptake was active at both pCO2 levels when bicarbonate uptake was blocked by lithium ions (Figure 6B).
Expression of the transcriptional regulator ccmR, located upstream of the high-affinity CO2 uptake operon, was strongly downregulated at high pCO2 (Figure 5). This is noteworthy, because expression of the high-affinity CO2 uptake genes did not respond to elevated pCO2. Possibly, CcmR regulates the expression of the cmpABCD operon of Microcystis, which was strongly downregulated at high pCO2. This would be consistent with the observation that CmpR, a known transcriptional regulator of the cmpABCD operon in other cyanobacteria, is lacking in Microcystis (Sandrini et al., 2014). Indeed, Woodger et al. (2007) previously showed that CcmR in Synechococcus PCC 7002 does not only control the high-affinity CO2 uptake operon but also the expression of other CCM genes.
Interestingly, gene expression of several key components of the CCM, including carboxysome, RuBisCO and carbonic anhydrase genes, was not affected by elevated pCO2 (Figure 5), suggesting that cells did not alter carboxysome component numbers. This is counterintuitive, since Ci availability strongly increased after the upshift in pCO2. Yet, it seems that Microcystis simply adjusted its Ci uptake arsenal to deal with the change in Ci availability. In contrast, studies that induced Ci limitation in Synechocystis PCC 6803 and Synechococcus elongatus PCC 7942 observed downregulation of carboxysomal genes after 24 h (Eisenhut et al., 2007; Schwarz et al., 2011). Possibly, the cyanobacteria in these latter studies did not need to produce new carboxysomes, because their growth rate was arrested in the experiments of Eisenhut et al. (2007) and Schwarz et al. (2011). This differs from our chemostat experiments, in which the growth rate was kept relatively high by the dilution rate, and hence carboxysome production should be maintained. Therefore, differences in experimental design might explain these results. Alternatively, the contrasting results might reflect species-specific differences, where Microcystis displays a milder response to fluctuating Ci conditions than these other cyanobacteria (see preceding discussion in section Alleviation from Ci limitation).
Reduced Expression of Stress-Related Genes
Our results show reduced expression of several stress genes (flv2, flv4, isiA, sigH) at elevated CO2 (Table 1). Flavodiiron proteins have previously been linked to acclimation to low Ci conditions (Zhang et al., 2009; Allahverdiyeva et al., 2011; Bersanini et al., 2014). Flv2 and Flv4 are unique for cyanobacteria. They are involved in photoprotection of the PSII complex (Zhang et al., 2009), and can function as electron sink (Bersanini et al., 2014). Reduced expression of the flavodiiron protein genes flv2 and flv4 at elevated pCO2 is in agreement with previous studies with Synechocystis PCC 6803 (Wang et al., 2004; Eisenhut et al., 2007).
The iron-stress chlorophyll-binding protein IsiA can function as a storage unit for spare chlorophyll molecules, as a PSI antenna enhancing the light harvesting ability, and in addition can protect PSII from photooxidative stress (Yeremenko et al., 2004; Havaux et al., 2005). Reduced expression of the isiA gene at elevated pCO2 likely signifies lower levels of oxidative stress, which shifted the IsiA-bound spare chlorophylls to new chlorophyll protein complexes.
Sigma factors are involved in transcription initiation. sigH expression typically increases with general stress (Huckauf et al., 2000; Hakkila et al., 2013). The expression of sigH was lowered in our study after the increase in pCO2 (Table 1), indicating that the cells perceived less stress at this stage.
Increased Toxins per Cell at Elevated CO2?
Our results show that cells of Microcystis PCC 7806 contained a 2.5 times higher microcystin content at elevated pCO2. Similar results were found in an earlier study with Microcystis HUB 5-2-4, where elevated CO2 also produced a transition from Ci to light limitation and an ~2–2.5-fold increase in microcystin content (Van de Waal et al., 2009). This suggests that rising CO2 levels will increase the toxicity of Microcystis cells.
In contrast to the increase of the cellular microcystin content, expression of the mcy genes remained constant during the shift from low pCO2 to high pCO2 (Figure 4B). Gene expression may not be equivalent to abundance of the final gene product, and a further complication is that microcystins are synthesized by non-ribosomal peptide synthetases (Dittmann et al., 1997). The control mechanisms for the synthetase activity are largely unknown, but it has been suggested that amino acid availability may play a decisive role (Tonk et al., 2008; Van de Waal et al., 2010a).
The microarray results showed a strong increase in two polyketide synthase operons (PKS I/III) at elevated pCO2 (Figure 4B). These operons were described previously (Frangeul et al., 2008; Makower et al., 2015), yet the structure of the actual produced compounds and the exact function remain unknown. Polyketides have diverse biological functions and many have pharmacological and toxicological properties. Further research is needed to know more about the polyketides of cyanobacteria.
Other Physiological Responses to Elevated CO2
Our results also point at several other physiological changes in response to rising pCO2 levels. For example, the dry weight of cells decreased ~2-fold at elevated pCO2, but the cells were hardly smaller (Figure 2A). This was accompanied by a reduced cellular C storage, lower cellular C/N ratio and reduced carbohydrate content at elevated pCO2 (Figures 2B–D). A lower cellular C content at elevated CO2 contradicts the common expectation that rising CO2 levels will increase the carbon content of phytoplankton cells (e.g., Finkel et al., 2010; Van de Waal et al., 2010b; Verschoor et al., 2013). However, recent experiments showed that also other Microcystis strains do not increase their C/N ratio at elevated CO2 when provided with an ample nutrient supply (Verspagen et al., 2014a). A possible explanation for these observations might be that cells do not require large amounts of C reserves in the presence of plentiful Ci in the environment. Furthermore, changes in carbohydrate content are known to play a role in the vertical migration of Microcystis (Thomas and Walsby, 1985; Visser et al., 1997; Wallace et al., 2000). A strong decrease in cellular dry matter and carbohydrate content will increase the buoyancy of cells, which may be particularly advantageous when cells experience low light levels. The shift from Ci to light limitation induced by rising CO2 concentrations may thus stimulate the formation of surface blooms in Microcystis-dominated lakes.
Elevated pCO2 levels also led to an increase in the photosynthetic pigments and in the PSI/PSII ratio of the cells (Figures 3A,B). Most likely, this response is due to the reduced light availability caused by the denser cultures at elevated pCO2. This process, known as photoacclimation, is well-known to occur in cyanobacteria (Deblois et al., 2013). Yet, expression of the psa and psb genes for photosystem components remained unaltered.
We did not observe many changes in the genes involved in C and N metabolism (Table 1). One exception is the upregulation of glnN, that encodes for a glutamine synthase. The expression of glnN has been linked with nitrogen stress (Reyes et al., 1997). In this way the N metabolism of the cells responds subtly to changes in Ci availability caused by high pCO2 levels.
Concluding Remarks
We investigated the genetic and physiological response of the harmful cyanobacterium Microcystis to rising CO2. The experiments were conducted in chemostats, which provide ideal conditions to study microorganisms in a controlled environment. Yet, chemostats provide a simplified experimental setting in comparison to the complexity of the natural world. In lakes, buoyancy regulation enables Microcystis populations to form dense blooms at the water surface (Reynolds and Walsby, 1975; Huisman et al., 2004), where they intercept the influx of atmospheric CO2 (Ibelings and Maberly, 1998). Hence, the formation of surface blooms is a successful strategy to avoid low CO2 availability deeper in the water column (Paerl and Ustach, 1982). However, despite their proximity to the surface, dissolved CO2 concentrations can be strongly depleted and pH may exceed 9 during surface blooms of buoyant cyanobacteria (López-Archilla et al., 2004; Verspagen et al., 2014b). The high concentration of cells in blooms causes a high local demand for inorganic carbon and consequently extreme carbon limitation (Ibelings and Maberly, 1998), resembling the conditions in our CO2-limited laboratory experiments.
In our experiments, elevated CO2 alleviated Microcystis cells from Ci limitation. In response, Microcystis induced changes in the expression of a relatively limited number of genes, including several genes involved in Ci uptake. The expression of several stress-related genes was reduced at elevated CO2, while only a few key genes at control sites of cellular C/N metabolism were regulated. At elevated CO2, Microcystis cells halted its high-affinity bicarbonate uptake systems, and relied on CO2 and low-affinity bicarbonate uptake systems. This supports earlier results that high-affinity bicarbonate uptake systems will become less essential with rising CO2 (Sandrini et al., 2014). This may ultimately lead to an evolutionary loss of high-affinity Ci uptake systems, as shown in evolution experiments with the green alga Chlamydomonas reinhardtii. This green alga lost its ability to induce high-affinity Ci uptake while maintaining its low-affinity Ci uptake after 1000 generations at elevated CO2 levels (Collins and Bell, 2004; Collins et al., 2006).
In addition to changes in Ci uptake, elevation of the CO2 concentrations in our experiments also led to a higher population abundance, increased buoyancy of the cells, and higher toxin content per Microcystis cell. This indicates that the current rise in atmospheric CO2 levels may strongly increase the problems associated with the harmful cyanobacterium Microcystis in eutrophic lakes.
Conflict of Interest Statement
The authors declare that the research was conducted in the absence of any commercial or financial relationships that could be construed as a potential conflict of interest.
Acknowledgments
We thank the reviewers for their helpful comments on the manuscript, Pieter Slot for assistance with the HPLC measurements, Leo Hoitinga for assistance with the TOC-VCPH analyzer, and Chiara Cerli for assistance with the Elemental Analyser. We thank the MicroArray Department of the University of Amsterdam for support with the microarray hybridization and scanning. This research was supported by the Division of Earth and Life Sciences (ALW) of the Netherlands Organization for Scientific Research (NWO). JH acknowledges support from the Turner-Kirk Charitable Trust for his stay at the Isaac Newton Institute for Mathematical Sciences of the University of Cambridge.
Supplementary Material
The Supplementary Material for this article can be found online at: http://journal.frontiersin.org/article/10.3389/fmicb.2015.00401/abstract
References
Allahverdiyeva, Y., Ermakova, M., Eisenhut, M., Zhang, P., Richaud, P., Hagemann, M., et al. (2011). Interplay between flavodiiron proteins and photorespiration in Synechocystis sp. PCC 6803. J. Biol. Chem. 286, 24007–24014. doi: 10.1074/jbc.M111.223289
PubMed Abstract | Full Text | CrossRef Full Text | Google Scholar
Balmer, M. B., and Downing, J. A. (2011). Carbon dioxide concentrations in eutrophic lakes: undersaturation implies atmospheric uptake. Inland Waters 1, 125–132. doi: 10.5268/IW-4.1.614
Benjamini, Y., and Yekutieli, D. (2001). The control of the false discovery rate in multiple testing under dependence. Ann. Statist. 29, 1165–1188. doi: 10.1214/aos/1013699998
Bersanini, L., Battchikova, N., Jokel, M., Rehman, A., Vass, I., Allahverdiyeva, Y., et al. (2014). Flavodiiron protein Flv2/Flv4-related photoprotective mechanism dissipates excitation pressure of PSII in cooperation with phycobilisomes in cyanobacteria. Plant Physiol. 164, 805–818. doi: 10.1104/pp.113.231969
PubMed Abstract | Full Text | CrossRef Full Text | Google Scholar
Bolstad, B. M., Irizarry, R. A., Åstrand, M., and Speed, T. P. (2003). A comparison of normalization methods for high density oligonucleotide array data based on variance and bias. Bioinformatics 19, 185–193. doi: 10.1093/bioinformatics/19.2.185
PubMed Abstract | Full Text | CrossRef Full Text | Google Scholar
Bradford, M. M. (1976). A rapid and sensitive method for the quantitation of microgram quantities of protein utilizing the principle of protein-dye binding. Anal. Biochem. 72, 248–254. doi: 10.1016/0003-2697(76)90527-3
PubMed Abstract | Full Text | CrossRef Full Text | Google Scholar
Carmichael, W. W. (2001). Health effects of toxin-producing cyanobacteria: “the CyanoHABs”. Human Ecol. Risk Assess. 7, 1393–1407. doi: 10.1080/20018091095087
Chen, Y. W., Qin, B. Q., Teubner, K., and Dokulil, M. T. (2003). Long-term dynamics of phytoplankton assemblages: Microcystis-domination in Lake Taihu, a large shallow lake in China. J. Plankton Res. 25, 445–453. doi: 10.1093/plankt/25.4.445
Chorus, I., and Bartram, J. (1999). Toxic Cyanobacteria in Water: A Guide to their Public Health Consequences, Monitoring and Management. London: E&FN Spon.
Codd, G. A., Morrison, L. F., and Metcalf, J. S. (2005). Cyanobacterial toxins: risk management for health protection. Toxicol. Appl. Pharmacol. 203, 264–272. doi: 10.1016/j.taap.2004.02.016
PubMed Abstract | Full Text | CrossRef Full Text | Google Scholar
Cole, J. J., Caraco, N. F., Kling, G. W., and Kratz, T. K. (1994). Carbon dioxide supersaturation in the surface waters of lakes. Science 265, 1568–1570. doi: 10.1126/science.265.5178.1568
PubMed Abstract | Full Text | CrossRef Full Text | Google Scholar
Collins, S., and Bell, G. (2004). Phenotypic consequences of 1000 generations of selection at elevated CO2 in a green alga. Nature 431, 566–569. doi: 10.1038/nature02945
PubMed Abstract | Full Text | CrossRef Full Text | Google Scholar
Collins, S., Sültemeyer, D., and Bell, G. (2006). Changes in carbon uptake in populations of Chlamydomonas reinhardtii selected at high CO2. Plant Cell Environ. 29, 1812–1819. doi: 10.1111/j.1365-3040.2006.01559.x
PubMed Abstract | Full Text | CrossRef Full Text | Google Scholar
Deblois, C. P., Marchand, A., and Juneau, P. (2013). Comparison of photoacclimation in twelve freshwater photoautotrophs (Chlorophyte, Bacillariophyte, Cryptophyte and Cyanophyte) isolated from a natural community. PLoS ONE 8:e57139. doi: 10.1371/journal.pone.0057139
PubMed Abstract | Full Text | CrossRef Full Text | Google Scholar
Dittmann, E., Neilan, B. A., Erhard, M., von Döhren, H., and Börner, T. (1997). Insertional mutagenesis of a peptide synthetase gene that is responsible for hepatotoxin production in the cyanobacterium Microcystis aeruginosa PCC 7806. Mol. Microbiol. 26, 779–787. doi: 10.1046/j.1365-2958.1997.6131982.x
PubMed Abstract | Full Text | CrossRef Full Text | Google Scholar
Dodds, W. K., Bouska, W. W., Eitzmann, J. L., Pilger, T. J., Pitts, K. L., Riley, A. J., et al. (2008). Eutrophication of US freshwaters: analysis of potential economic damages. Environ. Sci. Technol. 43, 12–19. doi: 10.1021/es801217q
PubMed Abstract | Full Text | CrossRef Full Text | Google Scholar
Dubois, M., Giles, K. A., Hamilton, J. K., Rebers, P. A., and Smith, F. (1956). Colorimetric method for determination of sugars and related substances. Anal. Chem. 28, 350–356. doi: 10.1021/ac60111a017
PubMed Abstract | Full Text | CrossRef Full Text | Google Scholar
Eisenhut, M., Aguirre von Wobeser, E., Jonas, L., Schubert, H., Ibelings, B. W., Bauwe, H., et al. (2007). Long-term response toward inorganic carbon limitation in wild type and glycolate turnover mutants of the cyanobacterium Synechocystis sp. strain PCC 6803. Plant Physiol. 144, 1946–1959. doi: 10.1104/pp.107.103341
PubMed Abstract | Full Text | CrossRef Full Text | Google Scholar
Espie, G. S., Miller, A. G., and Canvin, D. T. (1988). Characterization of the Na+-requirement in cyanobacterial photosynthesis. Plant Physiol. 88, 757–763. doi: 10.1104/pp.88.3.757
PubMed Abstract | Full Text | CrossRef Full Text | Google Scholar
Finkel, Z. V., Beardall, J., Flynn, K. J., Quigg, A., Rees, T. A. V., and Raven, J. A. (2010). Phytoplankton in a changing world: cell size and elemental stoichiometry. J. Plankton Res. 32, 119–137. doi: 10.1093/plankt/fbp098
Frangeul, L., Quillardet, P., Castets, A. M., Humbert, J. F., Matthijs, H. C. P., Cortez, D., et al. (2008). Highly plastic genome of Microcystis aeruginosa PCC 7806, a ubiquitous toxic freshwater cyanobacterium. BMC Genomics 9:274. doi: 10.1186/1471-2164-9-274
PubMed Abstract | Full Text | CrossRef Full Text | Google Scholar
Giordano, M., Beardall, J., and Raven, J. A. (2005). CO2 concentrating mechanisms in algae: mechanisms, environmental modulation, and evolution. Ann. Rev. Plant Biol. 56, 99–131. doi: 10.1146/annurev.arplant.56.032604.144052
PubMed Abstract | Full Text | CrossRef Full Text | Google Scholar
Hackenberg, C., Huege, J., Engelhardt, A., Wittink, F., Laue, M., Matthijs, H. C. P., et al. (2012). Low-carbon acclimation in carboxysome-less and photorespiratory mutants of the cyanobacterium Synechocystis sp. strain PCC 6803. Microbiology 158, 398–413. doi: 10.1099/mic.0.054544-0
PubMed Abstract | Full Text | CrossRef Full Text | Google Scholar
Hakkila, K., Antal, T., Gunnelius, L., Kurkela, J., Matthijs, H. C. P., Tyystjarvi, E., et al. (2013). Group 2 sigma factor mutant ΔsigCDE of the cyanobacterium Synechocystis sp. PCC 6803 reveals functionality of both carotenoids and flavodiiron proteins in photoprotection of photosystem II. Plant Cell Physiol. 54, 1780–1790. doi: 10.1093/pcp/pct123
PubMed Abstract | Full Text | CrossRef Full Text | Google Scholar
Havaux, M., Guedeney, G., Hagemann, M., Yeremenko, N., Matthijs, H. C. P., and Jeanjean, R. (2005). The chlorophyll-binding protein IsiA is inducible by high light and protects the cyanobacterium Synechocystis PCC6803 from photooxidative stress. FEBS Lett. 579, 2289–2293. doi: 10.1016/j.febslet.2005.03.021
PubMed Abstract | Full Text | CrossRef Full Text | Google Scholar
Helman, Y., Barkan, E., Eisenstadt, D., Luz, B., and Kaplan, A. (2005). Fractionation of the three stable oxygen isotopes by oxygen-producing and oxygen-consuming reactions in photosynthetic organisms. Plant Physiol. 138, 2292–2298. doi: 10.1104/pp.105.063768
PubMed Abstract | Full Text | CrossRef Full Text | Google Scholar
Huckauf, J., Nomura, C., Forchhammer, K., and Hagemann, M. (2000). Stress responses of Synechocystis sp. strain PCC 6803 mutants impaired in genes encoding putative alternative sigma factors. Microbiology 146, 2877–2889.
Huisman, J., Matthijs, H. C. P., Visser, P. M., Balke, H., Sigon, C. A. M., Passarge, J., et al. (2002). Principles of the light-limited chemostat: theory and ecological applications. Antonie Leeuwenhoek 81, 117–133. doi: 10.1023/A:1020537928216
PubMed Abstract | Full Text | CrossRef Full Text | Google Scholar
Huisman, J., Sharples, J., Stroom, J. M., Visser, P. M., Kardinaal, W. E. A., Verspagen, J. M. H., et al. (2004). Changes in turbulent mixing shift competition for light between phytoplankton species. Ecology 85, 2960–2970. doi: 10.1890/03-0763
Humbert, J. F., Barbe, V., Latifi, A., Gugger, M., Calteau, A., Coursin, T., et al. (2013). A tribute to disorder in the genome of the bloom-forming freshwater cyanobacterium Microcystis aeruginosa. PLoS ONE 8: e70747. doi: 10.1371/journal.pone.0070747
PubMed Abstract | Full Text | CrossRef Full Text | Google Scholar
Ibelings, B. W., and Maberly, S. C. (1998). Photoinhibition and the availability of inorganic carbon restrict photosynthesis by surface blooms of cyanobacteria. Limnol. Oceanogr. 43, 408–419. doi: 10.4319/lo.1998.43.3.0408
Izard, J., and Limberger, R. J. (2003). Rapid screening method for quantitation of bacterial cell lipids from whole cells. J. Microbiol. Meth. 55, 411–418. doi: 10.1016/S0167-7012(03)00193-3
PubMed Abstract | Full Text | CrossRef Full Text | Google Scholar
Jeppesen, E., Søndergaard, M., Sortkjær, O., Mortensen, E., and Kristensen, P. (1990). Interactions between phytoplankton, zooplankton and fish in a shallow, hypertrophic lake: a study of phytoplankton collapses in Lake Søbygård, Denmark. Hydrobiologia 191, 149–164. doi: 10.1007/BF00026049
Jochimsen, E. M., Carmichael, W. W., An, J., Cardo, D., Cookson, S. T., Holmes, C. E. M., et al. (1998). Liver failure and death following exposure to microcystin toxins at a hemodialysis center in Brazil. N. Engl. J. Med. 36, 373–378. doi: 10.1056/NEJM199803263381304
Jöhnk, K. D., Huisman, J., Sharples, J., Sommeijer, B., Visser, P. M., and Stroom, J. M. (2008). Summer heatwaves promote blooms of harmful cyanobacteria. Glob. Change Biol. 14, 495–512. doi: 10.1111/j.1365-2486.2007.01510.x
Kaneko, T., Nakajima, N., Okamoto, S., Suzuki, I., Tanabe, Y., Tamaoki, M., et al. (2007). Complete genomic structure of the bloom-forming toxic cyanobacterium Microcystis aeruginosa NIES-843. DNA Res. 14, 247–256. doi: 10.1093/dnares/dsm026
PubMed Abstract | Full Text | CrossRef Full Text | Google Scholar
Lazzarino, J. K., Bachmann, R. W., Hoyer, M. V., and Canfield, D. E. (2009). Carbon dioxide supersaturation in Florida lakes. Hydrobiologia 627, 169–180. doi: 10.1007/s10750-009-9723-y
Livak, K. J., and Schmittgen, T. D. (2001). Analysis of relative gene expression data using real-time quantitative PCR and the 2-ΔΔC(T) method. Methods 25, 402–408. doi: 10.1006/meth.2001.1262
PubMed Abstract | Full Text | CrossRef Full Text | Google Scholar
López-Archilla, A. I., Moreira, D., López-García, P., and Guerrero, C. (2004). Phytoplankton diversity and cyanobacterial dominance in a hypereutrophic shallow lake with biologically produced alkaline pH. Extremophiles 8, 109–115. doi: 10.1007/s00792-003-0369-9
PubMed Abstract | Full Text | CrossRef Full Text | Google Scholar
Maberly, S. C., Ball, L. A., Raven, J. A., and Sültemeyer, D. (2009). Inorganic carbon acquisition by chrysophytes. J. Phycol. 45, 1052–1061. doi: 10.1111/j.1529-8817.2009.00734.x
Maeda, S., Badger, M. R., and Price, G. D. (2002). Novel gene products associated with NdhD3/D4-containing NDH-1 complexes are involved in photosynthetic CO2 hydration in the cyanobacterium, Synechococcus sp. PCC7942. Mol. Microbiol. 43, 425–435. doi: 10.1046/j.1365-2958.2002.02753.x
PubMed Abstract | Full Text | CrossRef Full Text | Google Scholar
Makower, K., Schuurmans, J. M., Groth, D., Zilliges, Y., Matthijs, H. C. P., and Dittmann, E. (2015). Transcriptomics-aided dissection of the intracellular and extracellular roles of microcystin in Microcystis aeruginosa PCC 7806. Appl. Environ. Microbiol. 81, 544–554. doi: 10.1128/AEM.02601-14
PubMed Abstract | Full Text | CrossRef Full Text | Google Scholar
Meissner, S., Fastner, J., and Dittmann, E. (2013). Microcystin production revisited: conjugate formation makes a major contribution. Environ. Microbiol. 15, 1810–1820. doi: 10.1111/1462-2920.12072
PubMed Abstract | Full Text | CrossRef Full Text | Google Scholar
Merel, S., Walker, D., Chicana, R., Snyder, S., Baurès, E., and Thomas, O. (2013). State of knowledge and concerns on cyanobacterial blooms and cyanotoxins. Environ. Int. 59, 303–327. doi: 10.1016/j.envint.2013.06.013
PubMed Abstract | Full Text | CrossRef Full Text | Google Scholar
Michalak, A. M., Anderson, E. J., Beletsky, D., Boland, S., Bosch, N. S., Bridgeman, T. B., et al. (2013). Record-setting algal bloom in Lake Erie caused by agricultural and meteorological trends consistent with expected future conditions. Proc. Natl. Acad. Sci. U.S.A. 110, 6448–6452. doi: 10.1073/pnas.1216006110
PubMed Abstract | Full Text | CrossRef Full Text | Google Scholar
Miller, A. G., Espie, G. S., and Canvin, D. T. (1988). Active transport of inorganic carbon increases the rate of O2 photoreduction by the cyanobacterium Synechococcus UTEX 625. Plant Physiol. 88, 6–9. doi: 10.1104/pp.88.1.6
PubMed Abstract | Full Text | CrossRef Full Text | Google Scholar
Moroney, J. V., and Ynalvez, R. A. (2007). Proposed carbon dioxide concentrating mechanism in Chlamydomonas reinhardtii. Eukaryot. Cell 6, 1251–1259. doi: 10.1128/EC.00064-07
PubMed Abstract | Full Text | CrossRef Full Text | Google Scholar
Murphy, J., and Riley, J. P. (1962). A modified single solution for the determination of phosphate in natural waters. Anal. Chim. Acta 27, 31–36. doi: 10.1016/S0003-2670(00)88444-5
PubMed Abstract | Full Text | CrossRef Full Text | Google Scholar
Nodop, A., Pietsch, D., Höcker, R., Becker, A., Pistorius, E. K., Forchhammer, K., et al. (2008). Transcript profiling reveals new insights into the acclimation of the mesophilic fresh-water cyanobacterium Synechococcus elongatus PCC 7942 to iron starvation. Plant Physiol. 147, 747–763. doi: 10.1104/pp.107.114058
PubMed Abstract | Full Text | CrossRef Full Text | Google Scholar
O'Neil, J. M., Davis, T. W., Burford, M. A., and Gobler, C. J. (2012). The rise of harmful cyanobacteria blooms: the potential roles of eutrophication and climate change. Harmful Algae 14, 313–334. doi: 10.1016/j.hal.2011.10.027
Omata, T., Price, G. D., Badger, M. R., Okamura, M., Gohta, S., and Ogawa, T. (1999). Identification of an ATP-binding cassette transporter involved in bicarbonate uptake in the cyanobacterium Synechococcus sp. strain PCC 7942. Proc. Natl. Acad. Sci. U.S.A. 96, 13571–13576. doi: 10.1073/pnas.96.23.13571
PubMed Abstract | Full Text | CrossRef Full Text | Google Scholar
Omata, T., Takahashi, Y., Yamaguchi, O., and Nishimura, T. (2002). Structure, function and regulation of the cyanobacterial high-affinity bicarbonate transporter, BCT1. Funct. Plant Biol. 29, 151–159. doi: 10.1071/PP01215
Paerl, H. W., and Huisman, J. (2008). Blooms like it hot. Science 320, 57–58. doi: 10.1126/science.1155398
PubMed Abstract | Full Text | CrossRef Full Text | Google Scholar
Paerl, H. W., and Ustach, J. F. (1982). Blue−green algal scums: an explanation for their occurrence during freshwater blooms. Limnol. Oceanogr. 27, 212–217.
Price, G. D. (2011). Inorganic carbon transporters of the cyanobacterial CO2 concentrating mechanism. Photosynth. Res. 109, 47–57. doi: 10.1007/s11120-010-9608-y
PubMed Abstract | Full Text | CrossRef Full Text | Google Scholar
Price, G. D., Badger, M. R., Woodger, F. J., and Long, B. M. (2008). Advances in understanding the cyanobacterial CO2-concentrating-mechanism (CCM): functional components, Ci transporters, diversity, genetic regulation and prospects for engineering into plants. J. Exp. Bot. 59, 1441–1461. doi: 10.1093/jxb/erm112
PubMed Abstract | Full Text | CrossRef Full Text | Google Scholar
Price, G. D., Maeda, S., Omata, T., and Badger, M. R. (2002). Modes of active inorganic carbon uptake in the cyanobacterium, Synechococcus sp. PCC7942. Funct. Plant Biol. 29, 131–149. doi: 10.1071/PP01229
Price, G. D., Woodger, F. J., Badger, M. R., Howitt, S. M., and Tucker, L. (2004). Identification of a SulP-type bicarbonate transporter in marine cyanobacteria. Proc. Natl. Acad. Sci. U.S.A. 101, 18228–18233. doi: 10.1073/pnas.0405211101
PubMed Abstract | Full Text | CrossRef Full Text | Google Scholar
Qin, B., Zhu, G., Gao, G., Zhang, Y., Li, W., Paerl, H. W., et al. (2010). A drinking water crisis in Lake Taihu, China: linkage to climatic variability and lake management. Environ. Manag. 45, 105–112. doi: 10.1007/s00267-009-9393-6
PubMed Abstract | Full Text | CrossRef Full Text | Google Scholar
Ramakers, C., Ruijter, J. M., Deprez, R. H., and Moorman, A. F. (2003). Assumption-free analysis of quantitative real-time polymerase chain reaction (PCR) data. Neurosci. Lett. 339, 62–66. doi: 10.1016/S0304-3940(02)01423-4
PubMed Abstract | Full Text | CrossRef Full Text | Google Scholar
Raven, J. A., Giordano, M., Beardall, J., and Maberly, S. C. (2012). Algal evolution in relation to atmospheric CO2: carboxylases, carbon-concentrating mechanisms and carbon oxidation cycles. Phil. Trans. R. Soc. B 367, 493–507. doi: 10.1098/rstb.2011.0212
PubMed Abstract | Full Text | CrossRef Full Text | Google Scholar
Reyes, J. C., Muro-Pastor, M. I., and Florencio, F. J. (1997). Transcription of glutamine synthetase genes (glnA and glnN) from the cyanobacterium Synechocystis sp. strain PCC 6803 is differently regulated in response to nitrogen availability. J. Bacteriol. 179, 2678–2689.
Reynolds, C. S., and Walsby, A. E. (1975). Water−blooms. Biol. Rev. 50, 437–481. doi: 10.1111/j.1469-185X.1975.tb01060.x
Rippka, R., Deruelles, J., Waterbury, J. B., Herdman, M., and Stanier, R. Y. (1979). Generic assignments, strain histories and properties of pure cultures of cyanobacteria. Microbiology 111, 1–61. doi: 10.1099/00221287-111-1-1
Rost, B., Riebesell, U., Burkhardt, S., and Sültemeyer, D. (2003). Carbon acquisition of bloom-forming marine phytoplankton. Limnol. Oceanogr. 48, 55–67. doi: 10.4319/lo.2003.48.1.0055
PubMed Abstract | Full Text | CrossRef Full Text | Google Scholar
Rost, B., Zondervan, I., and Wolf-Gladrow, D. (2008). Sensitivity of phytoplankton to future changes in ocean carbonate chemistry: current knowledge, contradictions and research directions. Mar. Ecol. Prog. Ser. 373, 227–237. doi: 10.3354/meps07776
Ruijter, J. M., Ramakers, C., Hoogaars, W. M., Karlen, Y., Bakker, O., Van den Hoff, M.J., et al. (2009). Amplification efficiency: linking baseline and bias in the analysis of quantitative PCR data. Nucleic Acids Res. 37:e45. doi: 10.1093/nar/gkp045
PubMed Abstract | Full Text | CrossRef Full Text | Google Scholar
Sandrini, G., Matthijs, H. C. P., Verspagen, J. M. H., Muyzer, G., and Huisman, J. (2014). Genetic diversity of inorganic carbon uptake systems causes variation in CO2 response of the cyanobacterium Microcystis. ISME J. 8, 589–600. doi: 10.1038/ismej.2013.179
PubMed Abstract | Full Text | CrossRef Full Text | Google Scholar
Schwarz, D., Nodop, A., Hüge, J., Purfürst, S., Forchhammer, K., Michel, K. P., et al. (2011). Metabolic and transcriptomic phenotyping of inorganic carbon acclimation in the cyanobacterium Synechococcus elongatus PCC 7942. Plant Physiol. 155, 1640–1655. doi: 10.1104/pp.110.170225
PubMed Abstract | Full Text | CrossRef Full Text | Google Scholar
Shapiro, J. (1997). The role of carbon dioxide in the initiation and maintenance of blue−green dominance in lakes. Freshw. Biol. 37, 307–323. doi: 10.1046/j.1365-2427.1997.00164.x
Smyth, G. K. (2005). “Limma: linear models for microarray data,” in Bioinformatics and Computational Biology Solutions Using R and Biocnductor, eds R. Gentleman, V. Carey, S. Dudoit, R. Irizarry, and W. Huber (New York, NY: Springer), 397–420.
Sobek, S., Tranvik, L. J., and Cole, J. J. (2005). Temperature independence of carbon dioxide supersaturation in global lakes. Glob. Biogeochem. Cycles 19, GB2003. doi: 10.1029/2004GB002264
Song, Y. F., and Qiu, B. S. (2007). The CO2 concentrating mechanism in the bloom-forming cyanobacterium Microcystis aeruginosa (Cyanophyceae) and effects of UVB radiation on its operation. J. Phycol. 43, 957–964. doi: 10.1111/j.1529-8817.2007.00391.x
Storey, J. D., and Tibshirani, R. (2003). Statistical significance for genomewide studies. Proc. Natl. Acad. Sci. U.S.A. 100, 9440–9445. doi: 10.1073/pnas.1530509100
PubMed Abstract | Full Text | CrossRef Full Text | Google Scholar
Straub, C., Quillardet, P., Vergalli, J., De Marsac, N. T., and Humbert, J. F. (2011). A day in the life of Microcystis aeruginosa strain PCC 7806 as revealed by a transcriptomic analysis. PLoS ONE 6:e16208. doi: 10.1371/journal.pone.0016208
PubMed Abstract | Full Text | CrossRef Full Text | Google Scholar
Stumm, W., and Morgan, J. J. (1996). Aquatic Chemistry: Chemical Equilibria and Rates in Natural Waters. New York, NY: Wiley-Interscience.
Talling, J. F. (1976). The depletion of carbon dioxide from lake water by phytoplankton. J. Ecol. 64, 79–121. doi: 10.2307/2258685
Thomas, R. H., and Walsby, A. E. (1985). Buoyancy regulation in a strain of Microcystis. J. Gen. Microbiol. 131, 799–809. doi: 10.1099/00221287-131-4-799
Tonk, L., Van de Waal, D. B., Slot, P., Huisman, J., Matthijs, H. C. P., and Visser, P. M. (2008). Amino acid availability determines the ratio of microcystin variants in the cyanobacterium Planktothrix agardhii. FEMS Microbiol. Ecol. 65, 383–390. doi: 10.1111/j.1574-6941.2008.00541.x
PubMed Abstract | Full Text | CrossRef Full Text | Google Scholar
Tonk, L., Welker, M., Huisman, J., and Visser, P. M. (2009). Production of cyanopeptolins, anabaenopeptins, and microcystins by the harmful cyanobacteria Anabaena 90 and Microcystis PCC 7806. Harmful Algae 8, 219–224. doi: 10.1016/j.hal.2008.05.005
Tortell, P. D., DiTullio, G. R., Sigman, D. M., and Morel, F. M. M. (2002). CO2 effects on taxonomic composition and nutrient utilization in an Equatorial Pacific phytoplankton assemblage. Mar. Ecol. Prog. Ser. 236, 37–43. doi: 10.3354/meps236037
Van de Waal, D. B., Ferreruela, G., Tonk, L., Van Donk, E., Huisman, J., Visser, P. M., et al. (2010a). Pulsed nitrogen supply induces dynamic changes in the amino acid composition and microcystin production of the harmful cyanobacterium Planktothrix agardhii. FEMS Microbiol. Ecol. 74, 430–438. doi: 10.1111/j.1574-6941.2010.00958.x
PubMed Abstract | Full Text | CrossRef Full Text | Google Scholar
Van de Waal, D. B., Verschoor, A. M., Verspagen, J. M. H., Van Donk, E., and Huisman, J. (2010b). Climate-driven changes in the ecological stoichiometry of aquatic ecosystems. Front. Ecol. Environ. 8, 145–152. doi: 10.2307/20696462
Van de Waal, D. B., Verspagen, J. M. H., Finke, J. F., Vournazou, V., Immers, A. K., Kardinaal, W. E. A., et al. (2011). Reversal in competitive dominance of a toxic versus non-toxic cyanobacterium in response to rising CO2. ISME J. 5, 1438–1450. doi: 10.1038/ismej.2011.28
PubMed Abstract | Full Text | CrossRef Full Text | Google Scholar
Van de Waal, D. B., Verspagen, J. M. H., Lürling, M., Van Donk, E., Visser, P. M., and Huisman, J. (2009). The ecological stoichiometry of toxins produced by harmful cyanobacteria: an experimental test of the carbon−nutrient balance hypothesis. Ecol. Lett. 12, 1326–1335. doi: 10.1111/j.1461-0248.2009.01383.x
PubMed Abstract | Full Text | CrossRef Full Text | Google Scholar
Verschoor, A. M., Van Dijk, M. A., Huisman, J., and Van Donk, E. (2013). Elevated CO2 concentrations affect the elemental stoichiometry and species composition of an experimental phytoplankton community. Freshw. Biol. 58, 597–611. doi: 10.1111/j.1365-2427.2012.02833.x
Verspagen, J. M. H., Passarge, J., Jöhnk, K. D., Visser, P. M., Peperzak, L., Boers, P., et al. (2006). Water management strategies against toxic Microcystis blooms in the Dutch delta. Ecol. Appl. 16, 313–327. doi: 10.1890/04-1953
PubMed Abstract | Full Text | CrossRef Full Text | Google Scholar
Verspagen, J. M. H., Van de Waal, D. B., Finke, J. F., Visser, P. M., and Huisman, J. (2014a). Contrasting effects of rising CO2 on primary production and ecological stoichiometry at different nutrient levels. Ecol. Lett. 17, 951–960. doi: 10.1111/ele.12298
PubMed Abstract | Full Text | CrossRef Full Text | Google Scholar
Verspagen, J. M. H., Van de Waal, D. B., Finke, J. F., Visser, P. M., Van Donk, E., and Huisman, J. (2014b). Rising CO2 levels will intensify phytoplankton blooms in eutrophic and hypertrophic lakes. PLoS ONE 9, e104325. doi: 10.1371/journal.pone.0104325
PubMed Abstract | Full Text | CrossRef Full Text | Google Scholar
Visser, P. M., Passarge, J., and Mur, L. R. (1997). Modelling vertical migration of the cyanobacterium Microcystis. Hydrobiologia 349, 99–109. doi: 10.1023/A:1003001713560
Wallace, B. B., Bailey, M. C., and Hamilton, D. P. (2000). Simulation of vertical position of buoyancy regulating Microcystis aeruginosa in a shallow eutrophic lake. Aquat. Sci. 62, 320–333. doi: 10.1007/PL00001338
Wang, H. L., Postier, B. L., and Burnap, R. L. (2004). Alterations in global patterns of gene expression in Synechocystis sp. PCC 6803 in response to inorganic carbon limitation and the inactivation of ndhR, a LysR family regulator. J. Biol. Chem. 279, 5739–5751. doi: 10.1074/jbc.M311336200
PubMed Abstract | Full Text | CrossRef Full Text | Google Scholar
Watson, S. B., Ridal, J., and Boyer, G. L. (2008). Taste and odour and cyanobacterial toxins: impairment, prediction, and management in the Great Lakes. Can. J. Fish. Aquat. Sci. 65, 1779–1796. doi: 10.1139/F08-084
Wetzel, R. G., and Likens, G. E. (2000). Limnological Analyses, 3rd Edn. New York, NY: Springer-Verlag.
Woodger, F. J., Badger, M. R., and Price, G. D. (2003). Inorganic carbon limitation induces transcripts encoding components of the CO2-concentrating mechanism in Synechococcus sp. PCC7942 through a redox-independent pathway. Plant Physiol. 133, 2069–2080. doi: 10.1104/pp.103.029728
PubMed Abstract | Full Text | CrossRef Full Text | Google Scholar
Woodger, F. J., Bryant, D. A., and Price, G. D. (2007). Transcriptional regulation of the CO2-concentrating mechanism in a euryhaline, coastal marine cyanobacterium, Synechococcus sp. strain PCC 7002: role of NdhR/CcmR. J. Bacteriol. 189, 3335–3347. doi: 10.1128/JB.01745-06
PubMed Abstract | Full Text | CrossRef Full Text | Google Scholar
Ye, J., Coulouris, G., Zaretskaya, I., Cutcutache, I., Rozen, S., and Madden, T. L. (2012). Primer-BLAST: a tool to design target-specific primers for polymerase chain reaction. BMC Bioinformatics 13:134. doi: 10.1186/1471-2105-13-134
PubMed Abstract | Full Text | CrossRef Full Text | Google Scholar
Yeremenko, N., Kouril, R., Ihalainen, J. A., D'Haene, S., Van Oosterwijk, N., Andrizhiyevskaya, E. G., et al. (2004). Supramolecular organization and dual function of the IsiA chlorophyll-binding protein in cyanobacteria. Biochemistry 43, 10308–10313. doi: 10.1021/bi048772l
PubMed Abstract | Full Text | CrossRef Full Text | Google Scholar
Zhang, P., Allahverdiyeva, Y., Eisenhut, M., and Aro, E. M. (2009). Flavodiiron proteins in oxygenic photosynthetic organisms: photoprotection of photosystem II by Flv2 and Flv4 in Synechocystis sp. PCC 6803. PLoS ONE 4:e5331. doi: 10.1371/journal.pone.0005331
PubMed Abstract | Full Text | CrossRef Full Text | Google Scholar
Zhang, P., Eisenhut, M., Brandt, A. M., Carmel, D., Silen, H. M., Vass, I., et al. (2012). Operon flv4-flv2 provides cyanobacterial photosystem II with flexibility of electron transfer. Plant Cell 24, 1952–1971. doi: 10.1105/tpc.111.094417
PubMed Abstract | Full Text | CrossRef Full Text | Google Scholar
Keywords: bicarbonate uptake, climate change, CO2-concentrating mechanisms, harmful algal blooms, inorganic carbon uptake, microarrays, microcystins, phytoplankton
Citation: Sandrini G, Cunsolo S, Schuurmans JM, Matthijs HCP and Huisman J (2015) Changes in gene expression, cell physiology and toxicity of the harmful cyanobacterium Microcystis aeruginosa at elevated CO2. Front. Microbiol. 6:401. doi: 10.3389/fmicb.2015.00401
Received: 29 January 2015; Accepted: 17 April 2015;
Published: 05 May 2015.
Edited by:
George S. Bullerjahn, Bowling Green State University, USAReviewed by:
Hans Paerl, University of North Carolina-Chapel Hill, USAMarie-Ève Garneau, Independant, Canada
Copyright © 2015 Sandrini, Cunsolo, Schuurmans, Matthijs and Huisman. This is an open-access article distributed under the terms of the Creative Commons Attribution License (CC BY). The use, distribution or reproduction in other forums is permitted, provided the original author(s) or licensor are credited and that the original publication in this journal is cited, in accordance with accepted academic practice. No use, distribution or reproduction is permitted which does not comply with these terms.
*Correspondence: Jef Huisman, Department of Aquatic Microbiology, Institute for Biodiversity and Ecosystem Dynamics, University of Amsterdam, PO Box 94248, 1090 GE Amsterdam, Netherlands, j.huisman@uva.nl