Protein flexibility in the light of structural alphabets
 Pierrick Craveur1,2,3,4
  Agnel P. Joseph5
  Jeremy Esque6
  Tarun J. Narwani1,2,3,4
  Floriane Noël1,2,3,4
  Nicolas Shinada1,2,3,4
  Matthieu Goguet1,2,3,4
  Sylvain Leonard1,2,3,4
  Pierre Poulain1,2,3,4,7
  Olivier Bertrand1,3,4
  Guilhem Faure8
  Joseph Rebehmed9
  Amine Ghozlane10
  Lakshmipuram S. Swapna11,12
  Ramachandra M. Bhaskara11,13
  Jonathan Barnoud1,2,3,4,14
  Stéphane Téletchéa1,2,3,4,15 Vincent Jallu16
  Jiri Cerny17
  Bohdan Schneider17
  Catherine Etchebest1,2,3,4
  Narayanaswamy Srinivasan11 Jean-Christophe Gelly1,2,3,4
  Alexandre G. de Brevern1,2,3,4*
- 1Institut National de la Santé et de la Recherche Médicale U 1134, Paris, France
- 2UMR_S 1134, DSIMB, Université Paris Diderot, Sorbonne Paris Cite, Paris, France
- 3Institut National de la Transfusion Sanguine, DSIMB, Paris, France
- 4UMR_S 1134, DSIMB, Laboratory of Excellence GR-Ex, Paris, France
- 5Rutherford Appleton Laboratory, Science and Technology Facilities Council, Didcot, UK
- 6Institut National de la Santé et de la Recherche Médicale U964,7 UMR Centre National de la Recherche Scientifique 7104, IGBMC, Université de Strasbourg, Illkirch, France
- 7Ets Poulain, Pointe-Noire, Congo
- 8National Library of Medicine, National Center for Biotechnology Information, National Institutes of Health, Bethesda, MD, USA
- 9Centre National de la Recherche Scientifique UMR7590, Sorbonne Universités, Université Pierre et Marie Curie – MNHN – IRD – IUC, Paris, France
- 10Metagenopolis, INRA, Jouy-en-Josas, France
- 11Molecular Biophysics Unit, Indian Institute of Science, Bangalore, Bangalore, India
- 12Hospital for Sick Children, and Departments of Biochemistry and Molecular Genetics, University of Toronto, Toronto, ON, Canada
- 13Department of Theoretical Biophysics, Max Planck Institute of Biophysics, Frankfurt, Germany
- 14Laboratoire de Physique, École Normale Supérieure de Lyon, Université de Lyon, Centre National de la Recherche Scientifique UMR 5672, Lyon, France
- 15Faculté des Sciences et Techniques, Université de Nantes, Unité Fonctionnalité et Ingénierie des Protéines, Centre National de la Recherche Scientifique UMR 6286, Université Nantes, Nantes, France
- 16Platelet Unit, Institut National de la Transfusion Sanguine, Paris, France
- 17Institute of Biotechnology, The Czech Academy of Sciences, Prague, Czech Republic
Protein structures are valuable tools to understand protein function. Nonetheless, proteins are often considered as rigid macromolecules while their structures exhibit specific flexibility, which is essential to complete their functions. Analyses of protein structures and dynamics are often performed with a simplified three-state description, i.e., the classical secondary structures. More precise and complete description of protein backbone conformation can be obtained using libraries of small protein fragments that are able to approximate every part of protein structures. These libraries, called structural alphabets (SAs), have been widely used in structure analysis field, from definition of ligand binding sites to superimposition of protein structures. SAs are also well suited to analyze the dynamics of protein structures. Here, we review innovative approaches that investigate protein flexibility based on SAs description. Coupled to various sources of experimental data (e.g., B-factor) and computational methodology (e.g., Molecular Dynamic simulation), SAs turn out to be powerful tools to analyze protein dynamics, e.g., to examine allosteric mechanisms in large set of structures in complexes, to identify order/disorder transition. SAs were also shown to be quite efficient to predict protein flexibility from amino-acid sequence. Finally, in this review, we exemplify the interest of SAs for studying flexibility with different cases of proteins implicated in pathologies and diseases.
Introduction
Analysis of protein structures is crucial to understand protein dynamics and functions. X-ray crystallography, the gold-standard method for solving 3D structures at atomic resolution, is impeded by protein dynamics. Hence, tricks are frequently used to restrict motions. It is why proteins have been often considered as static macromolecules, composed of rigid repetitive secondary structures and less rigid random coils. However, more and more emerging evidences show that protein structures are more complex with their internal dynamics being a key determinant of their function. Analyses of protein structures are often performed with a simplified three-state description known as α-helix, β-strand and coil which constitutes the classical secondary structures (Corey and Pauling, 1953; Kabsch and Sander, 1983). A more precise and complete description of protein backbone conformation exists based on the definition of libraries of small protein fragments, namely the structural alphabets (SAs) (Unger et al., 1989; Fetrow et al., 1997; Camproux et al., 1999; Offmann et al., 2007; Tyagi et al., 2007; Joseph et al., 2010a,b). SAs are designed to approximate every part of the local protein structures providing conformational detail. They have performed remarkably well spanning various problems in structural bioinformatics, from the characterization of ligand binding sites to the superimposition of protein structures (Joseph et al., 2010b). Furthermore, SAs are also very well suited to analyze the internal dynamics of protein structures. SAs have been used at three different levels to comprehend protein flexibility: (i) for studying specific fundamental biological and biomedical problems, (ii) to analyze changes associated with protein complexation and allostery, and (iii) to predict protein flexibility.
Here, we present state-of-the-art of developments in the study of protein flexibility using SAs based approximation. The backbone conformational variations can be described as changes in the pattern of SAs, which acts as fingerprints of the dynamics involved. These innovative approaches are useful, customizable, and deal with specific proteins involved in pathologies and diseases. They are also powerful to evaluate generalized principles from large biological complex structures. Thus, SAs provide new vision for detailed analysis and prediction flexibility of proteins.
The Different Views of Protein Structures
The primary sequence of the protein—the succession of amino acids—is assumed to encompass all the information necessary for its function. The protein structures resolved from X-ray crystallography or Nuclear Magnetic Resonance (NMR) (see Figures 1A,B) can be obtained in the Protein DataBank format (PDB, Bernstein et al., 1977; Berman et al., 2000). From the very beginning, theoreticians or experimentalists have described local protein structures by using three states (see Figure 1C, Corey and Pauling, 1953; Kabsch and Sander, 1983; Eisenberg, 2003). Two of them are repetitive structures stabilized by hydrogen bond patterns, namely the α-helices and the β-sheets (composed of β-strands). These structures are connected with more variable structures, i.e., random coil or loops. Later studies have identified spotted small repetitive and regular structures such as the β-hairpins or different kinds of turns in several protein structures (Richardson, 1981). These simplified descriptions were nicely represented with 3D visualization software (e.g., arrows for β-sheets, springs for α-helix) and accompanying the emergence of macromolecular crystallography. However these simplistic representations also contributed to the static and rigid views of these structures (Chavent et al., 2011).
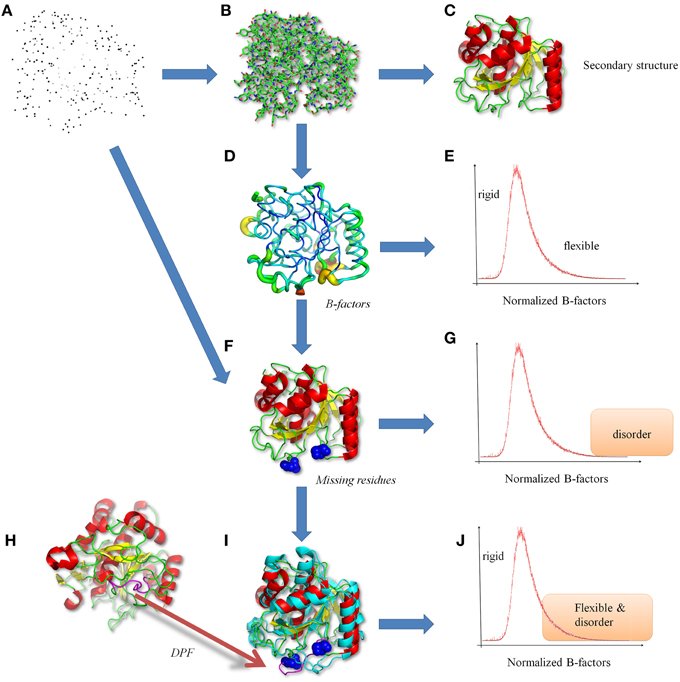
Figure 1. Classical views of protein structures. (A) The protein structure is a file in PDB format (Bernstein et al., 1977; Berman et al., 2000), containing the 3D atomic coordinates. (B) The atoms are bound to build the protein backbone and side-chain residues. (C) From this information, secondary structures are performed (Kabsch and Sander, 1983). (D) From crystallographic data, B-factors are analyzed underlining (E) rigid to flexible residues. (F) More precise analyses shows missing residues revealing. (G) disorder regions (Uversky et al., 2000; Dunker et al., 2001). (H) Interestingly same or similar proteins can be found in the PDB (Berman et al., 2000), and (I) in numerous times with the missing regions resolved, leading to (J) a more complex definition and an ambiguity between flexibility and disorder. Protein visualization was created by the program PyMOL (http://www.pymol.org, Delano, 2013). The proteins used are two proteases (PDB codes 1dbi chain A, and 1wmd chain A, for this last only residues 1–306 are shown for more clarity).
In fact, growing evidence shows that proteins are highly dynamic macromolecules and that this dynamics is crucial in many biological processes. Thus, recent studies have demonstrated that conformational transitions in folded states of many proteins are essential to accomplish their functions, e.g., enzyme catalysis, activity regulation (Goh et al., 2004; Grunberg et al., 2004; Lensink and Mendez, 2008). Flexibility also allows interactions with different partners, with ligands by induced-fit interaction, with other proteins, or nucleic acids to form complex structures. NMR based methods and computational experiments such as Molecular Dynamic (MD) simulations, have largely contributed to gain valuable insights into the observation, understanding, and analyses of flexibility (Hirst et al., 2014). Flexibility can be versatile and covers a large range of timescales and amplitudes of structural modifications. It encompasses different kinds of conformational changes corresponding to (i) mobility of rigid part of the protein, e.g., domain motions (ii) deformability of the protein backbone, e.g., crankshaft motions or (iii) both. These different transitions are shown by analyzing and comparing protein structures (see Figure 1D). At a local level, the flexibility can be identified by the information contained in diffraction images of X-ray crystallography experiments and quantified along the refinement process through the Debye-Waller factors (expressed as surface units) also known as “B-factors” or temperature (displacement) factors. These so-called B-factors reflect atom mobility due to thermal vibration and measure the static disorder. They allow quantifying different levels of flexibility in proteins (see Figure 1E, Marsh, 2013). This criterion is also used by majority of flexibility prediction methods (from the sequence) (Schlessinger and Rost, 2005).
In this context, missing coordinates of whole residues in X-ray protein structures (usually labeled as missing residues, see Figure 1F) and several dedicated biochemical analyses have suggested these protein segments should be considered as disordered regions (see Figure 1G, Uversky et al., 2000; Dunker et al., 2001). From few years, beside the paradigm of a well-defined 3D folded state, new visions of protein structure and dynamics have emerged, namely the Intrinsically Disordered Proteins (IDP) or disordered regions. IDP may exhibit large structural rearrangements like the formation (then the loss) of secondary structures depending on the environment or the interacting partners. The impressive amount of research in this field is motivated by the implication of IDP in multiple crucial biological functions (Dunker et al., 2000; Dunker and Obradovic, 2001), for e.g., 14-3-3 proteins (Uhart and Bustos, 2014) or the Innate Antiviral Immunity (Xue and Uversky, 2014). Nevertheless, the regions with missing residues can be found resolved in other PDB structures of the same (or highly homologous) protein (see Figure 1I) (see Figure 1H, Berman et al., 2000). These ambiguous regions, termed Dual Personality Fragments (DPFs, see Dunker, 2007; Zhang et al., 2007), complicate the distinction and per se the definition of disorder versus flexibility (see Figure 1J). In Figure 1, we show a protease (PDB code 1dbi chain A), the corresponding DPF found (with a good resolution) in another protease (PDB code 1wmd chain A). Correlation between B-factors (representing flexibility) and disorder predictor outputs has been explored and shows a good agreement (Jin and Dunbrack, 2005; Schlessinger et al., 2009).
In the light of the above observations, the classic representation of protein structure as a succession of repetitive ordered secondary structures and random coil does not allow understanding of the complexity associated with structural flexibility. Actually, the coarseness of the secondary structure assignment may prevent from identifying conformational changes. Therefore distinction between flexible loops and rigid loops, for example, cannot be made on the sole basis of a three-state secondary structure assignment. A more precise and local description of protein structure is needed. In this regard, Structural Alphabet (SAs), allow to investigate primarily the complexity of the protein conformations, and consequently of their associated dynamics.
A SA is a library of N structural prototypes (the letters). Each prototype is representative of a backbone local structure of l-residues length. The combination of those structural prototypes is assumed to approximate any given protein structure. Many different libraries have been developed, (e.g., Unger et al., 1989; Fetrow et al., 1997; Camproux et al., 1999; Tung et al., 2007). Depending on the targeted accuracy, the length l and the number N can vary significantly. The length l typically ranges between 4 and 9 while can vary, the most frequent value being close to 20 (see Offmann et al., 2007; Joseph et al., 2010a,b for more details). The various structural alphabets also differ by the description parameters of the protein backbone. The description can be based on Cα coordinates, Cα-Cα distances, α or dihedral angles. The classification and learning methods that were used, are also various, e.g., hierarchical clustering, empirical function, Kohonen Maps, neural network or Hidden Markov Model Besides their interest to provide a finer description, They SA have been also designed for prediction purpose, which requires to decipher the sequence—structure relationship.
As example, in their respective work, Park and Levitt (1995) and Kolodny et al. (2002) aimed at finding representations based on smallest libraries of protein fragments to accurately construct protein structures. Fragments of four to seven residues long were considered in a library of 25–300 fragments. Micheletti et al. (2000) did similar studies and constructed a library that encompassed from 28 to 2561 recurrent local structures.
To date, one of the most developed and comprehensive SA is the Protein Blocks approach (PBs, de Brevern et al., 2000). This SA is composed by 16 local structure prototypes of 5 residues fragments (see Figure 2). It was shown to efficiently approximate every part of the protein structure. The PBs m and d can be roughly described as prototypes for the central region of α-helix and β-strand, respectively. PBs a-c primarily represent the N-cap of β-strand while e and f correspond to C-caps; PBs g -j are specific to coils, PBs k and l correspond to N cap of α-helix while PBs n-p to C-caps. PBs have been used to address various problems, including protein superimposition (Gelly et al., 2011; Joseph et al., 2012), general analyses of flexibility (Dudev and Lim, 2007; Wu et al., 2010) or and prediction of structure and flexibility (Zimmermann and Hansmann, 2008; Rangwala et al., 2009; Suresh et al., 2013; Joseph and de Brevern, 2014).
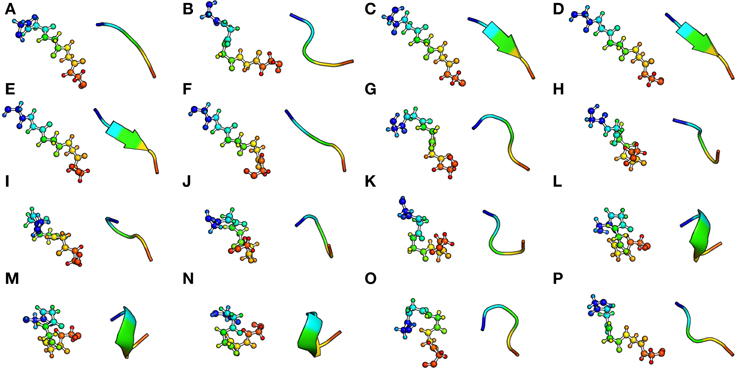
Figure 2. The Protein Blocks structural alphabet. The conformation of each 16 pentapeptides is presented with ball and stick (left) and cartoon representation (right). The N-ter and C-ter extremity are respectively colored in blue and red. Visualization was created by the program PyMOL (http://www.pymol.org, Delano, 2013).
The assignment algorithm (see Figure 3A, de Brevern et al., 2000) runs through the 3D structure of the target protein, from the N to the C-ter of the sequence. The algorithm is iterative and uses 5 residues long overlapping windows over the entire sequence to assign a PB to every position. For each “nth” position of the structure, 8 dihedrals ψ (n − 2), φ (n − 1), ψ (n − 1), φ (n), ψ (n), φ (n + 1), ψ (n + 1), φ (n + 2) are compared to each of the 16 PBs. The comparison is made by a least squares approach to match the RMSDA criteria (Root mean square Deviation on Angular Values) (Schuchhardt et al., 1996):
where V1 is the vector of 8 dihedral angles extracted from the 5 residues long window, and V2 is the 8 vector of dihedral corresponding to the individual PB type. The PB with the lowest RMSDA, is assigned to the corresponding position for that window. This PB captures the overall local conformation and approximates the transition along the main-chain smoothly.
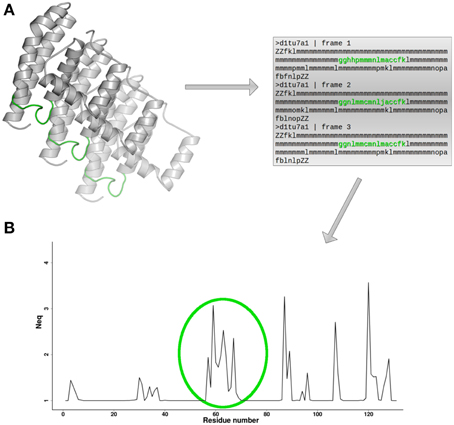
Figure 3. Neq and local flexibility. (A) For each conformation extracted from MD simulation, a PB sequence is assigned. (B) Neq profile provides direct identification of protein fragments in which local conformational change is observed. Here, in green, is indicated a flexible loop. The protein 3D structure representation is generated using PyMOL software (http://www.pymol.org, Delano, 2013).
PB assignments can be done using the Python PBxplore tool (https://github.com/pierrepo/PBxplore, in preparation). The result is a translation of a 3D structure into a 1D sequence of PBs.
Interestingly, the subtle differences between protein conformations can be captured by the assignment of the PB sequences. By analyzing the variation of PBs assigned at a given position for multiple conformers, the local conformational properties and corresponding changes can be easily identified. Moreover, a quantification of the flexibility at a given position n can be obtained by calculating, the average number of PBs across a set of conformers in this position or the “equivalent number” of PBs (Neq). Neq is based on a statistical metric similar to Shannon entropy (de Brevern et al., 2000) and is calculated as follows:
where fx is the frequency of PB x (x takes values from a to p). A Neq value of 1 indicates that only one type of PB is observed, while a value of 16 is equivalent to a random distribution. For example Neq value equal to 6, could mean that 6 different PBs are observed in equal proportions (1/6), or that more than 6 PBs are observed in different proportions. By plotting the computed value for each residue position (see Figure 3B), it is possible to easily localize which protein regions present local conformation change, or in other words, which regions represent local flexibility.
This PB derived-entropy index is an interesting feature of PBs, which can be used to analyze PB prediction (de Brevern et al., 2000) or an ensemble of structures, corresponding to the same protein solved in different experiments, or to several structures extracted from MD simulation (Jallu et al., 2012). Note that PBxplore can be used to calculate Neq, and to visualize in various ways the PB variation for each position from a collection of models or through a MD trajectory (de Brevern et al., 2005).
Other interesting SAs used in the flexibility context. We have proposed an extension of our SA through a novel library consisting of 120 overlapping structural classes of 11-residues fragments, firstly defined as PBs series (Benros et al., 2006). This library was constructed with an original unsupervised structural clustering method called the Hybrid Protein Model (de Brevern and Hazout, 2003). For each class, a mean representative fragment, or “local structure prototype” (LSP), correctly approximate the local structures with an average Cα RMSD of 1.61 Å. LSPs capture both the continuity between the identified recurrent local structures and long-range interactions. From this description, two methodologies were developed to predict flexibility. The first one was based on simple logistic functions and supervised with a system of experts (Benros et al., 2006). The second one was a combination of Support Vector Machines (SVMs) and evolutionary information (Bornot et al., 2009).
Pandini and co-workers developed their own SA; it is derived from the notion of attractors in conformational space, a more complex approach than PBs (Pandini et al., 2010). Pandini and co-workers developed their own SA; it is derived from the notion of attractors in conformational space, a more complex approach than PBs (Pandini et al., 2010). They focused on four-residue long fragments, the conformation of each being defined by internal angles between Cα atoms, i.e., two pseudo-bond angles and one pseudo torsion angle. All protein fragments were mapped as points in a three-dimensional space of these internal angles. The optimal number of clusters, i.e., structural prototypes, was assessed by the quality of the reconstructed protein structures and by information content. They ended with an alphabet of 25 letters, called M32K25. The alphabet starts from extended structures (e.g., A letter) and ends with turns (e.g., Y letter), passing through loops (e.g., P letter) and helical structures (e.g., U letter). The authors compared their approach with other SAs of four-residue fragments and showed the superiority of their method (Camproux et al., 2004; Tung et al., 2007). An interesting point was the analysis of the correlation between local flexibility and variability in the assignment. Thereafter, they have developed GSATools, (http://mathbio.nimr.mrc.ac.uk/wiki/GSATools, Pandini et al., 2013), composed of a set of programs, that encode ensembles of protein conformations into alignments of structural strings using their Structural Alphabet. This software package is particularly well suited for the investigation of the conformational dynamics of local structures, the analysis of functional correlations between local and global motions, and the mechanisms of allosteric communication. It performs a wide range of statistical analyses using a various set of external tools, mainly from R (Ihaka and Gentleman, 1996) and Python (Python Software Foundation, 2015). The software has been integrated into the GROMACS environment (Lindahl et al., 2001; Van Der Spoel et al., 2005). The user must compile it specifically.
GSATools was used to finely analyse the NtrC receiver domain and its homologs CheY and FixJ. For this purpose, different conformations of the protein extracted from a MDs simulation were encoded. The distributions of SA strings were used to compute different mutual information matrices using information theory. Remarkably, they were able to detect allosteric signal transmission from protein dynamics (Pandini et al., 2012). They also applied this methodology to a larger set of related proteins to show how evolutionary conservation and binding promiscuity have opposite effects on intrinsic protein dynamics (Fornili et al., 2013). Other examples are provided in Section 4.
These innovative approaches have been useful to study specific proteins implicated in pathologies and diseases. They are also sufficiently powerful to analyze large datasets of protein structures using automated pipelines. To summarize, SAs provide new visions for the analyses and prediction of protein structure flexibility. Different examples will be detailed in the following sections.
Duffy Antigen/Chemokine Receptor (DARC) Protein
Using the approaches described above, we analyzed conformations of different proteins implicated in pathologies. A very first study was done on predicting flexibility of loops in the Duffy antigen/receptor for chemokine (DARC) protein (Cutbush and Mollison, 1950; Compton and Haber, 1960). DARC is a transmembrane protein localized in the plasma membrane of red blood cells. It is a non-specific receptor for several chemokines (Allen et al., 2007); it is also named atypical chemokine receptor 1, Fy glycoprotein (FY), or CD234 (Cluster of Differentiation 234). The transmembrane chemokine receptors comprise two main families, defined by differences in their ligands. Indeed, chemokines can contain either two consecutive Cysteines (the CC chemokines) or two adjacent Cysteines with one amino acid in-between (the CXC chemokines). Furthermore, the two families of chemokine receptors have a specific linear sequence motif in their C-terminus region that enables signal transduction. In contrast, DARC lacks the specific motif, thus showing a specific difference coming probably from a distinct evolution.
This protein is also known as the receptor for the human malarial parasites Plasmodium vivax and Plasmodium knowlesi (Miller et al., 1975, 1976). Polymorphisms of DARC are the basis of the Duffy blood group system. While malaria is the most important sickness associated with DARC (Guerra et al., 2006; Cutts et al., 2014), DARC plays also a role in numerous other diseases, such as HIV and cancer, and risk factor associated with many other diseases is emerging (Liu et al., 1999; Horne and Woolley, 2009).
Like most transmembrane proteins, no experimental structure of DARC is currently available (de Brevern et al., 2005). We designed a structural model based on a comparative modeling approach. Using rhodopsin (the only available related structure at this time) as a structural template (a simple alignment showed a very low sequence identity value of 12%, e.g., close to a random value), we carefully built different structural models, based on a hierarchical and iterative procedure. A first step was to predict using more than 10 methods the positions of the 7 transmembrane helices along the sequence. From this initial and rough model, helices of DARC were aligned with rhodopsin helices assigned from the 3D structure. The same methodology was used for the loops, a complete alignment was generated using helices and connecting loops. A specific treatment was done for N- and C-termini region, combining Protein Blocks prediction (de Brevern et al., 2004; Etchebest et al., 2005) with threading approaches.
Experimentally, 40 Alanine mutants had been produced and associations binding constants with CXC-L8 were evaluated (Tournamille et al., 2003, 2005). We used these experiments to assess the quality of our best refined models. From the results, we generated new models by manually changing the positions of helices (and the alignments). Building and refinements were done 10 times until a proper set of characteristics were obtained. In regards to these experiments, in silico analysis of protein flexibility has underlined specific characteristics of different epitopes and interaction regions.
Interestingly, we obtained two different conformations (see Figure 4A) that were both as compatible with experimental data and similarly scored by the few assessment approaches available for transmembrane structural models. Interestingly five years later, an attempt to generate better models with the best available methods was not crowned with success (de Brevern et al., 2009; Smolarek et al., 2010).
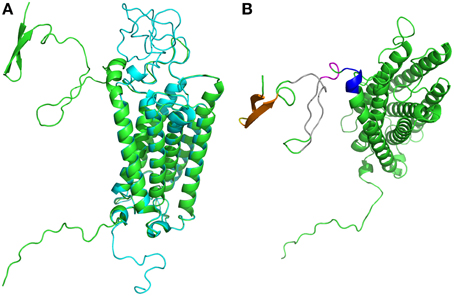
Figure 4. Duffy Antigen/Receptor for Chemokines structural models. (A) Are shown the two best structural models obtained (de Brevern et al., 2005), in blue the compact one, in green the located far away. They are near identical on transmembrane domains. (B) The different regions with significant local conformational tendencies are shown in other colors. The most important ones are within the first 15 residues (predicted as disordered), with two β-stands (in orange) connected by a short turn (in yellow), later two long regions show some local conformational tendencies to be in extended conformation (in gray color) while the end of this N-terminus is packed in helical conformation (in pink and in violet). Visualization was created by the program PyMOL (http://www.pymol.org, Delano, 2013).
It took us one year to build such models (models are available at Model Archive website (http://modelarchive.org/, Schwede et al., 2009). The Nterminus is particularly important in the infection by Plasmodium vivax (Batchelor et al., 2014). It is nearly 55 residues long and different disorder prediction methods (i.e., DisEMBL, Linding et al., 2003 or PrDOS, Ishida and Kinoshita, 2007), predicted as partially disordered, with the beginning of the sequence as fully disordered.
To evaluate the different conformational states of the Duffy protein, we carried out numerous MDs simulated annealing simulations with the GROMACS software (Lindahl et al., 2001; Van Der Spoel et al., 2005). MD simulated annealing allows a harsh sampling of the conformational space by crossing energetic barriers in an efficient and fast way. Many runs were performed and the different conformations obtained at room temperature were analyzed using Protein Blocks. In practice, we encoded each 3D protein structural model conformation into a 1D string (the length of the protein sequence) using Protein Blocks. Then, we computed, the number of times each PB was observed for each position. Positions with a high frequency of a single PB exhibit no local change, while some others positions exhibit local deformations that require a more in-depth analyses. Few variations could be observed in the helical regions (PB m and encompassing PBs) that were weakly restrained with harmonic forces. Instead, loops sampled large regions of the conformational space. A very interesting result was observed for the Nterminus region, and especially the distal region. In contrast to what was suggested by disorder predictors, this region was not a random coil region, but in fact a small β-sheet composed of two β-strands (PBs d and encompassing PBs, seen in orange on Figure 4B), connected by a short turns (in yellow). In the β-sheets, some positions, e.g., 12 and 13, were invariant. Likewise, the closest region to the first helix was more constrained than expected and not disordered (in pink and violet). Even the central regions (in gray) showed some tendencies to be structured. It was a striking example of a complex series of conformations which cannot be analyzed for instance through classical secondary structure (Kabsch and Sander, 1983).
A second example on DARC loops was the last extra-cellular loops for which a specific and constrained loop conformation was observed. Remarkably, this unexpected conformation explains a “lethal” mutation for the binding of CXCL8. It was the first time a structural alphabet was used to analyze the dynamics of a protein structures or structural model.
Human Integrin α2bβ3
In another project, we were interested in integrins, a large family of cell surface receptors involved in cell—cell or cell—matrix adhesion. Integrins are type I membrane glycoproteins composed of two distinct α and β subunits. Each subunit has a large extracellular region (composed of multiple structural domains), a trans-membrane segment and a short intracellular domain. Integrins interact with cell cytoskeleton and mediate bi-directional trans-membrane signal transduction. These receptors are expressed in vertebrate, but also in lower metazoans including sponges, nematode Caeorhabditis elegans and fruitfly Drosophila Melanogaster. In mammals, 18 α and 8 β subunits assemble in 24 distinct integrin complexes. Integrins play critical roles in many physiological processes like hemostasis, immune response, leukocyte trafficking, development and angiogenesis or in pathology like cancer. In human, they are responsible for many diseases from genetic or immune origins. They also make effective targets for drug therapies in thrombosis and inflammation. Furthermore, integrins are binding sites for many viruses and bacteria (Hynes, 2002; Takada et al., 2007).
In regard to these various characteristics, integrins have been extensively studied over the past decades. Especially, structural analyses have provided substantial insights to explain functional mechanism(s). In 2004, the first structure of the extracellular domain of αVβ3 integrin, a vitronectin receptor found in platelets, was proposed (Xiao et al., 2004). Then, several structures of αVβ3 but also of αIIbβ3 integrin (Zhu et al., 2008), a fibrinogen receptor involved in platelet aggregation, were resolved in different activation states. Molecular models for both trans-membrane and cytoplasmic domains were also proposed. Thus, it opens the way to investigate impact of mutant using in silico mutagenesis.
Hence, we examined the effect of the β3-Leu253Met substitution of αIIbβ3 complex in patients with Glanzmann thrombasthenia (Jallu et al., 2010), a rare bleeding disorder characterized by an impaired platelet aggregation (George et al., 1990). For the first time, we showed that residue Leu253—localized at the interface of the complex—is playing a major role in the stability of αIIbβ3. Nonetheless, structural models reflecting static specific states do not depict structural dynamics accompanying the various aspects of integrin functions. For instance, when integrins are activated by substrates, large conformational changes are observed. Analyses of static structures (e.g., B-factor, electrostatics), give only a limited view of the protein complex behavior, contrary to MDs simulations which are able to some extent, to reproduce the inner dynamics of protein structures.
α and β subunits of integrins are associated to rigid, flexible and even disorder properties (such as Duffy protein presented in the section above). We ran independent MDs simulations on different systems, i.e., the wild type but also variants and mutants, using GROMACS MDs package (Van Der Spoel et al., 2005) to examine specific regions of αIIbβ3. We observed different opposite behaviors depending on the region and mutants studied.
Hence, we studied the Cab3a+ alloantigen resulting from a Leu841Met substitution in the αIIb chain. This polymorphism might result in severe life-threatening thrombocytopenias. Cab3a+ corresponds to a Leu841Met mutation. We evaluated the flexibility by using Neq index and found that this polymorphism locates in a very flexible sequence in the wild type (with a Neq > 4), but the mutation did not modify the Neq behaviors (Jallu et al., 2013). Moreover, no change in the secondary structure content, neither the PBs adopted by residues of encompassing sequences change. Hence, intriguingly, this substitution would have little effect, if any, on the backbone structure of the peptide 829–853. It must be noticed that disorder prediction does not show this region has flexible property, i.e., prediction with IUPred (Dosztanyi et al., 2005) or DisEMBL (Linding et al., 2003).
In Caucasian population, the Human Platelet Alloantigenic (HPA) system 1 is involved in most neonatal thrombocytopenias (NAITP) and post-transfusion purpura (PTP) (Espinoza et al., 2013). The HPA-1 system results from a Leucine to Proline substitution in position 33 of the β3 chain (alleles HPA-1a and HPA-1b, respectively) in platelet αIIbβ3 integrin (Jallu et al., 2012). Alloantibodies to the HPA-1a variant can induce very severe immune thrombocytopenia (Espinoza et al., 2013). Furthermore, the Pro33 allelic variant of β3 is considered as a risk factor of thrombosis in patients with cardiovascular diseases.
To compare the HPA-1a and -1b variants, we have proposed for the first time to use a combination of standard analysis of flexibility (namely Root Mean Square Fluctuation, RMSF) and Protein Blocks analyses. MD simulations have revealed that (i) the Leu33Pro substitution of the β3 knee (a domain of β3 integrin chain) leads to adverse structural effects not highlighted by static models; and (ii) that these alterations can explain the increased adhesion potential of HPA-1b platelets to fibrinogen and the possible thrombotic risk associated with the HPA-1b phenotype (Jallu et al., 2012). These molecular simulations also support a novel structural explanation for the epitope complexity of the HPA-1 antigen (Jallu et al., 2012).
Although not yet known to be involved in an alloimmune response, a third variant discovered more recently and characterized by a Valine in position 33 of β3, was also examined. Analyses of the protein flexibility properties can mainly explain the variable reactivity of anti-HPA-1a alloantibodies. This result suggests that dynamics plays a key role in the binding of these alloantibodies. Unlike the L33P substitution which increases the local structure flexibility, the L33V transition would not affect the local structure flexibility, and consequently the functions of αIIbβ3 (Jallu et al., 2014). Although, this region is considered as rigid by disorder prediction, both RMSF and PBs analysis shows a high mobility. This behavior may be explained by a local rigidity, surrounded by deformable regions.
Figure 5 represents another MDs simulation focusing here only on the Calf-1 domain (a domain of α2b integrin chain), using same parameters as before. Simulations were analyzed through PB approaches underlining its interest for flexibility studies using PBxplore. Figures 5A,B show the superimposition of two distinct snapshots (in red and in yellow) extracted from the MDs simulation. Figure 5C shows the frequency of PBs at each position, calculated along the MD trajectory, and represented as a WebLogo graphic (Crooks et al., 2004) obtained with PBxplore. WebLogo (Crooks et al., 2004) summarizes this information with an entropy of every PBs at each position. Figure 5D is the superimposition of Neq and RMSF. Interestingly, even though some regions show similar tendencies, namely large RMSF associated with large Neq, other regions exhibit different and even opposite tendencies. For example, focusing on the residues near position 66 of Calf-1, the RMSF given Figure 5G, is the highest one (in blue on Figure 5E) as highly flexible, but it is not the case as the Neq-values for this residue is not high. Therefore, these residues appear to be a mobile region between two deformable regions. This example confirms the interest to examine Neq index beside RMSF because each measure brings related but different information on flexibility.
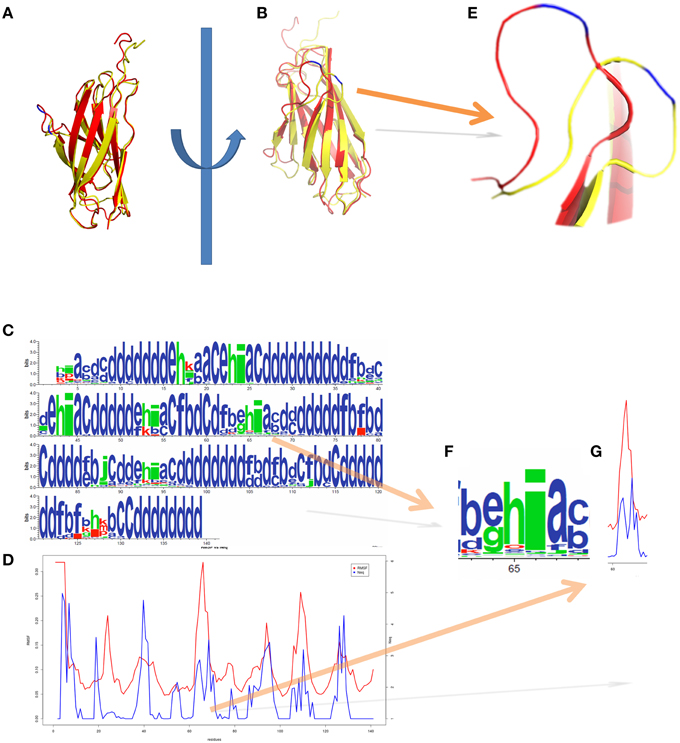
Figure 5. Integrin Calf-1 domain simulation using PBxplore. (A,B) show the superimposition of two distinct snapshots (in red and in yellow) extracted from a molecular dynamics. (C) Shows the PB distribution in terms of WebLogo (Crooks et al., 2004) obtained thanks to PBxplore, and (D) represents the superimposition of Neq and RMSF for the whole domain. (E) Zoom on the loop containing the residue 66 of Cab-1 domain (blue) which shows a dedicated (F) PB pattern i with a (G) low Neq and high RMSF, i.e., a mobile position in a “flexible” region. Visualization was created by the program PyMOL (http://www.pymol.org, Delano, 2013).
Figure 6 shows the structural alphabet distribution during the simulation obtained with GSATools (see Section The Different Views of Protein Structures). The most frequent letters seen (in black) are from the beginning of the alphabet, underlining its all-β composition (Figure 6A). The decomposition by this SA shows a large number of conformational changes at each position of the sequence. Only few positions, e.g., 10, 131, and 44 represented by B, H, and X letters, respectively, remained unchanged during the Calf-1 simulations. The transition probability matrix calculated between SA letters (Figure 6B) reflects how the local structure changes occur. Along the diagonal, high values are found, the highest ones being for letters N and X while the lowest ones being for letters U and Y The Mutual Information (MI) matrix presented in Figure 6C describes the correlation of local conformational changes among the protein fragments. Significant off-diagonal values are found but actually they correspond to strands forming β-sheets. Hence, in contrast to the examples detailed in (Pandini et al., 2012, 2013), the all-β conformation of the protein impedes to enlighten long-range correlations, except between β –strands close in 3D and found all along the protein sequences. The Shannon entropy per position shows quite similar profile between β –strands (mainly between 1.0 and 2.5 bits). All the lowest values correspond to residues inside loops. One of the most interesting features of GSATools is the graph representation of the correlated local motions from the MI matrix; it describes the relative importance of the nodes in the network useful to analyze allosteric behaviors. Figure 6F is a visualization of the two most important peaks underlined, they are found far away from the rigid β-sheet region.
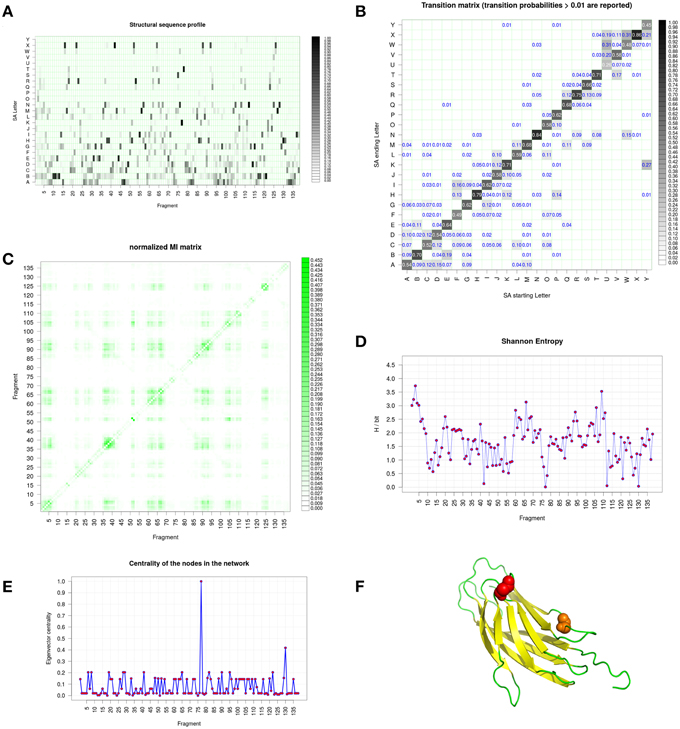
Figure 6. Integrin Calf-1 domain simulation analyses using GSATools. (A) shows the structural alphabet distribution during the simulation, i.e., the sequence profile of the alignment, (B) the transition probability matrix for the transitions between SA letters, which reflect local conformational changes, (C) the Mutual Information (MI) matrix describing the correlation of local conformational changes among the protein's fragments, (D) the Shannon entropy per position, and (E) the graph representation of the correlated local motions from the MI matrix, with the eigenvector centrality, which describes the relative importance of the nodes in the network. (F) Is a visualization created by the program PyMOL (http://www.pymol.org, Delano, 2013) of the two most important peaks underlined by (E).
Protein Complexes and Allostery
It is well documented that protein–protein interactions are often guided by flexibility (Jones and Thornton, 1996; Salwinski et al., 2004) and that alternative conformations can have a significant influence on the binding process. It is why predicting the structure of a complex using the unbound structures of the partners remains highly challenging, despite a scrutinizing examination of the amino acid composition of the interface (Janin et al., 2008). Thus, in most cases, protein structures change during the formation of the complex. The changes can be limited to few side chains motions but can also correspond to major reorganization in the fold. Therefore, we undertook the analysis of the protein–protein complexes in the light of structural alphabet. We compared proteins 3D structures in free form, and as part of larger macromolecular complexes.
The building of the protein dataset was quite strict leaving only 76 high quality complexes representing very different configurations with free and bound forms (Swapna et al., 2012). Accordingly, structural changes occurring between the free and bound forms of the protein were analyzed using three different measures: the Cα root mean square deviation, the percentage of PB change and a specific PB substitution score. This last score relies on a PB structural substitution matrix that quantifies the cost to replace a given PB by another PB. The more similar the PBs, the more favorable the substitution score. Consequently, this score permits to quantify the conformational change by distinguishing similar PBs from to the most distinct ones. Comparison between unbound and bound forms shows that significant structural rearrangement occurs at the interface but also in regions away from the interface upon the formation of a highly specific, stable and functional complex. For 50% of them, which correspond to signaling proteins, the major changes correspond to allosteric ones, localized far away from the interface. These sites could be associated to mutations known to be involved in multiple diseases such as cancer. PB allows distinguishing here also between large movements, from mobility to deformability or flexibility. Normal Mode Analysis was also performed to gain deeper insights (Swapna et al., 2012). The results obtained for signaling complexes underline the importance of allostery-like structural changes much more than appreciated before (see Figure 7).
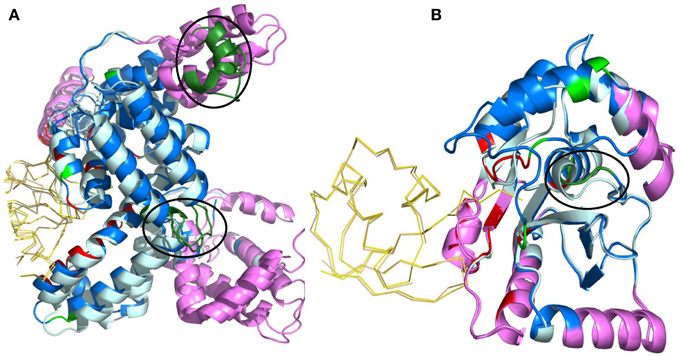
Figure 7. Normal mode analysis of structural changes in regions of low B-factor far from interface. The protein containing the region of interest is depicted as cartoon and the interface of the other protein in ribbon. Unbound and bound forms of the protein of interest are in pale cyan and marine blue, respectively. The partner protein's unbound and bound forms are in light orange and yellow, respectively. Interacting residues are in red and non-interacting residues with PB change in green. All regions of interest are marked with a black circle, irrespective of whether they are intrinsically mobile or rigid. Regions identified to be intrinsically mobile according to NMA are in violet. Regions of interest occurring within the intrinsically mobile segments are in dark green. The complexes shown are (A) α-actin and Vitamin D - binding protein (PDB code 1KXP, Otterbein et al., 2002) (B) Ubiquitin Carboxyl-terminal esterase L3 protein and Ubiquitin complex (PDB code 1XD3, Misaghi et al., 2005). These figures show that non-interacting regions observed to undergo conformational changes upon complexation are usually intrinsically mobile, which is a characteristic of a functional site. Visualization was created by the program PyMOL (http://www.pymol.org, Delano, 2013).
Flexibility becomes a critical issue in complexes especially the ones involving intrinsically disordered protein. Fine analyses have shown that disordered proteins can also adopt well-defined conformations in their bound form; their inherently dynamic nature is cast into their complexes (Meszaros et al., 2011). Protein families with more diverse interactions exhibit less average disorder over all members of the family (Fong and Panchenko, 2010). Inter-domain linkers are evolutionarily well conserved and are constrained by the domain-domain interface interactions (Bhaskara et al., 2013). An interesting resource is the ComSin database which provides a collection of structures of proteins solved in unbound and bound form, targeted toward disorder–order transitions (Lobanov et al., 2010).
Protein/DNA Interfaces
Beside protein-protein interactions, which govern many biological functions, fundamental biological processes like transcription also require complex formation, i.e., between protein and DNA. As for protein-protein interaction, complexation can change structures of both partners, but most studies focused on the protein side. Most of protein/DNA interfaces only extend the classical approaches to analyze protein/protein interfaces or protein/ligands interface. For instance, in PDIdb (Ferrada and Melo, 2009) or Biswas and coworkers studies, the interface is classified into core and rim regions, the first one being more sequentially conserved. Biswas and coworkers proposed a new classification scheme for the interfaces based on the composition of secondary structures (Biswas et al., 2009). Beyond this description in terms of regular local structures, Sunami and Kono (2013) conducted a quantitative analysis to understand the conformational changes in proteins when they bind to DNA. They compared DNA-free and DNA-bound forms of proteins and used structural alphabets to describe conformational changes in 4-residue fragments. They found that (i) three specific alphabets appeared in the DNA interfaces, (ii) conformational changes in DNA interfaces are more frequent than in non-interfaces and importantly, (iii) regions involved in DNA interfaces have more conformational variations in the DNA-free form. This study underlines also the importance of intrinsic flexibility of interacting regions to fit into DNA structure.
Another recent analysis has explored an extensive set of protein/DNA complexes and looked at conformational changes occurring in proteins but also in DNA. Importantly, for both molecules, structural alphabets were used. The alphabet used for describing protein backbone is the Protein Blocks. For DNA, a structural alphabet was obtained using a new approach of registering torsion angles of a dinucleotide unit combined with Fourier averaging and clustering (http://www.dnatco.org/, Svozil et al., 2008; Cech et al., 2013). These structural alphabets describe biopolymer conformations at greater detail than the 3-state protein secondary structure and basic DNA structural types such as A, BI and BII. Figure 8 shows an example of different conformations. This study compared structural features of the protein/DNA interface with the features of non-interacting parts of protein and DNA molecules. Clear differences in preferences for occurrences of local protein and DNA conformations were observed. Specific preferences were underlined between complexes containing various types of proteins such as transcription factors and nucleases. Minor DNA conformers are often significantly enriched at the interface so that the ability of DNA to adopt non-canonical conformers, rare in naked DNA, is clearly essential for the recognition by proteins. Rare DNA conformations introduce significant deformations to the DNA regular structure. The occurrence of these rare forms was estimated and characterized enabling a better understanding of the role of non-B-DNA structures. A critical feature was the distinct interaction patterns for the DNA minor groove relative to the major groove and phosphate, and the importance of water-mediated contacts. Indeed, water molecules mediate a proportionally largest number of contacts in the minor groove and form the largest proportion of contacts in complexes of transcription factors (Schneider et al., 2014). It corroborates to previous researches on the importance of mobility of such water molecules (Luo et al., 2011; Russo et al., 2011).
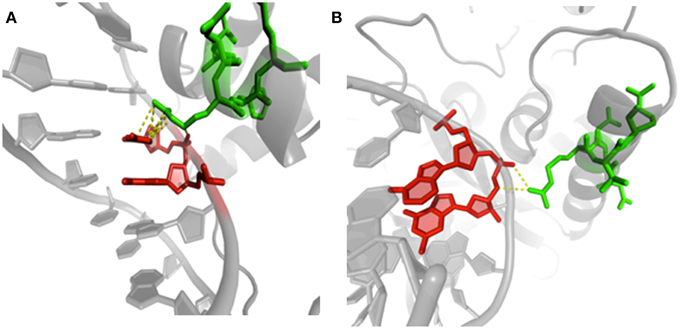
Figure 8. Examples of protein/DNA interactions. (A) Structure of human centromere protein B (CENP-B) binding to DNA CENP-B box (PDB code 1HLV, Tanaka et al., 2001). The image highlights contacts between arginine 125 (chain A, green) in PB m (regular helix) and cytosine 15 (chain B, red) in ntC 41. (B) Details of methionine repressor protein (MetJ) binding to DNA metbox (PDB code 1MJQ, Garvie and Phillips, 2000). The same PB m and amino acid residue (arginine 40 in chain H, green) is in contact with guanine 2 (chain K, red) in NtC 13. Visualization was created by the program PyMOL (http://www.pymol.org, Delano, 2013).
The above-discussed analyses pointed to some remarkable features about the protein/DNA interfaces, so that we performed a more specific analysis of the protein and DNA dynamics based on crystal structures. The analysis of B-factors (Schneider et al., 2014) showed that the dynamics of biopolymer residues, amino acids and nucleotides, as well as ordered water molecules is first of all a function of their neighborhood: amino acids in the interior of proteins have the tightest distribution of their displacements, residues forming the biopolymer interfaces (protein/protein or protein/DNA) intermediate, and residues exposed to the solvent the widest distribution (Figure 9). This general picture is best pronounced for structures with the highest crystallographic resolution since discrimination of different types of residues in structures becomes unclear with lower crystallographic resolution. Besides, amino acid residues in the protein core display a unique feature: their backbone and side chain atoms have virtually identical B-factor distributions. The protein core is therefore extremely well packed leaving minimum free space for atomic movements. B-factors of water molecules bridging protein and DNA molecules were surprisingly significantly lower than B-factors of DNA phosphates; in opposite, solvent-accessible phosphates were extremely flexible. An unexpected conclusion of this analysis is that a part of the observed trends could be due to improper refinement protocols that may need slight modifications (Schneider et al., 2014). Hence, the B-factors of high-resolution structures reflect the expected dynamics of residues in protein–DNA complexes but the B factors of lower resolution structures should be treated cautiously. Based on such kinds of ideas, Vriend proposed a dedicated dataset of refined B-factors (http://www.cmbi.umcn.nl/bdb/, Touw and Vriend, 2014).
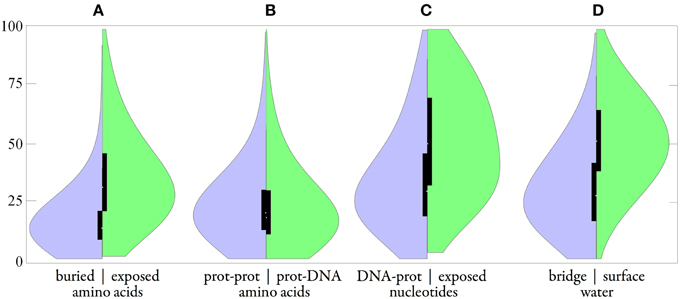
Figure 9. Distributions of B-factors in the group of protein-DNA complexes (165 structures with crystallographic resolution 1.9 Å and better). Smooth plot (A) compared buried amino acid (left in purple) vs. exposed aa (right in green); (B) protein-protein aa vs. protein-DNA aa; (C) DNA-protein nucleotide vs. exposed nt; (D) bridge water vs. surface w. Black boxes show the second and third quartiles; the white spot indicates the median.
PTMs
As seen in the previous sections, protein flexibility is essential for interactions between proteins and ligand, nucleic acid, or protein partners. Apart from interaction with partners, chemical modifications like formation or breaking of covalent bonds, can impact structural and dynamics properties. One of the most spectacular examples is depicted by the serpin family members when they interact with the protease (see Figure 10, Huntington et al., 2000; Kim et al., 2001). An initial large conformational change, consecutive to the cleavage of the reactive center of the serpin by the protease, occurs. The loop involved in the cleavage moves, folds as a β-strand that inserts between the other strands of the β-sheet composing the serpin protein core. The two proteins are tightly linked, which significantly affects the protease that looses more than 30% of its structure.
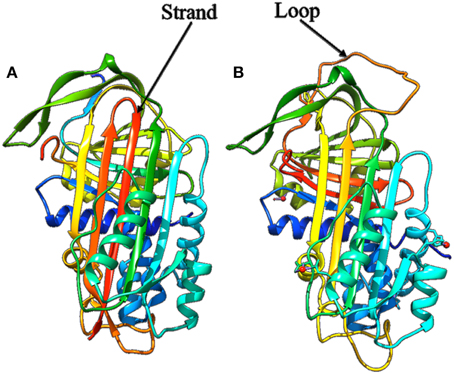
Figure 10. Structure of the alpha 1 antitrypsin. (A) The cleaved form after complexation with protease (PDB code 1EZX, Huntington et al., 2000) showing the strand inserted in the β-sheet after cleavage, (B) the uncleaved form (PDB code 1HP7, Kim et al., 2001) showing the wild whole loop.
Among chemical modifications, post-translational modifications (PTMs), like phosphorylation, play a major role in many biology processes. Integrins, for example, can be activated consecutive to phosphorylation. The impact of these modifications on the structure and the dynamics of proteins is thus of particular interest.
Recent studies have shown that PTMs have significant effects on the protein conformations and on their flexibility. Hence Xin and Radivojac used 3D structures from the PDB and studied the conformational heterogeneity of protein structures corresponding to identical sequences in their unmodified and modified forms (Xin and Radivojac, 2012). They demonstrated that PTMs induce conformational changes at both local and global level, but with a limited impact. Accordingly PTMs would affect regulatory and signaling pathways (Nussinov et al., 2012; Xin and Radivojac, 2012) by subtle but common mechanisms of allostery. Some prediction approaches and are included into dedicated databases (Matlock et al., 2015), but few analyzed precisely the whole PTMome.
This led us to conduct a deep analysis of structures of the same protein with or without PTMs. As an example, we selected 157 PDB chains of the human Cyclin-dependent kinase 2 (UniProt AC: P24941) in complex form, and 222 PDB chains of unbound monomer. Based on data from PTM-SD (Craveur et al., 2014), a database of structurally solved and annotated post-translational modifications, 112 chains among the 157 complexes, present a phosphorylated threonine at position 160 in the structure of the kinase. As described in Table 1, we compared the backbone flexibility of three different cases: unbound kinase, kinase complex, and phospho-Thr160 kinase in complex.
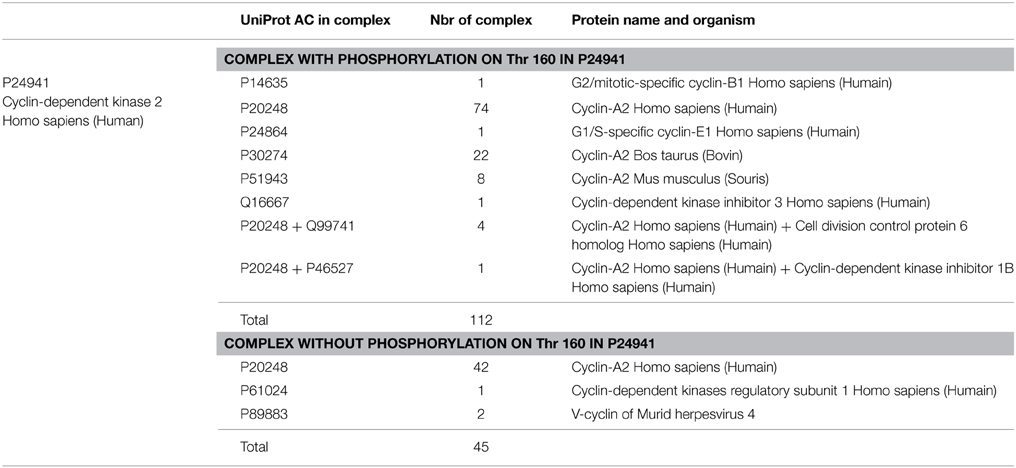
Table 1. Composition of structural complexes involving the Cyclin-dependent kinase 2.
Comparison of the three Neq profiles, shown in Figure 11, highlights significant differences in local flexibility of the kinase structures. Figure 11A shows that, when kinase is in unbound form, the polypeptide chain presents a flexible fragment (colored in green), which corresponds to a large loop. When complex is formed (Figure 11B), this loop is placed at the interface and leads to stiffening of its edges and higher flexibility in the neighborhood of Thr-160. This change is characterized by a diminution and an increase of Neq-values, respectively. Finally, when the Thr-160 is phosphorylated (Figure 11C), the green region becomes comparatively rigid, which results to limited flexibility (Neq ≤ 3.16). However, another region in kinase (position 8 to 18) is associated with increasing flexibility. When the complex is forming, the Neq range in this area increases from (1;2.77) to (1;3.76), and secondly, when the phosphorylation is in place, the range increases to (1;5.91). Interestingly, this region corresponds to the neighboring positions of two other phosphorylation sites, at Thr-14 and Tyr-15. It is important to note that these phosphorylations were absent in the structures used here for the Neq computation.
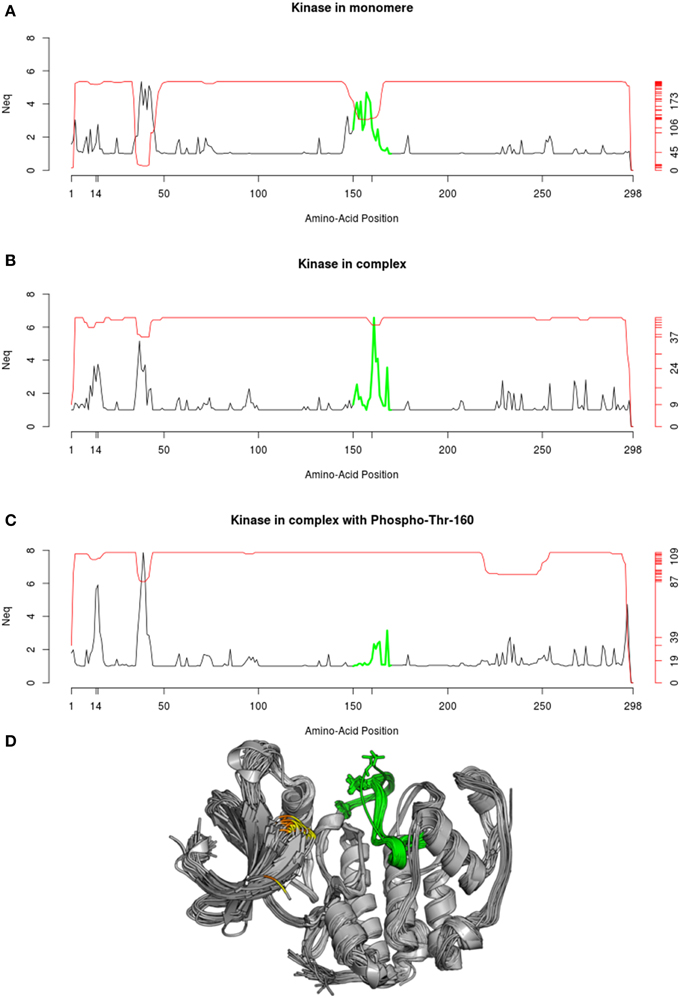
Figure 11. Neq profile of Cyclin-dependent kinase 2. The Neq profile is given in each case: (A) for structure of kinase found in monomer, (B) found as part of a complex, (C) found in complex with a phosphorylation solved in the Thr-160. (D) The superposition of the 112 PDB chains used to compute the Neq profile in (C) is shown. The corresponding green region is highlighted, and positions 14 and 15 are, respectively, indicated in yellow and orange. Protein visualization was created by the program PyMOL (http://www.pymol.org, Delano, 2013).
In a functional point of view, the phosphorylation in position 160 is known to promote the activation of the kinase, while the phosphorylation of position 14 and 15 slightly reduce its activity (Gu et al., 1992). Thereby, the changes in flexibility observed at these 3 phosphorylation sites, could reflect that the activity of the kinase is regulated by a mechanism of complementary rigidity/flexibility of local protein backbone, which could be related to allosteric effects.
The red line plotted in Figure 11 represents the number of available structural data for each position. Interestingly, the green region in Figure 11 is proportionally less resolved when kinase is in monomer than when it is in complex, and even more solved when the Thr-160 is phosphorylated. This observation emphasizes that the decrease of flexibility in this region facilitates the resolution of the structures. Several structures of the same protein present specific regions that are disordered in some crystals and ordered in others. These regions were defined by Zhang and collaborators as “Dual Personality Fragments” (Zhang et al., 2007), and the corresponding fragment of the green region in Cyclin dependent kinase was the emblematic example used by Zhang et al. (2007) to defined DPF. In the same way, the region between positions 35 to 45 were also identify as DP fragments.
Prediction of Protein Flexibility
The growing gap between the number of protein sequences and the number of atomic structures imposes to resort to alternative approaches to gain structural and dynamics information. They are mainly based on crystallographic B-factor analyses. It is often seen that crystallographic B-factors are a mix of properties, dynamics being one of them. Recent approaches show that NMR spectroscopy provides an ever increasing amount of dynamics data, going well beyond the simple thermal vibrations (Powers et al., 1993; Palmer, 2001; Olsson et al., 2014). None of them can describe all the important flexible movement or even disorder. Hence, it must be taken into account that everything in protein dynamics cannot be assessed based on a single view Prediction methods are therefore of particular importance. Flexibility prediction from sequences started as a Boolean prediction, i.e., rigid or flexible, using simple statistical analyses of B-factor values (Karplus and Schulz, 1985; Vihinen et al., 1994). Following developments combined evolutionary information to different machine learning methods, such as Artificial Neural Networks (Schlessinger et al., 2006), support vector regression coupled with random forest (Pan and Shen, 2009), and support vector machines (Kuznetsov, 2008; Kuznetsov and McDuffie, 2008). Additional sources of information were progressively take into account, rather than X-ray B-factors, as Nuclear magnetic resonance data (NMR) (Trott et al., 2008; Zhang et al., 2010), dihedral angles and accessibility (Hwang et al., 2011), or computational data from Normal Mode Analysis (Hirose et al., 2010). At last, some methodology, dedicated to predict protein disorder were also developed and designed to high flexibility prediction (Galzitskaya et al., 2006; Mamonova et al., 2010; Jones and Cozzetto, 2015). Recent approaches are quite complex like (i) the DynaMine webserver (http://dynamine.ibsquare.be/, Cilia et al., 2013, 2014), DynaMine predicts backbone flexibility at the residue-level in the form of backbone N-H S2 order parameter values learnt from NMR data, or (ii) as a predictor which used relative solvent accessibility (RSA) and custom-derived amino acid (AA) alphabets. The prediction is done in two-stage linear regression model that uses RSA-based space in a local sequence window in the first stage and a reduced AA pair-based space in the second stage as the inputs (Zhang and Kurgan, 2014).
We also proposed prediction of protein flexibility of an amino acid sequence using the potentialities of SA prediction. The approach is not only innovative through the use of local protein conformations, but also with specific definition of flexibility. Flexibility is often defined based on α-carbon B-factor values obtained from X-ray experiments. As mentioned above, these data reflect protein flexibility, but may also be prone to experimental and systematic biases. Hence, flexibility was considered with X-ray B-factor descriptors and the RMSF observed in MDs simulations, which is calculated from the amplitude of atom motions during simulation. Both descriptors were combined to define and to examine flexibility classes of SA.
This dedicated prediction method is divided in two steps: first an SA prediction from sequence, and second a flexibility prediction from the SA predicted. The SA used in this method is the LSP (see Section The Different Views of Protein Structures). They consist of 120 overlapping structural classes of 11-residue long fragments (Benros et al., 2006), which encompass all known local protein structures and ensure good quality 3D local approximation. The major advantage of this library is its capacity to capture the continuity between the identified recurrent local structures (Benros et al., 2009). We can notice that is quite difficult to have a good correlation between theoretical results to actual experiments. With LSPs, we have shown that they have on average a correlation > 0.9 with B-factors.
Relevant sequence–structure relationships were also observed and further used for prediction. Briefly, LSP prediction is based on SVM training. With the LSP prediction, a Confidence Index (CI) that is based on the discriminative power of the SVMs is provided. The higher CI, the better the prediction rate is. The prediction rate reaches 63.1%, a rather high value given the high number of structural classes (Bornot et al., 2009).
In a second step, we considered the two descriptors for quantifying protein dynamics, X-ray B-factors and RMSF. They were combined to define 3 flexibility classes of LSPs: rigid, intermediate and flexible. Then for each 11-residue long target sequences, the SA prediction provided a list of five possible LSP candidates. Based on the previously defined flexibility classes of these structural candidates, the prediction of target flexibility is made. Interestingly, the prediction rate is slightly better than the one of PROFbval (Schlessinger et al., 2006) that was optimized for only two classes.
Hence, the originality of the method lies (i) in the use of a combination of B-factors and RMSF for quantifying protein dynamics, (ii) in prediction of flexibility through SA prediction of LSPs, and (iii) in prediction of three classes of flexibility, which are usually limited to two. The method is implemented in a web server named PredyFlexy (http://www.dsimb.inserm.fr/dsimb_tools/predyflexy, de Brevern et al., 2012), in which the users have access to a confidence index (CI) for assessing the quality of the prediction rate.
Conclusion
The protein structure organization is characterized by a conformational arrangement of repetitive structures (secondary structures, i.e., α-helices, β-sheets and coils/loops). Static observation of protein organization has revealed some of their essential properties, i.e., active sites are generally found at the protein core in which residues are well packed and mainly hydrophobic, while the surface residues, exposed to solvent or to another partner(s) (protein, DNA), are more flexible because less constrained than the core. The function of proteins and their interaction mechanism need some flexible properties that are considerably more complex than this simplistic binary view. By exploiting various structural data sources and by developing different computational methods (B-factor, NMR data, MDs Simulation, NMA, …) dynamics of proteins turn out to cover a large spectrum of conformational changes (combined by mobility of rigid fragment and deformability of backbone), by the existence of intrinsic disorder region, by allosteric effect… Some of these flexible mechanisms need structural reorganization at a local level. Thus investigation of protein flexibility requires a more local and complex description of protein structures than the classic representation.
In this review we have illustrated using numerous examples (DARC protein, Human integrins, Protein Complexes, Protein/DNA interfaces, Proteins with Post-Translational Modifications) how the approaches, based on Structural Alphabets, are a valuable tool to study flexibility at this level.
From our experiences with these examples, we can state that the use of SAs allows to tackle and address the important problem of the comparison of an ensemble of protein conformations. Indeed, in a recent paper, Scott and Strauss (Scott and Straus, 2015) underlines the bias related to the use of RMSD, which needs beforehand an optimally superimposed approach often remains as rigid bodies. They proposed an elegant method, fleximatch, of protein structure comparison that tries to take flexibility into account. As it was done for protein superimposition methods (Yang and Tung, 2006; Tung et al., 2007; Tung and Yang, 2007; Le et al., 2009; Budowski-Tal et al., 2010; Gelly et al., 2011; Leonard et al., 2014), SA is an efficient approach, not considering proteins as rigid bodies. We underline the interest of our approach based on Protein Blocks with the PBxplore tools (https://github.com/pierrepo/PBxplore, in preparation) or GSAtools (http://mathbio.nimr.mrc.ac.uk/wiki/GSATools, Pandini et al., 2013) in other cases. The use of SAs and the development of associated metrics such as Neq is required to study the details and begin to understand the complexity of protein flexibility. It allows discriminating flexibility from mobility and deformability, which is not currently considered by other available methods. Nonetheless, it also had drawbacks as no simple threshold will guide the researcher to point out that certain segment is THE highly flexible part and not the other, same as for RMSF. In the same way, use of information theory with GSATools also requires expertise. Moreover, as SA represents a simplification of the 3D description, its results can be compared to the Normal Mode Analysis based on Elastic Network Model (Suhre and Sanejouand, 2004; Tiwari et al., 2014; Eyal et al., 2015) that are efficient to define large movement. However, changes at a finer level such as side chain rotameric states or minor changes in the backbone (but essential for the biological functions) are more difficult to handle. Here as always, a good knowledge of the biological system is essential as a correct definition of the scientific question and its scale (Buehler and Yung, 2009).
To conclude, we can find that all these approaches are suitable for highlighting both flexible and rigid parts of a protein from structures derived from NMR, X-ray diffraction or molecular simulation.
Author Contributions
Section Introduction: PC, APJ, JE, TJN, FN, JR, CE, NS, JCG. Section The Different Views of Protein Structures: PC, APJ, JE, TJN, MG, SL, PP, GF, JR, AG, LSS, RMB, JB, ST, JC, BS, CE, NS, JCG. Section Duffy Antigen/Chemokine Receptor Protein: NS, OB, CE. Section Human Integrin α2bβ3: APJ, NS, MG, PP, JR, JB, ST, VJ. Section Protein Complexes and Allostery: PC, APJ, JE, LSS, RMB, NS. Section Protein/DNA Interfaces: JC, BS, JCG. Section PTMs: PC, JE, TJN, FN, SL, GF, JR. Section Prediction of Protein Flexibility: PC, APJ, JE, SL, GF, AG, CE, JCG. Section Conclusion: PC, APJ, GF, CE, NS. AdB conceived the review and participated in all the different sections.
Conflict of Interest Statement
The authors declare that the research was conducted in the absence of any commercial or financial relationships that could be construed as a potential conflict of interest.
Acknowledgments
PC, APJ, JE, TJN, FL, NS, MG, SL, PP, OB, GF, JR, AG, JB, ST, CE, JCG, and AdB are supported by the Ministry of Research (France), University Paris Diderot, Sorbonne Paris Cité (France), National Institute of Blood Transfusion (INTS, France), National Institute of Health and Medical Research (INSERM, France), and labex GR-Ex (France). The labex GR-Ex, reference ANR-11-LABX-0051 is funded by the program “Investissements d'avenir” of the French National Research Agency, reference ANR-11-IDEX-0005-02. This work was supported by the Czech-France collaboration Partenariat Hubert Curien Barrande (MEB021032) for JCG, JC, BS, and ADB. This study was also supported by BIOCEV CZ.1.05/1.1.00/02.0109 from the ERDF and RVO: 86652036 for BS and JC, by University of Toronto (Canada) for LSS, by Max Planck (Germany) for BMR, by INTS (France) for VJ, by CNRS (France) and Univ Lyon (France) for JB, by CNRS (France), INSERM (France) and Univ Strasbourg (France) for JE, by CNRS (France) and Univ Nantes (France) for ST, by HFSP to APJ; by NIH (USA) for GF, by Department of Biotechnology (India) to NS, and by CNRS (France), Univ Pierre & Marie Curie (France) and ANR NaturaDyRe (France, ANR-2010-CD2I-014-04) to JR. APJ was supported by CEFIPRA number 3903-E and TJN is supported by CEFIPRA number 5203-2. NS and AdB also acknowledge to CEFIPRA for collaborative grant (numbers 3903-E and 5203-2).
References
Allen, S. J., Crown, S. E., and Handel, T. M. (2007). Chemokine: receptor structure, interactions, and antagonism. Annu. Rev. Immunol. 25, 787–820. doi: 10.1146/annurev.immunol.24.021605.090529
Batchelor, J. D., Malpede, B. M., Omattage, N. S., DeKoster, G. T., Henzler-Wildman, K. A., and Tolia, N. H. (2014). Red blood cell invasion by Plasmodium vivax: structural basis for DBP engagement of DARC. PLoS Pathog. 10:e1003869. doi: 10.1371/journal.ppat.1003869
Benros, C., de Brevern, A. G., Etchebest, C., and Hazout, S. (2006). Assessing a novel approach for predicting local 3D protein structures from sequence. Proteins 62, 865–880. doi: 10.1002/prot.20815
Benros, C., de Brevern, A. G., and Hazout, S. (2009). Analyzing the sequence-structure relationship of a library of local structural prototypes. J. Theor. Biol. 256, 215–226. doi: 10.1016/j.jtbi.2008.08.032
Berman, H. M., Westbrook, J., Feng, Z., Gilliland, G., Bhat, T. N., Weissig, H., et al. (2000). The Protein Data Bank. Nucleic Acids Res. 28, 235–242. doi: 10.1093/nar/28.1.235
Bernstein, F. C., Koetzle, T. F., Williams, G. J., Meyer, E. F. Jr., Brice, M. D., Rodgers, J. R., et al. (1977). The Protein Data Bank: a computer-based archival file for macromolecular structures. J. Mol. Biol. 112, 535–542. doi: 10.1016/S0022-2836(77)80200-3
Bhaskara, R. M., de Brevern, A. G., and Srinivasan, N. (2013). Understanding the role of domain-domain linkers in the spatial orientation of domains in multi-domain proteins. J. Biomol. Struct. Dyn. 31, 1467–1480. doi: 10.1080/07391102.2012.743438
Biswas, S., Guharoy, M., and Chakrabarti, P. (2009). Dissection, residue conservation, and structural classification of protein-DNA interfaces. Proteins 74, 643–654. doi: 10.1002/prot.22180
Bornot, A., Etchebest, C., and de Brevern, A. G. (2009). A new prediction strategy for long local protein structures using an original description. Proteins 76, 570–587. doi: 10.1002/prot.22370
Budowski-Tal, I., Nov, Y., and Kolodny, R. (2010). FragBag, an accurate representation of protein structure, retrieves structural neighbors from the entire PDB quickly and accurately. Proc. Natl. Acad. Sci. U.S.A. 107, 3481–3486. doi: 10.1073/pnas.0914097107
Buehler, M. J., and Yung, Y. C. (2009). Deformation and failure of protein materials in physiologically extreme conditions and disease. Nat. Mater. 8, 175–188. doi: 10.1038/nmat2387
Camproux, A. C., Gautier, R., and Tuffery, P. (2004). A hidden markov model derived structural alphabet for proteins. J. Mol. Biol. 339, 591–605. doi: 10.1016/j.jmb.2004.04.005
Camproux, A. C., Tuffery, P., Chevrolat, J. P., Boisvieux, J. F., and Hazout, S. (1999). Hidden Markov model approach for identifying the modular framework of the protein backbone. Protein Eng. 12, 1063–1073. doi: 10.1093/protein/12.12.1063
Cech, P., Kukal, J., Cerny, J., Schneider, B., and Svozil, D. (2013). Automatic workflow for the classification of local DNA conformations. BMC Bioinformatics 14, 205. doi: 10.1186/1471-2105-14-205
Chavent, M., Levy, B., Krone, M., Bidmon, K., Nomine, J. P., Ertl, T., et al. (2011). GPU-powered tools boost molecular visualization. Brief. Bioinformatics 12, 689–701. doi: 10.1093/bib/bbq089
Cilia, E., Pancsa, R., Tompa, P., Lenaerts, T., and Vranken, W. F. (2013). From protein sequence to dynamics and disorder with DynaMine. Nat. Commun. 4, 2741. doi: 10.1038/ncomms3741
Cilia, E., Pancsa, R., Tompa, P., Lenaerts, T., and Vranken, W. F. (2014). The DynaMine webserver: predicting protein dynamics from sequence. Nucleic Acids Res. 42, W264–W270. doi: 10.1093/nar/gku270
Compton, A., and Haber, J. M. (1960). The duffy blood group system in transfusion reactions: a reviw of the literature and report of four cases. Blood 15, 186–191.
Corey, R. B., and Pauling, L. (1953). Fundamental dimensions of polypeptide chains. Proc. R. Soc. Lond. B Biol. Sci. 141, 10–20. doi: 10.1098/rspb.1953.0011
Craveur, P., Rebehmed, J., and de Brevern, A. G. (2014). PTM-SD: a database of structurally resolved and annotated posttranslational modifications in proteins. Database 2014:bau041. doi: 10.1093/database/bau041
Crooks, G. E., Hon, G., Chandonia, J. M., and Brenner, S. E. (2004). WebLogo: a sequence logo generator. Genome Res. 14, 1188–1190. doi: 10.1101/gr.849004
Cutbush, M., and Mollison, P. L. (1950). The Duffy blood group system. Heredity (Edinb.) 4, 383–389. doi: 10.1038/hdy.1950.31
Cutts, J. C., Powell, R., Agius, P. A., Beeson, J. G., Simpson, J. A., and Fowkes, F. J. (2014). Immunological markers of Plasmodium vivax exposure and immunity: a systematic review and meta-analysis. BMC Med. 12:150. doi: 10.1186/s12916-014-0150-1
de Brevern, A. G., Autin, L., Colin, Y., Bertrand, O., and Etchebest, C. (2009). In silico studies on DARC. Infect. Disord. Drug Targets 9, 289–303. doi: 10.2174/1871526510909030289
de Brevern, A. G., Benros, C., Gautier, R., Valadie, H., Hazout, S., and Etchebest, C. (2004). Local backbone structure prediction of proteins. In Silico Biol. 4, 381–386.
de Brevern, A. G., Bornot, A., Craveur, P., Etchebest, C., and Gelly, J. C. (2012). PredyFlexy: flexibility and local structure prediction from sequence. Nucleic Acids Res. 40, W317–W322. doi: 10.1093/nar/gks482
de Brevern, A. G., Etchebest, C., and Hazout, S. (2000). Bayesian probabilistic approach for predicting backbone structures in terms of protein blocks. Proteins 41, 271–287. doi: 10.1002/1097-0134(20001115)41:3<271::AID-PROT10>3.0.CO;2-Z
de Brevern, A. G., and Hazout, S. (2003). 'Hybrid protein model' for optimally defining 3D protein structure fragments. Bioinformatics 19, 345–353. doi: 10.1093/bioinformatics/btf859
de Brevern, A. G., Wong, H., Tournamille, C., Colin, Y., Le Van Kim, C., and Etchebest, C. (2005). A structural model of a seven-transmembrane helix receptor: the Duffy antigen/receptor for chemokine (DARC). Biochim. Biophys. Acta 1724, 288–306. doi: 10.1016/j.bbagen.2005.05.016
Delano, W. L. (2013). The PyMOL Molecular Graphics System on World Wide Web. Available online at: http://www.pymol.org
Dosztanyi, Z., Csizmok, V., Tompa, P., and Simon, I. (2005). IUPred: web server for the prediction of intrinsically unstructured regions of proteins based on estimated energy content. Bioinformatics 21, 3433–3434. doi: 10.1093/bioinformatics/bti541
Dudev, M., and Lim, C. (2007). Discovering structural motifs using a structural alphabet: application to magnesium-binding sites. BMC Bioinformatics 8:106. doi: 10.1186/1471-2105-8-106
Dunker, A. K. (2007). Another window into disordered protein function. Structure 15, 1026–1028. doi: 10.1016/j.str.2007.08.001
Dunker, A. K., Lawson, J. D., Brown, C. J., Williams, R. M., Romero, P., Oh, J. S., et al. (2001). Intrinsically disordered protein. J. Mol. Graph. Model. 19, 26–59. doi: 10.1016/S1093-3263(00)00138-8
Dunker, A. K., and Obradovic, Z. (2001). The protein trinity–linking function and disorder. Nat. Biotechnol. 19, 805–806. doi: 10.1038/nbt0901-805
Dunker, A. K., Obradovic, Z., Romero, P., Garner, E. C., and Brown, C. J. (2000). Intrinsic protein disorder in complete genomes. Genome Inform. Ser. Workshop Genome Inform. 11, 161–171.
Eisenberg, D. (2003). The discovery of the alpha-helix and beta-sheet, the principal structural features of proteins. Proc. Natl. Acad. Sci. U.S.A. 100, 11207–11210. doi: 10.1073/pnas.2034522100
Espinoza, J. P., Caradeux, J., Norwitz, E. R., and Illanes, S. E. (2013). Fetal and neonatal alloimmune thrombocytopenia. Rev. Obstet. Gynecol. 6, e15–21. doi: 10.1097/AOG.0b013e31823403f4
Etchebest, C., Benros, C., Hazout, S., and de Brevern, A. G. (2005). A structural alphabet for local protein structures: improved prediction methods. Proteins 59, 810–827. doi: 10.1002/prot.20458
Eyal, E., Lum, G., and Bahar, I. (2015). The anisotropic network model web server at 2015 (ANM 2.0). Bioinformatics 31, 1487–1489. doi: 10.1093/bioinformatics/btu847
Ferrada, E., and Melo, F. (2009). Effective knowledge-based potentials. Protein Sci. 18, 1469–1485. doi: 10.1002/pro.166
Fetrow, J. S., Palumbo, M. J., and Berg, G. (1997). Patterns, structures, and amino acid frequencies in structural building blocks, a protein secondary structure classification scheme. Proteins 27, 249–271.
Fong, J. H., and Panchenko, A. R. (2010). Intrinsic disorder and protein multibinding in domain, terminal, and linker regions. Mol. Biosyst. 6, 1821–1828. doi: 10.1039/c005144f
Fornili, A., Pandini, A., Lu, H. C., and Fraternali, F. (2013). Specialized dynamical properties of promiscuous residues revealed by simulated conformational ensembles. J. Chem. Theory Comput. 9, 5127–5147. doi: 10.1021/ct400486p
Galzitskaya, O. V., Garbuzynskiy, S. O., and Lobanov, M. Y. (2006). FoldUnfold: web server for the prediction of disordered regions in protein chain. Bioinformatics 22, 2948–2949. doi: 10.1093/bioinformatics/btl504
Garvie, C. W., and Phillips, S. E. (2000). Direct and indirect readout in mutant Met repressor-operator complexes. Structure 8, 905–914. doi: 10.1016/S0969-2126(00)00182-9
Gelly, J. C., Joseph, A. P., Srinivasan, N., and de Brevern, A. G. (2011). iPBA: a tool for protein structure comparison using sequence alignment strategies. Nucleic Acids Res. 39, W18–W23. doi: 10.1093/nar/gkr333
George, J. N., Caen, J. P., and Nurden, A. T. (1990). Glanzmann's thrombasthenia: the spectrum of clinical disease. Blood 75, 1383–1395.
Goh, C. S., Milburn, D., and Gerstein, M. (2004). Conformational changes associated with protein-protein interactions. Curr. Opin. Struct. Biol. 14, 104–109. doi: 10.1016/j.sbi.2004.01.005
Grunberg, R., Leckner, J., and Nilges, M. (2004). Complementarity of structure ensembles in protein-protein binding. Structure 12, 2125–2136. doi: 10.1016/j.str.2004.09.014
Gu, Y., Rosenblatt, J., and Morgan, D. O. (1992). Cell cycle regulation of CDK2 activity by phosphorylation of Thr160 and Tyr15. EMBO J. 11, 3995–4005.
Guerra, C. A., Snow, R. W., and Hay, S. I. (2006). Mapping the global extent of malaria in 2005. Trends Parasitol. 22, 353–358. doi: 10.1016/j.pt.2006.06.006
Hirose, S., Yokota, K., Kuroda, Y., Wako, H., Endo, S., Kanai, S., et al. (2010). Prediction of protein motions from amino acid sequence and its application to protein-protein interaction. BMC Struct. Biol. 10:20. doi: 10.1186/1472-6807-10-20
Hirst, J. D., Glowacki, D. R., and Baaden, M. (2014). Molecular simulations and visualization: introduction and overview. Faraday Discuss. 169, 9–22. doi: 10.1039/C4FD90024C
Horne, K., and Woolley, I. J. (2009). Shedding light on DARC: the role of the Duffy antigen/receptor for chemokines in inflammation, infection and malignancy. Inflamm. Res. 58, 431–435. doi: 10.1007/s00011-009-0023-9
Huntington, J. A., Read, R. J., and Carrell, R. W. (2000). Structure of a serpin-protease complex shows inhibition by deformation. Nature 407, 923–926. doi: 10.1038/35038119
Hwang, H., Vreven, T., Whitfield, T. W., Wiehe, K., and Weng, Z. (2011). A machine learning approach for the prediction of protein surface loop flexibility. Proteins 79, 2467–2474. doi: 10.1002/prot.23070
Hynes, R. O. (2002). Integrins: bidirectional, allosteric signaling machines. Cell 110, 673–687. doi: 10.1016/S0092-8674(02)00971-6
Ihaka, R., and Gentleman, R. (1996). R: a language for data analysis and graphics. J. Comput. Graph. Stat. 5, 299–314. doi: 10.2307/1390807
Ishida, T., and Kinoshita, K. (2007). PrDOS: prediction of disordered protein regions from amino acid sequence. Nucleic Acids Res. 35, W460–W464. doi: 10.1093/nar/gkm363
Jallu, V., Bertrand, G., Bianchi, F., Chenet, C., Poulain, P., and Kaplan, C. (2013). The alphaIIb p.Leu841Met (Cab3(a+)) polymorphism results in a new human platelet alloantigen involved in neonatal alloimmune thrombocytopenia. Transfusion 53, 554–563. doi: 10.1111/j.1537-2995.2012.03762.x
Jallu, V., Dusseaux, M., Panzer, S., Torchet, M. F., Hezard, N., Goudemand, J., et al. (2010). AlphaIIbbeta3 integrin: new allelic variants in Glanzmann thrombasthenia, effects on ITGA2B and ITGB3 mRNA splicing, expression, and structure-function. Hum. Mutat. 31, 237–246. doi: 10.1002/humu.21179
Jallu, V., Poulain, P., Fuchs, P. F., Kaplan, C., and de Brevern, A. G. (2012). Modeling and molecular dynamics of HPA-1a and -1b polymorphisms: effects on the structure of the beta3 subunit of the alphaIIbbeta3 integrin. PLoS ONE 7:e47304. doi: 10.1371/journal.pone.0047304
Jallu, V., Poulain, P., Fuchs, P. F., Kaplan, C., and de Brevern, A. G. (2014). Modeling and molecular dynamics simulations of the V33 variant of the integrin subunit beta3: structural comparison with the L33 (HPA-1a) and P33 (HPA-1b) variants. Biochimie 105, 84–90. doi: 10.1016/j.biochi.2014.06.017
Janin, J., Bahadur, R. P., and Chakrabarti, P. (2008). Protein-protein interaction and quaternary structure. Q. Rev. Biophys. 41, 133–180. doi: 10.1017/S0033583508004708
Jin, Y., and Dunbrack, R. L. Jr. (2005). Assessment of disorder predictions in CASP6. Proteins 61(Suppl. 7), 167–175. doi: 10.1002/prot.20734
Jones, D. T., and Cozzetto, D. (2015). DISOPRED3: precise disordered region predictions with annotated protein-binding activity. Bioinformatics 31, 857–863. doi: 10.1093/bioinformatics/btu744
Jones, S., and Thornton, J. M. (1996). Principles of protein-protein interactions. Proc. Natl. Acad. Sci. U.S.A. 93, 13–20. doi: 10.1073/pnas.93.1.13
Joseph, A. P., Agarwal, G., Mahajan, S., Gelly, J. C., Swapna, L. S., Offmann, B., et al. (2010a). A short survey on protein blocks. Biophys. Rev. 2, 137–145. doi: 10.1007/s12551-010-0036-1
Joseph, A. P., Bornot, A., and de Brevern, A. G. (2010b). “Local structural alphabet,” in Protein Structure Methods and Algorithms, eds H. Rangwala and G. Karypis (Hoboken, NJ: Wiley), 75–106. doi: 10.1002/9780470882207.ch5
Joseph, A. P., and de Brevern, A. G. (2014). From local structure to a global framework: recognition of protein folds. J. R. Soc. Interface 11:20131147. doi: 10.1098/rsif.2013.1147
Joseph, A. P., Srinivasan, N., and de Brevern, A. G. (2012). Progressive structure-based alignment of homologous proteins: adopting sequence comparison strategies. Biochimie 94, 2025–2034. doi: 10.1016/j.biochi.2012.05.028
Kabsch, W., and Sander, C. (1983). Dictionary of protein secondary structure: pattern recognition of hydrogen-bonded and geometrical features. Biopolymers 22, 2577–2637. doi: 10.1002/bip.360221211
Karplus, P., and Schulz, G. (1985). Prediction of chain flexibility in proteins. A tool for the selection of peptide antigens. Naturwissenschaften 72, 212–213. doi: 10.1007/BF01195768
Kim, S., Woo, J., Seo, E. J., Yu, M., and Ryu, S. (2001). A 2.1 A resolution structure of an uncleaved alpha(1)-antitrypsin shows variability of the reactive center and other loops. J. Mol. Biol. 306, 109–119. doi: 10.1006/jmbi.2000.4357
Kolodny, R., Koehl, P., Guibas, L., and Levitt, M. (2002). Small libraries of protein fragments model native protein structures accurately. J. Mol. Biol. 323, 297–307. doi: 10.1016/S0022-2836(02)00942-7
Kuznetsov, I. B. (2008). Ordered conformational change in the protein backbone: prediction of conformationally variable positions from sequence and low-resolution structural data. Proteins 72, 74–87. doi: 10.1002/prot.21899
Kuznetsov, I. B., and McDuffie, M. (2008). FlexPred: a web-server for predicting residue positions involved in conformational switches in proteins. Bioinformation 3, 134–136. doi: 10.6026/97320630003134
Le, Q., Pollastri, G., and Koehl, P. (2009). Structural alphabets for protein structure classification: a comparison study. J. Mol. Biol. 387, 431–450. doi: 10.1016/j.jmb.2008.12.044
Lensink, M. F., and Mendez, R. (2008). Recognition-induced conformational changes in protein-protein docking. Curr. Pharm. Biotechnol. 9, 77–86. doi: 10.2174/138920108783955173
Leonard, S., Joseph, A. P., Srinivasan, N., Gelly, J. C., and de Brevern, A. G. (2014). mulPBA: an efficient multiple protein structure alignment method based on a structural alphabet. J. Biomol. Struct. Dyn. 32, 661–668. doi: 10.1080/07391102.2013.787026
Lindahl, E., Hess, B., and van der Spoel, D. (2001). GROMACS 3.0: A package for molecular simulation and trajectory analysis. J. Mol. Mod. 7, 306–317. doi: 10.1007/s008940100045
Linding, R., Jensen, L. J., Diella, F., Bork, P., Gibson, T. J., and Russell, R. B. (2003). Protein disorder prediction: implications for structural proteomics. Structure 11, 1453–1459. doi: 10.1016/j.str.2003.10.002
Liu, X. H., Hadley, T. J., Xu, L., Peiper, S. C., and Ray, P. E. (1999). Up-regulation of Duffy antigen receptor expression in children with renal disease. Kidney Int. 55, 1491–1500. doi: 10.1046/j.1523-1755.1999.00385.x
Lobanov, M. Y., Shoemaker, B. A., Garbuzynskiy, S. O., Fong, J. H., Panchenko, A. R., and Galzitskaya, O. V. (2010). ComSin: database of protein structures in bound (complex) and unbound (single) states in relation to their intrinsic disorder. Nucleic Acids Res. 38, D283–D287. doi: 10.1093/nar/gkp963
Luo, X., Lv, F., Pan, Y., Kong, X., Li, Y., and Yang, Q. (2011). Structure-based prediction of the mobility and disorder of water molecules at protein-DNA interface. Protein Pept. Lett. 18, 203–209. doi: 10.2174/092986611794475066
Mamonova, T. B., Glyakina, A. V., Kurnikova, M. G., and Galzitskaya, O. V. (2010). Flexibility and mobility in mesophilic and thermophilic homologous proteins from molecular dynamics and FoldUnfold method. J. Bioinform. Comput. Biol. 8, 377–394. doi: 10.1142/S0219720010004690
Marsh, J. A. (2013). Buried and accessible surface area control intrinsic protein flexibility. J. Mol. Biol. 425, 3250–3263. doi: 10.1016/j.jmb.2013.06.019
Matlock, M. K., Holehouse, A. S., and Naegle, K. M. (2015). ProteomeScout: a repository and analysis resource for post-translational modifications and proteins. Nucleic Acids Res. 43, D521–D530. doi: 10.1093/nar/gku1154
Meszaros, B., Simon, I., and Dosztanyi, Z. (2011). The expanding view of protein-protein interactions: complexes involving intrinsically disordered proteins. Phys. Biol. 8:035003. doi: 10.1088/1478-3975/8/3/035003
Micheletti, C., Seno, F., and Maritan, A. (2000). Recurrent oligomers in proteins: an optimal scheme reconciling accurate and concise backbone representations in automated folding and design studies. Proteins 40, 662–674. doi: 10.1002/1097-0134(20000901)40:4<662::AID-PROT90>3.0.CO;2-F
Miller, L. H., Mason, S. J., Clyde, D. F., and McGinniss, M. H. (1976). The resistance factor to Plasmodium vivax in blacks. The Duffy-blood-group genotype, FyFy. N. Engl. J. Med. 295, 302–304. doi: 10.1056/NEJM197608052950602
Miller, L. H., Mason, S. J., Dvorak, J. A., McGinniss, M. H., and Rothman, I. K. (1975). Erythrocyte receptors for (Plasmodium knowlesi) malaria: Duffy blood group determinants. Science 189, 561–563. doi: 10.1126/science.1145213
Misaghi, S., Galardy, P. J., Meester, W. J., Ovaa, H., Ploegh, H. L., and Gaudet, R. (2005). Structure of the ubiquitin hydrolase UCH-L3 complexed with a suicide substrate. J. Biol. Chem. 280, 1512–1520. doi: 10.1074/jbc.M410770200
Nussinov, R., Tsai, C. J., Xin, F., and Radivojac, P. (2012). Allosteric post-translational modification codes. Trends Biochem. Sci. 37, 447–455. doi: 10.1016/j.tibs.2012.07.001
Offmann, B., Tyagi, M., and de Brevern, A. G. (2007). Local protein structures. Curr. Bioinform. 3, 165–202. doi: 10.2174/157489307781662105
Olsson, S., Vögeli, B., Cavalli, A., Boomsma, W., Ferkinghoff-Borg, J., Lindorff-Larsen, K., et al. (2014). Probabilistic determination of native state ensembles of proteins. J. Chem. Theory Comput. 10, 3484–3491. doi: 10.1021/ct5001236
Otterbein, L. R., Cosio, C., Graceffa, P., and Dominguez, R. (2002). Crystal structures of the vitamin D-binding protein and its complex with actin: structural basis of the actin-scavenger system. Proc. Natl. Acad. Sci. U.S.A. 99, 8003–8008. doi: 10.1073/pnas.122126299
Palmer, A. G. 3rd. (2001). Nmr probes of molecular dynamics: overview and comparison with other techniques. Annu. Rev. Biophys. Biomol. Struct. 30, 129–155. doi: 10.1146/annurev.biophys.30.1.129
Pan, X. Y., and Shen, H. B. (2009). Robust prediction of B-factor profile from sequence using two-stage SVR based on random forest feature selection. Protein Pept. Lett. 16, 1447–1454. doi: 10.2174/092986609789839250
Pandini, A., Fornili, A., Fraternali, F., and Kleinjung, J. (2012). Detection of allosteric signal transmission by information-theoretic analysis of protein dynamics. FASEB J. 26, 868–881. doi: 10.1096/fj.11-190868
Pandini, A., Fornili, A., Fraternali, F., and Kleinjung, J. (2013). GSATools: analysis of allosteric communication and functional local motions using a structural alphabet. Bioinformatics 29, 2053–2055. doi: 10.1093/bioinformatics/btt326
Pandini, A., Fornili, A., and Kleinjung, J. (2010). Structural alphabets derived from attractors in conformational space. BMC Bioinformatics 11:97. doi: 10.1186/1471-2105-11-97
Park, B. H., and Levitt, M. (1995). The complexity and accuracy of discrete state models of protein structure. J. Mol. Biol. 249, 493–507. doi: 10.1006/jmbi.1995.0311
Powers, R., Clore, G., Garrett, D., and Gronenborn, A. (1993). Relationships between the precision of high-resolution protein NMR structures, solution-order parameters, and crystallographic B factors. J. Magn. Reson. B 101, 325–327. doi: 10.1006/jmrb.1993.1051
Python Software Foundation. (2015). Python Language Reference, Version 2.7. Available online at: http://www.python.org
Rangwala, H., Kauffman, C., and Karypis, G. (2009). svmPRAT: SVM-based protein residue annotation toolkit. BMC Bioinformatics 10:439. doi: 10.1186/1471-2105-10-439
Richardson, J. S. (1981). The anatomy and taxonomy of protein structure. Adv. Protein Chem. 34, 167–339. doi: 10.1016/S0065-3233(08)60520-3
Russo, D., Teixeira, J., Kneller, L., Copley, J. R., Ollivier, J., Perticaroli, S., et al. (2011). Vibrational density of states of hydration water at biomolecular sites: hydrophobicity promotes low density amorphous ice behavior. J. Am. Chem. Soc. 133, 4882–4888. doi: 10.1021/ja109610f
Salwinski, L., Miller, C. S., Smith, A. J., Pettit, F. K., Bowie, J. U., and Eisenberg, D. (2004). The database of interacting proteins: 2004 update. Nucleic Acids Res. 32, D449–D451. doi: 10.1093/nar/gkh086
Schlessinger, A., Punta, M., Yachdav, G., Kajan, L., and Rost, B. (2009). Improved disorder prediction by combination of orthogonal approaches. PLoS ONE 4:e4433. doi: 10.1371/journal.pone.0004433
Schlessinger, A., and Rost, B. (2005). Protein flexibility and rigidity predicted from sequence. Proteins 61, 115–126. doi: 10.1002/prot.20587
Schlessinger, A., Yachdav, G., and Rost, B. (2006). PROFbval: predict flexible and rigid residues in proteins. Bioinformatics 22, 891–893. doi: 10.1093/bioinformatics/btl032
Schneider, B., Gelly, J. C., de Brevern, A. G., and Cerny, J. (2014). Local dynamics of proteins and DNA evaluated from crystallographic B factors. Acta Crystallogr. D Biol. Crystallogr. 70(Pt 9), 2413–2419. doi: 10.1107/S1399004714014631
Schuchhardt, J., Schneider, G., Reichelt, J., Schomburg, D., and Wrede, P. (1996). Local structural motifs of protein backbones are classified by self-organizing neural networks. Protein Eng. 9, 833–842. doi: 10.1093/protein/9.10.833
Schwede, T., Sali, A., Honig, B., Levitt, M., Berman, H. M., Jones, D., et al. (2009). Outcome of a workshop on applications of protein models in biomedical research. Structure 17, 151–159. doi: 10.1016/j.str.2008.12.014
Scott, W. R., and Straus, S. K. (2015). Determining and visualizing flexibility in protein structures. Proteins 83, 820–826. doi: 10.1002/prot.24776
Smolarek, D., Bertrand, O., Czerwinski, M., Colin, Y., Etchebest, C., and de Brevern, A. G. (2010). Multiple interests in structural models of DARC transmembrane protein. Transfus. Clin. Biol. 17, 184–196. doi: 10.1016/j.tracli.2010.05.003
Suhre, K., and Sanejouand, Y. H. (2004). ElNemo: a normal mode web server for protein movement analysis and the generation of templates for molecular replacement. Nucleic Acids Res. 32, W610–W614. doi: 10.1093/nar/gkh368
Sunami, T., and Kono, H. (2013). Local conformational changes in the DNA interfaces of proteins. PLoS ONE 8:e56080. doi: 10.1371/journal.pone.0056080
Suresh, V., Ganesan, K., and Parthasarathy, S. (2013). A protein block based fold recognition method for the annotation of twilight zone sequences. Protein Pept. Lett. 20, 249–254. doi: 10.2174/092986613804910617
Svozil, D., Kalina, J., Omelka, M., and Schneider, B. (2008). DNA conformations and their sequence preferences. Nucleic Acids Res. 36, 3690–3706. doi: 10.1093/nar/gkn260
Swapna, L. S., Mahajan, S., de Brevern, A. G., and Srinivasan, N. (2012). Comparison of tertiary structures of proteins in protein-protein complexes with unbound forms suggests prevalence of allostery in signalling proteins. BMC Struct. Biol. 12:6. doi: 10.1186/1472-6807-12-6
Takada, Y., Ye, X., and Simon, S. (2007). The integrins. Genome Biol. 8:215. doi: 10.1186/gb-2007-8-5-215
Tanaka, Y., Nureki, O., Kurumizaka, H., Fukai, S., Kawaguchi, S., Ikuta, M., et al. (2001). Crystal structure of the CENP-B protein-DNA complex: the DNA-binding domains of CENP-B induce kinks in the CENP-B box DNA. EMBO J. 20, 6612–6618. doi: 10.1093/emboj/20.23.6612
Tiwari, S. P., Fuglebakk, E., Hollup, S. M., Skjaerven, L., Cragnolini, T., Grindhaug, S. H., et al. (2014). WEBnm@ v2.0: Web Server and Services for Comparing Protein Flexibility. BMC Bioinformatics 15:6597. doi: 10.1186/s12859-014-0427-6
Tournamille, C., Filipe, A., Badaut, C., Riottot, M. M., Longacre, S., Cartron, J. P., et al. (2005). Fine mapping of the Duffy antigen binding site for the Plasmodium vivax Duffy-binding protein. Mol. Biochem. Parasitol. 144, 100–103. doi: 10.1016/j.molbiopara.2005.04.016
Tournamille, C., Filipe, A., Wasniowska, K., Gane, P., Lisowska, E., Cartron, J. P., et al. (2003). Structure-function analysis of the extracellular domains of the Duffy antigen/receptor for chemokines: characterization of antibody and chemokine binding sites. Br. J. Haematol. 122, 1014–1023. doi: 10.1046/j.1365-2141.2003.04533.x
Touw, W. G., and Vriend, G. (2014). BDB: databank of PDB files with consistent B-factors. Protein Eng. Des. Sel. 27, 457–462. doi: 10.1093/protein/gzu044
Trott, O., Siggers, K., Rost, B., and Palmer, A. G. 3rd. (2008). Protein conformational flexibility prediction using machine learning. J. Magn. Reson. 192, 37–47. doi: 10.1016/j.jmr.2008.01.011
Tung, C. H., Huang, J. W., and Yang, J. M. (2007). Kappa-alpha plot derived structural alphabet and BLOSUM-like substitution matrix for fast protein structure database search. Genome Biol. 8:R31. doi: 10.1186/gb-2007-8-3-r31
Tung, C. H., and Yang, J. M. (2007). fastSCOP: a fast web server for recognizing protein structural domains and SCOP superfamilies. Nucleic Acids Res. 35, W438–W443. doi: 10.1093/nar/gkm288
Tyagi, M., Benros, C., Martin, J., and de Brevern, A. G. (2007). “Description of the local protein structure II. Novel approaches,” in Recent Research Developments in Protein Engineering, ed A. G. de Brevern (Trivandrum: Research Signpost), 23–36.
Uhart, M., and Bustos, D. M. (2014). Protein intrinsic disorder and network connectivity. The case of 14-3-3 proteins. Front. Genet. 5:10. doi: 10.3389/fgene.2014.00010
Unger, R., Harel, D., Wherland, S., and Sussman, J. L. (1989). A 3D building blocks approach to analyzing and predicting structure of proteins. Proteins 5, 355–373. doi: 10.1002/prot.340050410
Uversky, V. N., Gillespie, J. R., and Fink, A. L. (2000). Why are “natively unfolded” proteins unstructured under physiologic conditions? Proteins 41, 415–427. doi: 10.1002/1097-0134(20001115)41:3<415::AID-PROT130>3.0.CO;2-7
Van Der Spoel, D., Lindahl, E., Hess, B., Groenhof, G., Mark, A. E., and Berendsen, H. J. (2005). GROMACS: fast, flexible, and free. J. Comput. Chem. 26, 1701–1718. doi: 10.1002/jcc.20291
Vihinen, M., Torkkila, E., and Riikonen, P. (1994). Accuracy of protein flexibility predictions. Proteins 19, 141–149. doi: 10.1002/prot.340190207
Wu, C. Y., Chen, Y. C., and Lim, C. (2010). A structural-alphabet-based strategy for finding structural motifs across protein families. Nucleic Acids Res. 38:e150. doi: 10.1093/nar/gkq478
Xiao, T., Takagi, J., Coller, B. S., Wang, J. H., and Springer, T. A. (2004). Structural basis for allostery in integrins and binding to fibrinogen-mimetic therapeutics. Nature 432, 59–67. doi: 10.1038/nature02976
Xin, F., and Radivojac, P. (2012). Post-translational modifications induce significant yet not extreme changes to protein structure. Bioinformatics 28, 2905–2913. doi: 10.1093/bioinformatics/bts541
Xue, B., and Uversky, V. N. (2014). Intrinsic disorder in proteins involved in the innate antiviral immunity: another flexible side of a molecular arms race. J. Mol. Biol. 426, 1322–1350. doi: 10.1016/j.jmb.2013.10.030
Yang, J. M., and Tung, C. H. (2006). Protein structure database search and evolutionary classification. Nucleic Acids Res. 34, 3646–3659. doi: 10.1093/nar/gkl395
Zhang, H., and Kurgan, L. (2014). Improved prediction of residue flexibility by embedding optimized amino acid grouping into RSA-based linear models. Amino Acids 46, 2665–2680. doi: 10.1007/s00726-014-1817-9
Zhang, T., Faraggi, E., and Zhou, Y. (2010). Fluctuations of backbone torsion angles obtained from NMR-determined structures and their prediction. Proteins 78, 3353–3362. doi: 10.1002/prot.22842
Zhang, Y., Stec, B., and Godzik, A. (2007). Between order and disorder in protein structures: analysis of “dual personality” fragments in proteins. Structure 15, 1141–1147. doi: 10.1016/j.str.2007.07.012
Zhu, J., Luo, B. H., Xiao, T., Zhang, C., Nishida, N., and Springer, T. A. (2008). Structure of a complete integrin ectodomain in a physiologic resting state and activation and deactivation by applied forces. Mol. Cell 32, 849–861. doi: 10.1016/j.molcel.2008.11.018
Keywords: protein structures, disorder, secondary structure, structural alphabet, protein folding, allostery, protein complexes, protein—DNA interactions
Citation: Craveur P, Joseph AP, Esque J, Narwani TJ, Noël F, Shinada N, Goguet M, Leonard S, Poulain P, Bertrand O, Faure G, Rebehmed J, Ghozlane A, Swapna LS, Bhaskara RM, Barnoud J, Téletchéa S, Jallu V, Cerny J, Schneider B, Etchebest C, Srinivasan N, Gelly J-C and de Brevern AG (2015) Protein flexibility in the light of structural alphabets. Front. Mol. Biosci. 2:20. doi: 10.3389/fmolb.2015.00020
Received: 28 February 2015; Accepted: 30 April 2015;
Published: 27 May 2015.
Edited by:
Kris Pauwels, Vrije Universiteit Brussel, BelgiumCopyright © 2015 Craveur, Joseph, Esque, Narwani, Noël, Shinada, Goguet, Leonard, Poulain, Bertrand, Faure, Rebehmed, Ghozlane, Swapna, Bhaskara, Barnoud, Téletchéa, Jallu, Cerny, Schneider, Etchebest, Srinivasan, Gelly and de Brevern. This is an open-access article distributed under the terms of the Creative Commons Attribution License (CC BY). The use, distribution or reproduction in other forums is permitted, provided the original author(s) or licensor are credited and that the original publication in this journal is cited, in accordance with accepted academic practice. No use, distribution or reproduction is permitted which does not comply with these terms.
*Correspondence: Alexandre G. de Brevern, Institut National de la Santé et de la Recherche Médicale U 1134, 6 Rue Alexandre Cabanel, 75015 Paris, France, alexandre.debrevern@univ-paris-diderot.fr