Using network science to evaluate exercise-associated brain changes in older adults
- 1 Department of Radiology, Laboratory for Complex Brain Networks, Wake Forest University Health Sciences, Winston-Salem, NC, USA
- 2 Division of Public Health Sciences, Wake Forest University Health Sciences, Winston-Salem, NC, USA
- 3 Department of Biomedical Engineering, Wake Forest University Health Sciences, Winston-Salem, NC, USA
- 4 Neuroscience Program, Wake Forest University Health Sciences, Winston-Salem, NC, USA
- 5 Department of Psychology, Wake Forest University, Winston-Salem, NC, USA
- 6 Department of Health and Exercise Science, Wake Forest University, Winston-Salem, NC, USA
Literature has shown that exercise is beneficial for cognitive function in older adults and that aerobic fitness is associated with increased hippocampal tissue and blood volumes. The current study used novel network science methods to shed light on the neurophysiological implications of exercise-induced changes in the hippocampus of older adults. Participants represented a volunteer subgroup of older adults that were part of either the exercise training (ET) or healthy aging educational control (HAC) treatment arms from the Seniors Health and Activity Research Program Pilot (SHARP-P) trial. Following the 4-month interventions, MRI measures of resting brain blood flow and connectivity were performed. The ET group’s hippocampal cerebral blood flow (CBF) exhibited statistically significant increases compared to the HAC group. Novel whole-brain network connectivity analyses showed greater connectivity in the hippocampi of the ET participants compared to HAC. Furthermore, the hippocampus was consistently shown to be within the same network neighborhood (module) as the anterior cingulate cortex only within the ET group. Thus, within the ET group, the hippocampus and anterior cingulate were highly interconnected and localized to the same network neighborhood. This project shows the power of network science to investigate potential mechanisms for exercise-induced benefits to the brain in older adults. We show a link between neurological network features and CBF, and it is possible that this alteration of functional brain networks may lead to the known improvement in cognitive function among older adults following exercise.
Introduction
We propose that studying the brain as an integrated network using techniques developed in the field of network science may inform our understanding of the physiological effects of exercise on cerebral function in older adults. Network science is a burgeoning field of scientific inquiry that has been used to better understand complex integrated systems, such as social networks, the US power grid, and gene interactions (Watts and Strogatz, 1998 ; Barabasi and Albert, 1999 ). More recently, this methodology has been applied to study the functional and structural connectivity of the human brain and is shedding new light on how the brain works as a system (Bullmore and Sporns, 2009 ). We know that the brain demonstrates properties of complex network systems, such as small-world characteristics (Sporns and Zwi, 2004 ), hubs (Hagmann et al., 2008 ), and modularity (Schwarz et al., 2008 ; Meunier et al., 2009 ), but the effects of exercise on brain networks is unknown.
A growing body of literature has shown that exercise is beneficial for cognitive function in healthy older adults (Colcombe and Kramer, 2003 ; Erickson and Kramer, 2009 ). Exercise appears to facilitate neuroprotection and neuroplasticity (Stranahan et al., 2009 ), while improving physical and cognitive function (Hillman et al., 2008 ). Evidence also indicates that the exercise-induced improvements in cognitive function are associated with increased gray matter volume (Colcombe et al., 2003 , 2006 ). Recently, it has been shown that aerobic fitness is associated with increased hippocampal volumes (Erickson et al., 2009 ) and improved brain blood flow (Swain et al., 2003 ; Pereira et al., 2007 ), findings that are particularly important considering the role of the hippocampus in memory processing. In addition to the observed structural changes in the brain, research indicates that exercise can alter brain activity associated with cognitive tasks (Colcombe et al., 2004 ) and functional connectivity (Voss et al., 2010 ). Here, we argue that using network science techniques to study the brain as an integrated network can begin to elucidate the mechanisms underlying the known hippocampal changes associated with exercise.
These network science techniques can determine whole-brain summary network metrics, which describe various global brain network properties, such as global clustering or network-wide average path length. In fact, summary metrics extracted from whole-brain networks can exhibit changes in various study populations, including aging (Micheloyannis et al., 2006 ; Stam et al., 2007 ; He et al., 2008 ; Supekar et al., 2008 ). However, such changes are insensitive to the regional specificity of the human brain. Our belief is that network metrics are best evaluated at the local/regional level within the context of a whole-brain network. As such, and given the converging evidence implicating the hippocampus as a crucial brain region in exercise research on older adults, the current study focuses on exercise-associated hippocampal connectivity within the whole-brain network. In a cross-sectional study, Erickson et al. (2009) found larger hippocampal volume in older adults who had higher levels of aerobic fitness and reported that the larger volume was related to better memory. It has also been shown that cerebral blood volume is increased in the hippocampus of exercising adults (Pereira et al., 2007 ), and a recent study reported an association between increased cerebral blood flow (CBF) to the hippocampus and superior memory performance in older adults (Heo et al., 2010 ). Mindful of the aforementioned data, the current study used novel network science methods to shed light on the neurophysiological underpinnings of changes in hippocampal perfusion that is associated with exercise. We predicted that exercise would be associated with greater CBF in the hippocampus and that these changes would be associated with changes in the brain network metrics.
Materials and Methods
Participants
Participants in this study represented a volunteer subgroup of older adults that were part of either the exercise or control treatment arms from the Seniors Health and Activity Research Program Pilot trial (SHARP-P). SHARP-P was a single-blinded pilot randomized controlled trial that involved 4 months of treatment and four different treatment groups: exercise training (ET), cognitive training (CT), a combined treatment of ET and CT, and a healthy aging educational control (HAC) group. Note that the HAC group is not implied to be “healthy agers;” rather, they participated in a healthy aging education program. SHARP-P targeted the enrollment of 80 community-dwelling persons, who were at risk for cognitive decline by being aged 70–85 years and had self-reported memory loss. The findings reported here focus on six volunteer participants in the ET group and five volunteers from HAC group that agreed to participate and met standard safety criteria for a scanning sub-study.
Inclusion/exclusion criteria were selected to identify individuals who were appropriate candidates for physical activity and CT, who did not have neurological conditions or current medications likely to affect cognitive functioning, and who appeared likely to adhere to study protocols (see Espeland et al., 2010 ). Exclusion criteria related to physical activity included (1) severe rheumatologic, pulmonary, or orthopedic diseases, (2) actively participating in a formal exercise program within the past month (defined as >30 min/week), (3) severe cardiac disease, including NYHA Class III or IV congestive heart failure, (4) receiving physical therapy for gait, balance, or other lower extremity training, (5) myocardial infarction, CABG, or valve replacement within past 6 months, (6) serious conduction disorder (e.g., third degree heart block), uncontrolled arrhythmia, pulmonary embolism or deep venous thrombosis within past 6 months, (7) hip fracture, hip or knee replacement, or spinal surgery within past 4 months, and (8) severe hypertension. Exclusion criteria related to cognition included (1) neurologic diseases (stroke, Alzheimer’s disease/dementia, Parkinson’s, MS, ALS, or prior diagnosis of MCI), (2) TICS 2 standard deviations below normal on memory or non-memory domain tests, (3) other significant factors that may affect the ability for CT (e.g., head trauma), and (4) baseline Geriatric Depression Scale score ≥8. Exclusion criteria related to trial design or adherence included (1) age >85 years, (2) unwillingness to be randomized to treatment, (3) failure to provide the name of a personal physician, (4) living in a nursing home, (5) terminal illness with life expectancy less than 8 months, (6) unable to communicate because of severe hearing loss or speech disorder, (7) severe visual impairment, (8) excessive alcohol use (>14 drinks per week), (9) member of household is already enrolled, (10) planning to move out of the area in the next year, (11) other temporary intervening events, such as sick spouse, bereavement, or recent move, participation in another intervention trial, inability to commit to intervention schedule requirements, and (12) failure to provide informed consent. All study participants signed an Informed Consent document for this study, which was approved by the Wake Forest University Institutional Review Board.
Exercise Training and Healthy aging Education Control
ET consisted of center-based training sessions and home-based sessions with a focus on aerobic exercise and with a targeted duration of 150 min/week. It included two center and two home-based training sessions per week for 4 months. Participants came to the center twice each week with a 40-min stimulus phase (80 min/week). Ratings of perceived exertion (RPE) were used to regulate the intensity of the intervention as was done in the LIFE-P study (Pahor et al., 2006 ). The exercise intensity was conducted at an RPE of from 12 to 14 (Borg’s 6–20 scale) (Borg and Kaijser, 2006 ). We used RPE rather than heart rate when regulating exercise intensity in older adults based on our prior experience in the LIFE-P study (Pahor et al., 2006 ). The primary focus of the intervention was walking with the explicit intent of improving cardiovascular fitness. Other forms of endurance activity (e.g., stationary cycling) were used when regular walking was contraindicated for medical or behavioral reasons. Individualized participant programs were tailored to optimize safety utilizing supervised center-based contacts in a safe and effective manner. Participants were encouraged to slowly increase the duration and speed of home-based walking sessions as appropriate to their circumstances, and to add a third home-based walking session when possible.
The HAC arm combined health education-based lectures with light stretching. Participants were encouraged to take charge of their health and learn to seek out appropriate medical services and information. Topics such as medications, foot care, traveling, and nutrition were covered. Sessions lasted approximately 60 min; these sessions were scheduled weekly for the first 3 months and monthly thereafter.
MRI Scanning Procedures
All scans were conducted as post-treatment only and were performed on a 1.5 T GE scanner using an 8-channel head coil (GE Medical Systems, Milwaukee, WI, USA) and included anatomic imaging (3D BRAVO), perfusion imaging (PASL Q2TIPS, TR3000, voxel size 3.75 mm × 3.75 mm × 8 mm), and resting fMRI [echo planar imaging (EPI), TR2000, voxel size 3.75 mm × 3.75 mm × 5 mm], as detailed below. All scans were completed within 1-month after the interventions had been completed. To prevent problems that might have occurred due to deconditioning, participants in the ET group continued to exercise after completion of ET training until they were able to complete the scanning protocol.
Cerebral blood flow measurements
Non-invasive multi-slice quantitative CBF was measured with quantitative imaging of perfusion using a single subtraction with thin slice TI1 periodic saturation (QUIPSS II TIPS a.k.a. Q2TIPS, Luh et al., 1999 ) with a flow-sensitive alternating inversion recovery (FAIR, Kim and Tsekos, 1997 ). In our implementation of Q2TIPS, saturation pulses were very selective suppression (VSS) radio frequency pulses (Tran et al., 2000 ), which were applied every 25 ms between 800 ms (TI1) and 1200 ms (TI1s) and which saturated a 2-cm slab of tissue with a 1-cm gap between the saturation slab and the first imaging slice. Other imaging parameters were as follows: TE 28 ms, TI1 800 ms, TI1s 1200 ms, TI 2000 ms, TR 3000 ms, receiver bandwidth 62.5 kHz, flip angle 90°, FOV 24 cm (frequency) × 18 cm (phase), an acquisition matrix 64 × 48 (11 slices, 8 mm thickness, 0 mm slice gap), and frequency encoding direction anterior/posterior. A diffusion gradient with an equivalent b value of 5.25 s/mm2 was added to suppress intra-arterial spins (Yang et al., 1998 ). An inversion time of 2000 ms was used for both groups.
Q2TIPS-FAIR acquired data in label/control (slice selective inversion/global inversion) pairs. We acquired 60 label/control pairs to obtain perfusion weighted images with good signal-to-noise ratio in a time of 6 min 30 s. The first 30 s (10 volumes) was used to establish steady state and to acquiring a proton density (M0) image. The M0 image served as an internal reference to scale the perfusion weighted images appropriately to obtain quantitative CBF maps.
Quantitative CBF maps require that the T1 of the tissue be measured at each voxel. T1 maps were calculated from data acquired from a separate inversion recovery (IR) EPI experiment. Twelve inversion times were acquired logarithmically from 10 ms to 6 s with a TR of 10 s. A total of 13 imaging volumes were acquired in a total scan time of 2 min and 10 s. All other imaging acquisition parameters (FOV, matrix size, TE, flip angle, slice thickness, and slice location, etc) were identical to the Q2TIPS-FAIR protocol described previously.
Resting fMRI
Whole-brain activation was assessed with the BOLD signal by measuring changes in the T2*-relaxation rate that accompany changes in blood oxygenation during cortical activation. The images were collected parallel to the anterior commissure–posterior commissure (AC–PC) line. Functional imaging was performed using multi-slice gradient-EPI (TR = 2000 ms; TE = 40 ms; field of view = 24 cm (frequency) × 15 cm (phase); matrix size = 96 × 86, 40 slices, 5 mm thickness, no skip; voxel resolution = 3.75 mm × 3.75 mm × 5 mm. The subjects performed no task but were asked to keep their eyes open for the 6 min 20 s resting fMRI scan.
Data Processing
Cerebral blood flow: perfusion imaging preprocessing
Prior to statistical analyses, perfusion data were processed using the following algorithms (Wong et al., 1998 ). Motion correction was applied to the perfusion weighted volumes with a six-parameter rigid body transformation using SPM5. After motion correction the difference images were averaged together, and quantitative perfusion maps were calculated from the equation:
where CBF is the cerebral blood flow, ΔM(TI2) is the mean difference in the signal intensity between the label and control images, M0,blood is the equilibrium magnetization of blood, α is the tagging efficiency, TI1 is the time duration of the tagging bolus, TI2 is the inversion time of each slice, and T1,blood is the longitudinal relaxation time of blood, qp is a correction factor that accounts for the difference between the T1 of blood and the T1 of brain tissue. The M0,blood was approximated from the M0, white matter, which was measured directly from the M0 image acquired with the perfusion weighted images. The correction factor, qp, required that the T1 of the brain tissue be measured at each voxel, which was measured with a separate IR EPI experiment. All other parameters are known or assumed to be a constant (TI1 = 800 ms, TI1S = 1200 ms, T1,blood = 1200 ms ). These maps measured perfusion in standard units of milliliters per 100 g of tissue per minute.
Networks
We evaluated whole-brain functional connectivity using graph theory methods on a voxel-by-voxel basis. In brief, the first step generated a whole-brain connectivity matrix, or adjacency matrix (Aij) for each subject. This is a binary n × n matrix, where n = the number of brain voxels with each voxel representing a network node (∼15,000 in this data). The matrix notes the presence or absence of a connection between any two nodes (i and j). The adjacency matrix serves as the basis for most of the network analyses. For the resting fMRI data, the determination of a connection between i and j was performed using a time-series regression analysis on spatially normalized brain images. To account for physiological noise associated with cardiac, respiratory and cerebrospinal fluid (CSF) changes, the fMRI time series was first band-pass filtered (0.009–0.08 Hz). The full regression analysis was then performed including motion parameters, as well as mean global, white matter, and CSF as covariate of no interests to further correct for physiological noise. This produced a cross-correlation matrix that contains the partial correlation coefficient representing the connectivity between each and every network node. A threshold was then set to dichotomize the data, resulting in the binary adjacency matrix (Aij). In order to compare data across people, it was necessary to generate comparable networks. Therefore, the network was defined so that the relationship between the number of nodes N and the average node degree K was the same across different subjects. In particular, the network was defined so that S = log(N)/log(K) was the same across subjects, with S = 2.5. This relationship was based on the path length of a random network with N nodes and average degree K (Stam et al., 2007 ; Supekar et al., 2008 ), and can be re-written as N = KS.
Network measurements
Once the complete adjacency matrix was generated for each subject, the typically calculated characteristic network attributes were determined. These network metrics allowed us to identify global and local changes in network topology for both study groups based on functional networks. It has repeatedly been demonstrated that the brain exhibits small-world connectivity with regional specialization as manifested by high local clustering and distributed information processing possible through short path lengths (Bullmore and Sporns, 2009 ). We evaluated the following network properties (see Bullmore and Sporns, 2009 for a review); (1) Degree (K): A measure of connectivity of each node. This metric is simply the number of edges connected to each node. The nodes that are ranked in the top 10–20% of the degree distribution for the network are typically considered hubs. Hub regions are critical for network integrity, and damage to these regions can dramatically alter information processing throughout the network (Sporns et al., 2007 ). (2) Global Efficiency (Eglob): A measure of the closeness of an individual node to all other nodes. This metric is the reciprocal of the average shortest path length from one node to all other nodes and identifies nodes that can be particularly influential in a network (Latora and Marchiori, 2001 ). Reductions in global efficiency impair distribution of information across the network and can occur with loss of long-range connections. This measure is scaled so that it ranges between 0 (no long distance information processing) and 1 (maximal distributed processing). (3) Local Efficiency (Eloc): A measure of the closeness of the neighbors of an individual node and is related to clustering. This metric is the reciprocal of the average shortest path length of the neighbors of a node (Latora and Marchiori, 2001 ). In other words, how interconnected are the neighbors of a node. For a given node it is the average of the efficiencies of the local sub-graphs of the neighbor nodes. This measure is also scaled so that it ranges between 0 (no local connections) and 1 (all connections are local). (4) Network Modularity: Network modularity is a measure of community structure and was used to identify communities of nodes that were more connected to each other than they are to nodes in other communities (Newman and Girvan, 2004 ). Population based overlap maps were generated for several metrics by first identifying voxels of interest (e.g., top 15% of all connected voxels). The maps were then thresholded to make binary images containing only the voxels of interest. The binary maps from all subjects in a group were summed to identify overlapping common voxels across subjects. The overlap maps were converted to percent overlap for presentation purposes.
Statistical Analyses
All imaging analyses were performed using SPM 5 or the network analysis techniques developed in our laboratory using Matlab. All imaging data were normalized to standard space within SPM. Region-based analyses of the hippocampus were completed using a region-of-interest (ROI) encompassing the hippocampus and parahippocampal gyrus from the International Consortium of Brain Mapping (ICBM) atlas using the WFU PickAtlas (Maldjian et al., 2003 ). This hippocampal ROI encompassed 174 voxels and amounted to approximately 14 ml in each hemisphere. All group comparisons were performed using two-sample t-tests.
Results
Participant characteristics and treatment fidelity
Table 1 provides a comparison of the two groups on selected demographic, biometric, cognitive, and comorbid conditions. There were no meaningful between group differences on these variables nor did the 11 participants who participated in MR scanning differ on any variable from the overall SHARP-P sample (p > 0.05). The mean attendance to scheduled sessions was excellent: 90.63% with no one below 85%. In addition, each participant was asked to exercise at home three times each week. The average adherence to this phase of the intervention was 2.9 times/week, and on average total time exercised at home was 78.5 min/week.
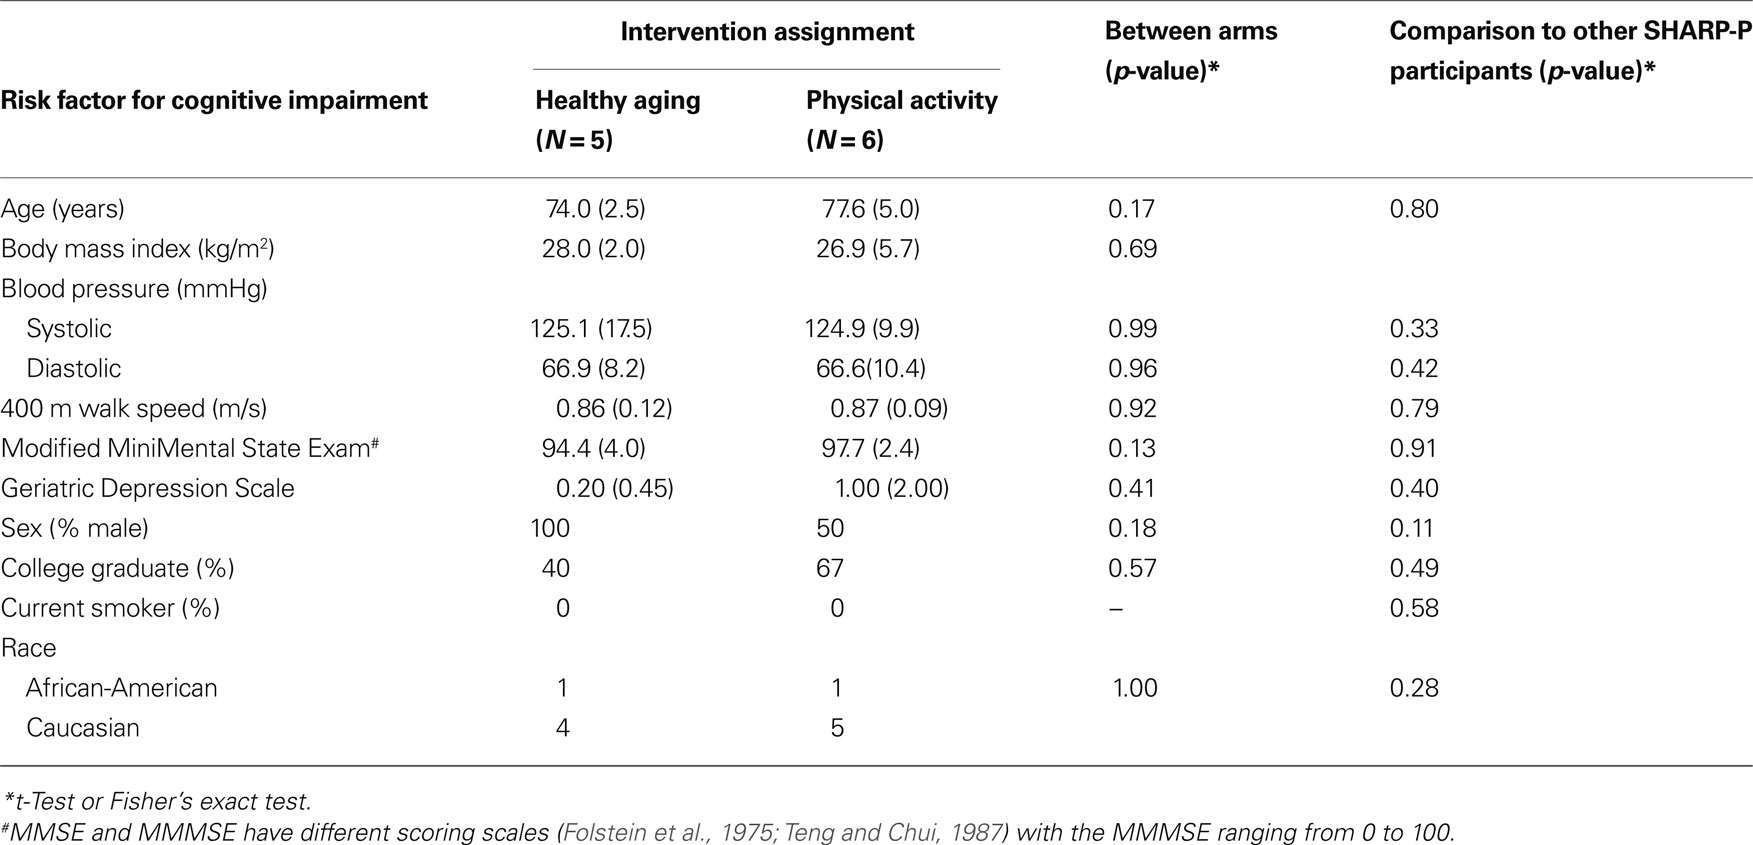
Table 1. Distribution of risk factors for cognitive impairment at baseline for individuals grouped by intervention assignment.
Cerebral Blood Flow
Based on the converging evidence of the hippocampus being directly affected by exercise in the elderly, we performed a ROI analysis of the hippocampus comparing the ET and HAC groups. Using mean values within the ROI (see Figure 1 ), the ET group’s hippocampal CBF (54 ml/100 g/min) was statistically higher (p < 0.0002) than the HAC group’s hippocampal CBF (38 ml/100 g/min). Note that the hatched bars in Figure 1 represent the hippocampal perfusion in each subject. The data clearly demonstrate that the individuals in the ET group consistently exhibited greater perfusion than the individuals in the HAC group. Furthermore, a voxel-wise SPM analysis on the hippocampus ROI showed statistically significant greater hippocampal CBF in the ET group compared with the HAC group (false discovery rate corrected for multiple comparisons at p < 0.05). The higher hippocampus CBF extended throughout the hippocampus bilaterally (see Figure 2 ).
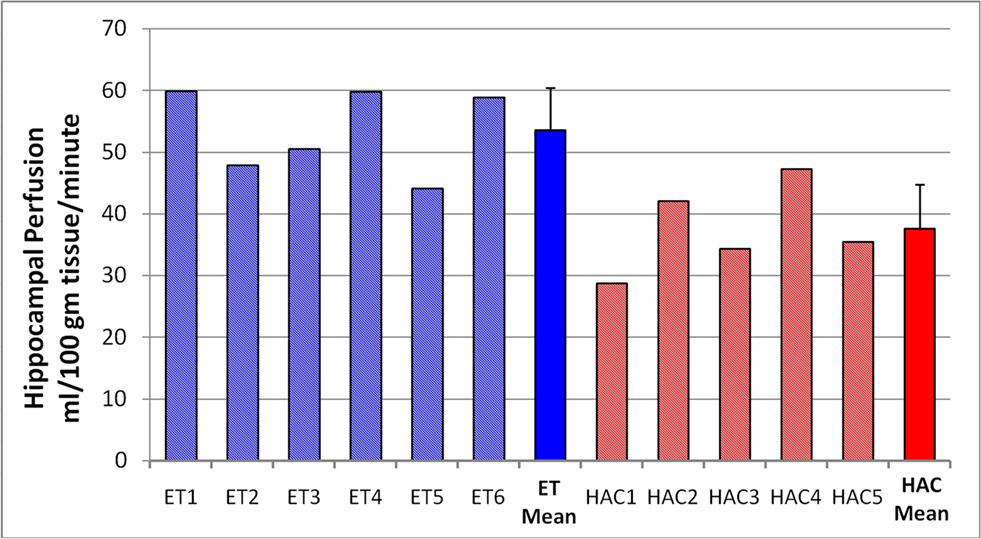
Figure 1. Hippocampal perfusion (CBF) in each subject. The hatched bars are the individuals in each group, and the mean and SD for each group are the solid bars. The individuals in the ET group consistently showed elevated hippocampal perfusion compared with the HAC group. Note that subjects 2, 5, and 6 are the male participants in the ET group.
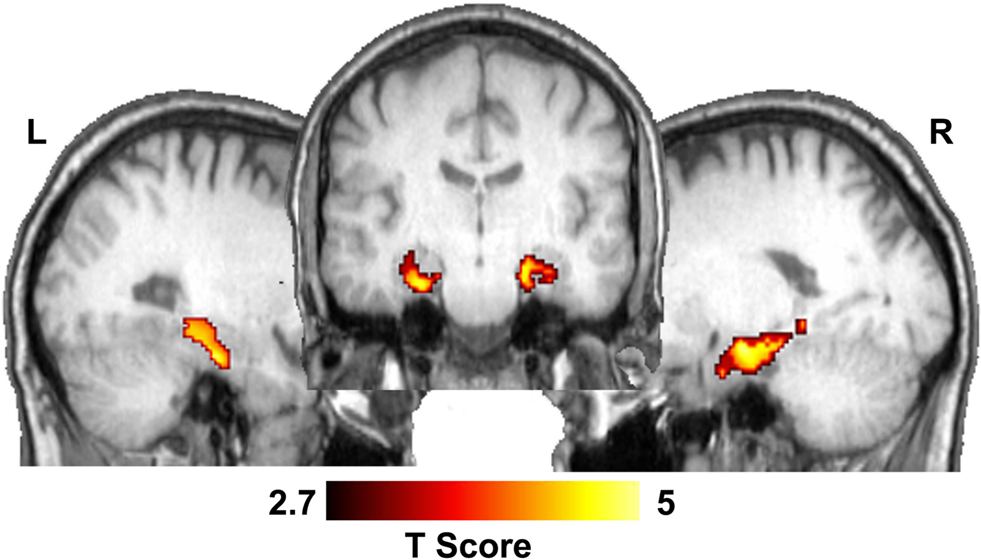
Figure 2. Statistical parametric map showing significant CBF differences between ET and HAC in the hippocampus. The middle image shows a coronal slice through the hippocampus and the lateral images show sagittal sections through the left and right hippocampi.
Network Analyses
Table 2 shows the global network metrics K, Eglob, and Eloc as well as the mean efficiencies for random networks of the same node number and degree (Maslov and Sneppen, 2002 ) calculated for each study participant. Both the ET and HAC groups were highly clustered (high Eloc) with high global connectivity (high Eglob) relative to the comparable random networks. These features of a so-called small world network (Watts and Strogatz, 1998 ) are consistent with known information processing in the human brain. There were no statistically significant differences in any of the global network metrics between the two groups. Thus, network wide assessments revealed that the two populations exhibited comparable regional specificity with maintained long-range connectivity. However, regional differences in the networks of the two groups were discovered. Compared to HAC, those participants who engaged in ET showed greater connectivity (or degree) in the hippocampus (Figure 3 ).
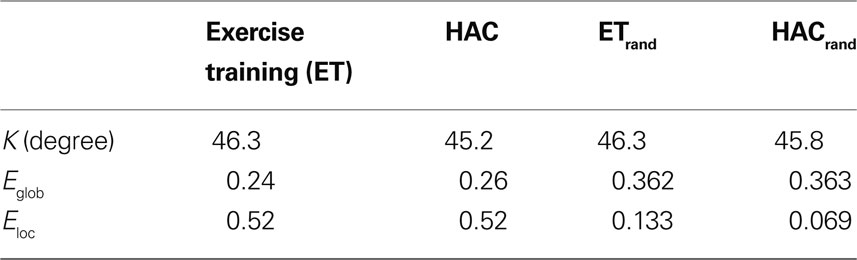
Table 2. Summary global network metrics for both groups. Note that there were no statistically significant differences between the two groups for degree or for global and local efficiency (Eglob and Eloc, respectively). ETrand and HACrand are the metrics calculated on equivalent random networks.
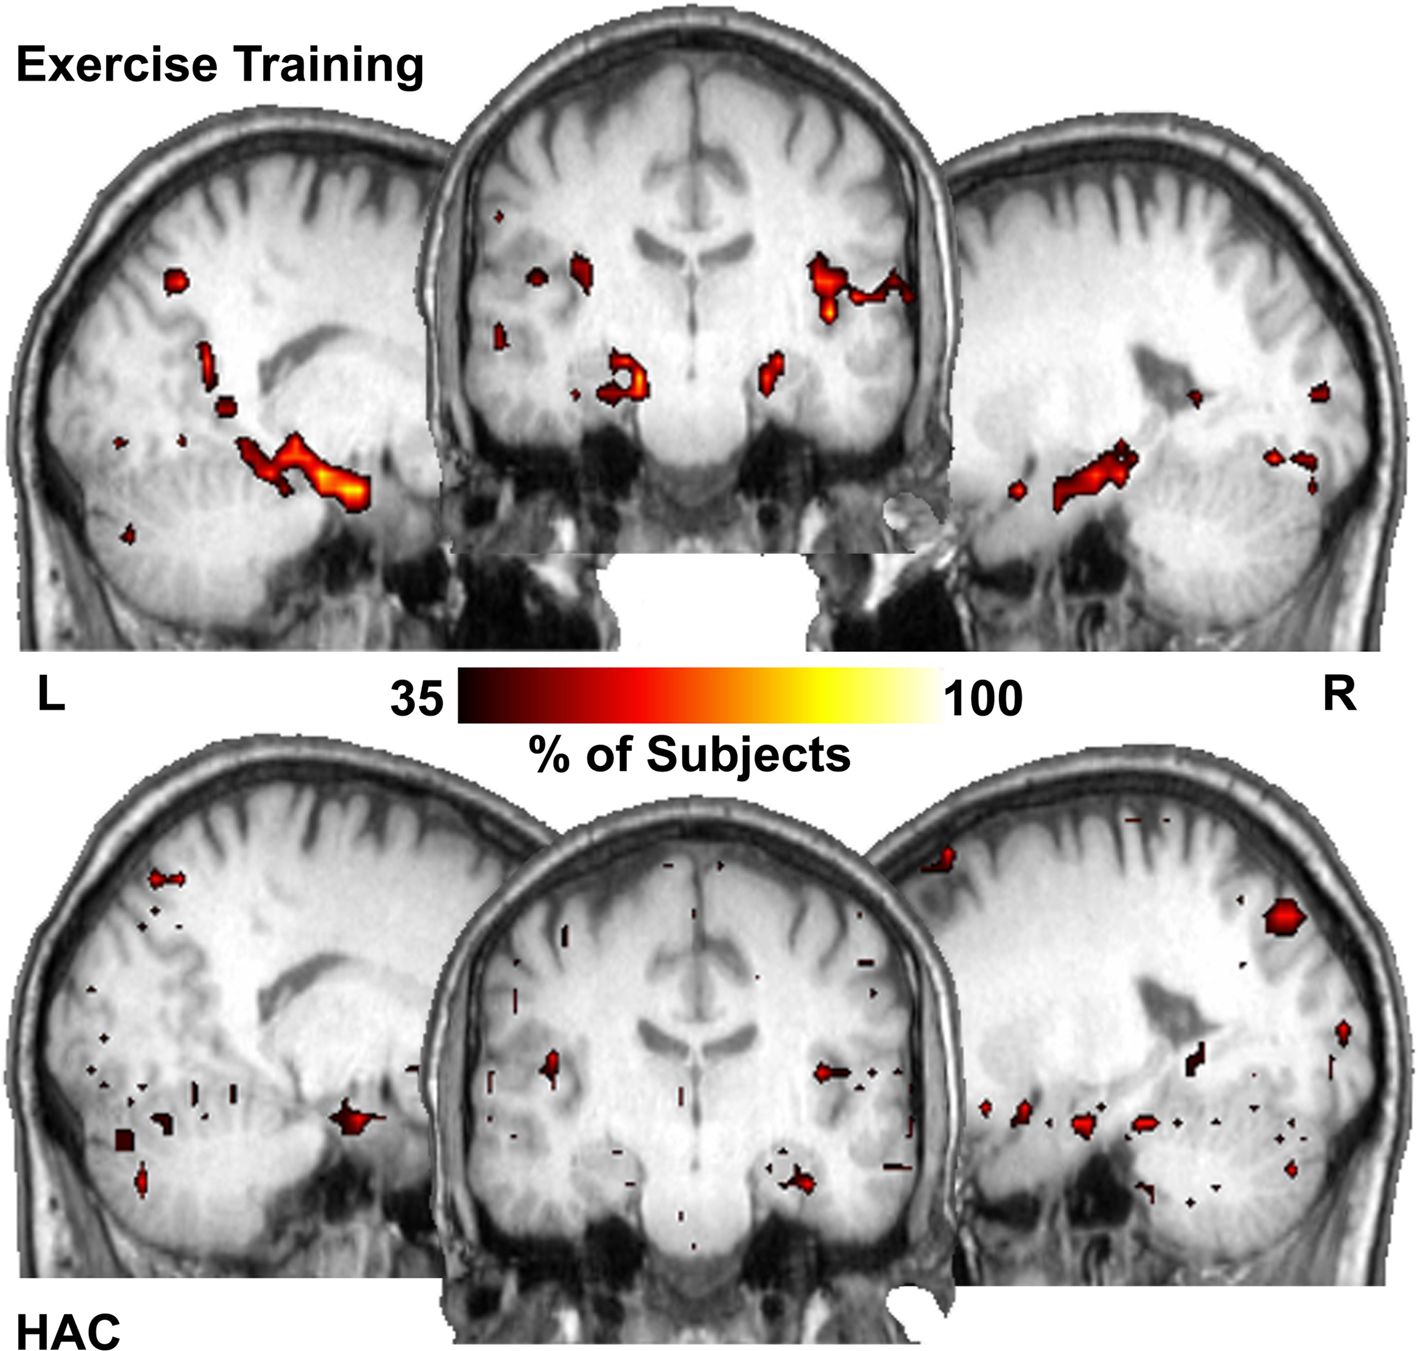
Figure 3. Hub maps show regions that have high number of connections (top 15% of all voxels) that are common across subjects in each population. The hippocampus is among the major hubs in the ET group. In the HAC group a small portion of the right hippocampus is a common hub but much less so than the ET group. Color bar shows the percentage of subjects with a hub in each region.
Figure 3 shows the number of subjects for whom each region had a degree (connectivity) that was among the top 15% relative to all other regions (i.e., how many subjects showed each voxel being a top 15% connected voxel). These are essentially “hub maps” and show consistency of hub voxels across participants. Thus, in the ET group, the hippocampi were among the regions consistently shown to be highly connected hubs, a finding not present in the HAC group. Statistically comparing the network properties within the hippocampus ROI showed that the degree (K) measurements within the hippocampi were significantly larger in the ET group (mean of 49.5, SD 17 connections and 28.3, SD 16 connections for the ET and HAC, respectively, with p < 0.028). In other words, the hippocampi of the people who participated in ET showed greater connectivity than those in HAC. These data imply that in the ET group, the hippocampi are more highly connected and functionally closer to all other nodes in the brain relative to HAC.
To examine brain regions that exhibited enhanced connectivity with the hippocampus following exercise, a modularity analysis was conducted. Modularity analyses allow the discovery of community structure within a network, as they show communities in which the nodes are more connected to each other than with nodes in other communities (Girvan and Newman, 2002 ). In other words, the different nodes within each module (or community) “play with each other” more than with nodes in other communities (i.e., analogously, they are best friends). This analysis revealed that the major change in hippocampi connectivity is with the anterior cingulate cortex (ACC). The hippocampi and the ACC are highly interconnected and localized to the same network neighborhood (module) in the ET group (Figure 4 ), an effect that was not observed in the HAC group.
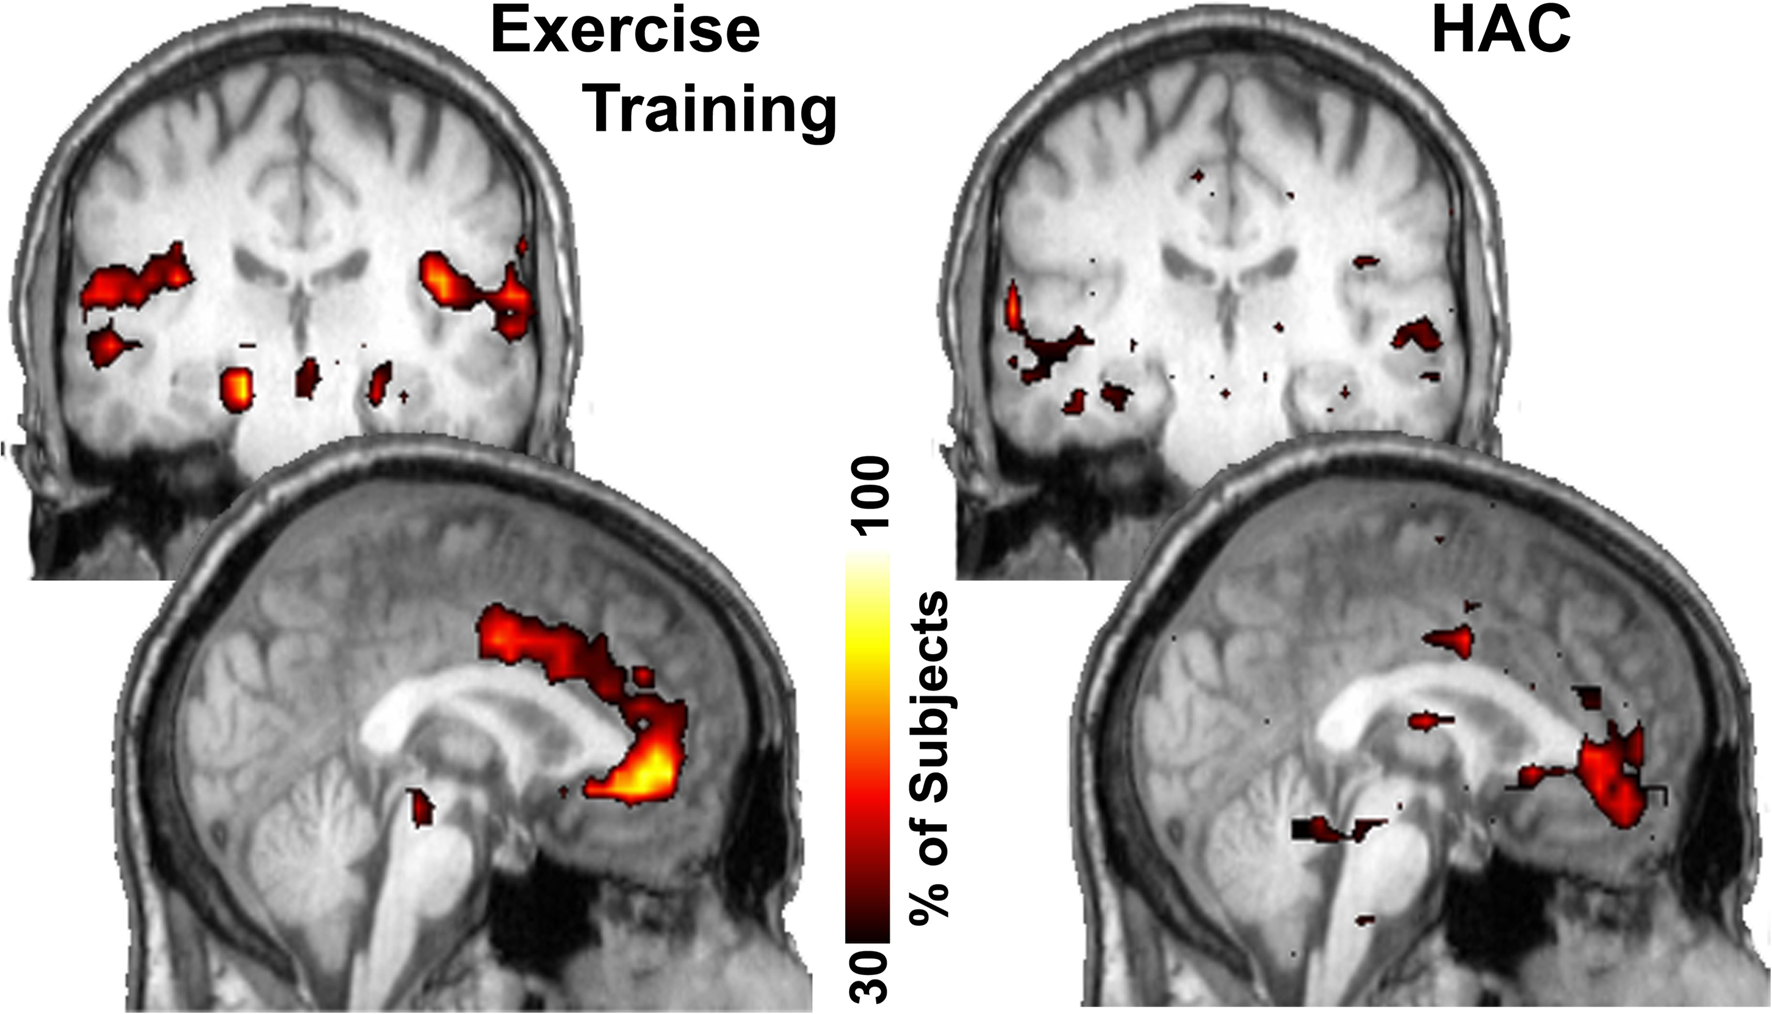
Figure 4. Consistency of community structure of the hippocampus across subjects. In the ET group the hippocampus most notably interconnected with the anterior cingulate gyrus as well as several other regions. In the HAC, the anterior cingulate only has minor connections with the hippocampus. Color bar shows the percentage of subjects that have each voxel in this network community.
The greater interconnectivity between the hippocampus and the ACC led to a post-hoc evaluation of the blood flow and network metrics in the ACC. These evaluations revealed no change in ACC blood flow following ET, but marginally significant increases in ACC connectivity or degree (89 and 55 connections for the ET and HAC, respectively, with p < 0.07). Therefore, not only did the network analyses show greater connectivity in the ET group’s hippocampi and ACC, but they also showed that these two areas are actually in the same module in the ET group. Thus, the ACC and hippocampi are more connected to each other and to the rest of the brain in the ET group.
Statistical Comparison of Perfusion and Network Findings
As shown in Figures 1 and 2 , the ET group had higher perfusion to the hippocampus, and as shown in Figures 3 and 4 , the ET group demonstrated greater connectivity within the hippocampus and ACC. Interestingly, statistical analyses of the degree (K) of the anterior cingulate gyrus and hippocampal perfusion (CBF) revealed a significant relationship between these variables (p = 0.03). Thus, higher hippocampal perfusion was significantly related to greater connectivity in the ACC.
Discussion
This project shows the power of network science methods to better understand brain function. Specifically, these methods begin to shed light on the neurophysiological underpinnings of exercise-induced benefits to the brain in older adults. For the first time, these data suggest that there is a link between neurological network features and CBF that could be important in understanding the mechanisms leading to increased CBF in the hippocampus following exercise in older adults. We have used novel brain imaging techniques to evaluate the effects of an exercise program on the brain. These non-invasive imaging techniques included (1) arterial spin labeled (ASL) MRI to measure quantitative CBF, and (2) a whole-brain network analysis technique which uses graph theory to evaluate the brain as a complex network of functional connections. We specifically focused our analyses on the hippocampus, as there is converging evidence of the importance of the hippocampus in exercise-induced changes in the brain (Pereira et al., 2007 ; Erickson et al., 2009 ; Heo et al., 2010 ).
The data presented here showed no significant difference in connectivity between the groups when network-wide whole-brain metrics were used. The extraction of single mean network metrics, such as global efficiency, appears to be fairly non-specific (Zhu et al., 2003 ; Rombouts et al., 2005 ; Bartolomei et al., 2006 ; Ponten et al., 2007 ; Stam et al., 2007 ; Bassett et al., 2008 ; Rubinov et al., 2009 ; Wang et al., 2009 ; Yuan et al., 2010 ) and likely insensitive. The averaging of the metrics from each of 15,000 network nodes means that a change in one region can easily be masked by maintenance of connectivity throughout the rest of the network. To avoid this possible confound, regional network metrics were evaluated in brain space using voxel-based networks (Hayasaka and Laurienti, 2010 ). The regional analyses suggested that the ET group exhibited greater connectivity in the hippocampus. This greater connectivity indicates that information from the hippocampus can be more readily transmitted throughout the brain. The magnitude of the change is considerable as an analysis of 20 young adults (data not presented here) revealed a mean hippocampal degree of 32. Thus, the ET group had higher connectivity in the hippocampus than would be expected in a young population. This could indicate a compensatory doubling of the connections in the hippocampus. Of particular interest are the other brain regions that are the target of the greater connectivity. The network neighborhood analyses revealed that the hippocampus was specifically interconnected with the anterior cingulate gyrus in the ET group but not in the control group. This increase in interconnectivity between these regions can help support more efficient and redundant communication.
Of particular interest are the other brain regions that are the target of the increased connectivity. The network neighborhood analyses revealed that the hippocampus was specifically interconnected with the anterior cingulate gyrus in the ET group but not in the control group. Changes in the anterior cingulate gyrus following ET are not unexpected in that exercise has been shown to influence executive control processes (Colcombe et al., 2003 , 2004 ), and the anterior cingulate is known to play a role in aspects of executive function, such as conflict resolution (Fan et al., 2005 ), monitoring to assess the need for cognitive control (MacDonald III et al., 2000 ), and response selection and evaluation (Banich, 2009 ). More importantly though, the anterior cingulate has been found to be engaged in episodic memory tasks that require cognitive control in the form of source monitoring (de Chastelaine et al., 2007 ; Kompus et al., 2009 ) and conflict detection (Fleck et al., 2006 ) suggesting increased interconnectivity between the anterior cingulate and the hippocampus may support more efficient communication when memory retrieval requires such control.
The Hippocampus and its Role in Exercise
Several studies have shown alterations in the hippocampus following exercise. For example, Pereira et al. (2007) showed that CBV is elevated in exercised adults using a bolus-gadolinium perfusion MRI technique, and furthermore, that these increases in CBV are correlated with aerobic fitness and cognition. In addition, Erickson et al. (2009) reported a positive relationship between hippocampal volume and aerobic fitness, and indicated that larger volume was associated with better memory. This previous work showing hippocampal changes associated with exercise necessitates a focus on the hippocampus in the current study. However, this focus on the hippocampus is not meant to imply regional specificity but is intended to increase the sensitivity for identifying exercise-related perfusion changes. Thus, future studies may find changes that extend well beyond the hippocampus, such as the anterior cingulate, which was implicated in our network analyses.
We used a non-invasive ASL MR perfusion technique to measure CBF rather than blood volume, and we found elevated CBF in the hippocampi. In a recent research report using a non-invasive MR technique, Heo et al. (2010) showed an association between elevated CBF in the hippocampi and better memory performance in older adults. This converging data suggests that increased hippocampal blood flow is likely beneficial, and given that exercise appears to focally increase regional CBF in the hippocampi, exercise is almost certainly beneficial for older adults, as exercise appears to preferentially affect these important brain regions.
It appears that network analyses may be useful in discovering underlying neurophysiological mechanisms associated with the exercise-induced perfusion changes in the hippocampi and may begin to explain some of the reported exercise-induced neurocognitive behavioral improvements observed in exercise with older adults. Voss et al. (2010) recently reported the first brain connectivity study showing portions of the so-called default mode network (DMN) mediating the relationship between cardiovascular fitness and cognition. They used the posterior cingulate cortex/retrosplenial cortex (PCC/rsp) as a seed or focus to determine what other areas of the brain were functionally connected to the PCC/rsp. For our analysis, we performed functional connectivity analyses at each voxel (on the order of 15,000 voxels) to simultaneously evaluate the interconnectivity of all brain regions. In other words, instead of the single connectivity analysis, we used data from all voxel-wise comparisons to create a matrix with which the network analysis tools could calculate the network properties of the brains of the two intervention groups. This analysis is inherently multivariate in nature and quite distinct from a traditional functional connectivity study using a single seed region. While we focused our analysis on the hippocampus, the connectivity metrics reported represent the role of the hippocampi within the whole-brain network. For example, network modularity is a metric that is based on the connectivity of the entire network and the position of the hippocampus within that network.
The modularity analyses that were performed allow for the identification of community structures within the networks. Communities are collections of network nodes (in our brain imaging case, that would be voxels) that are functionally more connected to each other than they are to nodes in other communities. These communities of nodes are in essence “best friends” but are not isolated from the remainder of the network. These methods suggest that exercise affects the community structure of the brain network; in particular, the ET group showed the hippocampus and ACC to be in the same functional module. Such findings were not present in the HAC group. Of course, the hippocampus and ACC are connected in the HAC (“friends,” if you will) but are not preferentially connected as seen in the ET group (“best friends”). This suggests that exercise may lead to increased functional communication between the ACC and hippocampus. The implications of this finding are that, within the ET group, there is greater connectivity within the hippocampus and ACC and specifically greater connectivity between each other! If confirmed in subsequent research, this would be a very important finding, suggesting that greater functional connections and perfusion in these regions likely interact. The increased synaptic activity that underlies the increased functional connectivity would demand greater blood flow. In addition, greater blood flow in the hippocampus would support increased neurogenesis and synaptogenesis (Pereira et al., 2007 ) helping increase connectivity. While the role of these changes in mediating exercise-induced cognitive improvements are not directly addressed here, the neurobiological principles underlying brain connectivity would suggest that improved communication between the cingulate and hippocampus could have significant implications for cognitive functioning (Buzsáki, 2006 ).
Limitations
The focus of this study was on the application of network analyses to help researchers better understand the role that exercise may have on neurophysiological changes in older adults. The small sample size, the group imbalance with respect to gender, and the absence of pre-intervention scans preclude us from drawing firm conclusion about the results of the study, and we would caution researchers from doing so. However, the differences that we did observe between populations are consistent with the literature on cognitive changes with exercise. Thus, the novelty of using these methods to evaluate exercise-induced changes in the brain among older adults is both conceptually intriguing and innovative.
Conclusions
In summary, the current study used novel network science methods, coupled with brain perfusion measurements, to shed light on the neurophysiological implications of exercise-induced changes in the hippocampus of older adults. The patterns and consistency in our data suggest that ET may lead to higher perfusion in the hippocampus. Furthermore, despite the limitations of our study design, the ET group also showed greater connectivity within the hippocampus and ACC, and the hippocampus and ACC were found to be within the same functional module or community only in the ET group. Importantly, these methods suggest that the exercise-associated network changes demonstrated here (greater degree in the hippocampus and greater functional communication between the hippocampus and ACC) may be the underlying neurophysiological causes of the previously reported blood volume and brain volume changes seen with exercise in healthy older adults. As already discussed, others have suggested that cerebral blood volume is a surrogate measure of neurogenesis and have concluded that increased cerebral blood volume in the hippocampus with exercise implies neurogenesis in these regions (Pereira et al., 2007 ). Network analyses provide a method to investigate the hypothesis that exercise may increase regional functional connectivity most likely in association with the neurogenesis and synaptogenesis that occurs (van Praag et al., 2005 ). The changes in connectivity could drive a greater demand for blood resulting in greater blood flow to the hippocampus thus further supporting neurogenesis. Thus, these methods may provide tools to get a glimpse into the neurological changes leading to the altered physiology (CBF) seen with exercise, as reported previously (Swain et al., 2003 ; Pereira et al., 2007 ) and seen within this study. This is particularly compelling considering that these regions are involved in memory and executive function, are thought to be part of the DMN (Greicius and Menon, 2004 ), and have been shown to be adversely affected by aging.
Conflict of Interest Statement
The authors declare that the research was conducted in the absence of any commercial or financial relationships that could be construed as a potential conflict of interest.
Acknowledgments
Trial Registration: Clinicaltrials.gov Identifier: NCT00688155.
Funding: The Seniors Health and Activity Research Program Pilot Study was funded by the Department of Health and Human Services, National Institutes of Health (1R01AG029285 - 01A1) and the General Clinical Research Center of Wake Forest University Baptist Medical Center (M01-RR07122). Funding was also provided by NIH R21 NS044149 to Jonathan H. Burdette, by the Roena Kulynych Memory and Cognitive Research Center, by NIH R01-NS070917 to Satoru Hayasaka, and by the Translational Science Center of Wake Forest University, Reynolda Campus. The funders had no role in study design, data collection and analysis, decision to publish, or preparation of the manuscript.
The SHARP-P Study Group includes:
Wake Forest University: Robert Amoroso; Lee Ann Andrews; Jerry Barnes, MA; Mary Barr; Dale Dagenbach, PhD; Patricia Davis; Meredith Dobrosielski, MS; Robin Dove; Mark A. Espeland, PhD; Deborah Felton; Sarah A. Jaramillo, MS; Janine M. Jennings, PhD; Jeff A. Katula, PhD; Mark D. King; Claudine Legault, PhD; Abbie Prescott, MS; Stephen Rapp, PhD; W. Jack Rejeski, PhD; Wes Roberson; Kaycee M. Sink, MD, MAS; Shannon Sharp; Sally A. Shumaker, PhD; and Terri Windham.
University of California at San Francisco: Deborah E. Barnes, PhD, MPH.
Stanford University: Victor W. Henderson, MD, MS; Abby C. King, PhD; and Marcia L. Stefanick, PhD.
The authors would like to thank the Center for Biomolecular Imaging at Wake Forest University Health Sciences and Ms. Debra Hege for their invaluable assistance with imaging data collection.
References
Banich, M. T. (2009). Executive function: the search for an integrated account. Curr. Dir. Psychol. Sci. 18, 89–94.
Barabasi, A. L., and Albert, R. (1999). Emergence of scaling in random networks. Science 286, 509–512.
Bartolomei, F., Bosma, I., Klein, M., Baayen, J. C., Reijneveld, J. C., Postma, T. J., Heimans, J. J., van Dijk, B. W., de Munck, J. C., de Jongh, A., Cover, K. S., and Stam, C. J. (2006). Disturbed functional connectivity in brain tumour patients: evaluation by graph analysis of synchronization matrices. Clin. Neurophysiol. 117, 2039–2049.
Bassett, D. S., Bullmore, E., Verchinski, B. A., Mattay, V. S., Weinberger, D. R., and Meyer-Lindenberg, A. (2008). Hierarchical organization of human cortical networks in health and schizophrenia. J. Neurosci. 28, 9239–9248.
Borg, E., and Kaijser, L. (2006). A comparison between three rating scales for perceived exertion and two different work tests. Scand. J. Med. Sci. Sports 16, 57–69.
Bullmore, E., and Sporns, O. (2009). Complex brain networks: graph theoretical analysis of structural and functional systems. Nat. Rev. Neurosci. 10, 186–198.
Colcombe, S., and Kramer, A. F. (2003). Fitness effects on the cognitive function of older adults: a meta-analytic study. Psychol. Sci. 14, 125–130.
Colcombe, S. J., Erickson, K. I., Raz, N., Webb, A. G., Cohen, N. J., McAuley, E., and Kramer, A. F. (2003). Aerobic fitness reduces brain tissue loss in aging humans. J. Gerontol. A Biol. Sci. Med. Sci. 58, 176–180.
Colcombe, S. J., Erickson, K. I., Scalf, P. E., Kim, J. S., Prakash, R., McAuley, E., Elavsky, S., Marquez, D. X., Hu, L., and Kramer, A. F. (2006). Aerobic exercise training increases brain volume in aging humans. J. Gerontol. A Biol. Sci. Med. Sci. 61, 1166–1170.
Colcombe, S. J., Kramer, A. F., Erickson, K. I., Scalf, P., McAuley, E., Cohen, N. J., Webb, A., Jerome, G. J., Marquez, D. X., and Elavsky, S. (2004). Cardiovascular fitness, cortical plasticity, and aging. Proc. Natl. Acad. Sci. U.S.A. 101, 3316–3321.
de Chastelaine, M., Friedman, D., and Cycowicz, Y. M. (2007). The development of control processes supporting source memory discrimination as revealed by event-related potentials. J. Cogn. Neurosci. 19, 1286–1301.
Erickson, K. I., and Kramer, A. F. (2009). Aerobic exercise effects on cognitive and neural plasticity in older adults. Br. J. Sports Med. 43, 22–24.
Erickson, K. I., Prakash, R. S., Voss, M. W., Chaddock, L., Hu, L., Morris, K. S., White, S. M., Wojcicki, T. R., McAuley, E., and Kramer, A. F. (2009). Aerobic fitness is associated with hippocampal volume in elderly humans. Hippocampus 19, 1030–1039.
Espeland, M. A., Rapp, S. R., Katula, J. A., Andrews, L. A., Felton, D., Gaussoin, S. A., Dagenbach, D., Legault, C., Jennings, J. M., and Sink, K. M. (2010). Telephone interview for cognitive status (TICS) screening for clinical trials of physical activity and cognitive training: the Seniors Health and Activity Research Program Pilot (SHARP-P) study. Int. J. Geriatr. Psychiatry (in press).
Fan, J., McCandliss, B. D., Fossella, J., Flombaum, J. I., and Posner, M. I. (2005). The activation of attentional networks. Neuroimage 26, 471–479.
Fleck, M. S., Daselaar, S. M., Dobbins, I. G., and Cabeza, R. (2006). Role of prefrontal and anterior cingulate regions in decision-making processes shared by memory and nonmemory tasks. Cereb. Cortex 16, 1623–1630.
Folstein M. F., Folstein S. E., and McHugh P. R. (1975). “Mini-mental state”. A practical method for grading the cognitive state of patients for the clinician. J. Psych. Res. 12, 189–198.
Girvan, M., and Newman, M. E. (2002). Community structure in social and biological networks. Proc. Natl. Acad. Sci. U.S.A. 99, 7821–7826.
Greicius, M. D., and Menon, V. (2004). Default-mode activity during a passive sensory task: uncoupled from deactivation but impacting activation. J. Cogn. Neurosci. 16, 1484–1492.
Hagmann, P., Cammoun, L., Gigandet, X., Meuli, R., Honey, C. J., Wedeen, V. J., and Sporns, O. (2008). Mapping the structural core of human cerebral cortex. PLoS Biol. 6, e159. doi: 10.1371/journal.pbio.0060159.
Hayasaka, S., and Laurienti, P. J. (2010). Comparison of characteristics between region- and voxel-based network analyses in resting-state fMRI data. Neuroimage 50, 499–508.
He, Y., Chen, Z., and Evans, A. (2008). Structural insights into aberrant topological patterns of large-scale cortical networks in Alzheimer’s disease. J. Neurosci. 28, 4756–4766.
Heo, S., Prakash, R. S., Voss, M. W., Erickson, K. I., Ouyang, C., Sutton, B. P., and Kramer, A. F. (2010). Resting hippocampal blood flow, spatial memory and aging. Brain Res. 1315, 119–127.
Hillman, C. H., Erickson, K. I., and Kramer, A. F. (2008). Be smart, exercise your heart: exercise effects on brain and cognition. Nat. Rev. Neurosci. 9, 58–65.
Kim, S. G., and Tsekos, N. V. (1997). Perfusion imaging by a flow-sensitive alternating inversion recovery (FAIR) technique: application to functional brain imaging. Magn. Reson. Med. 37, 425–435.
Kompus, K., Hugdahl, K., Ohman, A., Marklund, P., and Nyberg, L. (2009). Distinct control networks for cognition and emotion in the prefrontal cortex. Neurosci. Lett. 467, 76–80.
Latora, V., and Marchiori, M. (2001). Efficient behavior of small-world networks. Phys. Rev. Lett. 87, 198701.
Luh, W. M., Wong, E. C., Bandettini, P. A., and Hyde, J. S. (1999). QUIPSS II with thin-slice TI1 periodic saturation: a method for improving accuracy of quantitative perfusion imaging using pulsed arterial spin labeling. Magn. Reson. Med. 41, 1246–1254.
MacDonald, A. W. III., Cohen, J. D., Stenger, V. A., and Carter, C. S. (2000). Dissociating the role of the dorsolateral prefrontal and anterior cingulate cortex in cognitive control. Science 288, 1835–1838.
Maldjian, J. A., Laurienti, P. J., Kraft, R. A., and Burdette, J. H. (2003). An automated method for neuroanatomic and cytoarchitectonic atlas-based interrogation of fMRI data sets. Neuroimage 19, 1233–1239.
Maslov, S., and Sneppen, K. (2002). Specificity and stability in topology of protein networks. Science 296, 910–913.
Meunier, D., Lambiotte, R., Fornito, A., Ersche, K. D., and Bullmore, E. T. (2009). Hierarchical modularity in human brain functional networks. Front. Neuroinformatics 3:37. doi: 10.3389/neuro.11.037.2009.
Micheloyannis, S., Pachou, E., Stam, C. J., Breakspear, M., Bitsios, P., Vourkas, M., Erimaki, S., and Zervakis, M. (2006). Small-world networks and disturbed functional connectivity in schizophrenia. Schizophr. Res. 87, 60–66.
Newman, M. E., and Girvan, M. (2004). Finding and evaluating community structure in networks. Phys. Rev. E. Stat. Nonlin. Soft Matter Phys. 69, 026113.
Pahor, M., Blair, S. N., Espeland, M., Fielding, R., Gill, T. M., Guralnik, J. M., Hadley, E. C., King, A. C., Kritchevsky, S. B., Maraldi, C., Miller, M. E., Newman, A. B., Rejeski, W. J., Romashkan, S., and Studenski, S. (2006). Effects of a physical activity intervention on measures of physical performance: results of the lifestyle interventions and independence for Elders Pilot (LIFE-P) study. J. Gerontol. A Biol. Sci. Med. Sci. 61, 1157–1165.
Pereira, A. C., Huddleston, D. E., Brickman, A. M., Sosunov, A. A., Hen, R., McKhann, G. M., Sloan, R., Gage, F. H., Brown, T. R., and Small, S. A. (2007). An in vivo correlate of exercise-induced neurogenesis in the adult dentate gyrus. Proc. Natl. Acad. Sci. U.S.A. 104, 5638–5643.
Ponten, S. C., Bartolomei, F., and Stam, C. J. (2007). Small-world networks and epilepsy: graph theoretical analysis of intracerebrally recorded mesial temporal lobe seizures. Clin. Neurophysiol. 118, 918–927.
Rombouts, S. A., Barkhof, F., Goekoop, R., Stam, C. J., and Scheltens, P. (2005). Altered resting state networks in mild cognitive impairment and mild Alzheimer’s disease: an fMRI study. Hum. Brain Mapp. 26, 231–239.
Rubinov, M., Knock, S. A., Stam, C. J., Micheloyannis, S., Harris, A. W., Williams, L. M., and Breakspear, M. (2009). Small-world properties of nonlinear brain activity in schizophrenia. Hum. Brain Mapp. 30, 403–416.
Schwarz, A. J., Gozzi, A., and Bifone, A. (2008). Community structure and modularity in networks of correlated brain activity. Magn. Reson. Imaging 26, 914–920.
Sporns, O., Honey, C. J., and Kotter, R. (2007). Identification and classification of hubs in brain networks. PLoS ONE 2, e1049. doi: 10.1371/journal.pone.0001049.
Sporns, O., and Zwi, J. D. (2004). The small world of the cerebral cortex. Neuroinformatics 2, 145–162.
Stam, C. J., Jones, B. F., Nolte, G., Breakspear, M., and Scheltens, P. (2007). Small-world networks and functional connectivity in Alzheimer’s disease. Cereb. Cortex 17, 92–99.
Stranahan, A. M., Zhou, Y., Martin, B., and Maudsley, S. (2009). Pharmacomimetics of exercise: novel approaches for hippocampally-targeted neuroprotective agents. Curr. Med. Chem. 16, 4668–4678.
Supekar, K., Menon, V., Rubin, D., Musen, M., and Greicius, M. D. (2008). Network analysis of intrinsic functional brain connectivity in Alzheimer’s disease. PLoS Comput. Biol. 4, e1000100. doi: 10.1371/journal.pcbi.1000100.
Swain, R. A., Harris, A. B., Wiener, E. C., Dutka, M. V., Morris, H. D., Theien, B. E., Konda, S., Engberg, K., Lauterbur, P. C., and Greenough, W. T. (2003). Prolonged exercise induces angiogenesis and increases cerebral blood volume in primary motor cortex of the rat. Neuroscience 117, 1037–1046.
Teng, E. L., and Chui, H. C. (1987). The modified mini-mental state (3MS) examination. J. Clin. Psych. 48, 314–318.
Tran, T. K., Vigneron, D. B., Sailasuta, N., Tropp, J., Le Roux, P., Kurhanewicz, J., Nelson, S., and Hurd, R. (2000). Very selective suppression pulses for clinical MRSI studies of brain and prostate cancer. Magn. Reson. Med. 43, 23–33.
van Praag, H., Shubert, T., Zhao, C., and Gage, F. H. (2005). Exercise enhances learning and hippocampal neurogenesis in aged mice. J. Neurosci. 25, 8680–8685.
Voss, M. W., Erickson, K. I., Prakash, R. S., Chaddock, L., Malkowski, E., Alves, H., Kim, J. S., Morris, K. S., White, S. M., Wójcicki, T. R., Hu, L., Szabo, A., Klamm, E., McAuley, E., and Kramer, A. F. (2010). Functional connectivity: a source of variance in the association between cardiorespiratory fitness and cognition? Neuropsychologia 48, 1394–1406.
Wang, L., Zhu, C., He, Y., Zang, Y., Cao, Q., Zhang, H., Zhong, Q., and Wang, Y. (2009). Altered small-world brain functional networks in children with attention-deficit/hyperactivity disorder. Hum. Brain Mapp. 30, 638–649.
Watts, D. J., and Strogatz, S. H. (1998). Collective dynamics of ‘small-world’ networks. Nature 393, 440–442.
Wong, E. C., Buxton, R. B., and Frank, L. R. (1998). Quantitative imaging of perfusion using a single subtraction (QUIPSS and QUIPSS II). Magn. Reson. Med. 39, 702–708.
Yang, Y., Frank, J. A., Hou, L., Ye, F. Q., McLaughlin, A. C., and Duyn, J. H. (1998). Multislice imaging of quantitative cerebral perfusion with pulsed arterial spin labeling. Magn. Reson. Med. 39, 825–832.
Yuan, K., Qin, W., Liu, J., Guo, Q., Dong, M., Sun, J., Zhang, Y., Liu, P., Wang, W., Wang, Y., Li, Q., Yang, W., von Deneen, K. M., Gold, M. S., Liu, Y., and Tian, J. (2010). Altered small-world brain functional networks and duration of heroin use in male abstinent heroin-dependent individuals. Neurosci. Lett. 477, 37–42.
Keywords: hippocampus, exercise, fitness, aging, perfusion, networks, small-world, fMRI
Citation: Burdette JH, Laurienti PJ, Espeland MA, Morgan A, Telesford Q, Vechlekar CD, Hayasaka S, Jennings JM, Katula JA, Kraft RA and Rejeski WJ (2010) Using network science to evaluate exercise-associated brain changes in older adults. Front. Ag. Neurosci. 2:23. doi: 10.3389/fnagi.2010.00023
Received: 26 March 2010;
Paper pending published: 20 April 2010;
Accepted: 13 May 2010;
Published online: 07 June 2010
Edited by:
Arthur F. Kramer, University of Illinois at Urbana-Champaign, USAReviewed by:
Ruchika S. Prakash, The Ohio State University, USAJeff Burns, University of Kansas Medical Center, USA
David Madden, Duke University Center for the Study of Aging and Human Development, USA
Copyright: © 2010 Burdette, Laurienti, Espeland, Morgan, Telesford, Vechlekar, Hayasaka, Jennings, Katula, Kraft and Rejeski. This is an open-access article subject to an exclusive license agreement between the authors and the Frontiers Research Foundation, which permits unrestricted use, distribution, and reproduction in any medium, provided the original authors and source are credited.
*Correspondence: Jonathan H. Burdette, Department of Radiology, Laboratory for Complex Brain Networks, Wake Forest University Health Sciences, Medical Center Boulevard, Winston-Salem, NC 27157, USA. e-mail: jburdett@wfubmc.edu