Discriminatory analysis of biochip-derived protein patterns in CSF and plasma in neurodegenerative diseases
- 1 Clinical Neurochemistry Laboratory, Department of Psychiatry and Neurochemistry, Institute of Neuroscience and Physiology, The Sahlgrenska Academy at the University of Gothenburg, Gothenburg and Mölndal, Sweden
- 2 Department of Neuropsychiatry, Skaraborg Hospital, Falköping, Sweden
- 3 Department of Endocrinology, The Sahlgrenska Academy at the University of Gothenburg, Gothenburg, Sweden
- 4 Clinical Memory Research Unit, Clinical Sciences Malmö, Lund University, Lund, Sweden
- 5 Randox Laboratories, Antrim, UK
- 6 Department of Endocrinology, Skaraborg Hospital, Skövde, Sweden
The role of biomarkers in neurodegenerative diseases has been emphasized by recent research. Future clinical demands for identifying diseases at an early stage may render them essential. The aim of this pilot study was to test the analytical performance of two multiplex assays of cerebral markers on a well-defined clinical material consisting of patients with various neurodegenerative diseases. We measured 10 analytes in plasma and cerebrospinal fluid (CSF) from 60 patients suffering from Alzheimer’s disease (AD), vascular dementia, frontotemporal dementia, dementia with Lewy bodies, or mild cognitive impairment, as well as 20 cognitively healthy controls. We used the Randox biochip-based Evidence Investigator™ system to measure the analytes. We found it possible to measure most analytes in both plasma and CSF, and there were some interesting differences between the diagnostic groups, although with large overlaps. CSF heart-type fatty acid-binding protein was increased in AD. Glial fibrillary acidic protein and neutrophil gelatinase-associated lipocalin in CSF and D-dimer in plasma were elevated in patients with cerebrovascular disease. A multivariate statistical analysis revealed that the pattern of analytes could help to differentiate the conditions, although more studies are required to verify this.
Introduction
Neurodegenerative diseases are important worldwide health issues and include several diseases that share similar features (Jellinger, 2010), which can pose a diagnostic challenge. An objective way of measuring disease-specific processes is provided by biomarkers (Blennow et al., 2010). Biomarkers have several potential uses, as illustrated in the context of Alzheimer’s disease (AD). They can be applied in diagnosis and in monitoring disease progression (Hampel et al., 2010). They may also be used in clinical trials and in drug development, to identify and monitor biochemical drug effects, or to detect possible side effects (Hampel et al., 2010). The best-established biomarkers for AD are cerebrospinal fluid (CSF) levels of total tau (T-tau), which reflects cortical axonal degeneration; hyperphosphorylated tau (P-tau), which reflects neurofibrillary tangle pathology; and the 42 amino acid isoform of amyloid β (Aβ1-42), which reflects amyloid pathology (Blennow et al., 2010). Numerous studies have shown that a pathological signature of elevated CSF T-tau and P-tau with reduced Aβ1-42 identifies AD with dementia, as well as incipient AD in patients with mild cognitive impairment (MCI), with sensitivity and specificity figures of 75–95% (Zetterberg et al., 2003; Herukka et al., 2005; Hansson et al., 2006; Mattsson et al., 2009b; Shaw et al., 2009; Visser et al., 2009). However, differentiating AD from other neurodegenerative diseases remains a problem. Furthermore, it is evident that the disease mechanism of AD is very complex, involving inflammation, oxidative stress, endocrine dyscrasia, apoptosis, and other brain pathologies. It is possible that these processes can be monitored by CSF biomarkers, which could be useful in clinical practice and in research (Mattsson et al., 2009a).
The general aim of this study was to test the performance of two biochip arrays that measure biomarkers reflecting different aspects of brain injury. To that end, we analyzed 80 plasma and CSF samples from a well-documented clinical material, consisting of patients with AD, vascular dementia (VAD), frontotemporal dementia (FTD), dementia with Lewy bodies (DLB), or MCI, as well as cognitively healthy controls.
Materials and Methods
Study Participants
The study included 60 patients admitted to a memory clinic in Falköping, Sweden, for evaluation of cognitive impairment. A control group of 20 healthy age-matched individuals from the same geographical area was also included. Controls were recruited among spouses of the patients and by advertisement in local newspapers. The participants were recruited during the years 2000–2008. The controls underwent a normal neurological and psychiatric examination and had no subjective symptoms of cognitive dysfunction.
The DSM-IIIR criteria for dementia and the criteria for probable AD defined by NINCDS-ADRDA (McKhann et al., 1984) were used for AD diagnosis. Some AD patients showed signs of vascular pathology in brain imaging and were assigned to a separate group called “AD with cerebrovascular pathology” (MIX). The diagnosis MCI was made according to the criteria established by Petersen et al. (1999). Some MCI patients did not deteriorate during follow-up (median duration 3 years, range 1–7 years), and these are called “stable MCI patients” (SMCI) in this study. Subjects fulfilling the DSM-IIIR criteria for dementia (American Psychiatric Association, 1987) and the requirements for VAD defined by NINDS-AIREN (Roman et al., 1993) or VAD of the subcortical type according to the guidelines by Erkinjuntti et al. (2000) were given the diagnosis “VAD”. Patients who were diagnosed with DLB met the consensus criteria defined by McKeith et al. (1999). FTD was diagnosed through the criteria defined by Neary et al. (1998). Demographics and clinical characteristics are presented in Table 1. The participants have been previously described (Mattsson et al., 2010).
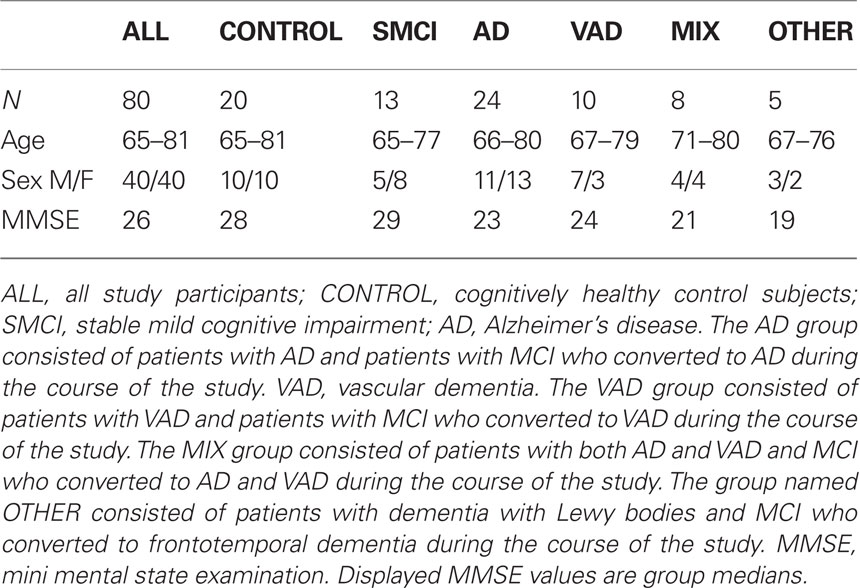
Table 1. Demographics of the study population.
Plasma and CSF Sampling
Plasma samples were collected in the morning in EDTA tubes by venipuncture. The samples were centrifuged, aliquoted, and stored at −70°C pending biochemical analyses, without being thawed and re-frozen. CSF samples were collected by lumbar puncture in the L3/L4 or L4/L5 interspace at the standardized time point 8.30–9.00 am. The first 12 mL of CSF was collected in a polypropylene tube and centrifuged at 2,000×g at +4°C for 10 min. The supernatant was pipetted off, gently mixed to avoid possible gradient effects, and aliquoted in polypropylene tubes that were stored at −70°C pending biochemical analyses, without being thawed and re-frozen.
Biochemical Analyses
Biochemical analyses were performed using the Randox biochip array technology (Fitzgerald et al., 2005). Measurements were made using the Randox Cerebral Arrays I (CRB I) and II (CRB II) (Randox Laboratories, Antrim, UK). CRB I tests for brain-derived neurotrophic factor (BDNF), heart-type fatty acid-binding protein (FABP), glial fibrillary acidic protein (GFAP), and interleukin-6 (IL6). CRB II tests for neuron-specific enolase (NSE), neutrophil gelatinase-associated lipocalin (NGAL), soluble tumor necrosis factor receptor I (TNFRI), D-dimer (DDMER), thrombomodulin (TM), and C-reactive protein (CRP). The analyses were performed according to the instructions from the manufacturer with some minor modifications, which are outlined below. A summary of the candidate biomarkers and their potential relation to brain injury is given in Table 2.
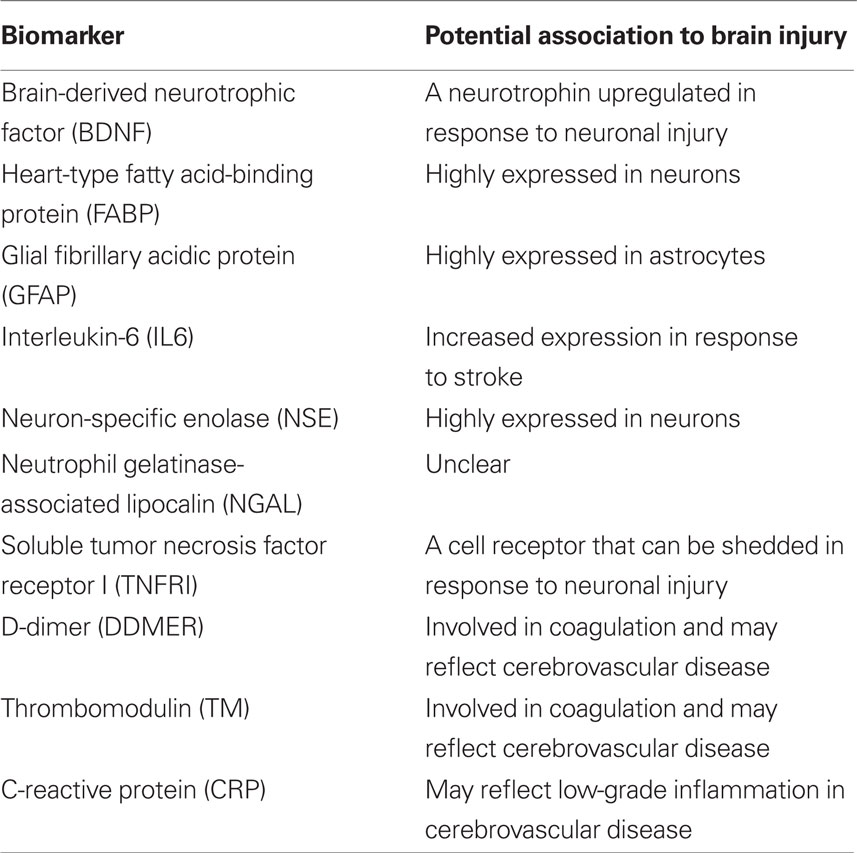
Table 2. Summary of tested candidate biomarkers.
In the analysis of plasma with CRB I, 100 μL of sample, calibrator, or control was added to each site of the biochip with 200 μL of assay buffer. The chip was then incubated for 45 min at 37°C. Unbound reagents were removed manually by two quick washes and four soaking periods. Following the addition of 300 μL of conjugate to each well, a second incubation of 45 min at 37°C was carried out. After six wash cycles, 250 μL of signal reagent (luminol and peroxide in a 1:1 ratio) was added. When 2 min had passed, the biochip was imaged in the Randox Evidence™ Investigator System.
The assay procedure for the analysis of plasma with CRB II differed from that of CRB I in some points. All calibrators, controls and samples were prediluted with dilution buffer in a clean vessel in a 1:8 ratio (35 μL plus 245 μL). For the samples originating from plasma, 200 μL of the prediluted sample and 100 μL of assay buffer were added to each well. The remaining procedure was identical to CRB I.
To increase the sensitivity of the assay, larger volumes of CSF than volumes of plasma were used. When analyzing CSF with CRB I, a sample volume of 200 μL was used, and the values obtained were therefore divided by 2. In the analysis of CSF with CRB II, the sample was prediluted in a 1:2 ratio instead of a 1:8 ratio. The values obtained were therefore divided by 4.
We used the limits of detection (LODs) provided in the Randox array manuals for CRB I and CRB II. The applicability of these detections limits was assessed by examining the standard curves. The standard curve-derived LODs agreed with the values in the manuals in all cases except for CRP for which a more accurate LOD was assigned. The employed LODs were as follows: BDNF = 0.59 pg/mL, FABP = 0.29 ng/mL, GFAP = 0.18 ng/mL, IL6 = 0.64 pg/mL, NSE = 0.26 ng/mL, NGAL = 17.8 ng/mL, TNFRI = 0.24 ng/mL, D-dimer = 2.1 ng/mL, TM = 0.5 ng/mL, CRP = 1.8 mg/L.
Statistical Analysis
The correlations of the analyte levels with the diagnostic groups were determined using GraphPad Prism 5 (GraphPad Software Inc., La Jolla, USA). As the distribution of quantitative measures was significantly skewed, statistical tests involving these variables were conducted using the non-parametric Kruskal–Wallis test for multiple variables using Dunn’s post hoc test, followed by the Mann–Whitney U-test for pair-wise comparisons. A p-value lower than 0.05 was used as a limit for significant difference between the diagnostic groups. Differences in the pattern of biomarkers between the diagnostic groups were investigated through multivariate discriminant analysis (DA) using the orthogonal projection to latent structures (OPLS) algorithm (Bylesjö et al., 2007) implemented in the software SIMCA P+ (v. 12, Umetrics, Umeå, Sweden). The quality of the models was assessed by the relationship between the total amount of explained (R2Y) and predicted (Q2) class-variation.
Results
Performance of the Arrays
Detectable levels of most analytes were found in both CSF and plasma (Figures 1–4). Detectable levels were found in less than half of subjects for CSF BDNF and DDMER, and plasma CRP, GFAP, and TNFRI. It was not possible to detect CRP in CSF in any patient. One sample of CSF was missing, making it impossible to measure BDNF, IL6, FABP, and GFAP in one patient with AD.
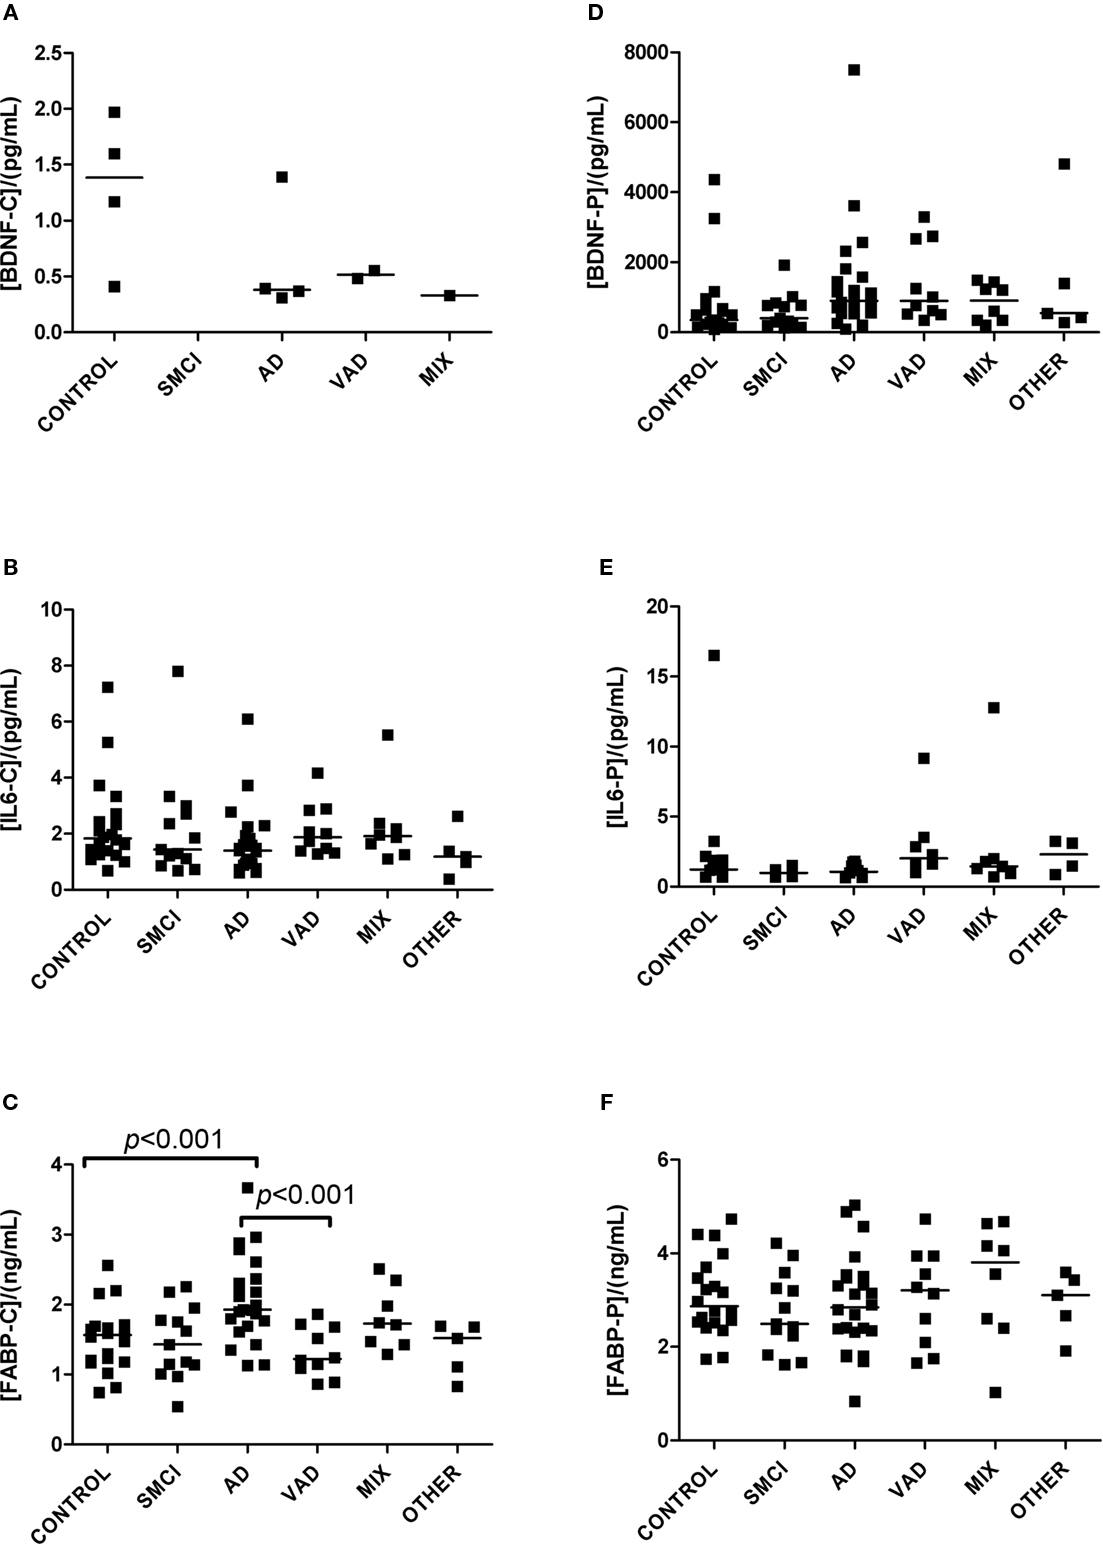
Figure 1. Levels of analytes in plasma and CSF. (A–C) Show values obtained in CSF, and (D–F) display values obtained in plasma. Significant differences between diagnostic groups are shown by brackets. Straight lines indicate median values.
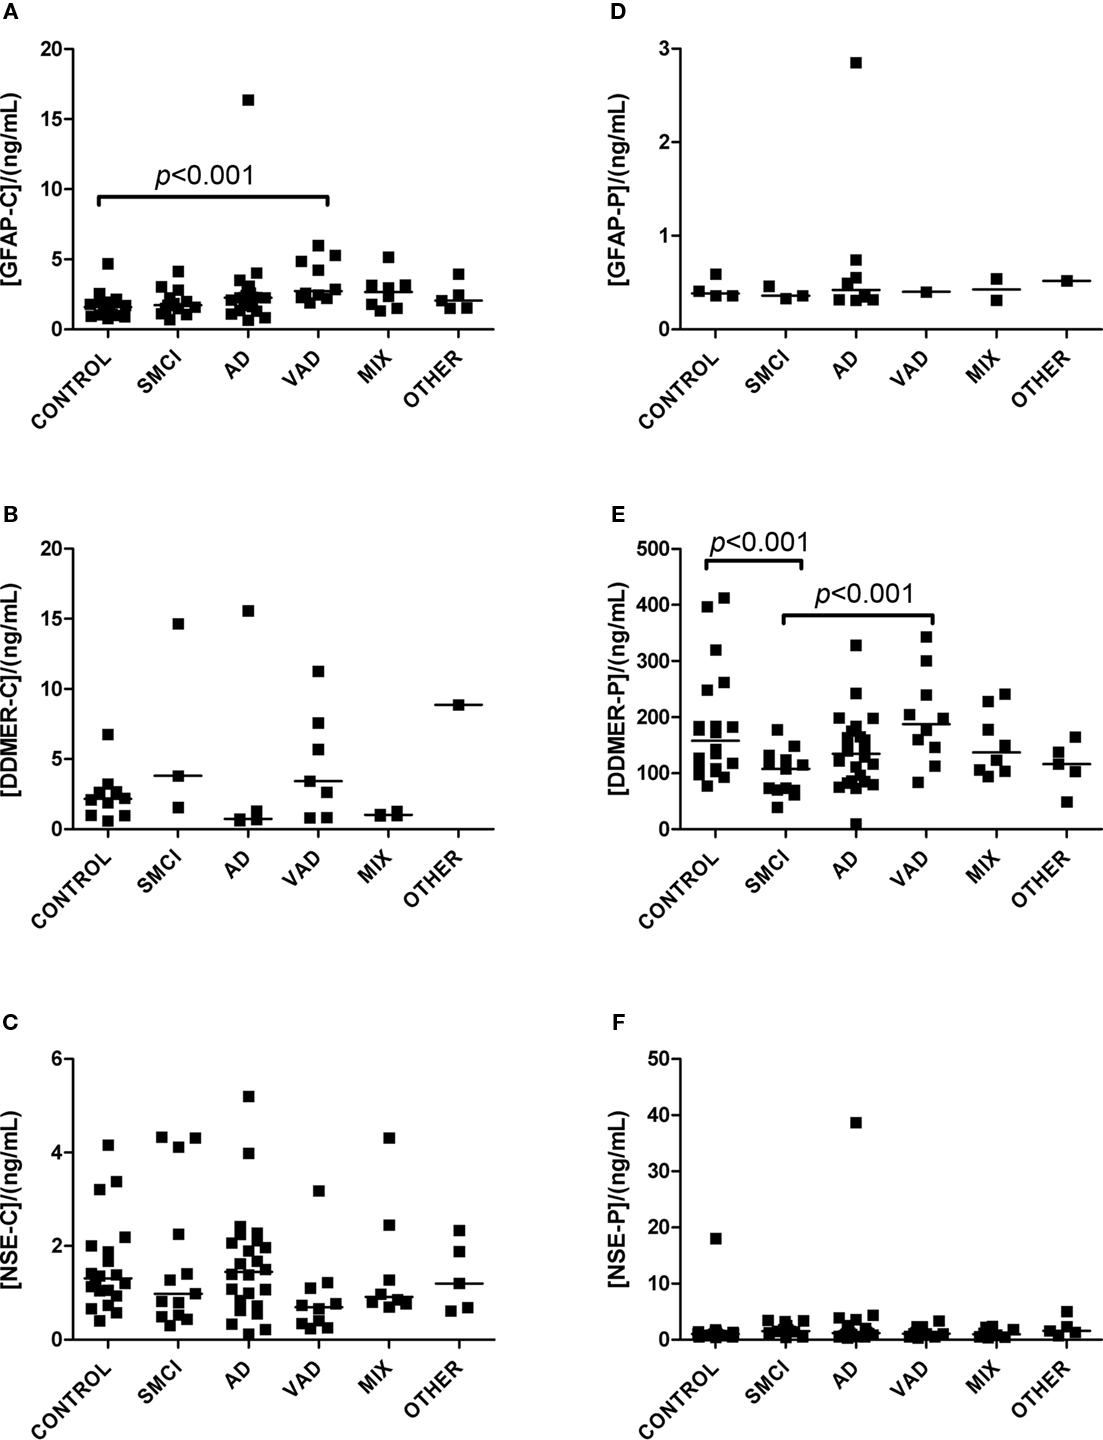
Figure 2. Levels of analytes in plasma and CSF. (A–C) Show values obtained in CSF, and (D–F) display values obtained in plasma. Significant differences between diagnostic groups are shown by brackets. Straight lines indicate median values.
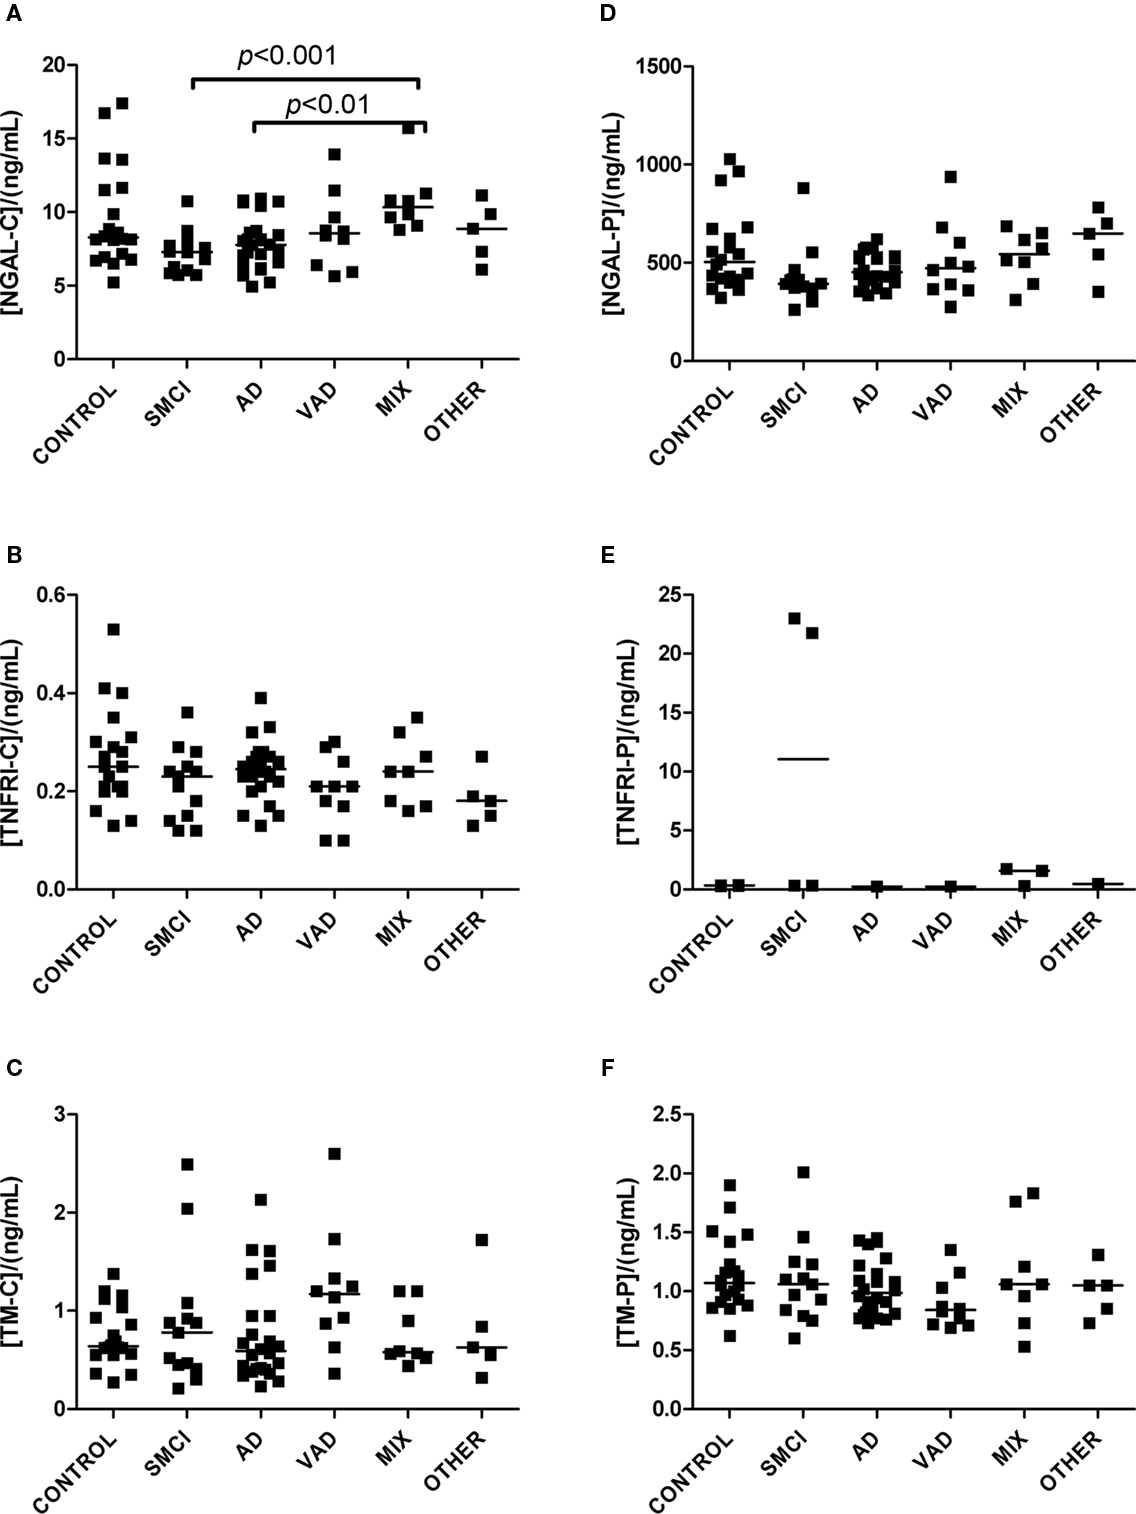
Figure 3. Levels of analytes in plasma and CSF. (A–C) Show values obtained in CSF, and (D–F) display values obtained in plasma. Significant differences between diagnostic groups are shown by brackets. Straight lines indicate median values.
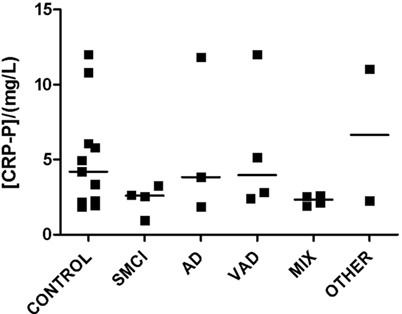
Figure 4. Levels of CRP in plasma. Straight lines indicate median values.
Levels of Biomarkers in the Diagnostic Groups
The univariate statistics showed that four biomarkers differed significantly between some of the diagnostic groups. FABP in CSF was higher in AD subjects than it was in controls (p < 0.01) and in patients with VAD (p < 0.001; Figure 1C). Subjects with VAD had higher levels of GFAP in CSF than controls (p < 0.001; Figure 2A). Measurements of DDMER in plasma showed higher levels in patients with VAD than in those with SMCI (p < 0.01) and higher levels in those with SMCI than in controls (p < 0.01; Figure 2E). NGAL in CSF was higher in AD patients with vascular risk factors (MIX) than it was in those with SMCI (p < 0.001) and in those with AD (p < 0.01; Figure 3A). Only the p-values below 0.001 survived Bonferroni correction for multiple comparisons.
Multimarker Comparisons between Diagnostic Groups
The controls and SMCI were merged into one group in the multivariate analysis. This was justified by the lack of significant differences between the two groups for most markers in the univariate analysis and the knowledge that patients with stable MCI most often do not suffer from a progressive neurodegenerative disorder (Hampel et al., 2010). The models demonstrated differences in the pattern of analyte levels between the diagnostic groups (Figures 5 and 6), although there was some overlap. The robustness of the models was estimated using the quality parameters R2Y and Q2. Although no clear-cut levels exist for when a model should be rejected, the relatively low Q2: R2Y ratios for the AD vs MIX, VAD vs MIX, and control vs MIX comparisons indicate that these models should be interpreted with caution (Table 3). The variable importance in projection (VIP) plots show clearly that the contributions of the individual analytes to the separation of the diagnostic groups differed. The most important analyte for separating AD from all other groups was FABP. In the separation of VAD and control, GFAP in CSF had the most impact, although many other analytes contributed.
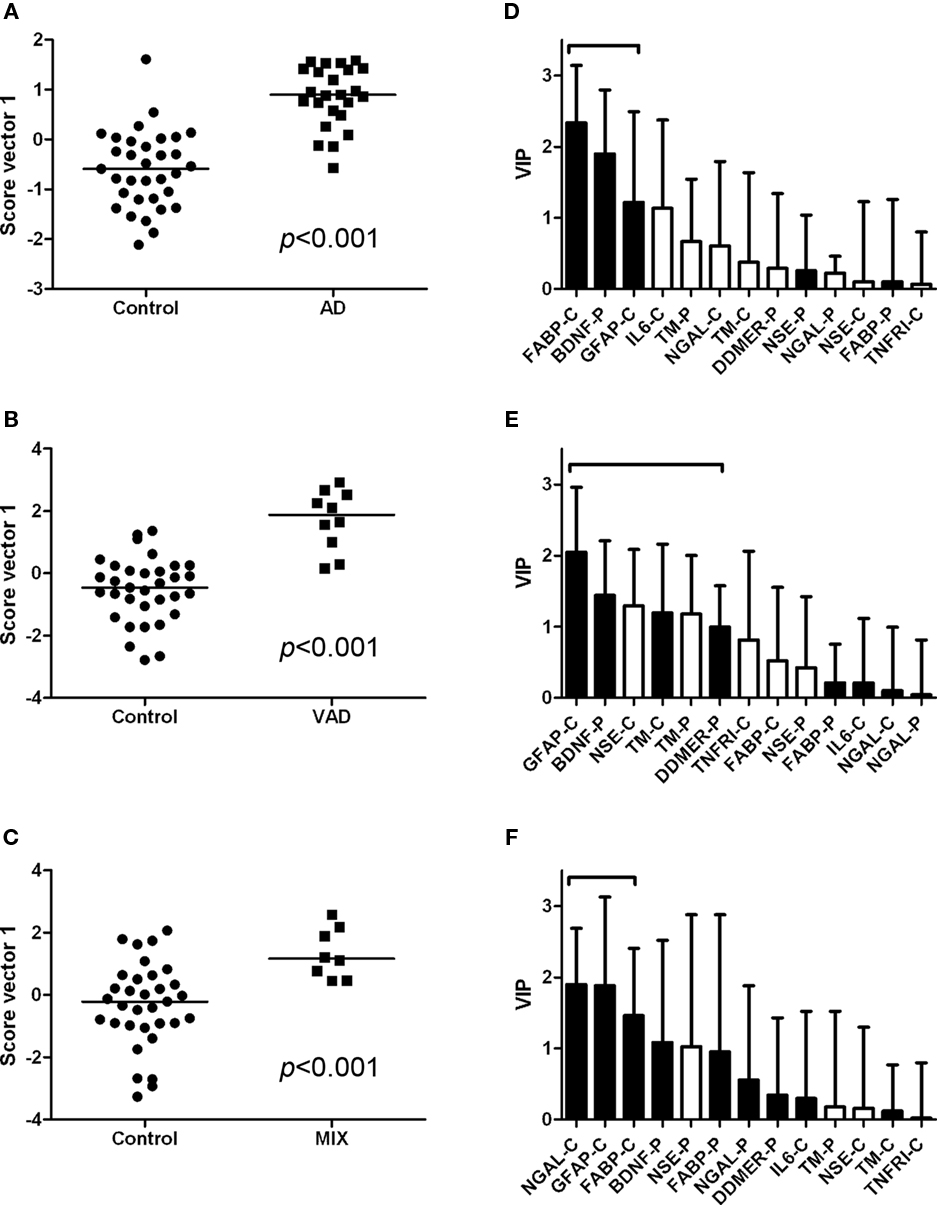
Figure 5. Scatter plots and VIP tables for the groups compared. (A–C) Show scatter plots from OPLS-DA, while (D–F) display the corresponding variable importance in projection (VIP) plots. A black bar indicates an elevated level of the analyte in the disease group, whereas a white bar indicates an elevated level in the control group. The analytes that contribute significantly to the separation of the diagnostic groups are marked with a bracket.
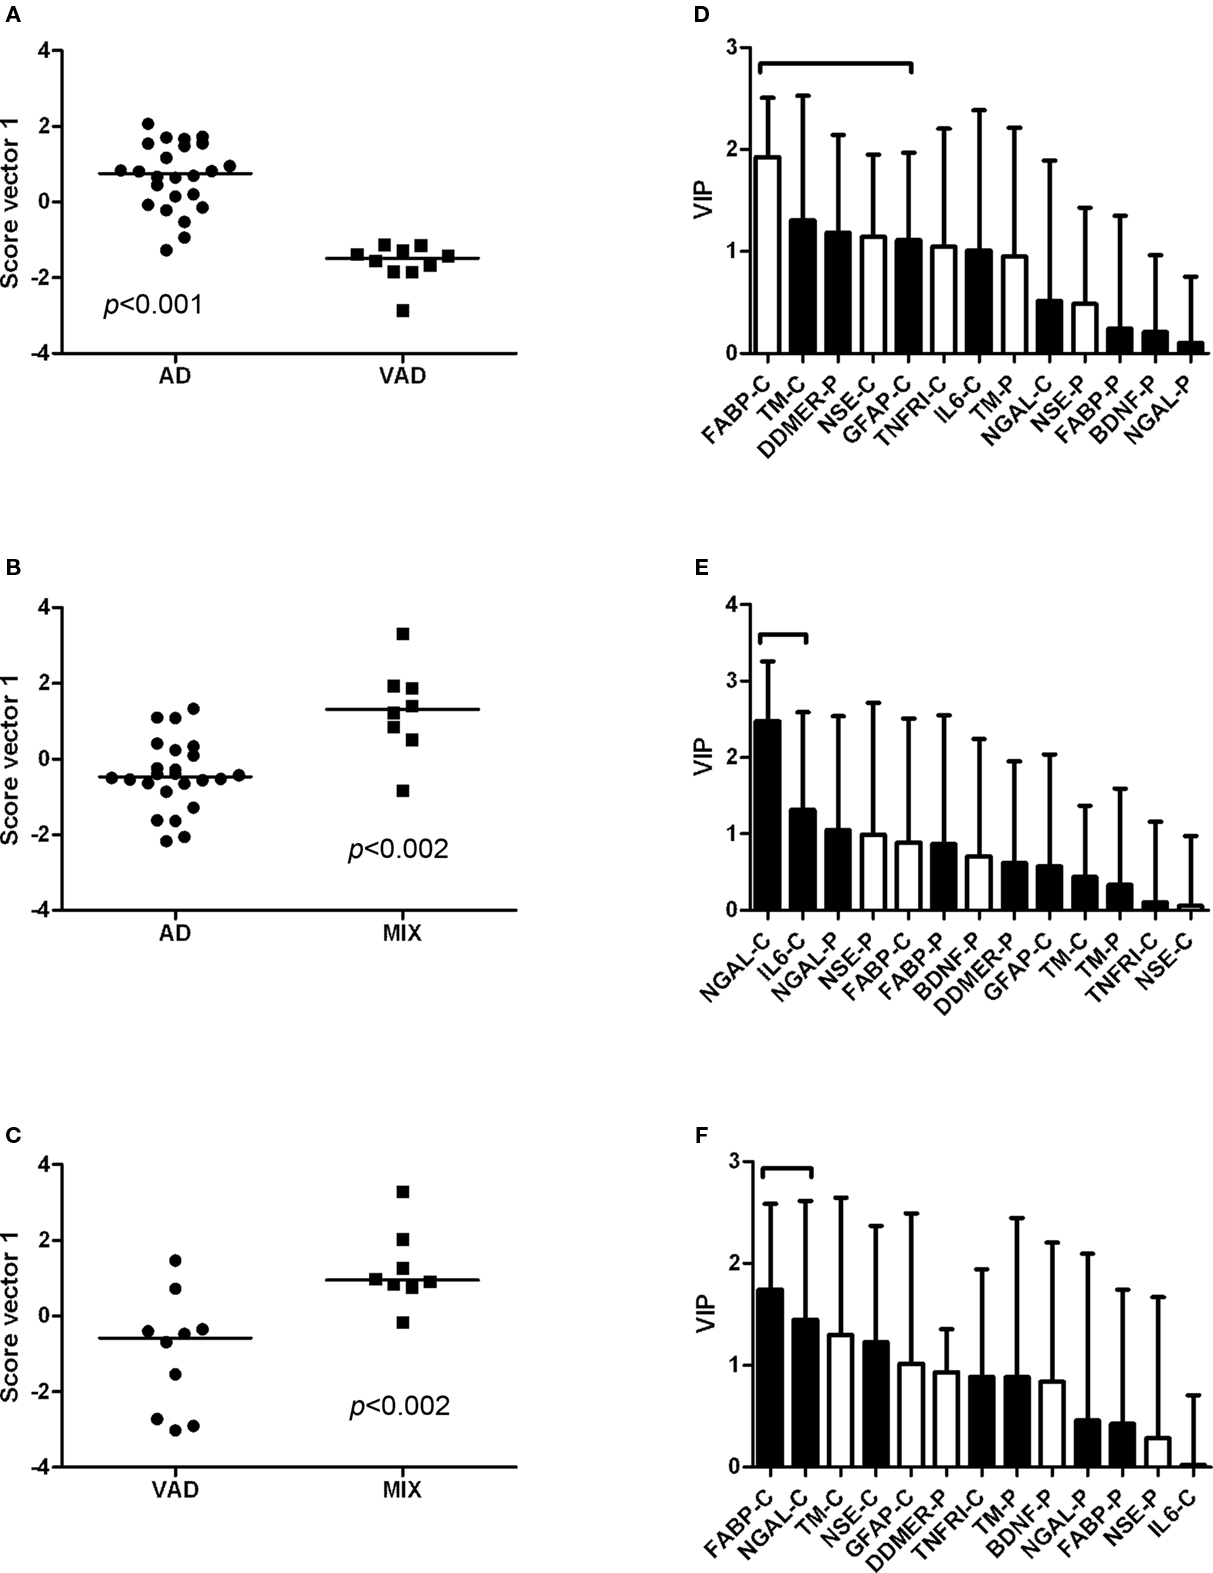
Figure 6. Scatter plots and VIP tables for the groups compared. (A–C) Show scatter plots from OPLS-DA, while (D–F) display the corresponding variable importance in projection (VIP) plots. In the upper two VIP tables, the white bars represent an elevated level of the analyte in AD, and a black bar represents an elevated level in the other group. In the lower VIP plot, elevated levels in VAD are represented by white bars and in MIX by black bars. The analytes that contribute significantly to the separation of the diagnostic groups are marked with a bracket.
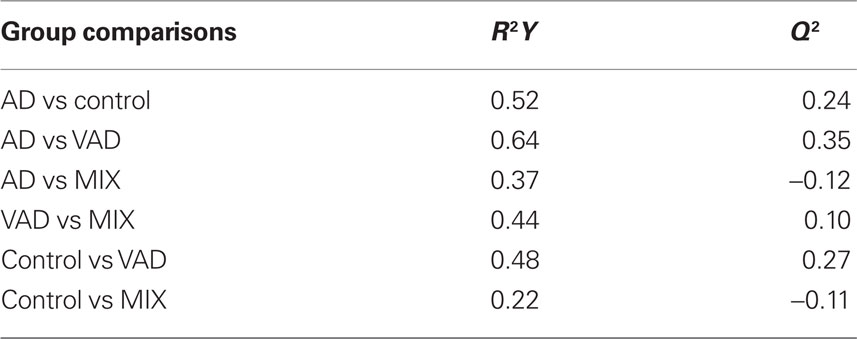
Table 3. R2Y and Q2 values for the multivariate statistics.
Correlations between Plasma and CSF Levels of the Different Markers
We examined the correlations between plasma and CSF levels of the markers. There were no significant correlations for most markers. The only exceptions were DDMER, where plasma levels decreased with high CSF levels (r = −0.37, p = 0.044) and NGAL, where there was a positive correlation between plasma and CSF levels (R = 0.45, p < 0.0001).
Discussion
Cerebrospinal fluid biomarkers have several usages in AD and will play a yet more important role if disease-modifying drugs become available (Blennow et al., 2010). Due to the complex nature of AD, and the overlap in pathology between neurodegenerative diseases, a multimarker strategy may be a key factor in clinical practice and in research. Several interesting potential biomarkers for AD have been described (Hu et al., 2010), but the results have been difficult to replicate, especially for markers in blood (Blennow et al., 2010). Although it is tempting to use blood-based biomarkers due to the easy accessibility of samples, CSF biomarkers have so far proved to be superior. This is probably due to the closer proximity of CSF to the brain tissue, and thereby to pathological processes in the brain.
We have been able to measure a number of analytes potentially related to neurodegeneration in both CSF and plasma from a clinically well-defined material of patients with neurodegenerative disorders using the Randox biochip method. The findings included elevated levels of CSF FABP in patients with AD and elevated levels of CSF GFAP, CSF NGAL, and plasma DDMER in patients with cerebrovascular disease. Notably, there was a large overlap in biomarker levels across the diagnostic groups and no biomarker was by itself disease-specific.
Fatty acid-binding protein is a small protein involved in the uptake, transport, and metabolism of fatty acids (Storch and McDermott, 2009). Nine different isoforms of FABP have been identified, and each has a specific pattern of tissue distribution. Heart-type FABP is expressed in the brain and in other organs, and has been identified as a potential marker for brain injury (Pelsers et al., 2005). In our study, CSF levels of FABP were clearly elevated in patients with AD, those with incipient AD, and those with clinical AD and concomitant cerebrovascular disease. These data are consistent with previous findings (Steinacker et al., 2004), and suggest that FABP has a potential role as a biomarker for AD.
Cerebrospinal fluid levels of GFAP were higher in patients with VAD than in controls. GFAP is a monomeric intermediate filament protein expressed almost exclusively in astrocytes, where it represents the major part of the cytoskeleton (Herrmann et al., 2000). Increased levels of GFAP have been found in the CSF and blood of patients with various neurological conditions (Lamers et al., 2003), including patients with AD and VAD (Verbeek et al., 2003). We conclude that increased levels of GFAP are not specific for any neurodegenerative disease.
Patients with AD and vascular risk factors had higher levels of NGAL in CSF than patients with SMCI and pure AD. NGAL is a protein found in the granules of neutrophils. It is released when the neutrophils are activated and is therefore considered to be a marker for neutrophil activation (Xu and Venge, 2000). The importance of elevated NGAL in the context of neurodegenerative diseases is not known, and this must be verified and further evaluated. The tendency toward different NGAL levels in the control and SMCI groups is peculiar and calls for caution when interpreting the data.
D-dimer is a product of the plasmin-mediated breakdown of fibrin (Keeling et al., 2004) and increased plasma levels have previously been associated with VAD (Gupta et al., 2005). This is confirmed by our findings.
The multivariate statistical model succeeded in separating the diagnostic groups, although with some overlap. Only some of the biomarkers contributed significantly to the separations, which is indicated by the VIP plots. This may be considered in the future design of biochips, providing chips that are equipped only with antibodies relevant for certain applications. Bearing in mind the low Q2 to R2Y ratios, there is a large uncertainty concerning the multivariate comparisons for AD vs MIX, VAD vs MIX, and control vs MIX. One probable explanation for the poor ratio is the small size of the MIX diagnostic group. The results from the multivariate statistics as such may only be valid for the population studied. Thus, more studies are required to verify the model in other populations.
In summary, we have shown that the biochip arrays studied can be applied to samples of plasma and CSF. Some statistically significant differences in biomarker concentrations were seen in the different diagnostic groups but none of the tested markers was by itself disease-specific: the clearest association was that of CSF FABP with AD. More studies are needed to verify the potential of each candidate biomarker, as well as the diagnostic performance of the multivariate statistical model.
Conflict of Interest Statement
The authors declare that the research was conducted in the absence of any commercial or financial relationships that could be construed as a potential conflict of interest.
Acknowledgments
We thank Rita Persson for skillful technical assistance and Harald Skafte for help with initiating the study. This study was supported by grants from the Swedish Research Council, Region Västra Götaland, the Royal Swedish Academy of Sciences and the Alzheimer’s Association.
References
American Psychiatric Association. (1987). Diagnostic and Statistical Manual of Mental Disorders. Arlington, VA: American Psychiatric Association.
Blennow, K., Hampel, H., Weiner, M., and Zetterberg, H. (2010). Cerebrospinal fluid and plasma biomarkers in Alzheimer disease. Nat. Rev. Neurol. 6, 131–144.
Bylesjö, M., Rantalainen, M., Cloarec, O., Nicholson, J., Holmes, E., and Trygg, J. (2007). OPLS discriminant analysis: combining the strengths of PLS-DA and SIMCA classification. J. Chemom. 20, 341–351.
Erkinjuntti, T., Inzitari, D., Pantoni, L., Wallin, A., Scheltens, P., Rockwood, K., Roman, G. C., Chui, H., and Desmond, D. W. (2000). Research criteria for subcortical vascular dementia in clinical trials. J. Neural Transm. Suppl. 59, 23–30.
Fitzgerald, S. P., Lamont, J. V., McConnell, R. I., and Benchikh el, O. (2005). Development of a high-throughput automated analyzer using biochip array technology. Clin. Chem. 51, 1165–1176.
Gupta, A., Watkins, A., Thomas, P., Majer, R., Habubi, N., Morris, G., and Pansari, K. (2005). Coagulation and inflammatory markers in Alzheimer’s and vascular dementia. Int. J. Clin. Pract. 59, 52–57.
Hampel, H., Frank, R., Broich, K., Teipel, S. J., Katz, R. G., Hardy, J., Herholz, K., Bokde, A. L., Jessen, F., Hoessler, Y. C., Sanhai, W. R., Zetterberg, H., Woodcock, J., and Blennow, K. (2010). Biomarkers for Alzheimer’s disease: academic, industry and regulatory perspectives. Nat. Rev. Drug Discov. 9, 560–574.
Hansson, O., Zetterberg, H., Buchhave, P., Londos, E., Blennow, K., and Minthon, L. (2006). Association between CSF biomarkers and incipient Alzheimer’s disease in patients with mild cognitive impairment: a follow-up study. Lancet Neurol. 5, 228–234.
Herrmann, M., Vos, P., Wunderlich, M. T., de Bruijn, C. H., and Lamers, K. J. (2000). Release of glial tissue-specific proteins after acute stroke: a comparative analysis of serum concentrations of protein S-100B and glial fibrillary acidic protein. Stroke 31, 2670–2677.
Herukka, S. K., Hallikainen, M., Soininen, H., and Pirttila, T. (2005). CSF Abeta42 and tau or phosphorylated tau and prediction of progressive mild cognitive impairment. Neurology 64, 1294–1297.
Hu, W. T., Chen-Plotkin, A., Arnold, S. E., Grossman, M., Clark, C. M., Shaw, L. M., Pickering, E., Kuhn, M., Chen, Y., McCluskey, L., Elman, L., Karlawish, J., Hurtig, H. I., Siderowf, A., Lee, V. M., Soares, H., and Trojanowski, J. Q. (2010). Novel CSF biomarkers for Alzheimer’s disease and mild cognitive impairment. Acta Neuropathol. 119, 669–678.
Jellinger, K. A. (2010). Basic mechanisms of neurodegeneration: a critical update. J. Cell. Mol. Med. 14, 457–487.
Keeling, D. M., Mackie, I. J., Moody, A., and Watson, H. G. (2004). The diagnosis of deep vein thrombosis in symptomatic outpatients and the potential for clinical assessment and D-dimer assays to reduce the need for diagnostic imaging. Br. J. Haematol. 124, 15–25.
Lamers, K. J., Vos, P., Verbeek, M. M., Rosmalen, F., van Geel, W. J., and van Engelen, B. G. (2003). Protein S-100B, neuron-specific enolase (NSE), myelin basic protein (MBP) and glial fibrillary acidic protein (GFAP) in cerebrospinal fluid (CSF) and blood of neurological patients. Brain Res. Bull. 61, 261–264.
Mattsson, N., Blennow, K., and Zetterberg, H. (2009a). CSF biomarkers: pinpointing Alzheimer pathogenesis. Ann. N. Y. Acad. Sci. 1180, 28–35.
Mattsson, N., Zetterberg, H., Hansson, O., Andreasen, N., Parnetti, L., Jonsson, M., Herukka, S. K., van der Flier, W. M., Blankenstein, M. A., Ewers, M., Rich, K., Kaiser, E., Verbeek, M., Tsolaki, M., Mulugeta, E., Rosen, E., Aarsland, D., Visser, P. J., Schröder, J., Marcusson, J., de Leon, M., Hampel, H., Scheltens, P., Pirttilä, T., Wallin, A., Jönhagen, M. E., Minthon, L., Winblad, B., and Blennow, K. (2009b). CSF biomarkers and incipient Alzheimer disease in patients with mild cognitive impairment. JAMA 302, 385–393.
Mattsson, N., Johansson, P., Hansson, O., Wallin, A., Johansson, J. O., Andreasson, U., Andersen, O., Haghighi, S., Olsson, M., Stridsberg, M., Svensson, J., Blennow, K., and Zetterberg, H. (2010). Converging pathways of chromogranin and amyloid metabolism in the brain. J. Alzheimers Dis. 20, 1039–1049.
McKeith, I. G., Perry, E. K., and Perry, R. H. (1999). Report of the second dementia with Lewy body international workshop: diagnosis and treatment. Consortium on Dementia with Lewy Bodies. Neurology 53, 902–905.
McKhann, G., Drachman, D., Folstein, M., Katzman, R., Price, D., and Stadlan, E. M. (1984). Clinical diagnosis of Alzheimer’s disease: report of the NINCDS-ADRDA Work Group under the auspices of Department of Health and Human Services Task Force on Alzheimer’s Disease. Neurology 34, 939–944.
Neary, D., Snowden, J. S., Gustafson, L., Passant, U., Stuss, D., Black, S., Freedman, M., Kertesz, A., Robert, P. H., Albert, M., Boone, K., Miller, B. L., Cummings, J., and Benson, D. F. (1998). Frontotemporal lobar degeneration: a consensus on clinical diagnostic criteria. Neurology 51, 1546–1554.
Pelsers, M. M., Hermens, W. T., and Glatz, J. F. (2005). Fatty acid-binding proteins as plasma markers of tissue injury. Clin. Chim. Acta 352, 15–35.
Petersen, R. C., Smith, G. E., Waring, S. C., Ivnik, R. J., Tangalos, E. G., and Kokmen, E. (1999). Mild cognitive impairment: clinical characterization and outcome. Arch. Neurol. 56, 303–308.
Roman, G. C., Tatemichi, T. K., Erkinjuntti, T., Cummings, J. L., Masdeu, J. C., Garcia, J. H., Amaducci, L., Orgogozo, J. M., Brun, A., Hofman, A., Moody, D. M., O’Brien, M. D., Yamaguchi, T., Grafman, J., Drayer, B. P., Bennett, D. A., Fisher, M., Ogata, J., Kokmen, E., Bermejo, F., Wolf, P. A., Gorelick, P. B., Bick, K. L., Pajeau, A. K., Bell, M. A., DeCarli, C., Culebras, A., Korczyn, A. D., Bogousslavsky, J., Hartmann, A., and Scheinberg, P. (1993). Vascular dementia: diagnostic criteria for research studies. Report of the NINDS-AIREN International Workshop. Neurology 43, 250–260.
Shaw, L. M., Vanderstichele, H., Knapik-Czajka, M., Clark, C. M., Aisen, P. S., Petersen, R. C., Blennow, K., Soares, H., Simon, A., Lewczuk, P., Dean, R., Siemers, E., Potter, W., Lee, V. M., and Trojanowski, J. Q. (2009). Cerebrospinal fluid biomarker signature in Alzheimer’s disease neuroimaging initiative subjects. Ann. Neurol. 65, 403–413.
Steinacker, P., Mollenhauer, B., Bibl, M., Cepek, L., Esselmann, H., Brechlin, P., Lewczuk, P., Poser, S., Kretzschmar, H. A., Wiltfang, J., Trenkwalder, C., and Otto, M. (2004). Heart fatty acid binding protein as a potential diagnostic marker for neurodegenerative diseases. Neurosci. Lett. 370, 36–39.
Storch, J., and McDermott, L. (2009). Structural and functional analysis of fatty acid-binding proteins. J. Lipid Res. 50, S126–S131.
Verbeek, M. M., De Jong, D., and Kremer, H. P. (2003). Brain-specific proteins in cerebrospinal fluid for the diagnosis of neurodegenerative diseases. Ann. Clin. Biochem. 40, 25–40.
Visser, P. J., Verhey, F., Knol, D. L., Scheltens, P., Wahlund, L. O., Freund-Levi, Y., Tsolaki, M., Minthon, L., Wallin, A. K., Hampel, H., Burger, K., Pirttila, T., Soininen, H., Rikkert, M. O., Verbeek, M. M., Spiru, L., and Blennow, K. (2009). Prevalence and prognostic value of CSF markers of Alzheimer’s disease pathology in patients with subjective cognitive impairment or mild cognitive impairment in the DESCRIPA study: a prospective cohort study. Lancet Neurol. 8, 619–627.
Xu, S., and Venge, P. (2000). Lipocalins as biochemical markers of disease. Biochim. Biophys. Acta 1482, 298–307.
Keywords: neurodegenerative diseases, Alzheimer, fatty acid-binding protein, biochip
Citation: Rosén C, Mattsson N, Johansson PM, Andreasson U, Wallin A, Hansson O, Johansson J-O, Lamont J, Svensson J, Blennow K and Zetterberg H (2011) Discriminatory analysis of biochip-derived protein patterns in CSF and plasma in neurodegenerative diseases. Front. Ag. Neurosci. 3:1. doi: 10.3389/fnagi.2011.00001
Received: 18 October 2010;
Paper pending published: 02 November 2010;
Accepted: 12 January 2011;
Published online: 31 January 2011.
Edited by:
George Perry, The University of Texas at San Antonio, USAReviewed by:
Raul Mena, Centro de Investigación y de Estudios Avanzados del Instituto Politécnico Nacional, MexicoCraig Atwood, University of Wisconsin, USA
Hyoung-Gon Lee, Case Western Reserve University, USA
Copyright: © 2011 Rosén, Mattsson, Johansson, Andreasson, Wallin, Hansson, Johansson, Lamont, Svensson, Blennow and Zetterberg. This is an open-access article subject to an exclusive license agreement between the authors and Frontiers Media SA, which permits unrestricted use, distribution, and reproduction in any medium, provided the original authors and source are credited.
*Correspondence: Henrik Zetterberg, Clinical Neurochemistry Laboratory, Department of Psychiatry and Neurochemistry, Institute of Neuroscience and Physiology, The Sahlgrenska Academy at the University of Gothenburg, S-431 80 Mölndal, Sweden. e-mail: henrik.zetterberg@gu.se