Sub-regional hippocampal injury is associated with fornix degeneration in Alzheimer’s disease
- 1 Imaging of Dementia and Aging Laboratory, Department of Neurology, Center for Neuroscience, University of California at Davis, Davis, CA, USA
- 2 Department of Neuropsychiatry, Seoul National University College of Medicine, Seoul, Korea
- 3 Department of Neurology, University of California at Davis, Sacramento, CA, USA
- 4 Department of Radiology, University of California at Davis, Sacramento, CA, USA
We examined in vivo evidence of axonal degeneration in association with neuronal pathology in Alzheimer’s disease (AD) through analysis of fornix microstructural integrity and measures of hippocampal subfield atrophy. Based on known anatomical topography, we hypothesized that the local thickness of subiculum and CA1 hippocampus fields would be associated with fornix integrity, reflecting an association between AD-related injury to hippocampal neurons and degeneration of associated axon fibers. To test this hypothesis, multi-modal imaging, combining measures of local hippocampal radii with diffusion tensor imaging (DTI), was applied to 44 individuals clinically diagnosed with AD, 44 individuals clinically diagnosed with mild cognitive impairment (MCI), and 96 cognitively normal individuals. Fornix microstructural degradation, as measured by reduced DTI-based fractional anisotropy (FA), was prominent in both MCI and AD, and was associated with reduced hippocampal volumes. Further, reduced fornix FA was associated with reduced anterior CA1 and antero-medial subiculum thickness. Finally, while both lesser fornix FA and lesser hippocampal volume were associated with lesser episodic memory, only the hippocampal measures were significant predictors of episodic memory in models including both hippocampal and fornix predictors. The region-specific association between fornix integrity and hippocampal neuronal death may provide in vivo evidence for degenerative white matter injury in AD: axonal pathology that is closely linked to neuronal injury.
Introduction
Neuropathological changes associated with Alzheimer’s disease (AD) begin in medial temporal structures including the hippocampus (Ball, 1977; Braak and Braak, 1991). Hippocampal damage in AD features pyramidal cell neuron loss in the CA1 subfield and subiculum early in the process (Ball, 1977; Mann et al., 1985; Doebler et al., 1987; Davies et al., 1992). Consistent with this pathological finding, recent in vivo magnetic resonance imaging (MRI) studies report significant volume loss within CA1 and subiculum in AD (Csernansky et al., 2000; Wang et al., 2006; Scher et al., 2007; Chetelat et al., 2008; Frisoni et al., 2008; Xie et al., 2009; Carmichael et al., 2011) and even mild cognitive impairment (MCI; Chetelat et al., 2008), a clinical syndrome believed to represent a preclinical stage of AD (Apostolova and Thompson, 2008). Because the hippocampus is considered the major neural structure underlying episodic memory impairments that are the earliest and the most prominent clinical manifestation of AD dementia (Soininen and Scheltens, 1998; Deweer et al., 2001), the sub-regional hippocampus measures have potential as markers of brain injury that underlies the earliest cognitive symptoms leading to eventual AD dementia.
However, a number of AD studies have also observed injury to the fornix, the main axonal output pathway from the hippocampus to the mammillary body (Brodal, 1981; Aggleton and Brown, 1999; Aggleton et al., 2005). Several such studies have used fractional anisotropy (FA) derived from diffusion tensor imaging (DTI) as a measure of anisotropic water diffusion, which is believed to reflect the microstructural integrity of white matter fibers including the axon and surrounding myelin (Assaf and Pasternak, 2008; Mielke et al., 2009; Pievani et al., 2010; Agosta et al., 2011). Because the subiculum and CA1 hippocampal subfields are believed to be principal sources of hippocampal efferent fibers passing through the fornix (Rosene and Van Hoesen, 1977; Krayniak et al., 1979; Thierry et al., 2000; Aggleton et al., 2005; Cenquizca and Swanson, 2007), these findings may suggest that damage to axons connected to early sites of neuronal injury in AD may play a prominent role in the AD pathological process.
Unfortunately, the relationship between hippocampal neuronal injury and fornix injury in AD has received little study. To our knowledge, only one study to date reported a significant association between total hippocampal volume and fornix white matter integrity (Cenquizca and Swanson, 2007) although the regional specificity of that relationship to hippocampal subfields, as well as associations between both forms of injury and cognition, was not explored. Clarifying the relationships between region-specific hippocampal injury, fornix axonal injury, and cognition is important for three key reasons. First, axonal pathology with abnormal axonal transport or myelin breakdown may be a contributing factor to neuronal loss in AD (de la Monte, 1989; Bartzokis, 2004, 2011; Stokin et al., 2005), although this hypothesis has not been conclusively confirmed (Muresan and Muresan, 2009). Second, understanding the relation of axonal to cellular degeneration in AD may offer new avenues of therapeutic intervention (Bartzokis et al., 2004a; Bartzokis, 2011). Third, because successful memory function requires not only intact hippocampi but intact connectivity between hippocampi and a distributed network of memory-relevant structures (Aggleton and Brown, 1999), imaging markers of injury to hippocampal axonal outputs may provide a more complete accounting of brain injury that is relevant to clinically relevant memory loss early in the AD process.
Based on the known anatomical connectivity between the hippocampus and fornix, we hypothesized that in MCI and AD, axonopathy (as measured by reduced fornix FA) would be associated with neuronal pathology (as measured by regional hippocampus atrophy). To test this hypothesis, we began with a global approach of associating total hippocampal volume with overall fornix FA; we then examined whether hippocampal subregion atrophy was associated with reduced fornix FA in the predicted topographical manner. The behavioral relevance of these findings was further tested by examining fornix FA and hippocampal volume as predictors of domain-specific cognitive performance.
Materials and Methods
Subjects
Subjects included 44 AD, 44 MCI, and 96 CN individuals. The AD group consisted of 86.4% patients with probable AD and 13.6% patients with possible AD. All MCI patients were of the amnestic subtype based on current consensus criteria for amnestic MCI (Winblad et al., 2004). The diagnosis of AD was made according to the National Institute of Neurological and Communication Disorders and Stroke/AD and Related Disorders Association criteria (McKhann et al., 1984). Although no strict psychometric cut-off scores were used to define cognitive impairment, memory impairment was defined clinically when a participant’s performance fell approximately 1.5 SDs below age-matched norms and in reference to their educational and socioeconomic background. No patient had clinical history of stroke. CN was diagnosed if there was no clinically significant cognitive impairment.
Subjects were recruited from the AD Center at the University of California, Davis. All participants received a comprehensive clinical evaluation and neuropsychological testing with a standardized test battery (Morris et al., 2006). The presence or absence of stroke, diabetes, hyperlipidemia, transient ischemic attack, hypertension, and coronary artery disease was systematically assessed to create a composite score for vascular risks that was the sum of the factors present ranging 0–6 and reported as a percentage (Lee et al., 2009). In addition, all subjects received a standardized MRI scan of the brain at the baseline evaluation. The institutional review boards at all participating institutions approved this study, and subjects or their legal representatives gave written informed consent.
Image Acquisition
All brain imaging was performed at the University of California at Davis Imaging Research Center on a 1.5-T GE Signa Horizon LX EchoSpeed system. A 3D T1-weighted coronal spoiled gradient-recalled echo acquisition (T1 SPGR: TR 9.1 ms, flip angle 15°, field of view 24 and slice thickness 1.5 mm) and an Axial-oblique 2D DTI sequence based on single-shot spin-echo echo planar imaging (SE-EPI) with a TE of 94 ms, a TR of 8000 ms and a Flip angle of 90° were used to acquire the imaging data. The B-value was 1000 s/mm2 with six gradient directions collected four times each, along with two B0 images. Ramp sampling was off, but phase correction for EPI was invoked. An FA map derived from DTI was obtained according to previously reported methods (Lee et al., 2009).
Mean Fornix FA Calculation
In order to obtain mean fornix FA values for each subject, the fornix body region of interest (ROI) was first delineated in subject native space using an automatic image warping that fitted a template mask to the native T1-weighted image. The steps to accomplish this fit are as follows:
Fornix body mask
A fornix body ROI covering the entire body part of the fornix, which contains all axonal fibers passing through the fornix, was drawn by one of the authors (CD) with substantial experience in neuroanatomy on a minimal deformation template (MDT; Kochunov et al., 2001). This mask did not include the column and crux of the fornix because these regions are too small to be reliably extracted through an ROI approach.
Automatic fitting of fornix body mask
Before the transformation steps, subject T1-weighted images were first stripped of the skull using an in-house semi-automatic algorithm that included a user-guided cleanup phase to insure accurate brain boundaries. The fit of the template fornix body mask onto subject T1-weighted images relied on registration between the MDT template and the subject T1-weighted image including linear alignment followed by B-spline warping. This method of image registration has been previously described (Lee et al., 2009). The registration of subject T1-weighted images to the template allowed the template fornix mask to be fitted to the subject’s anatomy. The subject FA image was also linearly registered to its corresponding T1-weighted image. After this automatic fitting process, we visually inspected every subject T1-weighted image and transformed fornix mask to confirm that the mask was well fitted to the fornix body in every subject.
Tissue segmentation
Segmentation of gray matter, white matter, and CSF was performed on subject T1-weighted images by an in-house computer program using Bayesian maximum-likelihood EM computation (Dempster et al., 1977). Tissue probabilities used a combination of Gaussian intensity distributions and a Markov random field (MRF) for modeling tissue classification of voxel neighborhoods.
Fornix ROI body FA calculation
To avoid artifactual FA reductions due to CSF voxels erroneously included in the automatically fitted fornix body mask, only voxels classified as white matter in the tissue segmentation were finally included in each fornix ROI body mask. The mean FA value was calculated within each fornix ROI body based on the subject FA image aligned to the subject T1-weighted image.
Hippocampus Manual Tracing
Boundaries of the hippocampus of each subject were manually traced on the native T1-weighted image according to previously described methods (DeCarli et al., 2008). We used the anterior two-thirds of the hippocampus that contains most of CA1 and subiculum neurons whose axons are included in the fornix. Hippocampus volume was corrected for head size (percentage total cranial volume). Reliability of hippocampus volume using this method is quite good with intra-rater intraclass correlation coefficients of 0.98 for right hippocampus and 0.96 for left hippocampus, and intra-rater, inter-scanner intraclass correlation coefficient of 0.87 for bilateral hippocampus volume (see Carmichael et al., 2012 for details).
3D Mapping of Regional Hippocampal Thickness, Fornix FA, and Their Association
We used 3D hippocampal radius mapping (Thompson et al., 2004) to provide spatially localized measures of hippocampal thickness. The manually traced right and left hippocampal masks were converted to smooth high-resolution mesh surfaces. These meshes were linearly transformed using a 12-parameter affine transformation onto hippocampal masks in the template space. This transformation reduced global differences in position and scaling over the population of hippocampi, while preserving local variations in shape. In the template space the transformed meshes were converted into a set of in-slice radial lines emanating from the centroid of hippocampal area on each slice. The number of centroids and radii from each centroid were standardized to the set of radii for the right and left template hippocampi. The lengths of the radial lines provided localized thickness measurements at standardized locations on each right and left hippocampus. These thickness values were used as dependent variables in group comparisons, and dependent or independent variables in regression analyses.
For voxel-based analysis of fornix FA, each individual FA image registered to the native T1-weighted image (as described in the methods above) was warped onto the MDT through affine transformation and high-dimensional B-spline transformation previously described (Lee et al., 2009).
Group differences between CN and AD in hippocampus thickness were evaluated at every 3D surface point of the MDT hippocampus, and group differences in FA were evaluated at every voxel within the fornix body mask in MDT space. Hippocampus surface points showing significant group differences were collected into a statistical hippocampus ROI, and fornix voxels showing significant group differences were collected into a statistical fornix ROI. For each hippocampus surface point, a regression model assessed the association between thickness (dependent variable) and mean FA of the statistical fornix ROI (independent variable). For each voxel in the fornix mask (dependent variable), a regression model assessed the association between FA and mean thickness within the statistical hippocampus ROI (independent variable). All regression models included age and gender as nuisance covariates. Non-parametric permutation testing was used to correct for multiple comparisons while providing significance values for the regression models, using p < 0.05 as a significance threshold (Nichols and Holmes, 2002; Thompson et al., 2003).
The results of hippocampal thickness group comparisons (p-value and percent difference maps) were displayed on a 3D hippocampal mesh surface in the space of the MDT (Figure 3). Approximate boundaries of cytoarchitectonic hippocampal fields were schematically mapped onto the same hippocampal surface (Figure 3A) in consultation with a well-established source (Duvernoy, 2005). To demonstrate region-specific associations between the fornix and hippocampus, we displayed in Figure 4 fornix and hippocampus surfaces in MDT space showing: (a) p-values for CN vs. AD group comparisons for both fornix FA and hippocampal RD, (b) the fornix statistical ROI and, at each hippocampal surface point, the p-value for the association between fornix statistical ROI mean FA and local hippocampus thickness, and (c) the hippocampus statistical ROI, and, for every voxel intersecting the fornix surface, the p-value for the association between hippocampus statistical ROI mean thickness and FA. Additional views of the hippocampus p-values in Figure 4B, along with an analogous R2 map, is shown in Figure 5.
Other Statistical Analysis
Demographic, clinical and global MRI summary variables from the CN, MCI, and AD groups were compared by one-way analysis of variance (ANOVA) with post hoc pair wise comparisons using Tukey correction for multiple comparisons. Group differences in total hippocampal volume and statistical fornix ROI mean FA were tested by analyses of covariance (ANCOVAs) with age and gender as covariates, using Tukey post hoc correction. The association between fornix body ROI mean FA and total hippocampal volume was evaluated in a multiple linear regression model with fornix body ROI mean FA as the dependent variable and hippocampus volume, age and gender as independent variables. Associations between cognitive variables and hippocampus and fornix predictors was assessed in multiple linear regression models with the cognitive variables as dependent variables; hippocampal volume, fornix FA, or both as independent variables; and age, education, and gender as additional independent variables. Unless otherwise specified, p-values less than 0.05 were regarded as significant.
Results
Subject Characteristics
Demographic, clinical, and global MRI variables are summarized in Table 1. The CN, MCI, and AD groups were broadly similar in age, education, and vascular risk. Expected stepwise differences between CN, MCI, and AD were observed in cognitive variables and global brain volume.
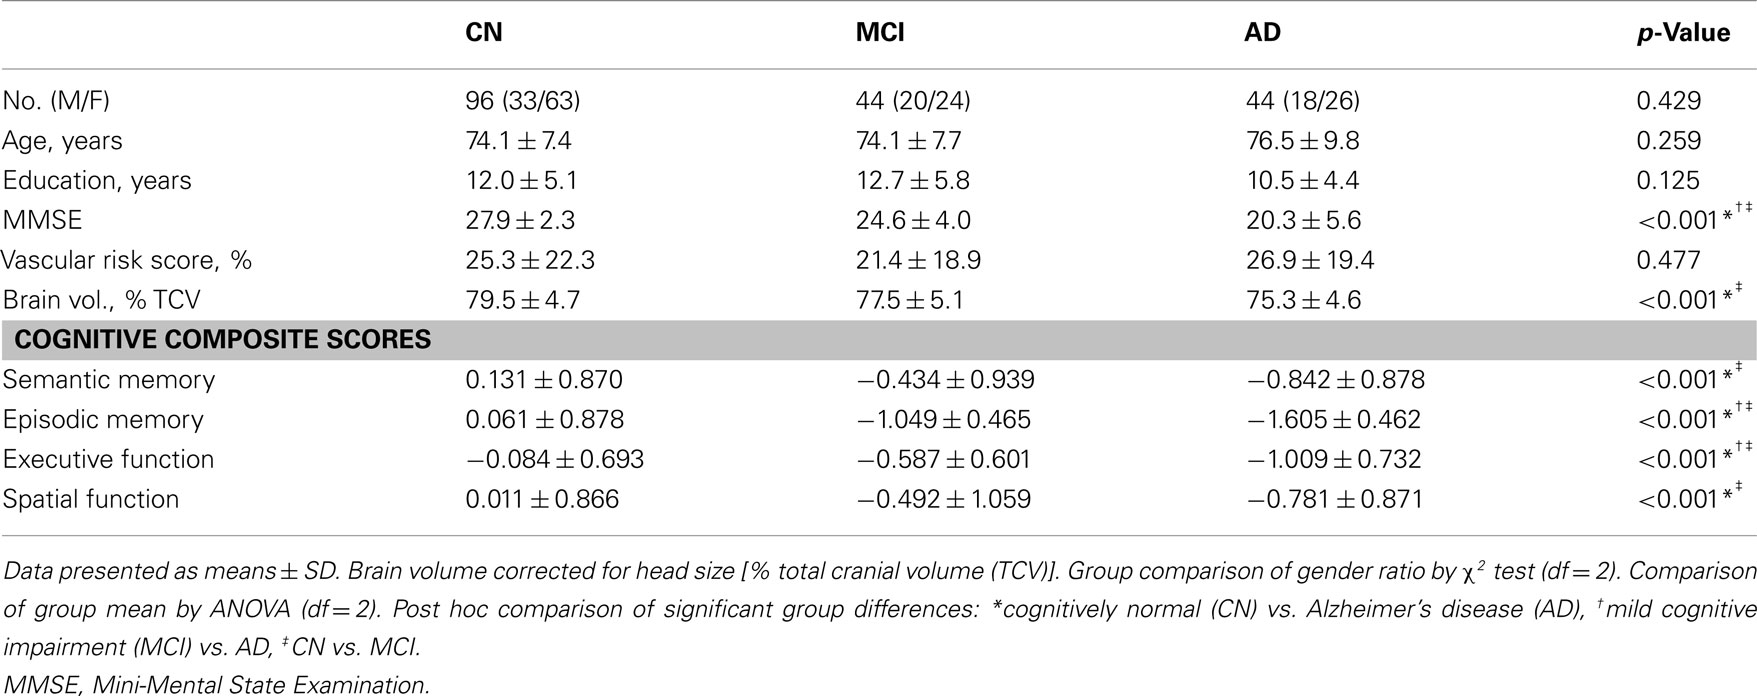
Table 1. Subject characteristics.
Hippocampal Volume and Mean Fornix FA Group Differences
Mean hippocampus volume in the AD group was 10.2% lower than that of the MCI group; mean hippocampus volume in the MCI group, in turn, was 9.6% lower than that of the CN group. These group differences were statistically significant (F = 17.26, df = 2, p < 0.001, Figure 1A). Mean fornix FA in the AD group was 1.8% lower, and mean fornix FA in the MCI group was 1.7% lower, than in the CN group (F = 12.19, df = 2, p < 0.001), but differences between AD and MCI groups were not significant (Figure 1B).
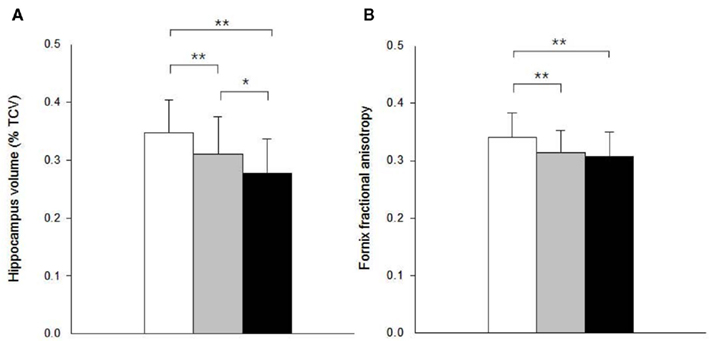
Figure 1. Graphic display of hippocampal volume and fornix fractional anisotropy (FA) according to diagnostic group. (A) Hippocampal volume; and (B) fornix FA. White columns indicate cognitively normal (CN) older individuals; gray columns, patients with mild cognitive impairment (MCI); and black columns, patients with Alzheimer’s disease (AD). Error bars indicates SD. *p < 0.05 and **p < 0.01 by Tukey post hoc diagnostic group comparison.
Relationship between Hippocampal Volume and Mean Fornix FA
A 1 SD increase in hippocampal volume was associated with a.41-SD increase in fornix body ROI mean FA in univariate analysis (p < 0.001). Controlling for age and gender in a multiple regression model did not substantially modify this association (Figure 2A). Separate analyses within separate baseline clinical groups revealed that the association was significant within the MCI and AD groups considered individually, but not CN (Figures 2B–D).
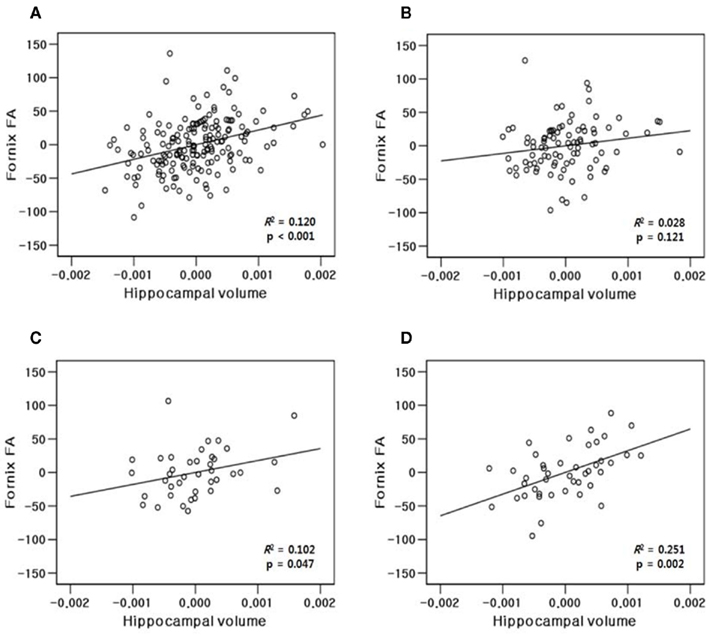
Figure 2. Partial regression plots showing relationship between fractional anisotropy of the fornix and volume of the hippocampus within (A) all study subjects (N = 184); (B) cognitively normal (CN, N = 96); (C) mild cognitive impairment (MCI, N = 44); and (D) Alzheimer’s disease (AD, N = 44) group. Variables in each plot were adjusted for age and gender.
Local Hippocampal Thickness Group Differences
Hippocampal thicknesses were significantly decreased in AD vs. CN bilaterally in most of the CA1, a small region of the CA2 adjacent to CA1, and the medial part of the subiculum. In contrast, the other areas corresponding to most of the CA2–4 and dentate gyrus and the middle and lateral part of the subiculum were relatively spared in AD patients (Figures 3A,B,E). MCI patients also showed decreased hippocampal thickness compared to CN at smaller, but similar hippocampal regions including the bilateral anterior CA1 and antero-medial subiculum (Figures 3C,F). The AD group also had decreased thickness relative to MCI in similar regions, although the difference was statistically significant mainly in the right CA1 region adjacent to the CA2 subfield (Figures 3D,G).
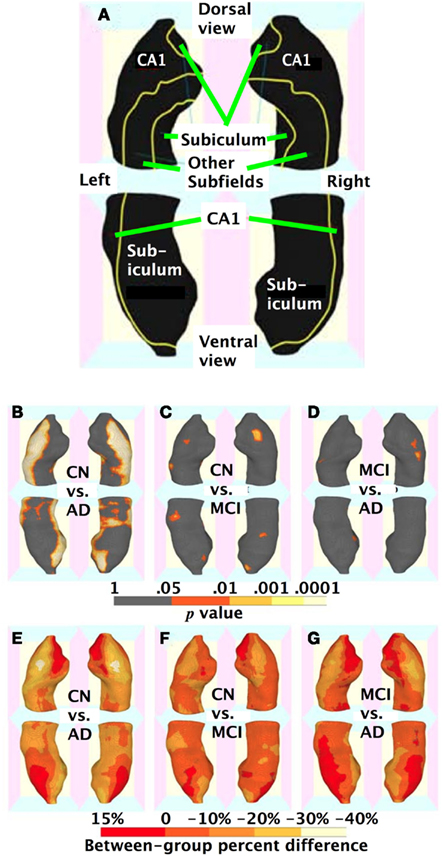
Figure 3. Three-dimensional maps of hippocampal regional atrophy. (A) A schematic representation of the hippocampal subregions mapped onto a representative hippocampal surface (definition of each subregion based on Duvernoy, 2005); (B,E) statistical p-value (corrected for multiple comparison) maps and percent difference maps for cognitively normal (CN) vs. Alzheimer’s disease (AD) comparison; (C,F) for CN vs. mild cognitive impairment (MCI) comparison; and (D,G) for MCI vs. AD comparison of hippocampal radial distance.
Region-Specific Association between Hippocampal Thickness and Fornix FA
As shown Figures 4B and 5, multiple regression analyses revealed that greater mean FA in the fornix regions showing reduced integrity in AD (i.e., the statistical fornix ROI; Figure 4B) was associated with greater thickness of bilateral antero-medial subiculum and middle-anterior CA1 subregions. The hippocampal subregions associated with fornix integrity were remarkably similar to the hippocampal subregions that were relatively atrophic in AD and MCI (Figures 3B and 4A). Similarly, lesser mean thickness of the hippocampal region that showed marked thinning in AD (i.e., the hippocampus statistical ROI; Figure 4C) was associated with lesser FA in fornix regions that overlapped greatly with the fornix statistical ROI (Figures 3A,B).
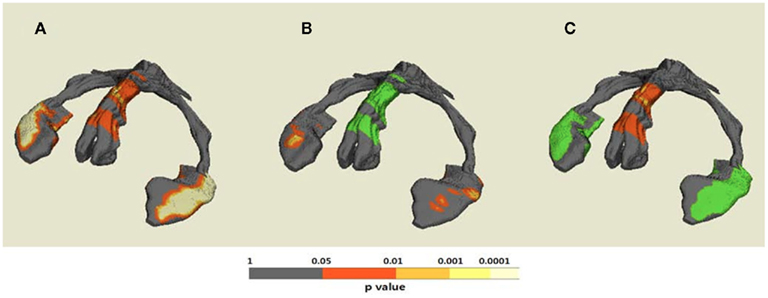
Figure 4. Demonstrative maps showing both anatomical fornix–hippocampus relationship and statistical association between fornix and hippocampus alteration on the same 3D template hippocampus–fornix surface. (A) Statistical p-value (corrected for multiple comparison) maps for cognitively normal (CN) vs. Alzheimer’s disease (AD) differences of both regional fornix fractional anisotropy (FA) and hippocampal thickness; (B) the statistical fornix ROI with significant CN vs. AD FA differences and p-value map for hippocampal regions associated with mean FA of the statistical fornix ROI; and (C) the statistical hippocampal ROI with significant CN vs. AD thickness differences and p-value map for fornix regions associated with mean thickness of the statistical hippocampal ROI.
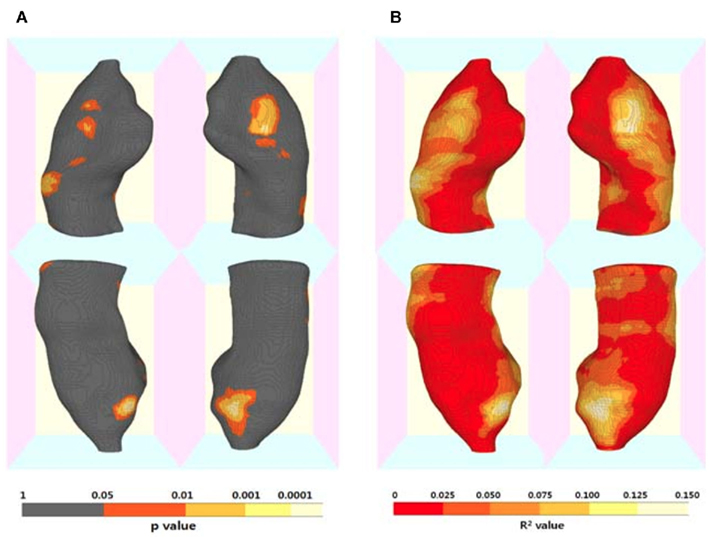
Figure 5. Three-dimensional maps for the association of regional hippocampal atrophy with fornix microstructural alteration by Alzheimer’s disease (AD). (A) Statistical p-value (corrected for multiple comparisons) map and (B) R2 map for the results of regression analyses including mean fornix fractional anisotropy (FA) as a independent variable and each hippocampal surface point radial distance as a dependent variable, and age and gender as covariates. (Also see Figure 4B).
Cognitive Consequences of Hippocampal Atrophy and Fornix Microstructural Alteration
A 1 SD increase in mean fornix body FA was associated with a 0.252 SD increase in episodic memory (p = 0.002) and a 0.22 SD increase in executive function (p = 0.006), but mean fornix body FA was not associated with semantic memory or spatial function (Table 2). A 1 SD increase in total hippocampal volume was associated with a 0.3 SD increase in episodic memory, but not with the three other cognitive measures (Table 2). As shown in Table 2, in models containing both total hippocampus volume and mean fornix body FA, the effect of fornix FA on episodic memory was no longer significant, while its effect on executive function remained. In contrast, hippocampal volume continued to show a significant effect on episodic memory in the model that also contained fornix FA.
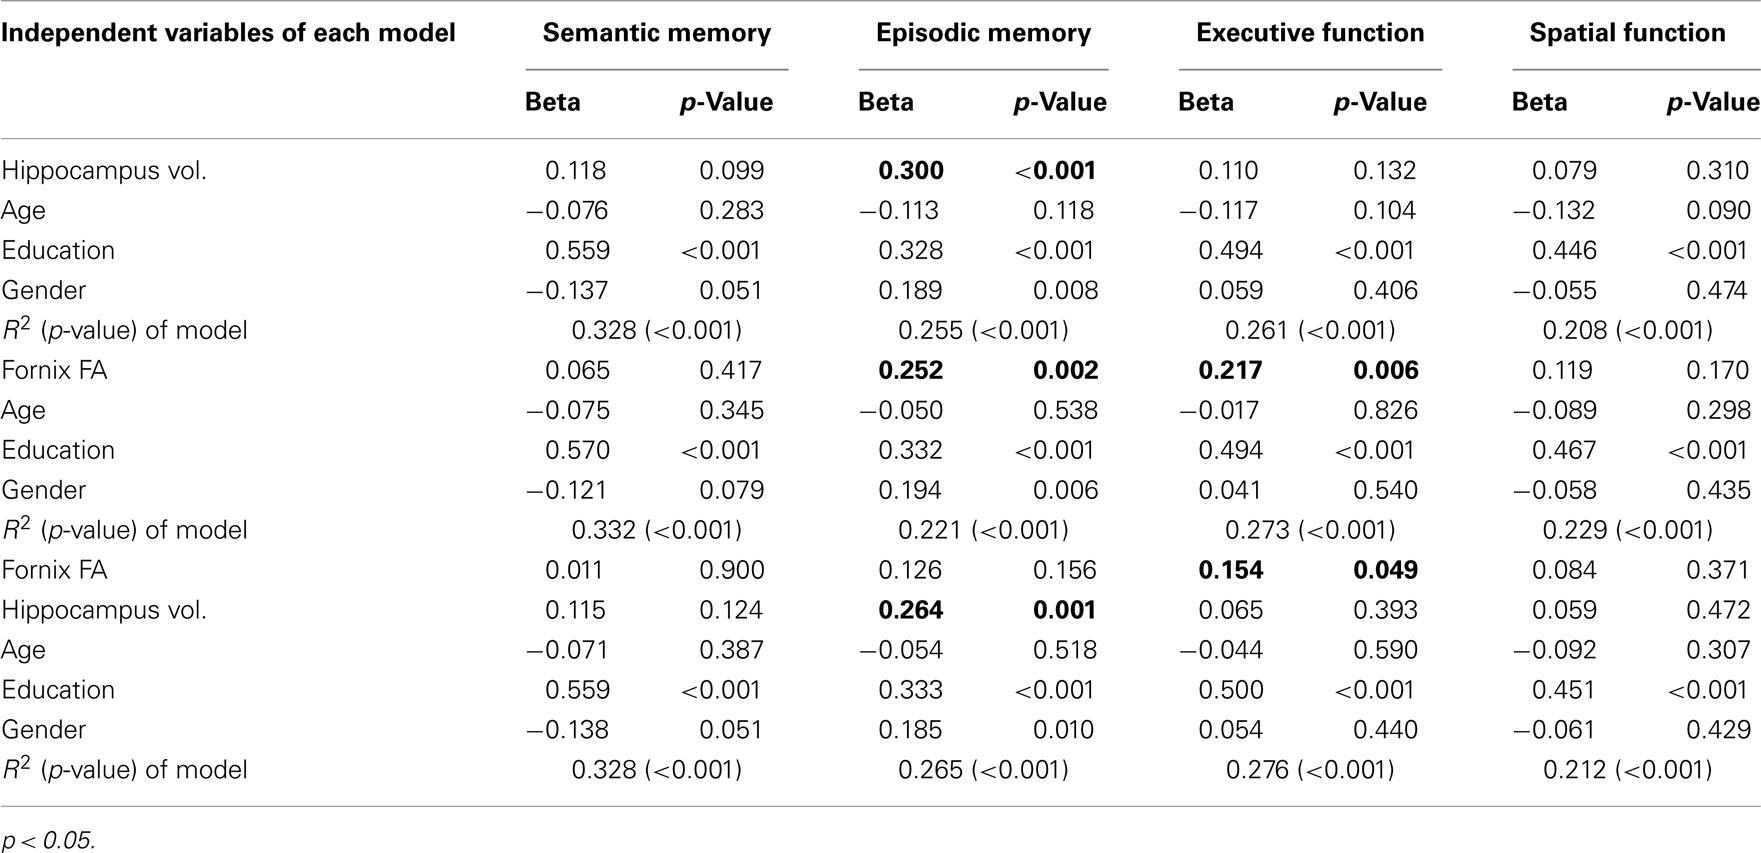
Table 2. Multiple regression models explaining cognitive functions with hippocampus volume and fornix fractional anisotropy (FA).
Discussion
Our ROI-based approach confirmed that both microstructural degradation of the fornix, as measured by FA, and overall hippocampal atrophy were prominent in AD and MCI. We also found through 3D thickness mapping that AD-associated hippocampal atrophy was mainly localized in the bilateral CA1 and medial subiculum subfields. In addition, greater fornix FA was associated with greater hippocampal volume as well as with greater thickness of anterior CA1 and antero-medial subiculum. Relationships between hippocampal and fornix subregions were confined to those regions that showed AD-related deficits. Finally, greater fornix integrity and hippocampal thickness and volume were associated with greater episodic memory performance, while greater fornix integrity was additionally associated with greater executive function.
Our finding of fornix microstructural disruption in AD is consistent with previous DTI studies (Mielke et al., 2009; Pievani et al., 2010; Agosta et al., 2011). In addition, however, we also found milder, but significant reductions in fornix FA in MCI subjects not previously identified by these studies (Mielke et al., 2009; Pievani et al., 2010). Enhanced statistical power with our larger sample size probably contributed to this discrepancy (Pievani et al., 2010). In addition, we measured FA within the entire body of the fornix, while one prior study (Mielke et al., 2009) measured FA from only a single slice of the fornix body, possibly leading to increased FA measurement error. Our finding in MCI, together with the results of a prior study (Ringman et al., 2007) that demonstrated fornix FA reductions in presymptomatic carriers of familial AD mutations, suggests that fornix degeneration may occur early in the AD pathological process.
In addition to overall hippocampal atrophy, we found region-specific atrophy of the CA1 and medial part of the subiculum adjacent to the presubiculum in AD, and to a lesser extent in MCI. These findings agree with prior MRI studies (Csernansky et al., 2000; Wang et al., 2006; Scher et al., 2007; Chetelat et al., 2008; Frisoni et al., 2008; Xie et al., 2009), which are in turn consistent with AD neuropathological findings (Ball, 1977; Mann et al., 1985; Doebler et al., 1987; Davies et al., 1992).
Our findings provide in vivo confirmation of topographical associations between fornix fibers and pyramidal cell bodies originating in the subiculum and CA1 subfields (Rosene and Van Hoesen, 1977; Krayniak et al., 1979; Brodal, 1981; Thierry et al., 2000; Aggleton et al., 2005; Cenquizca and Swanson, 2007). These findings suggest that microstructural degradation of the fornix is closely related to region-specific hippocampal cell loss in AD. Taken together with the observation that fornix–hippocampus relationships were significant in MCI and AD but not CN, these results strongly support the hypothesis that neuronal loss and axonal injury are not independent processes, but specifically related pathologies in the AD degenerative process. This hypothesis has been previously supported by data suggesting that axonal alterations may precede beta amyloid and even promote development of senile plaques in the cortex (Stokin et al., 2005). Other evidence suggests that, instead, axonal injury may be a downstream result of increased beta amyloid at the synapse (Muresan and Muresan, 2009). Independent of etiology, further evidence strongly suggests that axonal myelin breakdown occurs at the earliest or even preclinical stage of AD and has marked negative effects on neuronal survival (Han et al., 2002; Bartzokis et al., 2003; Bartzokis, 2004; Braak et al., 2006). Our findings support this evolving evidence suggesting shared pathogenesis between axonal and neuronal degeneration in AD. However, we caution that temporal relationships among AD pathology development, gray matter atrophy, and white matter degeneration clearly cannot be established by our cross-sectional study.
Regression analyses suggested that both hippocampal atrophy and fornix microstructural degradation were associated with episodic memory decline. These results are compatible with the established notion that, not only the hippocampus itself, but also the pathway from the hippocampus to the mammillary bodies and anterior thalamic nuclei, via the fornix (the so called extended hippocampal–diencephalic system), is critical for the efficient encoding and subsequent recall of new episodic information (Aggleton and Brown, 1999). However, when hippocampal and fornix measures were included in the same regression model, the association between fornix FA and episodic memory was no longer significant, whereas the association between hippocampal measures and episodic memory remained. This finding may favor the impact of gray matter degeneration (as measured by hippocampal volume) over white matter degeneration in the AD process, while it could also be explained by a model in which white matter injury occurs earlier, but hippocampal atrophy, once present, explains more of the variance. Fornix FA was also associated with executive function; this may be a reflection of structural or functional links between the fornix and prefrontal circuitry critical to executive function, as suggested in other mammalian studies (Thierry et al., 2000; Cenquizca and Swanson, 2007). Alternatively, reduced FA in the fornix may be a sign of more advanced disease and therefore associated with reduced executive function. Independent of exact cause for this association, these findings support the notion of AD as a syndrome of neuronal disconnection (De Lacoste and White, 1993) where widely dispersed neural systems are affected (Seeley et al., 2009). Axonal integrity is important to the fidelity of these systems and, therefore, may serve as a new avenue for therapeutic development (Bartzokis et al., 2004a,b; Bartzokis, 2011).
Our study is not without limitation. First, all subjects were clinically diagnosed. While the diagnosis of AD dementia is generally quite accurate at specialized centers such as ours, a substantial number of individuals with amnestic MCI may in fact lack indication of early AD pathology (Forsberg et al., 2008). Second, this is a cross-sectional study, so definite causal inferences between fornix and hippocampal alterations are not possible. Third, we focused only on the hippocampal output system via the fornix, but the entorhinal cortex is where neurofibrillary tangles accumulate first in the AD degenerative process (Gomez-Isla et al., 1996) and is the main input source of the hippocampus. The influence of pathology in this input system on regional hippocampal degeneration needs to be further clarified.
Conclusion
We found fornix microstructural alteration in MCI and AD patients that was closely associated with the hippocampus atrophy in the CA1 and medial subiculum where AD-specific neuronal loss and atrophy is marked. This region-specific relationship between fornix and hippocampal alterations indicates that cortical neuronal damage and subcortical axonal defects in AD are likely to be closely linked with each other, possibly reflecting a suggested pathogenic interaction between the two (Bartzokis, 2011), although this needs to be clarified through longitudinal studies.
Conflict of Interest Statement
The authors declare that the research was conducted in the absence of any commercial or financial relationships that could be construed as a potential conflict of interest.
Acknowledgments
This study was supported by National Institutes of Health (K01 AG030514, P30 AG10129, R01 AG010220, R01 AG031563, and R01 AG021028) and a grant from the Dana Foundation.
References
Aggleton, J. P., and Brown, M. W. (1999). Episodic memory, amnesia, and the hippocampal-anterior thalamic axis. Behav. Brain Sci. 22, 425–444; discussion 444–489.
Aggleton, J. P., Vann, S. D., and Saunders, R. C. (2005). Projections from the hippocampal region to the mammillary bodies in macaque monkeys. Eur. J. Neurosci. 22, 2519–2530.
Agosta, F., Pievani, M., Sala, S., Geroldi, C., Galluzzi, S., Frisoni, G. B., and Filippi, M. (2011). White matter damage in Alzheimer disease and its relationship to gray matter atrophy. Radiology 258, 853–863.
Apostolova, L. G., and Thompson, P. M. (2008). Mapping progressive brain structural changes in early Alzheimer’s disease and mild cognitive impairment. Neuropsychologia 46, 1597–1612.
Assaf, Y., and Pasternak, O. (2008). Diffusion tensor imaging (DTI)-based white matter mapping in brain research: a review. J. Mol. Neurosci. 34, 51–61.
Ball, M. J. (1977). Neuronal loss, neurofibrillary tangles and granulovacuolar degeneration in the hippocampus with ageing and dementia. A quantitative study. Acta Neuropathol. 37, 111–118.
Bartzokis, G. (2004). Age-related myelin breakdown: a developmental model of cognitive decline and Alzheimer’s disease. Neurobiol. Aging 25, 5–18; author reply 49–62.
Bartzokis, G. (2011). Alzheimer’s disease as homeostatic responses to age-related myelin breakdown. Neurobiol. Aging 32, 1341–1371.
Bartzokis, G., Cummings, J. L., Sultzer, D., Henderson, V. W., Nuechterlein, K. H., and Mintz, J. (2003). White matter structural integrity in healthy aging adults and patients with Alzheimer disease: a magnetic resonance imaging study. Arch. Neurol. 60, 393–398.
Bartzokis, G., Lu, P. H., and Mintz, J. (2004a). Quantifying age-related myelin breakdown with MRI: novel therapeutic targets for preventing cognitive decline and Alzheimer’s disease. J. Alzheimers Dis. 6(6 Suppl.), S53–S59.
Bartzokis, G., Sultzer, D., Lu, P. H., Nuechterlein, K. H., Mintz, J., and Cummings, J. L. (2004b). Heterogeneous age-related breakdown of white matter structural integrity: implications for cortical “disconnection” in aging and Alzheimer’s disease. Neurobiol. Aging 25, 843–851.
Braak, H., and Braak, E. (1991). Neuropathological stageing of Alzheimer-related changes. Acta Neuropathol. 82, 239–259.
Braak, H., Rub, U., Schultz, C., and Del Tredici, K. (2006). Vulnerability of cortical neurons to Alzheimer’s and Parkinson’s diseases. J. Alzheimers Dis. 9(3 Suppl.), 35–44.
Brodal, A. (1981). Neurological Anatomy in Relation to Clinical Medicine. New York: Oxford University Press.
Carmichael, O., Mungas, D., Beckett, L., Harvey, D., Tomaszewski Farias, S., Reed, B., Olichney, J., Miller, J., and Decarli, C. (2012). MRI predictors of cognitive change in a diverse and carefully characterized elderly population. Neurobiol. Aging 33, 83–95.
Carmichael, O., Xie, J., Fletcher, E., Singh, B., and DeCarli, C. (2011). Localized hippocampus measures are associated with Alzheimer pathology and cognition independent of total hippocampal volume. Neurobiol. Aging (in press).
Cenquizca, L. A., and Swanson, L. W. (2007). Spatial organization of direct hippocampal field CA1 axonal projections to the rest of the cerebral cortex. Brain Res. Rev. 56, 1–26.
Chetelat, G., Fouquet, M., Kalpouzos, G., Denghien, I., De la Sayette, V., Viader, F., Mezenge, F., Landeau, B., Baron, J. C., Eustache, F., and Desgranges, B. (2008). Three-dimensional surface mapping of hippocampal atrophy progression from MCI to AD and over normal aging as assessed using voxel-based morphometry. Neuropsychologia 46, 1721–1731.
Csernansky, J. G., Wang, L., Joshi, S., Miller, J. P., Gado, M., Kido, D., McKeel, D., Morris, J. C., and Miller, M. I. (2000). Early DAT is distinguished from aging by high-dimensional mapping of the hippocampus. Dementia of the Alzheimer type. Neurology 55, 1636–1643.
Davies, D. C., Horwood, N., Isaacs, S. L., and Mann, D. M. (1992). The effect of age and Alzheimer’s disease on pyramidal neuron density in the individual fields of the hippocampal formation. Acta Neuropathol. 83, 510–517.
de la Monte, S. M. (1989). Quantitation of cerebral atrophy in preclinical and end-stage Alzheimer’s disease. Ann. Neurol. 25, 450–459.
De Lacoste, M. C., and White, C. L. III. (1993). The role of cortical connectivity in Alzheimer’s disease pathogenesis: a review and model system. Neurobiol. Aging 14, 1–16.
DeCarli, C., Reed, B. R., Jagust, W., Martinez, O., Ortega, M., and Mungas, D. (2008). Brain behavior relationships among African Americans, Whites, and Hispanics. Alzheimer Dis. Assoc. Disord. 22, 382–391.
Dempster, A. P., Laird, N. M., and Rubin, D. B. (1977). Maximum likelihood from incomplete data via the EM algorithm. J. R. Stat. Soc. Series B Stat. Methodol. 39, 1–38.
Deweer, B., Pillon, B., Pochon, J. B., and Dubois, B. (2001). Is the HM story only a “remote memory”? Some facts about hippocampus and memory in humans. Behav. Brain Res. 127, 209–224.
Doebler, J. A., Markesbery, W. R., Anthony, A., and Rhoads, R. E. (1987). Neuronal RNA in relation to neuronal loss and neurofibrillary pathology in the hippocampus in Alzheimer’s disease. J. Neuropathol. Exp. Neurol. 46, 28–39.
Duvernoy, H. M. (2005). The Human Hippocampus: Functional Anatomy, Vascularization, and Serial Sections with MRI. New York: Springer.
Forsberg, A., Engler, H., Almkvist, O., Blomquist, G., Hagman, G., Wall, A., Ringheim, A., Langstrom, B., and Nordberg, A. (2008). PET imaging of amyloid deposition in patients with mild cognitive impairment. Neurobiol. Aging 29, 1456–1465.
Frisoni, G. B., Ganzola, R., Canu, E., Rub, U., Pizzini, F. B., Alessandrini, F., Zoccatelli, G., Beltramello, A., Caltagirone, C., and Thompson, P. M. (2008). Mapping local hippocampal changes in Alzheimer’s disease and normal ageing with MRI at 3 Tesla. Brain 131(Pt 12), 3266–3276.
Gomez-Isla, T., Price, J. L., McKeel, D. W. Jr., Morris, J. C., Growdon, J. H., and Hyman, B. T. (1996). Profound loss of layer II entorhinal cortex neurons occurs in very mild Alzheimer’s disease. J. Neurosci. 16, 4491–4500.
Han, X., Holtzman, D. M., McKeel, D. W. Jr., Kelley, J., and Morris, J. C. (2002). Substantial sulfatide deficiency and ceramide elevation in very early Alzheimer’s disease: potential role in disease pathogenesis. J. Neurochem. 82, 809–818.
Kochunov, P., Lancaster, J. L., Thompson, P., Woods, R., Mazziotta, J., Hardies, J., and Fox, P. (2001). Regional spatial normalization: toward an optimal target. J. Comput. Assist. Tomogr. 25, 805–816.
Krayniak, P. F., Siegel, A., Meibach, R. C., Fruchtman, D., and Scrimenti, M. (1979). Origin of the fornix system in the squirrel monkey. Brain Res. 160, 401–411.
Lee, D. Y., Fletcher, E., Martinez, O., Ortega, M., Zozulya, N., Kim, J., Tran, J., Buonocore, M., Carmichael, O., and Decarli, C. (2009). Regional pattern of white matter microstructural changes in normal aging, MCI, and AD. Neurology 73, 1722–1728.
Mann, D. M., Yates, P. O., and Marcyniuk, B. (1985). Some morphometric observations on the cerebral cortex and hippocampus in presenile Alzheimer’s disease, senile dementia of Alzheimer type and Down’s syndrome in middle age. J. Neurol. Sci. 69, 139–159.
McKhann, G., Drachman, D., Folstein, M., Katzman, R., Price, D., and Stadlan, E. M. (1984). Clinical diagnosis of Alzheimer’s disease: report of the NINCDS-ADRDA Work Group under the auspices of Department of Health and Human Services Task Force on Alzheimer’s Disease. Neurology 34, 939–944.
Mielke, M. M., Kozauer, N. A., Chan, K. C., George, M., Toroney, J., Zerrate, M., Bandeen-Roche, K., Wang, M. C., Vanzijl, P., Pekar, J. J., Mori, S., Lyketsos, C. G., and Albert, M. (2009). Regionally-specific diffusion tensor imaging in mild cognitive impairment and Alzheimer’s disease. Neuroimage 46, 47–55.
Morris, J. C., Weintraub, S., Chui, H. C., Cummings, J., Decarli, C., Ferris, S., Foster, N. L., Galasko, D., Graff-Radford, N., Peskind, E. R., Beekly, D., Ramos, E. M., and Kukull, W. A. (2006). The uniform data set (UDS): clinical and cognitive variables and descriptive data from Alzheimer Disease Centers. Alzheimer Dis. Assoc. Disord. 20, 210–216.
Muresan, V., and Muresan, Z. (2009). Is abnormal axonal transport a cause, a contributing factor or a consequence of the neuronal pathology in Alzheimer’s disease? Future Neurol. 4, 761–773.
Nichols, T. E., and Holmes, A. P. (2002). Nonparametric permutation tests for functional neuroimaging: a primer with examples. Hum. Brain Mapp. 15, 1–25.
Pievani, M., Agosta, F., Pagani, E., Canu, E., Sala, S., Absinta, M., Geroldi, C., Ganzola, R., Frisoni, G. B., and Filippi, M. (2010). Assessment of white matter tract damage in mild cognitive impairment and Alzheimer’s disease. Hum. Brain Mapp. doi:10.1002/hbm.20978
Ringman, J. M., O’Neill, J., Geschwind, D., Medina, L., Apostolova, L. G., Rodriguez, Y., Schaffer, B., Varpetian, A., Tseng, B., Ortiz, F., Fitten, J., Cummings, J. L., and Bartzokis, G. (2007). Diffusion tensor imaging in preclinical and presymptomatic carriers of familial Alzheimer’s disease mutations. Brain 130(Pt 7), 1767–1776.
Rosene, D. L., and Van Hoesen, G. W. (1977). Hippocampal efferents reach widespread areas of cerebral cortex and amygdala in the rhesus monkey. Science 198, 315–317.
Scher, A. I., Xu, Y., Korf, E. S., White, L. R., Scheltens, P., Toga, A. W., Thompson, P. M., Hartley, S. W., Witter, M. P., Valentino, D. J., and Launer, L. J. (2007). Hippocampal shape analysis in Alzheimer’s disease: a population-based study. Neuroimage 36, 8–18.
Seeley, W. W., Crawford, R. K., Zhou, J., Miller, B. L., and Greicius, M. D. (2009). Neurodegenerative diseases target large-scale human brain networks. Neuron 62, 42–52.
Soininen, H. S., and Scheltens, P. (1998). Early diagnostic indices for the prevention of Alzheimer’s disease. Ann. Med. 30, 553–559.
Stokin, G. B., Lillo, C., Falzone, T. L., Brusch, R. G., Rockenstein, E., Mount, S. L., Raman, R., Davies, P., Masliah, E., Williams, D. S., and Goldstein, L. S. (2005). Axonopathy and transport deficits early in the pathogenesis of Alzheimer’s disease. Science 307, 1282–1288.
Thierry, A. M., Gioanni, Y., Degenetais, E., and Glowinski, J. (2000). Hippocampo-prefrontal cortex pathway: anatomical and electrophysiological characteristics. Hippocampus 10, 411–419.
Thompson, P. M., Hayashi, K. M., de Zubicaray, G., Janke, A. L., Rose, S. E., Semple, J., Herman, D., Hong, M. S., Dittmer, S. S., Doddrell, D. M., and Toga, A. W. (2003). Dynamics of gray matter loss in Alzheimer’s disease. J. Neurosci. 23, 994–1005.
Thompson, P. M., Hayashi, K. M., De Zubicaray, G. I., Janke, A. L., Rose, S. E., Semple, J., Hong, M. S., Herman, D. H., Gravano, D., Doddrell, D. M., and Toga, A. W. (2004). Mapping hippocampal and ventricular change in Alzheimer disease. Neuroimage 22, 1754–1766.
Wang, L., Miller, J. P., Gado, M. H., McKeel, D. W., Rothermich, M., Miller, M. I., Morris, J. C., and Csernansky, J. G. (2006). Abnormalities of hippocampal surface structure in very mild dementia of the Alzheimer type. Neuroimage 30, 52–60.
Winblad, B., Palmer, K., Kivipelto, M., Jelic, V., Fratiglioni, L., Wahlund, L. O., Nordberg, A., Backman, L., Albert, M., Almkvist, O., Arai, H., Basun, H., Blennow, K., de Leon, M., DeCarli, C., Erkinjuntti, T., Giacobini, E., Graff, C., Hardy, J., Jack, C., Jorm, A., Ritchie, K., van Duijn, C., Visser, P., and Petersen, R. C. (2004). Mild cognitive impairment – beyond controversies, towards a consensus: report of the International Working Group on Mild Cognitive Impairment. J. Intern. Med. 256, 240–246.
Keywords: hippocampus, fornix, fractional anisotropy, Alzheimer’s disease, mild cognitive impairment
Citation: Lee DY, Fletcher E, Carmichael OT, Singh B, Mungas D, Reed B, Martinez O, Buonocore MH, Persianinova M and DeCarli C (2012) Sub-regional hippocampal injury is associated with fornix degeneration in Alzheimer’s disease. Front. Ag. Neurosci. 4:1. doi: 10.3389/fnagi.2012.00001
Received: 19 January 2012; Accepted: 11 March 2012;
Published online: 11 April 2012.
Edited by:
P. Hemachandra Reddy, Oregon Health and Science University, USAReviewed by:
Junming Wang, University of Mississippi Medical Center, USARongqiao He, Institute of Biophysics, Chinese Academy of Sciences, China
Copyright: © 2012 Lee, Fletcher, Carmichael, Singh, Mungas, Reed, Martinez, Buonocore, Persianinova and DeCarli. This is an open-access article distributed under the terms of the Creative Commons Attribution Non Commercial License, which permits non-commercial use, distribution, and reproduction in other forums, provided the original authors and source are credited.
*Correspondence: Owen Thomas Carmichael, Department of Neurology, University of California at Davis, 4860 Y Street, Suite 3700, Sacramento, CA 95817, USA. e-mail: ocarmichael@ucdavis.edu