Differences in functional brain connectivity alterations associated with cerebral amyloid deposition in amnestic mild cognitive impairment
 Dahyun Yi1
 Young Min Choe1
Min Soo Byun1
Bo Kyung Sohn2
Young Min Choe1
Min Soo Byun1
Bo Kyung Sohn2
 Eun Hyun Seo3
Jiyoung Han1
Eun Hyun Seo3
Jiyoung Han1
 Jinsick Park4
Jong Inn Woo1
Jinsick Park4
Jong Inn Woo1  Dong Young Lee1*
- 1Department of Neuropsychiatry, Clinical Research Institute, Seoul National University Hospital, Seoul, South Korea
- 2Department of Neuropsychiatry, Seoul Metropolitan Boramae Medical Center, Seoul, South Korea
- 3Division of Natural Medical Sciences, College of Health Science, Chosun University, Gwangju, South Korea
- 4Department of Biomedical Engineering, Hanyang University, Seoul, South Korea
Despite potential implications for the early detection of impending Alzheimer’s disease (AD), very little is known about the differences of large-scale brain networks between amnestic mild cognitive impairment (aMCI) with high cerebral amyloid-beta protein (Aβ) deposition (i.e., aMCI+) and aMCI with no or very little Aβ deposition (i.e., aMCI−). We first aimed to extend the current literature on altering intrinsic functional connectivity (FC) of the default mode network (DMN) and salience network (SN) from cognitively normal (CN) to AD dementia. Second, we further examined the differences of the DMN and the SN between aMCI−, aMCI+, and CN. Forty-three older adult (12 CN, 10 aMCI+, 10 aMCI−, and 11 AD dementia) subjects were included. All participants received comprehensive clinical and neuropsychological assessment, resting-state functional magnetic resonance imaging, structural MRI, and Pittsburgh compound-B-PET scans. FC data were preprocessed using multivariate exploratory linear optimized decomposition into independent components of FMRIB’s Software Library. Group comparisons were carried out using the “dual-regression” approach. In addition, to verify presence of gray matter volume changes with intrinsic functional network alterations, voxel-based morphometry was performed on the acquired T1-weighted data. As expected, AD dementia participants exhibited decreased FC in the DMN compared to CN (particularly in the precuneus and cingulate gyrus). The degree of alteration in the DMN in aMCI+ compared to CN was intermediate to that of AD. In contrast, aMCI− exhibited increased FC in the DMN compared to CN (primarily in the precuneus) as well as aMCI+. In terms of the SN, aMCI− exhibited decreased FC compared to both CN and aMCI+ particularly in the inferior frontal gyrus. FC within the SN in aMCI+ and AD did not differ from CN. Compared to CN, aMCI− showed atrophy in bilateral superior temporal gyri whereas aMCI+ showed atrophy in right precuneus. The results indicate that despite the similarity in cross-sectional cognitive features, aMCI− has quite different functional brain connectivity compared to aMCI+.
Introduction
Mild cognitive impairment (MCI) refers to the clinical state of cognitive decline that is greater than expected for a given age and educational attainment but does not interfere with the activities of daily living. In general, MCI is considered as a transitional stage or an intermediate state between normal aging and dementia. Particularly, amnestic MCI (aMCI) has been considered as a prodromal stage of Alzheimer’s disease (AD) dementia (Morris, 2006). Among aMCI individuals, however, nearly half does not show abnormal levels of cerebral amyloid-beta (Aβ) accumulation, which is considered as the hallmark of AD (Price et al., 2005; Rowe et al., 2007; Wolk et al., 2009; Nordberg et al., 2013).
Given that Aβ cerebral deposition is considered as a necessary pathological process of AD (Hardy and Selkoe, 2002; Villemagne et al., 2008), aMCI with high levels of Aβ deposition (aMCI+) may more specifically be the prodromal state of AD dementia compared to aMCI with low levels of Aβ deposition (aMCI−), which may be associated with pathophysiological processes other than AD. However, only a few studies investigated the differences in the clinical or neuroimaging characteristics of aMCI+ and aMCI−. Characterizing the differences between aMCI+ and aMCI− is anticipated to shed light on the underlying mechanisms of each state more specifically.
In the past several years, converging pieces of evidence from structural and functional magnetic resonance imaging (MRI) studies suggested that AD affects specific large-scale brain networks. Particularly, the studies using resting-state functional magnetic resonance imaging (rs-fMRI) – an imaging method that measures functional connectivity (FC, i.e., synchronous ongoing brain activity) between spatially distinct brain regions – have shown that individuals with an early stage of AD dementia or aMCI have disruptions in FC between the structures that are parts of the network referred to as the default mode network (DMN) (Biswal et al., 1995; Raichle et al., 2001; De Luca et al., 2006; Wang et al., 2006; Fox and Raichle, 2007; Sorg et al., 2007; He et al., 2009; Smith et al., 2009; Scholvinck et al., 2010). The DMN, which is comprised of a set of brain regions that are active during rest and deactivated when engaged in cognitively demanding tasks, also shows a striking overlap with the brain regions with high Aβ deposition in AD (Buckner et al., 2005; Hedden et al., 2009; Sperling et al., 2009; Sheline et al., 2010).
In addition to the DMN, abnormal activity within the salience network (SN) – comprised of paralimbic structures such as insula and anterior cingulate cortex – is implicated as another indicator of different neurodegenerative diseases, such as frontotemporal dementia (FTD) (Zhou et al., 2010; Farb et al., 2013). Furthermore, the interaction between the DMN and the SN is thought to be important in generating controlled behavior, particularly for the role of the SN in disengaging the DMN when on a task (Rilling et al., 2008; Sridharan et al., 2008; Sharp et al., 2010; Bonnelle et al., 2012).
Despite a growing literature on disruptions of the DMN and the SN in AD and other neurodegenerative conditions, little is known about differential alterations of the DMN or the SN between aMCI+ and aMCI−. In this context, we first aimed to expand current literature on changes in connectivity strengths of the DMN and the SN from cognitively normal (CN) to AD process by specifically including the analysis of aMCI+ rather than overall MCI. Second, we examined the FC differences in the DMN and the SN between aMCI+ and aMCI− by comparing them to CN as well as to each other.
Materials and Methods
Participants
Forty-three older adults (12 CN, 20 aMCI, and 11 AD) were recruited from a dementia clinic of the Seoul National University Hospital. CN subjects did not have subjective or reported cognitive complaints, had Clinical Dementia Rating (CDR) score of 0 (Morris, 1993) and the Mini-Mental State Examination (MMSE) score greater than or equal to 26 (Lee et al., 2002), and performed within the normal range on comprehensive neuropsychological assessment. Individuals with aMCI met Petersen’s criteria (Petersen, 2004): (a) memory complaint corroborated by an informant; (b) objective memory impairment for age, education, and gender; (c) essentially preserved general cognitive function; (d) largely intact functional activities; and (e) not demented. All aMCI individuals had an overall CDR (Morris, 1993) of 0.5. In terms of the criterion (b), a performance score for at least one of the four episodic memory tests included in the Consortium to Establish a Registry for Alzheimer’s disease (CERAD) neuropsychological battery [namely, Word List Memory (WLM), Word List Recall (WLR), Word List Recognition (WLRc), and Constructional Recall (CR) test] (Morris et al., 1989; Lee et al., 2002) was at least 1.5 SD below the respective age-, education-, and gender-specific normative mean (Lee et al., 2004). Patients diagnosed with AD dementia met the National Institute of Neurological and Communicative Diseases and Stroke/Alzheimer’s Disease and Related Disorders Association (NINCDS-ADRDA) criteria for the probable AD (McKhann et al., 1984).
The exclusion criteria for all subjects were: (a) any present serious medical, psychiatric, and neurological disorders that could affect the mental function; (b) evidence of focal brain lesions on MRI; (c) the presence of severe behavioral or communication problems that would make a clinical examination or brain scans difficult; (d) left-handedness; (e) absence of a reliable informant; and (f) illiteracy. Individuals with minor physical abnormalities (e.g., diabetes with no serious complications, essential hypertension, and mild hearing loss) were included. The Institutional Review Board of the Seoul National University Hospital, South Korea, approved the study, and subjects or their legal representatives gave written informed consent.
Clinical and Neuropsychological Assessment
All participants were administered a standardized clinical assessment according to the protocol of the Korean version of the CERAD Assessment Packet (Lee et al., 2002). The CERAD neuropsychological battery and the Stroop Test (Seo et al., 2008) were administered by experienced clinical neuropsychologists. Reliable informants provided information regarding participants’ cognitive, emotional, and functional changes as well as medical history. A panel of psychiatrists and a clinical neuropsychologist with expertise in dementia research made clinical decisions on the diagnoses.
PiB-PET Image Acquisition and Preprocessing
Participants underwent Carbon-11-labeled PiB (11C-PiB) PET imaging using the ECAT EXACT 47 scanner (Siemens-CTI, Knoxville, TN, USA), which has an intrinsic resolution of 5.2-mm full width at half maximum (FWHM) and the images of 47 contiguous transverse planes with a 3.4-mm thickness for a longitudinal field of view of 16.2 cm. Before administering 11C-PiB, a 10-min transmission scanning was performed using rotating three germanium-68 rod sources to correct the attenuation. Sixty minutes after the intravenous injection of 370 MBq 11C-PiB, three 10-min frames of data acquisition were started and later summed into a single frame (60–90 min). All the data were reconstructed in 123 × 128 × 47 matrix with a pixel size of 2.57 mm × 2.57 mm × 3.75 mm using the filtered back projection method with Shepp–Logan filter (cutoff = 0.35 cycle/pixel), and reconstructed images were corrected for attenuation and rearranged onto transaxial, sagittal, and coronal images.
The details of PiB quantification image analyses were described previously (Choo et al., 2011). Briefly, image preprocessing for statistical analyses was performed using SPM2 implemented in MatLab. 11C-PiB-PET data of each subject were co-registered to individual volumetric magnetic resonance image and then automatically spatially normalized into the standard MNI template in SPM2 using transformation parameters derived from the normalization of individual magnetic resonance image to the template. All normalized images were reformatted with a voxel size of 2 mm × 2 mm × 2 mm. For quantitative normalization of cerebral 11C-PiB uptake values, the cerebellum was used as a reference region (Lopresti et al., 2005) and 11C-PiB retention maps as region-to-cerebellar ratio were generated by dividing regional uptake values by the individual mean cerebellar uptake values in the same images. The automatic anatomic labeling algorithm (Tzourio-Mazoyer et al., 2002) and a region combining method (Reiman et al., 2009) were applied to set regions of interest (ROIs) to characterize 11C-PiB retention level in frontal, lateral parietal, posterior cingulate–precuneus (PC–PRC), lateral temporal, and basal ganglia (BG) regions. A global cortical ROI consisting of frontal, lateral parietal, PC–PRC, lateral temporal, and BG ROIs was also defined. For each ROI, mean value was calculated by averaging 11C-PiB retention values for all voxels within the ROI. Each aMCI participant was classified as PiB-positive (i.e., aMCI+) if 11C-PiB retention value of the image was over 1.4 in one of the five ROIs (i.e., frontal, lateral temporal, lateral parietal, PC–PRC, and BG) and PiB-negative (i.e., aMCI−) if 11C-PiB retention values of all of the ROIs were equal to or less than 1.4 (Reiman et al., 2009).
MRI Acquisition
Imaging was performed on a 3.0-T GE whole body imaging system (GE VH/I; General Electric, Milwaukee, WI, USA). The rs-fMRI BOLD data for each participant consisted of 100 T2*-weighted single-shot gradient echo EPI sequence with the following parameters: TR/TE/FA = 3000 ms/30 ms/90o; voxel size, 1.87 mm × 1.87 mm × 5.0 mm; 26 anterior commissure–posterior commissure aligned axial slices in interleaved order; matrix 128 × 128; scan time ~9 min. During the whole functional scanning, all participants were asked to keep their eyes closed, to stay awake during the entire session, and not to focus their minds on anything in particular. Cushions and headphones were used to reduce subject motion and scanner noise. For structural imaging, we obtained a three-dimensional T1-weighted spoiled gradient recalled echo (SPGR) sequence (TR = 22.0 ms, TE = 4.0 ms, slice thickness/gap = 1.40 mm, matrix = 256 × 192, FOV = 240 mm, Flip angle = 40o).
Data Processing and Analyses
Data analyses were carried out using multivariate exploratory linear optimized decomposition into independent components (MELODIC) of FMRIB’s Software Library (FSL version 4.0.4)1 to identify large-scale patterns of temporal signal-intensity coherence, interpreted as FC, in the population of subjects (Beckmann et al., 2005). Preprocessing included discarding the first five volumes to let the scanner reach equilibrium due to progressive saturation, motion correction, removal of non-brain structures, spatial smoothing (Gaussian kernel of 5-mm FWHM), slice timing correction, and high-pass temporal filtering (100 s). The rs-fMRI volumes were registered to Montreal Neurological Institute-152 standard space (MNI-152). Then, each subject’s preprocessed functional data were run through single-session independent component analysis (ICA) of MELODIC to identify artifacts to be denoised. Finally, the denoised functional data were temporally concatenated across all subjects (covering each comparisons) to create a single 4D group ICA (gICA) data set for the following analysis. The sample-specific DMN and SN were identified from the gICA results.
The between-subject analyses were carried out using the “dual-regression” approach, allowing for voxel-wise comparisons of resting FC (Filippini et al., 2009). In summary, dual-regression included the following steps: (1) obtaining matrices describing the temporal dynamics for each component and subject resulting from using the gICA spatial maps in a linear model fit against the separate rs-fMRI data set, which results in single-subject time-courses corresponding to each of spatial components generated by the gICA over all subjects; (2) normalizing the temporal modes to unit variance; (3) using the set of normalized individual temporal modes as regressors in a first-level GLM to derive individual subject spatial maps corresponding to each of the grand spatial maps. In the final stage of dual-regression analysis, we tested voxel-wise for statistically significant difference between the groups using non-parametric permutation testing (10000 permutations). This results in statistical maps characterizing the group differences. These maps were thresholded at p < 0.005 (uncorrected) using “threshold-free cluster enhancement (TFCE)” as implemented in FSL (Smith and Nichols, 2009). The effects of age, gender, and education were statistically accounted for by including these variables as subject-wise covariates in all of the statistical models. Group comparisons were performed for (a) CN and aMCI+, (b) CN and aMCI−, (c) CN and AD, and (d) aMCI− and aMCI+.
Gray Matter Morphology
To verify whether altered FC in the current study might be explained by MRI-detectable loss of gray matter (GM), a customized voxel-based morphometry (VBM) approach was implemented following the combination of the VBM toolbox version 8 (VBM8 version 435)2 and the Diffeomorphic Anatomical Registration through Exponentiated Lie algebra toolbox (DARTEL) (Ashburner, 2007) using SPM8 software package (Wellcome Trust Center for Neuroimaging, London)3 using default parameters. The native structural T1 volumes were segmented into GM, white matter (WM), and cerebrospinal fluid tissue classifications, which were then used for partial volume estimation to facilitate accurate segmentation (Tohka et al., 2004). Two denoising methods were applied: (1) a spatially adaptive non-local means denoising filter which removes noise while preserving edges and (2) a Markov Random Field denoising filter which removes isolated voxels that are unlikely to be a member of a certain tissue class (Manjon et al., 2010). The filtered segmented data were affine registered to the tissue probability maps provided by the VBM8 toolbox and then were used in DARTEL to create a study-specific customized template. The warped GM and WM segments were modulated by multiplying voxel values in the segmented images by the Jacobian determinants derived from the spatial normalization step to correct for local differences in shape. The resulting normalized modulated non-linear GM images were smoothed with an 8-mm FWHM and were used for between-group comparisons. Based on our hypothesis, we restricted the VBM analysis to only differences in GM. Total intracranial volume was not used as a covariate as the non-linear images represent volume of GM corrected for individual brain sizes. Age, gender, and education were included in the statistical model as nuisance covariates.
The resulting set of T values constituted the SPM(T) map. The voxel-wise results were initially displayed at p less than 0.005 (uncorrected) to illustrate patterns. Then, we applied p less than 0.001 (two-tailed, uncorrected for multiple comparisons) as a significance height threshold at a voxel-level across the GM. Given the relatively small sample size, the significance threshold was set at p less than 0.001 (uncorrected) in order to avoid the unintended overlook of novel findings by too conservative a threshold. The MNI coordinates were automatically calculated in SPM8 and transformed into Talairach and Tournoux(Talairach and Tournoux, 1988) by the mni2tal program4.
Non-Imaging Statistics
All other statistical analyses were performed using Statistical Package for the Social Sciences 18.0 (SPSS, SPSS Inc., Chicago, IL, USA). For continuous measures, differences between groups were assessed using one-way ANOVA with post hoc Bonferroni tests to correct for multiple comparisons. Fisher’s exact test was used to compare frequency distributions of gender.
Results
Demographics, Cognitive Performance, and Amyloid Burden
Twelve CN, 10 aMCI−, 10 aMCI+, and 11 AD patients were compared on their demographic characteristics and neuropsychological performance scores (Table 1). Mean age of all subjects was 69.4 (SEM = 1.07) and their mean years of education was 9.7 (SEM = 0.65), of which 81% of the subjects were female. CN, aMCI−, and aMCI+ groups did not differ in their age. However, CN was older than AD. All groups did not differ in their years of education or gender distribution. As expected, CN performed significantly better on the MMSE compared to aMCI−, aMCI+, and AD groups. In addition, aMCI− and aMCI+ groups performed significantly better than AD on the MMSE.
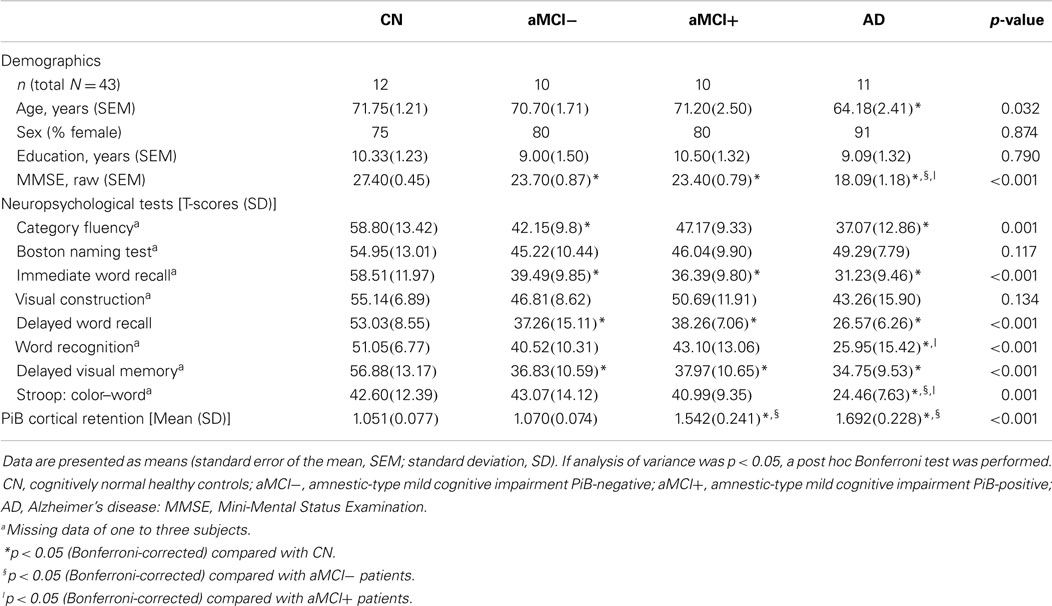
Table 1. Demographic, neuropsychological, gray matter volumetric, and cerebral amyloid burden characteristics.
In terms of other neuropsychological performances, four groups did not differ on the Boston Naming Test and a task of visual construction. Performances of aMCI−, aMCI+, and AD on word recall tasks (both immediate and delayed) as well as delayed visual memory task did not significantly differ from each other; however, they performed significantly worse than CN. On a recognition task, CN, aMCI−, and aMCI+ did not differ from each other; however, AD performed significantly worse than CN and aMCI+. On a task of response inhibition, CN, aMCI−, and aMCI+ performed similarly except for AD who performed significantly worse compared to the other groups. In addition, AD and aMCI− performed worse than CN on a category fluency test. Mean cortical retention of PiB of aMCI+ and AD was significantly higher than CN and aMCI− [F(3, 39) = 39.41, p < 0.001].
Group Differences in the DMN
As predicted, ICA analysis revealed a sample-specific DMN with both the anterior and posterior regions present (Figure 1A). The results of voxel-wise between-group comparison for FC within the DMN at the threshold of p < 0.005 (uncorrected, TFCE) are shown in Figure 2 and Table 2. Compared to CN, aMCI+ showed decreased FC at the left lingual gyrus. There were no regions within the DMN demonstrating increased FC in aMCI+ compared to CN. Similarly, AD showed weaker DMN connectivity in the right precuneus and left posterior cingulate cortex (PCC) than CN. There were no regions showing increased DMN connectivity in AD compared to CN. In contrast, when compared to CN, aMCI− demonstrated increased DMN connectivity in the left precuneus, right superior parietal lobule, right superior temporal gyrus, left middle temporal gyrus, and left culmen. There were no regions where aMCI− showed weaker DMN connectivity compared to CN.
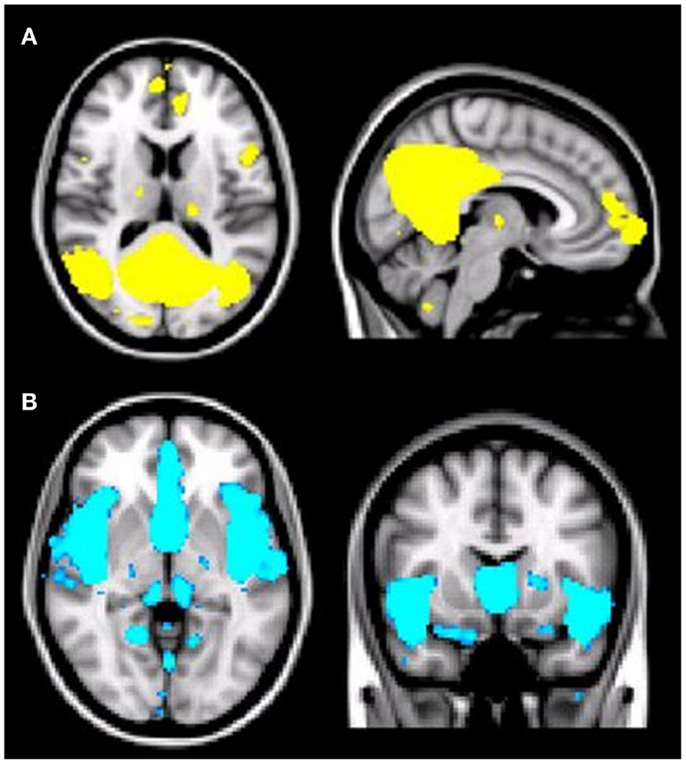
Figure 1. (A) Illustration of the default mode network (DMN) regions derived from group independent component analysis (ICA). The DMN component identified by meta-ICA analysis included the posterior cingulate cortex, precuneus, medical prefrontal cortex, lateral parietal regions, lateral temporal regions, and bilateral medial temporal regions (p < 0.001). (B) Illustration of the salience network (SN) regions derived from group independent component analysis (ICA). The SN component identified by meta-ICA analysis included the anterior cingulate cortex, presupplementary motor area, and anterior insula (p < 0.001).
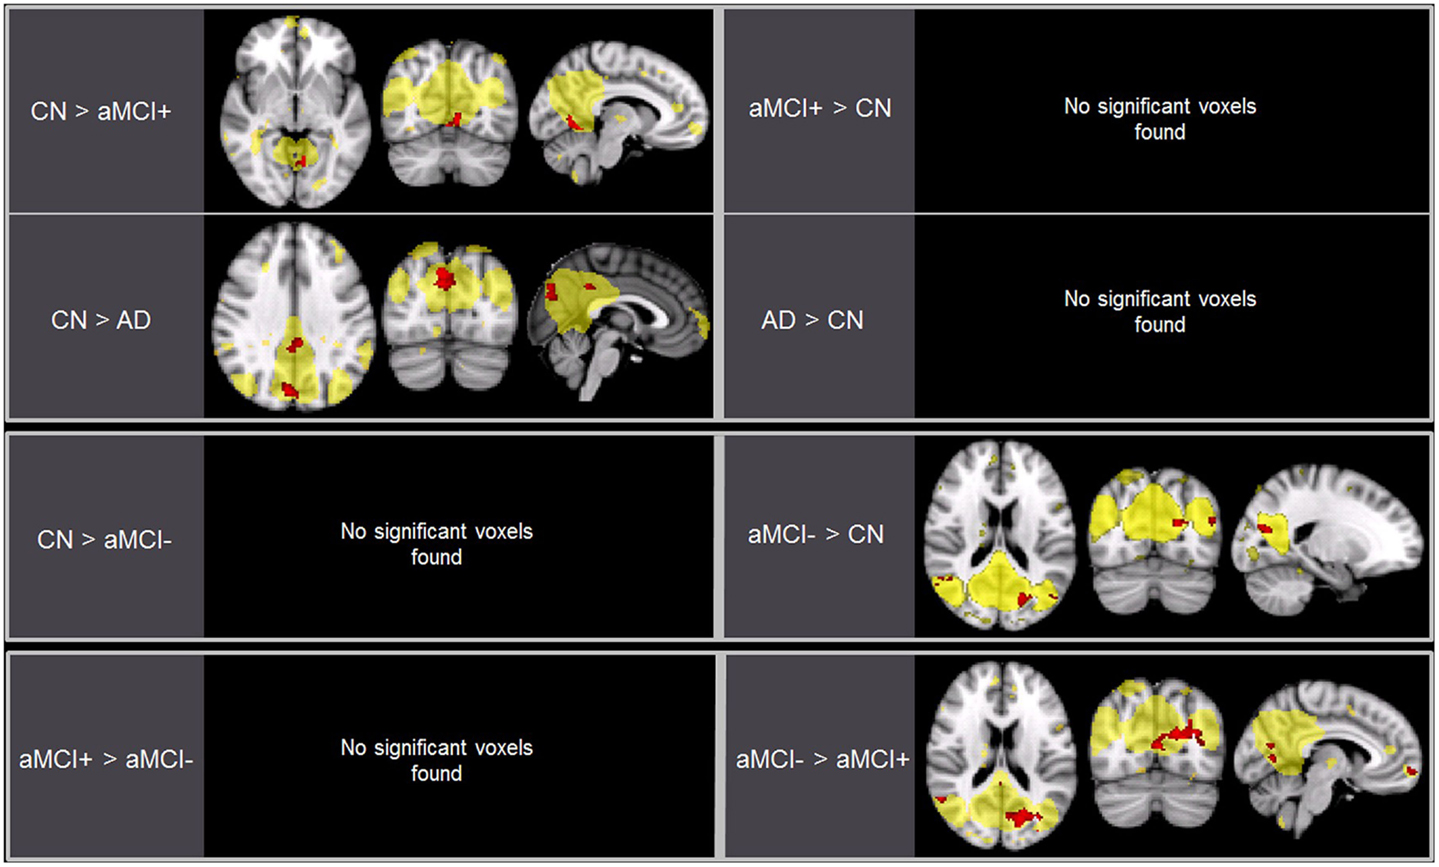
Figure 2. Brain regions displaying significant differences (in red) in the default mode network (DMN) between the groups using voxel-wise comparisons (p < 0.005, uncorrected for multiple comparisons) masked by the overall average DMN in yellow (p < 0.001, uncorrected). Results are superimposed on the MNI-152 T1 1-mm brain template.
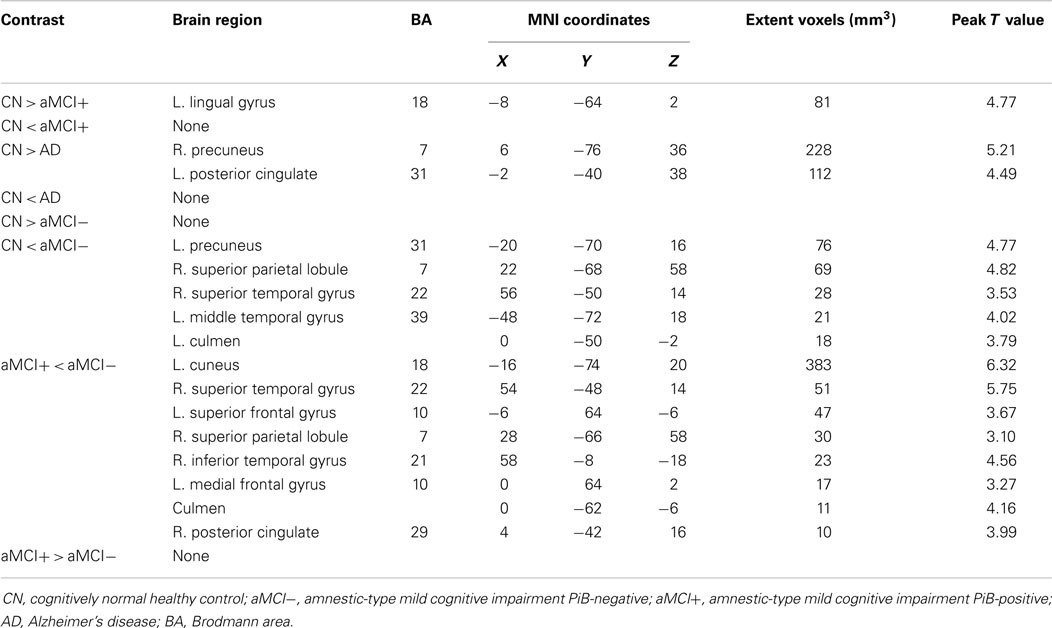
Table 2. Regions of significant difference in functional connectivity within the default mode network between CN, aMCI−, aMCI+, and AD.
Between aMCI+ and aMCI−, aMCI− showed stronger DMN connectivity in the left cuneus, right PCC, right superior parietal lobule, right superior temporal gyrus, right inferior temporal gyrus, left superior frontal gyrus, left medial frontal gyrus, and left culmen compared to aMCI+. There were no regions demonstrating decreased DMN connectivity in aMCI− compared to aMCI+.
Group Differences in the SN
Independent component analysis revealed a sample-specific SN with the anterior cingulate cortex and anterior insula (Figure 1B). The results of voxel-wise between-group comparison for FC within the SN at the threshold of p < 0.005 (uncorrected, TFCE) are shown in Figure 3 and Table 3. There were no differences in SN connectivity between CN, aMCI+, and AD. Compared to CN, aMCI− demonstrated decreased SN connectivity in the left inferior frontal gyrus (iFG); however, there were no regions where aMCI− showed increased SN connectivity compared to CN.
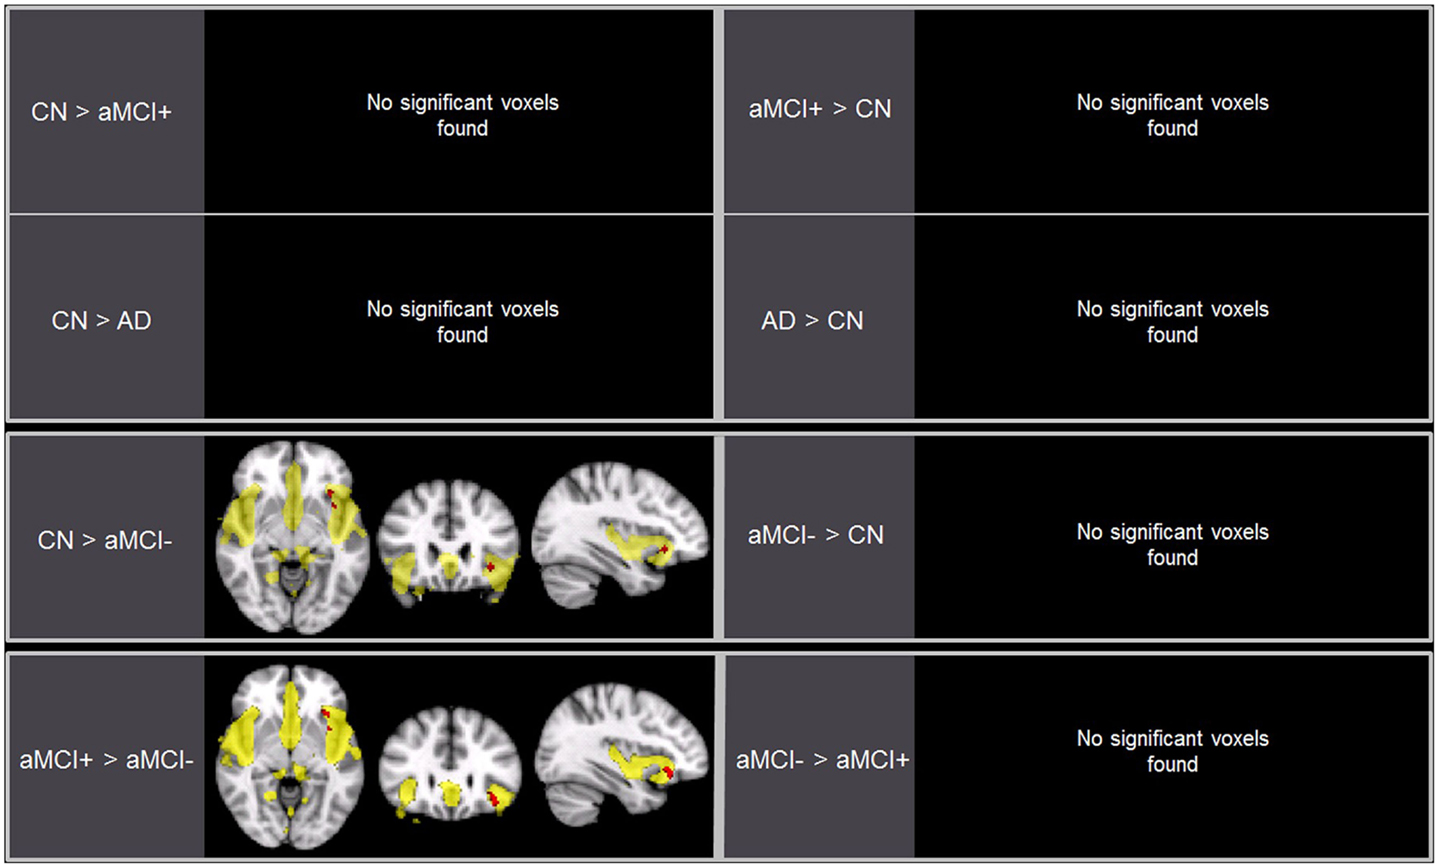
Figure 3. Brain regions displaying significant differences (in red) in the salience network (SN) between the groups using voxel-wise comparisons (p < 0.005, uncorrected for multiple comparisons) marked by the overall average SN in yellow (p < 0.001, uncorrected). Results are superimposed on the MNI-152 T1 1-mm brain template.
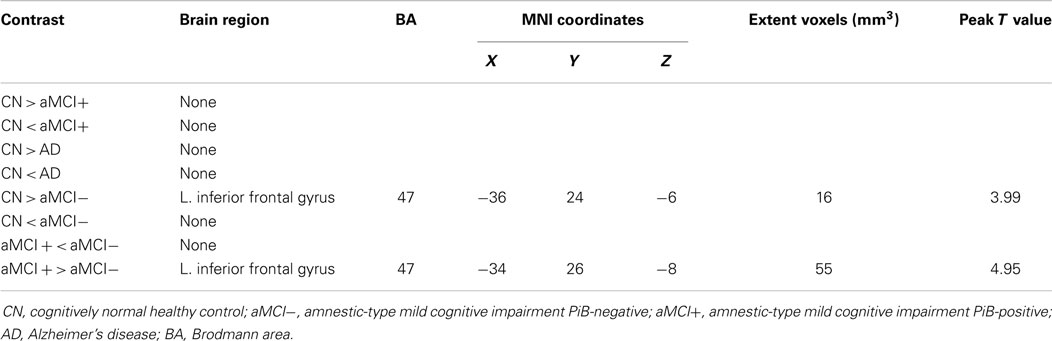
Table 3. Regions of significant difference in functional connectivity within the salience network between CN, aMCI−, aMCI+, and AD.
Between aMCI+ and aMCI−, aMCI− demonstrated decreased SN connectivity in the left iFG compared to aMCI+. There were no regions where aMCI− demonstrated stronger SN connectivity than aMCI+.
Group Differences in Regional Brain Volume
For illustration, the results of VBM between-group comparisons are displayed at the threshold of p < 0.005 (uncorrected) as shown in Figure 4. Compared to CN, aMCI− showed atrophy in the bilateral superior temporal gyri (BA 38 and 13) and left uncus whereas aMCI+ showed atrophy in the right precuneus and left lingual gyrus (Figure 4; Table 4). The peak voxels of clusters meeting the p < 0.001 (uncorrected) cluster-wise criterion for the contrasts are listed in Table 4.
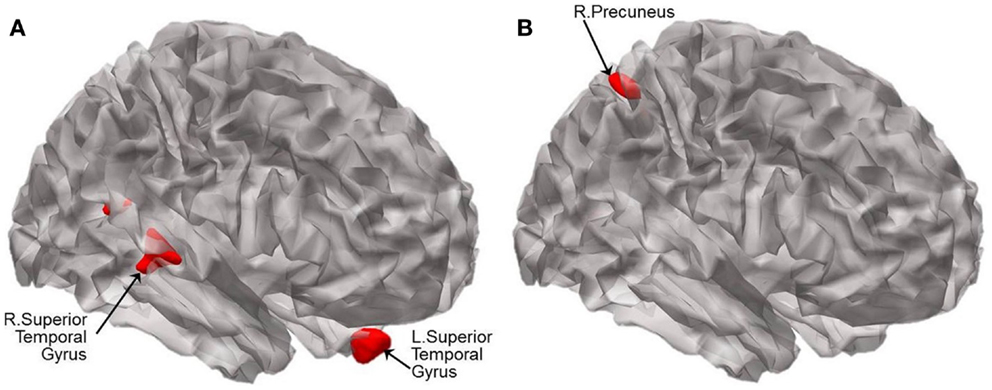
Figure 4. Statistical parametric maps showing the results of analysis of covariance of VBM at p < 0.005 (uncorrected). Brain regions displaying significant differences in brain volume are shown in red between (A) CN and aMCI−, and between (B) CN and aMCI+. Results are superimposed using the cortex_20484.surf template in SPM8. The peak voxels of clusters meeting the p < 0.001 (uncorrected) cluster-wise criterion for the contrasts are listed in Table 4.
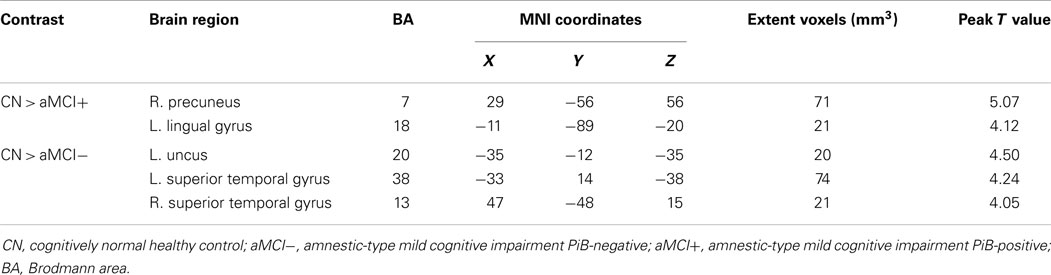
Table 4. Regions of significant difference in brain volume between CN, aMCI−, and aMCI+.
Discussion
The present study showed that DMN FC differences between CN, aMCI+, and AD occur in the expected direction consistent with the results from previous studies on the differences between CN, overall aMCI, and AD. Both AD and aMCI+ showed decreased DMN FC compared to CN. The novel aspect of the present report was the comparisons of aMCI− with CN and aMCI+. aMCI− demonstrated increased FC strength in several DMN regions, mainly involving the precuneus, posterior cingulate, superior parietal, and superior temporal regions compared to aMCI+ as well as CN. Furthermore, aMCI− showed decreased FC strength of the SN in the left iFG compared to both CN and aMCI+. The present findings show that aMCI− has quite a different functional brain connectivity compared to aMCI+ despite overall similarity in cross-sectional cognitive features. To the best of our knowledge, this is the first study to directly examine FC alterations in both DMN and SN between aMCI+ and aMCI−.
Functional connectivity alterations in the posterior regions (i.e., the precuneus and PCC) of the DMN in AD and aMCI have been repeatedly found in previous task-related as well as task-free fMRI studies (Lustig et al., 2003; Greicius et al., 2004; Celone et al., 2006). The current study extends our knowledge about the DMN FC alterations in aMCI by specifying that previously reported FC alterations are distinctive of aMCI with high Aβ burden. The most widely held hypothesis to account for such finding is that the decreased FC in the posterior association cortices is not only secondary to local AD-related neuropathological abnormalities in the very posterior DMN regions but also reflects distant effects of neuronal damage in the remote brain regions, such as the medial temporal lobe including hippocampus, based on its massive connectivity with widespread brain regions (Arnold et al., 1991; Jack et al., 2008; Bourgeat et al., 2010).
Unlike aMCI+ whose SN FC was comparable to CN, aMCI− exhibited decreased FC strength of the SN in the left iFG compared to CN and aMCI+. Furthermore, FC strength in the posterior regions of the DMN increased in aMCI− compared to CN and aMCI+. The present study does not demonstrate the causal relationship between memory difficulties and FC disruptions. However, given the role of the SN in disengaging the DMN when on a cognitive task (Rilling et al., 2008; Sridharan et al., 2008; Sharp et al., 2010; Bonnelle et al., 2012), the ability of aMCI− to disengage the DMN may be compromised resulting in manifestation of reduced memory performance from inefficient processing of information. Alternatively, increased FC of the DMN may indicate greater recruitment of the regions in order to compensate for atrophied temporal pole given that the posterior DMN has been implicated in memory retrieval (Shapira-Lichter et al., 2013).
The differential network changes of aMCI− and aMCI+ are also noteworthy when explicated in conjunction with the differential patterns of atrophy in aMCI− versus aMCI+ compared to CN. In aMCI+, atrophy was observed in the same region where decreased FC was found in AD compared to CN (i.e., right precuneus of the DMN), which is also one of the regions where Aβ aggregates very early in the AD process. In contrast to aMCI+, the regions of FC alterations and atrophy do not necessarily overlap in aMCI−. The current findings suggest that decreased FC of the SN in aMCI− may be associated, at least in part, to atrophied superior temporal gyri given that the regions share dense connection with the regions of the SN (Augustine, 1996).
The results of the present study point to the DMN as an important intrinsic network differentiating aMCI− and aMCI+ as well as from CN. Challenges remain, however, in conceptualization of the etiology behind aberrant FC in the PCC and iFG in aMCI−. The FC alterations in aMCI− likely reflect non-AD pathology, although the exact nature of the pathology is still not clearly elucidated. Potential candidate pathologies underlying the impairment include cerebrovascular disease, hippocampal sclerosis, or Lewy body disease (Bennett et al., 2005; Jicha et al., 2006; Schneider et al., 2007). Alternatively, FC alterations in aMCI− may reflect underlying dysregulated lipid metabolism. A recent study from our research group suggested that cognitive deficits and brain atrophy in aMCI− are associated with decreased serum apolipoprotein A-1 (APOA1), the major component of HDL cholesterol independently of Aβ and vascular burden; the authors posited that antioxidant and/or anti-inflammatory properties of APOA1 as well as its critical role in reverse cholesterol transport may account for the contribution of the lipoprotein to non-AD brain damage (Choi et al., 2013). Additional etiological considerations for aberrant FC of the SN and the DMN may include mood disorders. A recent study on major depressive disorder found decreased FC within the SN as well as aberrant inter-network FC between subsystems of the DMN and the central executive network in patients compared to healthy adults (Manoliu et al., 2013). Future studies are needed to examine and verify the relationship between non-AD pathological contributions and altered FC of the DMN and SN in aMCI− compared to aMCI+ and CN in order to elucidate the etiology.
This study has some limitations. First, the sample size in each group is relatively small. We tried to overcome statistical challenges due to small sample size by utilizing dual-regression with permutations; also, by combining all subjects in our gICA instead of using just CN, we ended up with more conservative results when describing alterations in FC in participants. Second, all presented data are cross-sectional in nature. Longitudinal changes in the networks may enable in-depth investigation of properties of alterations in these networks.
In conclusion, our results indicate that despite very similar cross-sectional profile of cognitive deficits, aMCI individuals with very low Aβ burden have quite different connectivity alteration pattern in the DMN and SN, compared to those with high Aβ burden. From a practical point of view, this discrepancy in the patterns of FC changes between the two aMCI groups may be utilized as a cost-effective biomarker for differentiating those who are at higher risk for AD dementia from those who are related to non-AD pathological processes among clinically defined overall aMCI individuals.
Author Contributions
DY made contribution to the design of the work and performed the data analyses and prepared the manuscript. YC, MB, BS, ES, JH, and JP made substantial contribution to the acquisition of the data and provided critical intellectual reviews. DL provided a substantial contribution to the design of the work as well as to the analyses and interpretation of data; and, he critically revised the paper and approved the final version. JW made contribution to the conception of the work and acquisition of the data. All authors approved the final version to be published.
Conflict of Interest Statement
The authors declare that the research was conducted in the absence of any commercial or financial relationships that could be construed as a potential conflict of interest.
Acknowledgments
This study was supported by a grant from the Korea Healthcare Technology R & D Project, Ministry of Health, Welfare & Family Affairs, Republic of Korea (grant no. A092145); a grant from the KIST Open Research Program (grant no. 2013-1520); and a grant from the Ministry of Science, ICT, and Future Planning, Republic of Korea (grant no. 2013M3C7A1069644).
Footnotes
References
Arnold, S. E., Hyman, B. T., Flory, J., Damasio, A. R., and Van Hoesen, G. W. (1991). The topographical and neuroanatomical distribution of neurofibrillary tangles and neuritic plaques in the cerebral cortex of patients with Alzheimer’s disease. Cereb. Cortex 1, 103–116. doi:10.1093/cercor/1.1.103
Pubmed Abstract | Pubmed Full Text | CrossRef Full Text | Google Scholar
Ashburner, J. (2007). A fast diffeomorphic image registration algorithm. Neuroimage 38, 95–113. doi:10.1016/j.neuroimage.2007.07.007
Augustine, J. R. (1996). Circuitry and functional aspects of the insular lobe in primates including humans. Brain Res. Brain Res. Rev. 22, 229–244. doi:10.1016/S0165-0173(96)00011-2
Beckmann, C. F., DeLuca, M., Devlin, J. T., and Smith, S. M. (2005). Investigations into resting-state connectivity using independent component analysis. Philos. Trans. R. Soc. Lond. B Biol. Sci. 360, 1001–1013. doi:10.1098/rstb.2005.1634
Bennett, D. A., Schneider, J. A., Bienias, J. L., Evans, D. A., and Wilson, R. S. (2005). Mild cognitive impairment is related to Alzheimer disease pathology and cerebral infarctions. Neurology 64, 834–841. doi:10.1212/01.WNL.0000152982.47274.9E
Biswal, B., Yetkin, F. Z., Haughton, V. M., and Hyde, J. S. (1995). Functional connectivity in the motor cortex of resting human brain using echo-planar MRI. Magn. Reson. Med. 34, 537–541. doi:10.1002/mrm.1910340409
Bonnelle, V., Ham, T. E., Leech, R., Kinnunen, K. M., Mehta, M. A., Greenwood, R. J., et al. (2012). Salience network integrity predicts default mode network function after traumatic brain injury. Proc. Natl. Acad. Sci. U.S.A. 109, 4690–4695. doi:10.1073/pnas.1113455109
Pubmed Abstract | Pubmed Full Text | CrossRef Full Text | Google Scholar
Bourgeat, P., Chetelat, G., Villemagne, V. L., Fripp, J., Raniga, P., Pike, K., et al. (2010). Beta-amyloid burden in the temporal neocortex is related to hippocampal atrophy in elderly subjects without dementia. Neurology 74, 121–127. doi:10.1212/WNL.0b013e3181c918b5
Pubmed Abstract | Pubmed Full Text | CrossRef Full Text | Google Scholar
Buckner, R. L., Snyder, A. Z., Shannon, B. J., LaRossa, G., Sachs, R., Fotenos, A. F., et al. (2005). Molecular, structural, and functional characterization of Alzheimer’s disease: evidence for a relationship between default activity, amyloid, and memory. J. Neurosci. 25, 7709–7717. doi:10.1523/JNEUROSCI.2177-05.2005
Celone, K. A., Calhoun, V. D., Dickerson, B. C., Atri, A., Chua, E. F., Miller, S. L., et al. (2006). Alterations in memory networks in mild cognitive impairment and Alzheimer’s disease: an independent component analysis. J. Neurosci. 26, 10222–10231. doi:10.1523/JNEUROSCI.2250-06.2006
Pubmed Abstract | Pubmed Full Text | CrossRef Full Text | Google Scholar
Choi, H. J., Lee, D. Y., Seo, E. H., Sohn, B. K., Choe, Y. M., and Woo, J. I. (2013). PIB-negative amnestic mild cognitive impairment related with low plasma apolipoprotein A1 level. Alzheimer Dement. 9, 26–27. doi:10.1016/j.jalz.2013.04.378
Choo, I. H., Lee, D. Y., Kim, J. W., Seo, E. H., Lee, D. S., Kim, Y. K., et al. (2011). Relationship of amyloid-beta burden with age-at-onset in Alzheimer disease. Am. J. Geriatr. Psychiatry 19, 627–634. doi:10.1097/JGP.0b013e318202bf3a
Pubmed Abstract | Pubmed Full Text | CrossRef Full Text | Google Scholar
De Luca, M., Beckmann, C. F., De Stefano, N., Matthews, P. M., and Smith, S. M. (2006). fMRI resting state networks define distinct modes of long-distance interactions in the human brain. Neuroimage 29, 1359–1367. doi:10.1016/j.neuroimage.2005.08.035
Pubmed Abstract | Pubmed Full Text | CrossRef Full Text | Google Scholar
Farb, N. A., Grady, C. L., Strother, S., Tang-Wai, D. F., Masellis, M., Black, S., et al. (2013). Abnormal network connectivity in frontotemporal dementia: evidence for prefrontal isolation. Cortex 49, 1856–1873. doi:10.1016/j.cortex.2012.09.008
Pubmed Abstract | Pubmed Full Text | CrossRef Full Text | Google Scholar
Filippini, N., MacIntosh, B. J., Hough, M. G., Goodwin, G. M., Frisoni, G. B., Smith, S. M., et al. (2009). Distinct patterns of brain activity in young carriers of the APOE-epsilon4 allele. Proc. Natl. Acad. Sci. U.S.A. 106, 7209–7214. doi:10.1073/pnas.0811879106
Pubmed Abstract | Pubmed Full Text | CrossRef Full Text | Google Scholar
Fox, M. D., and Raichle, M. E. (2007). Spontaneous fluctuations in brain activity observed with functional magnetic resonance imaging. Nat. Rev. Neurosci. 8, 700–711. doi:10.1038/nrn2201
Greicius, M. D., Srivastava, G., Reiss, A. L., and Menon, V. (2004). Default-mode network activity distinguishes Alzheimer’s disease from healthy aging: evidence from functional MRI. Proc. Natl. Acad. Sci. U.S.A. 101, 4637–4642. doi:10.1073/pnas.0308627101
Pubmed Abstract | Pubmed Full Text | CrossRef Full Text | Google Scholar
Hardy, J., and Selkoe, D. J. (2002). The amyloid hypothesis of Alzheimer’s disease: progress and problems on the road to therapeutics. Science 297, 353–356. doi:10.1126/science.1072994
Pubmed Abstract | Pubmed Full Text | CrossRef Full Text | Google Scholar
He, Y., Chen, Z., Gong, G., and Evans, A. (2009). Neuronal networks in Alzheimer’s disease. Neuroscientist 15, 333–350. doi:10.1177/1073858409334423
Pubmed Abstract | Pubmed Full Text | CrossRef Full Text | Google Scholar
Hedden, T., Van Dijk, K. R., Becker, J. A., Mehta, A., Sperling, R. A., Johnson, K. A., et al. (2009). Disruption of functional connectivity in clinically normal older adults harboring amyloid burden. J. Neurosci. 29, 12686–12694. doi:10.1523/JNEUROSCI.3189-09.2009
Pubmed Abstract | Pubmed Full Text | CrossRef Full Text | Google Scholar
Jack, C. R. Jr., Lowe, V. J., Senjem, M. L., Weigand, S. D., Kemp, B. J., Shiung, M. M., et al. (2008). 11C PiB and structural MRI provide complementary information in imaging of Alzheimer’s disease and amnestic mild cognitive impairment. Brain 131(Pt 3), 665–680. doi:10.1093/brain/awm336
Pubmed Abstract | Pubmed Full Text | CrossRef Full Text | Google Scholar
Jicha, G. A., Parisi, J. E., Dickson, D. W., Johnson, K., Cha, R., Ivnik, R. J., et al. (2006). Neuropathologic outcome of mild cognitive impairment following progression to clinical dementia. Arch. Neurol. 63, 674–681. doi:10.1001/archneur.63.5.674
Pubmed Abstract | Pubmed Full Text | CrossRef Full Text | Google Scholar
Lee, D. Y., Lee, K. U., Lee, J. H., Kim, K. W., Jhoo, J. H., Kim, S. Y., et al. (2004). A normative study of the CERAD neuropsychological assessment battery in the Korean elderly. J. Int. Neuropsychol. Soc. 10, 72–81. doi:10.1017/S1355617704101094
Pubmed Abstract | Pubmed Full Text | CrossRef Full Text | Google Scholar
Lee, J. H., Lee, K. U., Lee, D. Y., Kim, K. W., Jhoo, J. H., Kim, J. H., et al. (2002). Development of the Korean version of the consortium to establish a registry for Alzheimer’s disease assessment packet (CERAD-K): clinical and neuropsychological assessment batteries. J. Gerontol. B Psychol. Sci. Soc. Sci. 57, 47–53. doi:10.1093/geronb/57.1.P47
Pubmed Abstract | Pubmed Full Text | CrossRef Full Text | Google Scholar
Lopresti, B. J., Klunk, W. E., Mathis, C. A., Hoge, J. A., Ziolko, S. K., Lu, X., et al. (2005). Simplified quantification of Pittsburgh compound B amyloid imaging PET studies: a comparative analysis. J. Nucl. Med. 46, 1959–1972.
Lustig, C., Snyder, A. Z., Bhakta, M., O’Brien, K. C., McAvoy, M., Raichle, M. E., et al. (2003). Functional deactivations: change with age and dementia of the Alzheimer type. Proc. Natl. Acad. Sci. U.S.A. 100, 14504–14509. doi:10.1073/pnas.2235925100
Pubmed Abstract | Pubmed Full Text | CrossRef Full Text | Google Scholar
Manjon, J. V., Coupe, P., Marti-Bonmati, L., Collins, D. L., and Robles, M. (2010). Adaptive non-local means denoising of MR images with spatially varying noise levels. J. Magn. Reson. Imaging 31, 192–203. doi:10.1002/jmri.22003
Pubmed Abstract | Pubmed Full Text | CrossRef Full Text | Google Scholar
Manoliu, A., Meng, C., Brandl, F., Doll, A., Tahmasian, M., Scherr, M., et al. (2013). Insular dysfunction within the salience network is associated with severity of symptoms and aberrant inter-network connectivity in major depressive disorder. Front. Hum. Neurosci. 7:930. doi:10.3389/fnhum.2013.00930
Pubmed Abstract | Pubmed Full Text | CrossRef Full Text | Google Scholar
McKhann, G., Drachman, D., Folstein, M., Katzman, R., Price, D., and Stadlan, E. M. (1984). Clinical diagnosis of Alzheimer’s disease: report of the NINCDS-ADRDA work group under the auspices of department of health and human services task force on Alzheimer’s disease. Neurology 34, 939–944. doi:10.1212/WNL.34.7.939
Pubmed Abstract | Pubmed Full Text | CrossRef Full Text | Google Scholar
Morris, J. C. (1993). The clinical dementia rating (CDR): current version and scoring rules. Neurology 43, 2412–2414. doi:10.1212/WNL.43.11.2412-a
Morris, J. C. (2006). Mild cognitive impairment is early-stage Alzheimer disease: time to revise diagnostic criteria. Arch. Neurol. 63, 15–16. doi:10.1001/archneur.63.1.15
Morris, J. C., Heyman, A., Mohs, R. C., Hughes, J. P., van Belle, G., Fillenbaum, G., et al. (1989). The consortium to establish a registry for Alzheimer’s disease (CERAD). Part I. Clinical and neuropsychological assessment of Alzheimer’s disease. Neurology 39, 1159–1165. doi:10.1212/WNL.39.9.1159
Nordberg, A., Carter, S. F., Rinne, J., Drzezga, A., Brooks, D. J., Vandenberghe, R., et al. (2013). A European multicentre PET study of fibrillar amyloid in Alzheimer’s disease. Eur. J. Nucl. Med. Mol. Imaging 40, 104–114. doi:10.1007/s00259-012-2237-2
Pubmed Abstract | Pubmed Full Text | CrossRef Full Text | Google Scholar
Petersen, R. C. (2004). Mild cognitive impairment as a diagnostic entity. J. Intern. Med. 256, 183–194. doi:10.1111/j.1365-2796.2004.01388.x
Pubmed Abstract | Pubmed Full Text | CrossRef Full Text | Google Scholar
Price, J. C., Klunk, W. E., Lopresti, B. J., Lu, X., Hoge, J. A., Ziolko, S. K., et al. (2005). Kinetic modeling of amyloid binding in humans using PET imaging and Pittsburgh compound-B. J. Cereb. Blood Flow Metab. 25, 1528–1547. doi:10.1038/sj.jcbfm.9600146
Pubmed Abstract | Pubmed Full Text | CrossRef Full Text | Google Scholar
Raichle, M. E., MacLeod, A. M., Snyder, A. Z., Powers, W. J., Gusnard, D. A., and Shulman, G. L. (2001). A default mode of brain function. Proc. Natl. Acad. Sci. U.S.A. 98, 676–682. doi:10.1073/pnas.98.2.676
Reiman, E. M., Chen, K., Liu, X., Bandy, D., Yu, M., Lee, W., et al. (2009). Fibrillar amyloid-beta burden in cognitively normal people at 3 levels of genetic risk for Alzheimer’s disease. Proc. Natl. Acad. Sci. U.S.A. 106, 6820–6825. doi:10.1073/pnas.0900345106
Pubmed Abstract | Pubmed Full Text | CrossRef Full Text | Google Scholar
Rilling, J. K., Dagenais, J. E., Goldsmith, D. R., Glenn, A. L., and Pagnoni, G. (2008). Social cognitive neural networks during in-group and out-group interactions. Neuroimage 41, 1447–1461. doi:10.1016/j.neuroimage.2008.03.044
Pubmed Abstract | Pubmed Full Text | CrossRef Full Text | Google Scholar
Rowe, C. C., Ng, S., Ackermann, U., Gong, S. J., Pike, K., Savage, G., et al. (2007). Imaging beta-amyloid burden in aging and dementia. Neurology 68, 1718–1725. doi:10.1212/01.wnl.0000261919.22630.ea
Pubmed Abstract | Pubmed Full Text | CrossRef Full Text | Google Scholar
Schneider, J. A., Arvanitakis, Z., Bang, W., and Bennett, D. A. (2007). Mixed brain pathologies account for most dementia cases in community-dwelling older persons. Neurology 69, 2197–2204. doi:10.1212/01.wnl.0000271090.28148.24
Scholvinck, M. L., Maier, A., Ye, F. Q., Duyn, J. H., and Leopold, D. A. (2010). Neural basis of global resting-state fMRI activity. Proc. Natl. Acad. Sci. U.S.A. 107, 10238–10243. doi:10.1073/pnas.0913110107
Pubmed Abstract | Pubmed Full Text | CrossRef Full Text | Google Scholar
Seo, E. H., Lee, D. Y., Choo, I. H., Kim, S. G., Kim, K. W., Youn, J. C., et al. (2008). Normative study of the Stroop color and word test in an educationally diverse elderly population. Int. J. Geriatr. Psychiatry 23, 1020–1027. doi:10.1002/gps.2027
Pubmed Abstract | Pubmed Full Text | CrossRef Full Text | Google Scholar
Shapira-Lichter, I., Oren, N., Jacob, Y., Gruberger, M., and Hendler, T. (2013). Portraying the unique contribution of the default mode network to internally driven mnemonic processes. Proc. Natl. Acad. Sci. U.S.A. 110, 4950–4955. doi:10.1073/pnas.1209888110
Pubmed Abstract | Pubmed Full Text | CrossRef Full Text | Google Scholar
Sharp, D. J., Bonnelle, V., De Boissezon, X., Beckmann, C. F., James, S. G., Patel, M. C., et al. (2010). Distinct frontal systems for response inhibition, attentional capture, and error processing. Proc. Natl. Acad. Sci. U.S.A. 107, 6106–6111. doi:10.1073/pnas.1000175107
Sheline, Y. I., Morris, J. C., Snyder, A. Z., Price, J. L., Yan, Z., D’Angelo, G., et al. (2010). APOE4 allele disrupts resting state fMRI connectivity in the absence of amyloid plaques or decreased CSF Abeta42. J. Neurosci. 30, 17035–17040. doi:10.1523/JNEUROSCI.3987-10.2010
Pubmed Abstract | Pubmed Full Text | CrossRef Full Text | Google Scholar
Smith, S. M., Fox, P. T., Miller, K. L., Glahn, D. C., Fox, P. M., Mackay, C. E., et al. (2009). Correspondence of the brain’s functional architecture during activation and rest. Proc. Natl. Acad. Sci. U.S.A. 106, 13040–13045. doi:10.1073/pnas.0905267106
Pubmed Abstract | Pubmed Full Text | CrossRef Full Text | Google Scholar
Smith, S. M., and Nichols, T. E. (2009). Threshold-free cluster enhancement: addressing problems of smoothing, threshold dependence and localisation in cluster inference. Neuroimage 44, 83–98. doi:10.1016/j.neuroimage.2008.03.061
Pubmed Abstract | Pubmed Full Text | CrossRef Full Text | Google Scholar
Sorg, C., Riedl, V., Muhlau, M., Calhoun, V. D., Eichele, T., Laer, L., et al. (2007). Selective changes of resting-state networks in individuals at risk for Alzheimer’s disease. Proc. Natl. Acad. Sci. U.S.A. 104, 18760–18765. doi:10.1073/pnas.0708803104
Pubmed Abstract | Pubmed Full Text | CrossRef Full Text | Google Scholar
Sperling, R. A., Laviolette, P. S., O’Keefe, K., O’Brien, J., Rentz, D. M., Pihlajamaki, M., et al. (2009). Amyloid deposition is associated with impaired default network function in older persons without dementia. Neuron 63, 178–188. doi:10.1016/j.neuron.2009.07.003
Pubmed Abstract | Pubmed Full Text | CrossRef Full Text | Google Scholar
Sridharan, D., Levitin, D. J., and Menon, V. (2008). A critical role for the right fronto-insular cortex in switching between central-executive and default-mode networks. Proc. Natl. Acad. Sci. U.S.A. 105, 12569–12574. doi:10.1073/pnas.0800005105
Talairach, J., and Tournoux, P. (1988). Co-Planar Stereotaxic Atlas of the Human Brain. New York, NY: Thieme.
Tohka, J., Zijdenbos, A., and Evans, A. (2004). Fast and robust parameter estimation for statistical partial volume models in brain MRI. Neuroimage 23, 84–97. doi:10.1016/j.neuroimage.2004.05.007
Pubmed Abstract | Pubmed Full Text | CrossRef Full Text | Google Scholar
Tzourio-Mazoyer, N., Landeau, B., Papathanassiou, D., Crivello, F., Etard, O., Delcroix, N., et al. (2002). Automated anatomical labeling of activations in SPM using a macroscopic anatomical parcellation of the MNI MRI single-subject brain. Neuroimage 15, 273–289. doi:10.1006/nimg.2001.0978
Pubmed Abstract | Pubmed Full Text | CrossRef Full Text | Google Scholar
Villemagne, V. L., Fodero-Tavoletti, M. T., Pike, K. E., Cappai, R., Masters, C. L., and Rowe, C. C. (2008). The ART of loss: a beta imaging in the evaluation of Alzheimer’s disease and other dementias. Mol. Neurobiol. 38, 1–15. doi:10.1007/s12035-008-8019-y
Pubmed Abstract | Pubmed Full Text | CrossRef Full Text | Google Scholar
Wang, L., Zang, Y., He, Y., Liang, M., Zhang, X., Tian, L., et al. (2006). Changes in hippocampal connectivity in the early stages of Alzheimer’s disease: evidence from resting state fMRI. Neuroimage 31, 496–504. doi:10.1016/j.neuroimage.2005.12.033
Wolk, D. A., Price, J. C., Saxton, J. A., Snitz, B. E., James, J. A., Lopez, O. L., et al. (2009). Amyloid imaging in mild cognitive impairment subtypes. Ann. Neurol. 65, 557–568. doi:10.1002/ana.21598
Keywords: amnestic mild cognitive impairment, amyloid-beta deposition, brain functional connectivity, default mode network, salience network
Citation: Yi D, Choe YM, Byun MS, Sohn BK, Seo EH, Han J, Park J, Woo JI and Lee DY (2015) Differences in functional brain connectivity alterations associated with cerebral amyloid deposition in amnestic mild cognitive impairment. Front. Aging Neurosci. 7:15. doi: 10.3389/fnagi.2015.00015
Received: 23 July 2014; Accepted: 03 February 2015;
Published online: 19 February 2015.
Edited by:
Manuel Menéndez-González, Hospital Álvarez-Buylla, SpainReviewed by:
Hui Wang, Children’s National Medical Center, USAKoteswara Rao Valasani, The University of Kansas, USA
Copyright: © 2015 Yi, Choe, Byun, Sohn, Seo, Han, Park, Woo and Lee. This is an open-access article distributed under the terms of the Creative Commons Attribution License (CC BY). The use, distribution or reproduction in other forums is permitted, provided the original author(s) or licensor are credited and that the original publication in this journal is cited, in accordance with accepted academic practice. No use, distribution or reproduction is permitted which does not comply with these terms.
*Correspondence: Dong Young Lee, Department of Psychiatry and Behavioral Science, Seoul National University College of Medicine, 101 Daehak-ro, Jongno-gu, Seoul 110-744, South Korea e-mail: selfpsy@snu.ac.kr