Physiological characterization of formyl peptide receptor expressing cells in the mouse vomeronasal organ
 Tobias Ackels
 Benoît von der Weid
 Ivan Rodriguez2
  Marc Spehr
- 1Department of Chemosensation, RWTH Aachen University, Aachen, Germany
- 2Department of Genetics and Evolution, University of Geneva, Geneva, Switzerland
The mouse vomeronasal organ (VNO) is a chemosensory structure that detects both hetero- and conspecific social cues. Based on largely monogenic expression of either type 1 or 2 vomeronasal receptors (V1Rs/V2Rs) or members of the formyl peptide receptor (FPR) family, the vomeronasal sensory epithelium harbors at least three neuronal subpopulations. While various neurophysiological properties of both V1R- and V2R-expressing neurons have been described using genetically engineered mouse models, the basic biophysical characteristics of the more recently identified FPR-expressing vomeronasal neurons have not been studied. Here, we employ a transgenic mouse strain that coexpresses an enhanced variant of yellow fluorescent protein together with FPR-rs3 allowing to identify and analyze FPR-rs3-expressing neurons in acute VNO tissue slices. Single neuron electrophysiological recordings allow comparative characterization of the biophysical properties inherent to a prototypical member of the FPR-expressing subpopulation of VNO neurons. In this study, we provide an in-depth analysis of both passive and active membrane properties, including detailed characterization of several types of voltage-activated conductances and action potential discharge patterns, in fluorescently labeled vs. unmarked vomeronasal neurons. Our results reveal striking similarities in the basic (electro) physiological architecture of both transgene-expressing and non-expressing neurons, confirming the suitability of this genetically engineered mouse model for future studies addressing more specialized issues in vomeronasal FPR neurobiology.
Introduction
For mammals, the sense of smell is crucial to interact adequately with their environment. Fundamental information about hetero- and conspecifics, such as identity, social or reproductive state, is gathered by the olfactory system. In most mammals, this system consists of up to four anatomically and functionally distinct subsystems: the main olfactory system (Firestein, 2001; Mombaerts, 2004), the Grueneberg ganglion (Fuss et al., 2005; Koos and Fraser, 2005; Roppolo et al., 2006; Brechbühl et al., 2008; Schmid et al., 2010), the septal organ of Masera (Adams, 1992; Ma et al., 2003) and the vomeronasal organ (VNO). The VNO is a bilateral tubular structure located at the base of the nasal septum. Vomeronasal sensory neurons (VSNs) are highly sensitive chemoreceptors thought to primarily detect semiochemicals and other social cues (Leinders-Zufall et al., 2000; Dulac and Torello, 2003; Spehr et al., 2006; Ferrero et al., 2013). VSNs project single unbranched axons to the accessory olfactory bulb (AOB). To date, members of at least four chemoreceptor gene families are expressed in VSNs: the V1r (Dulac and Axel, 1995) and V2r (Herrada and Dulac, 1997; Matsunami and Buck, 1997; Ryba and Tirindelli, 1997) families, with more than 100 functional members each, a few odorant receptors (Lévai et al., 2006), and the recently discovered formyl peptide receptor (FPR)-related sequence (Fpr-rs) family of putative chemoreceptor genes. The Fpr-rs family comprises 7 members, 5 of which (Fpr-rs1, rs3, rs4, rs6 and rs7) are predominantly or exclusively expressed in subsets of VSNs (Liberles et al., 2009; Rivière et al., 2009; Chamero et al., 2012). As key mediators of leukocyte chemotaxis, FPR1 and FPR-rs2 receptor proteins are expressed in immune cells such as granulocytes and monocytes (Rivière et al., 2009; He et al., 2013) where they serve crucial functions in host defense against pathogens by detecting microbe- and/or host-derived inflammation-associated metabolites (Migeotte et al., 2006; Le et al., 2007; Soehnlein and Lindbom, 2010). However, neither FPR1 nor FPR-rs2 was found transcribed in mouse VSNs (Liberles et al., 2009; Rivière et al., 2009).
Vomeronasal sensory neurons expressing members of the V1R family of G protein-coupled receptors are located in the more apical part of the vomeronasal sensory epithelium. These neurons co-express the G-protein α-subunit Gαi2 and project to the anterior part of the AOB (Belluscio et al., 1999; Rodriguez et al., 1999). Functionally, V1R neurons respond to sulfated steroids and to a variety of other secreted ethologically relevant small semiochemicals (Leinders-Zufall et al., 2000; Boschat et al., 2002; Novotny, 2003; Nodari et al., 2008; Isogai et al., 2011). By contrast, V2R expression is restricted to VSNs in the more basal Gαo-positive layer (Martini et al., 2001; Matsuoka et al., 2001; Dulac and Torello, 2003). V2R neurons predominantly detect peptides/small proteins (Leinders-Zufall et al., 2004; Chamero et al., 2007; Kimoto et al., 2007; Ferrero et al., 2013; Kaur et al., 2014) and project to the posterior region of the AOB. For FPR-rs3 expressing neurons, we recently described axonal projections to the rostral AOB (Dietschi et al., 2013), the target region of V1R neurons.
The single Fpr-rs gene cluster is adjacent to a stretch of more than 30 V1/2r genes. However, neither V1rs, nor V2rs share significant sequence homology with vomeronasal Fpr-rs genes. Liberles and coworkers suggested that vomeronasal Fprs evolved from recent gene duplications and positive selection in the rodent lineage (Liberles et al., 2009). Together with recent functional data obtained from recombinant FPR expression (Bufe et al., 2012), these considerations argue for a neofunctionalization of vomeronasal Fpr-rs genes. Their predicted seven-transmembrane topology, their selective, punctate and monogenic vomeronasal expression pattern, and their localization in microvillous dendritic VSN endings (Liberles et al., 2009; Rivière et al., 2009), however, strongly suggest a functional role of FPR-rs in vomeronasal chemosignaling. Interestingly, while Fpr-rs1 is coexpressed with Gαo in basal sensory neurons, the remaining vomeronasal Fpr-rs genes all coexpress Gαi2 in the apical layer of the VNO neuroepithelium (Liberles et al., 2009; Munger, 2009; Rivière et al., 2009). Vomeronasal sensory neurons are activated in situ by formylated peptides and various other antimicrobial/inflammatory modulators (Rivière et al., 2009; Chamero et al., 2011) and heterologously expressed FPR-rs proteins retain agonist spectra that share some similarities to immune system FPRs (Rivière et al., 2009). However, the exact biological role of vomeronasal FPRs remains to be determined.
To address the neurobiological function of vomeronasal FPRs experimentally, a detailed physiological characterization of Fpr-rs neurons in their native environment is mandatory. Genetically modified animals in which the receptor identity of a given chemosensory neuron is marked by coexpression of a fluorescent reporter have proven particularly fruitful in the analysis of olfactory signaling (Boschat et al., 2002; Bozza et al., 2002; Grosmaitre et al., 2006, 2009; Oka et al., 2006; Ukhanov et al., 2007; Leinders-Zufall et al., 2009; Pacifico et al., 2012). Here, we describe a transgenic mouse strain that expresses FPR-rs3 together with a fluorescent marker (Fpr-rs3-i-Venus). This mouse model allows optical identification and subsequent physiological analysis of FPR-rs3-expressing neurons in acute VNO tissue slices. Using single neuron patch-clamp recordings, we thus provide an in-depth electrophysiological characterization of the basic biophysical properties inherent to a prototypical member of the FPR-expressing subpopulation of VNO neurons. Our analysis spans several types of voltage-activated conductances as well as action potential discharge parameters in both fluorescently labeled and control VSNs. Our data reveal a number of physiological similarities between FPR-rs3-expressing and non-expressing neurons. Together, these results confirm the suitability of Fpr-rs3-i-Venus mice for future studies of vomeronasal FPR neurobiology and, in addition, these findings indicate that the FPR expression does not confer a distinct biophysical phenotype to the subpopulation of FPR-positive VSNs.
Materials and Methods
Animals
All animal procedures were in compliance with local and European Union legislation on the protection of animals used for experimental purposes (Directive 86/609/EEC) and with recommendations put forward by the Federation of European Laboratory Animal Science Associations (FELASA). Both C57BL/6 mice (Charles River Laboratories, Sulzfeld, Germany) and Fpr-rs3-i-Venus mice were housed in groups of both sexes at room temperature on a 12 h light/dark cycle with food and water available ad libitum. Experiments used young adults of either sex. We did not observe obvious gender-dependent differences.
Transgenic Mice
The transgene (Fpr-rs3-i-Venus) contains the FPR-rs3 coding sequence followed by an internal ribosome entry site (IRES), and the coding sequence for tau-Venus, a fusion between the microtubule-associated protein tau and Venus yellow fluorescent protein (Nagai et al., 2002). These coding sequences are under the control of the H element followed by the MOR28 promoter (Serizawa et al., 2006; modified by and generously provided by P. Feinstein). The Fpr-rs3-i-Venus transgene was isolated on gel after BssHII digestion and purified using the QIAquick® Gel extraction kit (QIAGEN, Hilden, Germany). The transgene was injected into the pronuclei of fertilized C57BL6/DBA2 mouse oocytes following standard procedures. Four founders carrying the transgene were obtained. One of these founder animals expressed the transgene in VSNs and was, thus, used to start the colony. Backcrossed to C57BL/6J, mice were kept hemizygous. Wild type and transgenic mice had no obvious differences in size, weight, fertility, life expectancy or food consumption.
Chemicals and Solutions
The following solutions were used: (S1) 4-(2-Hydroxy-ethyl)piperazine-1-ethanesulfonic acid (HEPES) buffered extracellular solution containing (in mM) 145 NaCl, 5 KCl, 1 CaCl2, 1 MgCl2, 10 HEPES; pH = 7.3 (adjusted with NaOH); osmolarity = 300 mOsm (adjusted with glucose). (S2) Oxygenated (95% O2, 5% CO2) extracellular solution containing (in mM) 125 NaCl, 25 NaHCO3, 5 KCl, 1 CaCl2, 1 MgSO4, 5 BES; pH = 7.3; osmolarity = 300 mOsm. (S3) solution containing (in mM) 144 NaCl, 5 KCl, 1 TEACl, 1 CaCl2, 1 MgCl2, 10 HEPES, pH 7.3; osmolarity = 300 mOsm. (S4) solution containing (in mM) 134 NaCl, 5 KCl, 1 TEACl, 1 CaCl2, 1 MgCl2, 10 HEPES, 10 4-AP, pH 7.3; osmolarity = 300 mOsm. (S5) solution containing (in mM) 110 NaCl, 5 KCl, 25 TEACl, 1 CaCl2, 1 MgCl2, 10 HEPES, 10 4-AP, pH 7.3; osmolarity = 300 mOsm. (S6) solution containing (in mM) 115 NaCl, 25 TEACl, 1, 1 MgCl2, 10 HEPES, 10 4-AP, pH 7.3; osmolarity = 300 mOsm. (S7) solution containing (in mM) 105 NaCl, 25 TEACl, 5 mM BaCl2, 1 MgCl2, 10 HEPES, 10 4-AP, pH 7.3; osmolarity = 300 mOsm. (S8) Pipette solution containing (in mM) 143 KCl, 2 KOH, 1 EGTA, 0.3 CaCl2 (free Ca2+ = 110 nM), 10 HEPES, 2 MgATP, 1 NaGTP; pH = 7.1 (adjusted with KOH); osmolarity = 290 mOsm. (S9) Pipette solution containing (in mM) 133 CsCl, 10 NaCl, 2 CsOH, 1 EGTA, 0.3 CaCl2 (free Ca2+ = 110 nM), 10 HEPES, 1 MgATP, 1 NaGTP; pH = 7.1 (adjusted with CsOH); osmolarity = 290 mOsm.
Free Ca2+ and Mg2+ concentrations were calculated using WEBMAXC STANDARD1. If not stated otherwise, chemicals were purchased from Sigma (Schnelldorf, Germany). ω-agatoxin IVa and ω-conotoxin GVIA were purchased from Biotrend (Zurich, Switzerland). Stimuli and pharmacological agents were applied from air pressure-driven reservoirs via an 8-in-1 multi-barrel “perfusion pencil” (Science Products, Hofheim, Germany; Veitinger et al., 2011).
Cryosections
For preparation of cryosections, the VNO was fixed in PBS containing 4% paraformaldehyde (2 h; 4°C), decalcified overnight in 0.5 M EDTA (4°C) and cryoprotected in PBS containing 30% sucrose (4°C). The dehydrated VNO was embedded in Tissue Freezing Medium and sectioned at 20 µm on a Leica CM1950 cryostat (Leica Biosystems, Nussloch, Germany).
Vibratome Sections
Acute vomeronasal tissue sections were prepared as previously described (Hagendorf et al., 2009; Spehr et al., 2009). Briefly, mice were sacrificed by brief exposure to CO2 followed by decapitation using sharp surgical scissors. The lower jaw and the soft palate were removed allowing access to the vomeronasal capsule. After removal of the cartilage, the dissected VNO was embedded in 4% low-gelling temperature agarose and coronal slices (150–200 µm) were cut in ice-cold oxygenated extracellular solution (S2) using a Leica VT1000S vibratome (speed: 3.5 a.u. = 0.15 mm/s; frequency: 7.5 a.u. = 75 Hz; amplitude: 0.6 mm; Leica Biosystems). Sections were transferred to a submerged, oxygenated (S2) and chilled storage chamber until use.
Immunohistochemistry
Blocking was performed for 1 h in PBS containing 2% goat serum, 1% gelatine and 0.2% Triton X-100 (blocking solution). Sections were then incubated overnight at 4°C with primary antibody sera (1:500 rabbit anti-V2R2; 1:200 rabbit anti-FPR-rs3) in blocking solution, washed in PBS containing 0.05% Triton-X 100 (3 × 10 min, 1 × 30 min), and incubated for 1 h with Alexa® Fluor secondary antibodies (1:500). Excess antibodies were removed by washing in PBS containing 0.05% Triton-X 100 (3 × 10 min, 1 × 30 min). To control for nonspecific staining, experiments in which the primary antibodies were omitted were performed in parallel with each procedure.
Electrophysiology
Vomeronasal organ slices were transferred to a recording chamber (Luigs & Neumann, Ratingen, Germany) on an upright fixed-stage scanning confocal microscope (TCS SP5 DM6000CFS, Leica Microsystems) equipped with a 20x/1.0 NA water immersion objective (HCX APO L, Leica Microsystems) as well as a cooled a CCD-camera (DFC360FX, Leica Microsystems). Slices were continuously superfused with oxygenated S2 (~3 ml/min; gravity flow; RT). Patch pipettes (4–7 MΩ) were pulled from borosilicate glass capillaries (1.50 mm OD/0.86 mm ID; Science Products) on a PC-10 micropipette puller (Narishige Instruments, Tokyo, Japan), fire-polished (MF-830 Microforge; Narishige Instruments) and filled with pipette solution (S8 or S9) depending on experimental design. An agar bridge (150 mM KCl) connected reference electrode and bath solution. An EPC-10 amplifier controlled by Patchmaster 2.67 software (HEKA Elektronik, Lambrecht/Pfalz, Germany) was used for data acquisition. We monitored and compensated pipette and membrane capacitance as well as series resistance. Only neurons exhibiting small and stable access resistances (≤3% of Rinput; change <20%) were used for analysis. Liquid junction potentials were calculated using JPCalcW software (Barry, 1994) and corrected online. If not stated otherwise, signals were low-pass filtered (analog 3- and 4-pole Bessel filters (–3 dB); adjusted to 1/3–1/5 of the sampling rate (5–10 kHz, depending on protocol)). Between recordings, holding potential (Vhold) was −60 mV. All electrophysiological data were recorded in whole-cell configuration at room temperature.
Data Analysis
All data were obtained from independent experiments performed on at least 3 days using at least three different animals. Individual numbers of cells/experiments (n) are denoted in figure legends. If not stated otherwise, results are presented as means ± SEM. Statistical analyses were performed using paired or unpaired t-tests or one-way ANOVA with Tukey’s HSD post hoc test. Tests and corresponding p-values that report statistical significance are individually specified in figure legends. Drug sensitivity of voltage-gated K+ (Kv) currents was examined based on an “additive” drug exposure regime, i.e., TEA (1 mM), 4-AP (10 mM), and TEA (25 mM) were sequentially applied and the inhibitor-sensitive currents were isolated by subsequent “offline” subtraction from each preceding recording.
Electrophysiological data were analyzed offline using PatchMaster 2.67 (HEKA Elektronik), IGOR Pro 6.3 (WaveMetrics, Lake Oswego, OR) and Excel (Microsoft, Seattle, WA) software. Activation curves were fitted by the Hill equation to calculate the membrane potential of half-maximal activation (V1/2). Current activation time constants (τ) were calculated by fitting individual traces to monoexponential functions I(t) = I1 [exp (−t/τ)] + I0.
Results
Transgenic Expression of Fpr-rs3-i-Venus in a Subset of Neurons in the Mouse VNO
To analyze the biophysical properties inherent to a prototypical member of the FPR-expressing neurons, we engineered transgenic mice that express Fpr-rs3-i-Venus in a subset of olfactory sensory neurons (OSNs). Using standard transgenic techniques (see section materials and methods), we generated such a mouse strain in which FPR-rs3 is coexpressed with tau-Venus, an enhanced variant of yellow fluorescent protein (Nagai et al., 2002) fused to the microtubule-associated protein tau (Figure 1A). Four founders were obtained. Two of them expressed the transgene in OSNs, and one of them in VSNs. We focused our attention on this latter line, given its exclusive vomeronasal expression pattern. Neither hemi-, nor homozygous Fpr-rs3-i-Venus mice from this line showed any obvious aberrant phenotype.
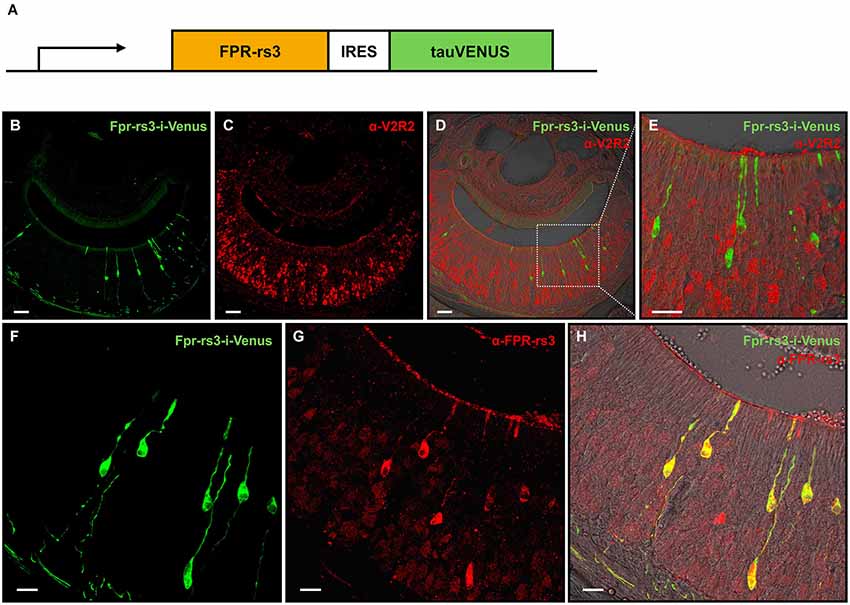
Figure 1. Generation and characterization of the Fpr-rs3-i-Venus transgenic mouse line. (A) Schematic of the transgene that includes an OR promoter/enhancer, followed by the coding sequence of FPR-rs3 and a polycistron that drives the tau-Venus fluorophore. (B) Confocal image of a coronal VNO cryosection showing sparsely distributed fluorescently labeled FPR-rs3+ VSNs (green) in the sensory neuroepithelium. (C) Confocal image displaying a coronal VNO cryosection immunostained with an antibody against V2R2 (red), a family-C V2R expressed in most basal VSNs. (D) Overlay of FPR-rs3 tau-Venus fluorescence and anti-V2R2 staining shows no co-localization of apically located FPR-rs3+ and basal V2R2 expressing neurons. (E) Higher magnification of the boxed area in (D) illustrating the absence of overlapping fluorescence. (F) Confocal image of a VNO cryosection showing distinct green fluorescent FPR-rs3+ sensory neurons (green). (G) Confocal image displaying the same area as in (F) stained against the FPR-rs3 protein (red). (H) Overlay of tau-Venus fluorescence and antibody staining against the FPR-rs3 protein. Note that all transgene-positive cells also express FPR-rs3 (yellow). Scale bars, 50 µm (B–D), 10 µm (E) and 20 µm (F–H).
In coronal VNO tissue slices, a subpopulation of VSNs is fluorescently labeled (81 out of 11,416 neurons (~0.7%); Figures 1B,F) indicating expression of the Fpr-rs3-i-Venus transgene. Fluorescent neurons are morphologically indistinguishable from unlabeled VSNs. Their somata appear to be predominantly located in the apical layer of the neuroepithelium (Figure 1B). Among the five vomeronasal FPRs, FPR-rs3, 4, 6 and 7 are expressed in the more apical Gαi2-positive layer of the VNO sensory epithelium, whereas FPR-rs1 is located in more basal Gαo-expressing neurons (Liberles et al., 2009; Rivière et al., 2009). To investigate layer-specific expression of the Fpr-rs3-i-Venus transgene we immunostained coronal VNO cryosections from hemizygous mice with an antibody against V2R2 (α-V2R2; specific for family-C V2Rs that are broadly expressed in the great majority of basal VSNs; Figures 1C–E; Martini et al., 2001; Silvotti et al., 2007). We never observed colabeling of transgene-expressing and V2R2-immunopositive VSNs (n = 79) confirming layer-specific expression of the FPR-rs3 transgene in apical VSNs. Immunostaining with an anti-FPR-rs3 antibody (Rivière et al., 2009; Dietschi et al., 2013) revealed 424 out of 53,284 FPR-rs3+ VSNs (0.79%), an expression level within the previously reported range between 0.4% and 0.8% (Rivière et al., 2009; Dietschi et al., 2013). Moreover, all transgene-positive cells (n = 225) also express the FPR-rs3 protein (Figures 1F–H). Some FPR-rs3-immunopositive neurons (199 out of 424 cells) did not show detectable Venus fluorescence, consistent with the presence of VSNs endogenously expressing FPR-rs3.
Passive Membrane Properties of FPR-rs3+ VSNs
The passive membrane properties of a neuron determine its basic electrophysiological characteristics and, thus, control its individual stimulus-response function. For FPR-rs expressing vomeronasal neurons, these critical physiological parameters are unknown. Using Fpr-rs3-i-Venus mice, we performed whole-cell patch-clamp recordings from optically identified, fluorescently labeled FPR-rs3-expressing neurons in acute VNO tissue slices (Figures 2A,B). For quantitative comparison, we additionally performed a series of control experiments in randomly chosen VSNs from C57BL/6 wild type mice.
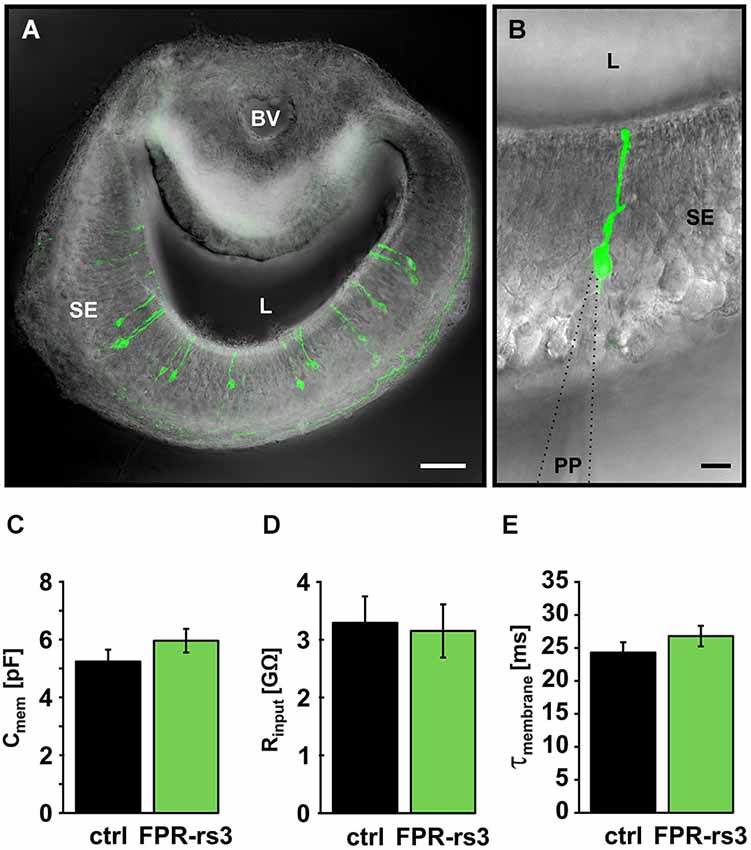
Figure 2. Passive membrane properties of FPR-rs3+ VSNs. (A) Confocal image (maximum projection) of a 150 µm acute coronal VNO tissue slice showing the distribution of fluorescent FPR-rs3 tau-Venus+ neurons (green) in the vomeronasal sensory epithelium. Fluorescent axon bundles are visible within the basal lamina. (B) FPR-rs3 tau-Venus+ neurons exhibit a single apical dendrite ending in a knob-like structure at the luminal border. Whole cell patch-clamp recordings were performed from the VSN soma. (C) Membrane capacitance and (D) input resistance (Rinput) are similar for both control and FPR-rs3+ neurons (n = 21). (E) Membrane time constant (τmembrane) of control neurons compared to FPR-rs3+ cells shows no significant difference (n = 21). Data are mean ± SEM. Blood vessel (BV), lumen (L), patch pipette (PP), sensory epithelium (SE). Scale bars, 50 µm (A), 10 µm (B).
Passive membrane properties (i.e., input resistance (Rinput), membrane capacitance (Cmem), and membrane time constant (τmem)) were obtained immediately after membrane rupture. Treated, to a first approximation, as a “biological constant” with a value of ~1 µF/cm2 (Gentet et al., 2000), Cmem was determined using a square pulse (5 mV, 10 ms) routine. Transgene-positive (FPR-rs3+) neurons revealed an average Cmem value of 5.96 ± 0.49 pF (n = 21), similar to data obtained from control VSNs (5.24 ± 0.38 pF; n = 21; Figure 2C). We next determined Rinput at the VSN soma by measuring the steady-state voltage response to a current step of defined amplitude. The average somatic Rinput of FPR-rs3+ neurons was 3.15 ± 0.49 GΩ (n = 21; Figure 2D). This large value resembles Rinput measurements from control VSNs (3.29 ± 0.43 GΩ; n = 21), suggesting that FPR-rs3+ neurons share the extraordinary sensitivity of V1/2R-expressing VSNs (Liman and Corey, 1996; Shimazaki et al., 2006; Hagendorf et al., 2009). Linear passive voltage responses were also used to estimate τmem from monoexponential fits to the voltage responses (from onset to steady state). We obtained relatively slow τmem values of 26.79 ± 2.25 ms (n = 21) in FPR-rs3+ neurons vs. 24.29 ± 1.57 ms (n = 21) in control neurons (Figure 2E).
Together, these results describe different passive membrane parameters of FPR-rs3+ neurons. Moreover, these data show that the passive electrical properties of FPR-rs3 expressing VSNs do not significantly differ from control neurons, suggesting (a) that FPR-rs expressing VSNs are not segregated or isolated from the “general” VSN population; and (b) that transgene expression per se does not perturb the passive biophysical properties of FPR-rs3+ neurons.
Active Membrane Properties of FPR-rs3+ Neurons
Next, we examined the active membrane properties of FPR-rs3+ neurons. A hallmark of VSNs is that depolarizing current injection of only a few picoamperes triggers repetitive action potential discharge (Liman and Corey, 1996; Shimazaki et al., 2006). This also holds true for FPR-rs3+ neurons (Figure 3A). Current-clamp recordings from fluorescently labeled VSNs show repetitive spiking in response to depolarizing current steps of 2–24 pA. Spontaneous activity (measured at 0 pA current injection) was 2.37 ± 0.54 Hz (n = 19) for FPRrs3+ neurons and 3.9 ± 1.08 Hz (n = 21) for control cells (Figure 3B, inset). By plotting mean instantaneous spike frequencies as a function of stationary current input (f-I curve; Figure 3B), response saturation at amplitudes >20 pA becomes apparent (maximum frequency fmax = 14.5 ± 0.88 Hz (n = 19; FPR-rs3+ neurons) or 16.54 ± 1.17 Hz (n = 21; control VSNs)). Injection of negative current into FPR-rs3+ neurons revealed a hyperpolarization-activated rebound depolarization (“sag”; Figure 3Aiii), indicative of Ih currents and, thus, HCN channel expression (Robinson and Siegelbaum, 2003; Dibattista et al., 2008). Plotting the sag potential amplitude (ΔVsag; Figure 3Aiii) as a function of peak hyperpolarization reveals the threshold (< −75 mV) and voltage dependence of the sag (n = 5–23; Figure 3C), likely corresponding to an increase in HCN channel activation at more negative membrane potentials. A similar voltage dependence was observed for control cells (n = 5–32). In both FPR-rs3+ and control VSNs, we frequently observed rebound spikes upon repolarization (Figure 3Aiii).
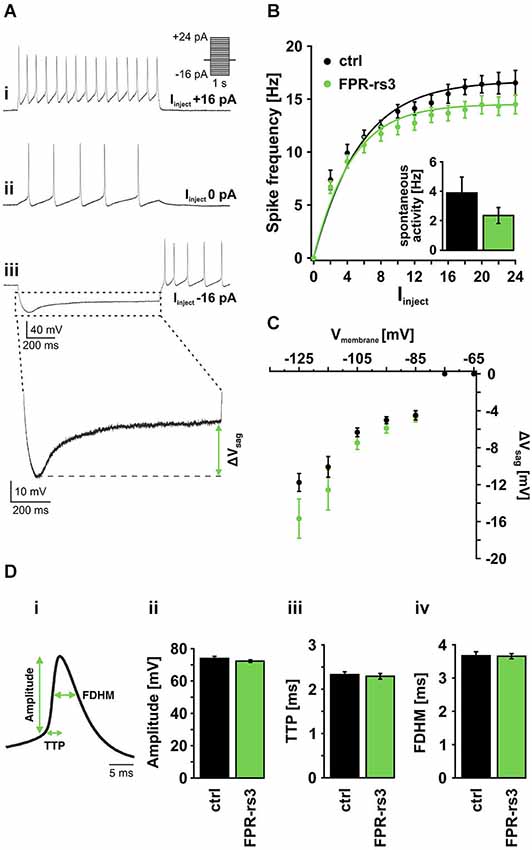
Figure 3. Active membrane properties of FPR-rs3+ VSNs. (A) Representative current clamp traces showing de- / hyperpolarization and trains of (rebound) action potentials generated upon stepwise current injection. Note the spontaneous activity measured at 0 pA current injection (Aii). Injection of negative current produces a prominent voltage “sag” most likely mediated by activation of HCN channels (Aiii). (B) Firing frequency of control (n = 21) and FPR-rs3+ (n = 19) neurons as a function of the injected current (Iinject). The gradual increase in firing rate is comparable for control and FPR-rs3+ VSNs. Inset: Spontaneous spiking frequency at 0 pA current injection. Note that f-I curves have been “background-corrected” using these values. (C) Voltage “sag” (ΔVsag, n = 3–32) as a function of the peak membrane hyperpolarization (10 mV bins). ΔVsag values of control and FPR-rs3+ neurons show no statistical difference (p > 0.01, two-tailed Student’s t-test). (D) Average spike waveform illustrating analysis parameters (amplitude, time-to-peak (TTP), full duration at half-maximum (FDHM; Di). Amplitude analysis of the first action potential for each current injection step shows no difference between control and FPR-rs3+ cells (Dii). TTP analysis reveals values in the same range for both cell populations (Diii). Spike width (FDHM) is not significantly different between control and FPR-rs3+ VSNs (Div). Data are mean ± SEM.
Next, we examined action potential discharge of FPR-rs3+ neurons. Figure 3Di depicts an averaged spike waveform and shows schematically how different spike parameters were analyzed: spike amplitude was measured as the threshold-to-peak distance, spike duration was calculated as the full duration at half-maximum (FDHM), spike generating kinetics was measured as the time-to-peak (TTP). All analyses were based on the first spike of a given train of action potentials (see Figure 3Ai). Our results reveal an average amplitude of 72.24 ± 0.97 mV (n = 134) for FPR-rs3+ neurons and 73.92 ± 0.87 mV (n = 172) for control neurons (Figure 3Di). Average TTP values were 2.29 ± 0.06 ms (FPR-rs3+ cells) and of 2.33 ± 0.09 ms (control neurons), while FDHM was 3.65 ± 0.08 ms (FPR-rs3+ neurons) and 3.67 ± 0.12 ms (control VSNs), respectively.
These data show that FPR-rs3 expressing VSNs exhibit rather slow action potentials and, albeit an extraordinary sensitivity, show a relatively narrow spike frequency coding range. Together, these active membrane properties are shared by both FPR-rs3 expressing and control neurons.
Voltage-gated Na+ Currents of FPR-rs3+ Neurons
In excitable cells, voltage-gated Na+ (NaV) channels are primarily responsible for action potential initiation and impulse propagation. Upon membrane depolarization, NaV channels mediate the rapid Na+ influx that underlies the upstroke of the action potential. However, the electrophysiological properties of the nine homologous members of the NaV channel family (NaV1.1 to NaV1.9) are not identical and even small differences in NaV channel expression can have profound effects on electrical excitability (Hille, 2001). Therefore, we next focused on macroscopic voltage-activated Na+ currents (INav) in FPR-rs3+ neurons. Stepwise depolarizations from −120 mV to +70 mV (30 ms duration; 5 mV increment) in absence and presence of tetrodotoxin (TTX; Figure 4Ai–ii; Narahashi et al., 1966; Wu and Narahashi, 1988) allowed pharmacological isolation of the TTX-sensitive INav (Figure 4Aiii). Plotting peak INav density as a function of membrane depolarization, the current-voltage relationship (Figure 4B) reveals an activation threshold at approximately −65 mV and a maximum current density of −136.7 ± 14.1 pA/pF (n = 10). Similar values were recorded from control VSNs (maximum INav = −157.5 ± 17.4 pA/pF; n = 20). Figure 4Ci illustrates the kinetics of channel gating during a single depolarizing step in membrane potential (−30 mV). As expected from relatively slow action potential firing in FPR-rs3+ neurons (Figure 3D), TTP analysis of INav reveals relatively slow activation kinetics (1.86 ± 0.10 ms; n = 10; Figure 4Cii).
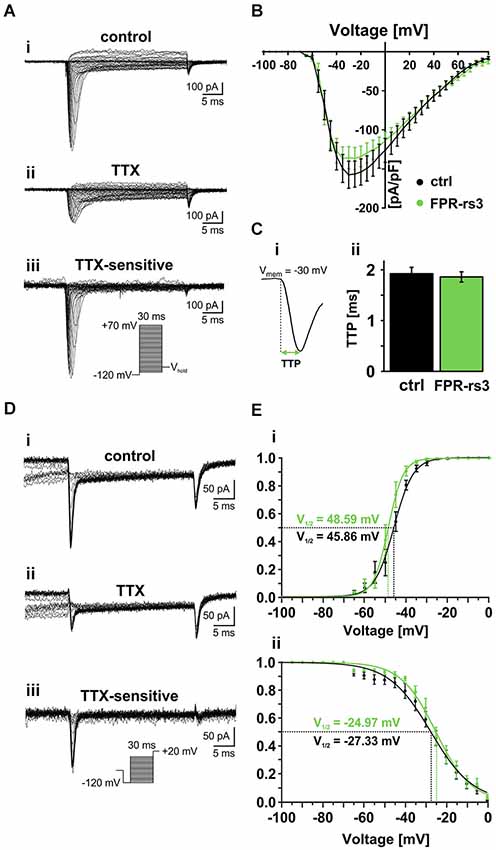
Figure 4. Voltage-gated Na+ currents. (A) Representative traces from whole-cell patch-clamp recordings of a TTX-sensitive fast activating Na+ current in FPR-rs3+ VSNs. (Ai) Voltage step recording under control conditions (extracellular solution S1; intracellular solution S9) reveals a voltage-dependent fast and transient inward current. (Aii) TTX treatment (1 μM) strongly diminishes the current. Digitally subtracted trace (control—TTX (Aiii)) reveals the TTX-sensitive voltage-gated Na+ current. (B) Current-voltage relationships of TTX-sensitive Na+ currents isolated from control and FPR-rs3+ neurons (control, n = 20; FPR-rs3+, n = 10; p > 0.01, two-tailed Student’s t-test). (C) Example of a voltage-clamp recording showing the fast activating transient inward current used for upstroke kinetics analysis (Ci). TTP of the fast activating Na+ current upon depolarization to −30 mV (control, n = 20; FPR-rs3+, n = 10; Cii). (D) Representative traces showing Na+ channel steady-state inactivation under control conditions (Di), in presence of TTX (Dii), and after digital subtraction (control—TTX (Diii)). Prepulse steps from −120 mV to 0 mV were applied to analyze inactivation (Diii, inset). (E) Normalized activation (Ei) and steady-state inactivation (Eii) curves (peak current vs. pulse / prepulse voltage). Data points were fitted using a sigmoidal Boltzmann-type equation. Membrane voltage inducing half-maximal activation and inactivation (V½) as indicated. Data are mean ± SEM.
Next, we examined the voltage-dependence of TTX-sensitive INav activation and inactivation in FPR-rs3+ neurons (Figures 4D,E). Fitting normalized peak INav amplitudes vs. voltage to a sigmoidal (Boltzmann) function demonstrates half-maximal current activation upon depolarization to approximately −50 mV (V1/2 = 48.6 mV; n = 9; Figure 4Ei). Steady-state INav inactivation was analyzed upon depolarization to +20 mV, preceded by prepulse steps to different potentials ranging from −120 mV to 0 mV (30 ms duration; 5 mV increment; Figure 4D). Again, offline subtraction of TTX-insensitive currents (Figure 4Dii) from control recordings (Figure 4Di) allowed pharmacological isolation of TTX-sensitive INav (Figure 4Diii). Steady-state inactivation curves are derived from inverse sigmoidal fits to normalized peak INav amplitudes vs. prepulse voltage (Figure 4Eii) and reveal half-maximal inactivation upon depolarization to V1/2 = −25 mV (n = 10). Interestingly, at voltages ranging from approximately −60 mV to −5 mV, activation and inactivation curves overlap, suggesting coexpression of multiple NaV channel isoforms and/or a substantial “window current”.
Together, these results demonstrate that FPR-rs3+ VSNs express one or more NaV channel isoform(s) that exhibit relatively slow activation upon membrane depolarization >−65 mV with half-maximal and complete activation at ~−50 mV and −30 mV, respectively. Moreover, the slope of the steady-state inactivation curve is relatively shallow, revealing that full channel inactivation only occurs at positive potentials. Since all measured parameters are similar to data recorded from control VSNs, our data further substantiate the notion that that FPR-rs expressing neurons do not constitute a biophysically segregated “outgroup” of VSNs.
Voltage-Gated K+ Currents of FPR-rs3+ Neurons
To a large extent, Kv channels control electrical signaling in excitable cells. Accordingly, the large and extended Kv channel family is functionally diversified by alternative splicing, oligomeric subunit assembly, and subcellular targeting (Jan and Jan, 2012). As Kv channels are involved in regulating a wide range of neuronal functions, such as setting the resting membrane potential, dictating the duration and/or frequency of action potentials, volume regulation, etc., we next characterized Kv channel-mediated currents (IKv) in FPR-rs3+ neurons.
Activated by depolarization, outward flux of K+ repolarizes the membrane and, thus, contributes to action potential termination and, in some neurons, afterhyperpolarization. To isolate different classes of IKv we used a pharmacological toolkit of several well-described Kv channel inhibitors (Alexander et al., 2013). Depending on concentration, tetraethylammonium (TEA) functions as a relatively selective inhibitor of big conductance Ca2+-dependent K+ (BK) channels at low millimolar concentrations (Yellen, 1984), whereas substantially higher concentrations (25 mM) serve as a nonselective “broadband” Kv channel blocker (Alexander et al., 2013). In addition, 4-aminopyridine (4-AP) specifically blocks A-type K+ currents in various neurons (Mei et al., 1995; Amberg et al., 2003).
Under control conditions, stepwise depolarization from −100 to +85 mV (100 ms duration; 5 mV increment) triggered large outward currents that essentially showed no sign of inactivation (Figure 5A; inset). When steady-state currents were plotted as a function of depolarization, the resulting current-voltage relationship reveals IKv activation at approximately −30 mV (Figure 5A). Linear regression from data points corresponding to full activation (+60 mV – +85 mV) indicates IKv reversal at ~−65 mV. When drug-sensitive currents were isolated by digital subtraction of blocker-insensitive from respective “control” recordings (Figures 5B–D, insets; see section materials and methods), the resulting current-voltage plots revealed no statistical differences between FPR-rs3+ neurons and control VSNs (Figures 5B–D). Somewhat surprisingly, currents isolated by 4-AP treatment did not show a pronounced transient component typical for A-type K+ currents. Interestingly, summation of the individual drug-sensitive IKv components added up to almost 100% of control currents (276.5 ± 31.1 pA/pF at +85 mV; n = 13; Figure 5E) showing that a “cocktail” of 4-AP (10 mM) and TEA (25 mM) is sufficient to block essentially all Kv channels in FPR-rs3+ neurons. This pharmacological profile was statistically indistinguishable from control VSNs.
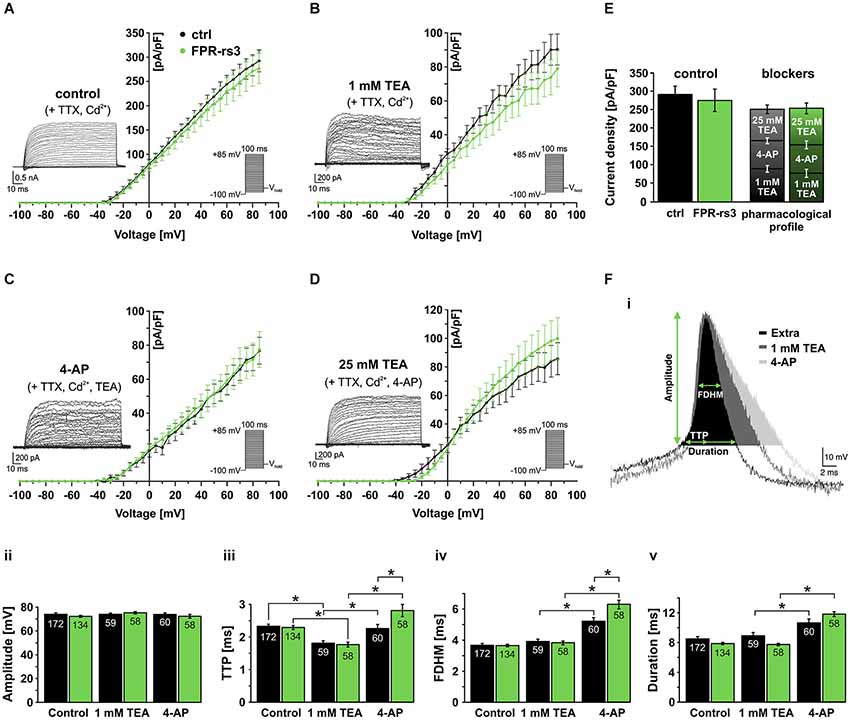
Figure 5. Voltage-gated K+ currents and their role in action potential firing. (A) Voltage-activated outward K+ currents under control conditions (solution S1 including TTX (1 µM) and Cd2+ (200 µM) to isolate K+ currents). Currents were induced by stepwise depolarization and measured during steady-state. Current densities were calculated and plotted against voltage (control, n = 10; FPR-rs3+, n = 13). (B) Outward currents sensitive to 1 mM TEA (control-TEA; digital subtraction; n = 10). (C) Outward currents sensitive to 10 mM 4-AP (control/TEA-4-AP; digital subtraction; n = 10). (D) Outward currents sensitive to 25 mM TEA (control/TEA/4-AP-TEA; digital subtraction; n = 10). (E) Quantification of outward currents. Maximum current densities under control conditions (left bars; 292.5 ± 22.4 pA/pF at +85 mV, n = 10 (ctrl); 276.5 ± 31.1 pA/pF, n = 13 (FPR-rs3+)) and added drug sensitive current densities (ctrl: 90.3 ± 9.1 pA/pF (1 mM TEA), 76.8 ± 7.9 pA/pF (10 mM 4-AP), 85.7 ± 11.2 pA/pF (25 mM TEA); FPR-rs3+: 78.9 ± 10.6 pA/pF (1 mM TEA), 77.5 ± 10.5 pA/pF (10 mM 4-AP), 99.8 ± 14.6 pA/pF (25 mM TEA)). Data are mean ± SEM. (F) Representative spike waveform under control conditions (solution S1 (Extra)) and in presence of TEA (1 mM) and 4-AP (10 mM; Fi). Analysis parameters (amplitude, TTP, FDHM and spike duration) are depicted schematically. Bar graphs illustrate the quantification of discharge characteristics (Fii–v). *p < 0.01; two-way ANOVA with Tukey’s multiple comparisons test. Data are mean ± SEM, number of cells as depicted inside the bars.
Next, we investigated how the pharmacologically different Kv channel populations shape action potential discharge in FPR-rs3+ cells. Spikes were elicited and discharge parameters were analyzed as described (Figures 3D, 5Fi). VSNs were challenged with either TEA (1 mM) or 4-AP (10 mM). Spike amplitude (Figure 5Fii) was not altered by either drug. Both Kv channel inhibitors affected the upstroke dynamics (Figure 5Fiii). However, while block of putative BK channels by TEA (1 mM) accelerated the upstroke, inhibition of A-type currents prolonged the average TTP. 4-AP treatment also prolonged the spike width (FDHM) and, consequently, spike duration (Figure 5Fiv–v) whereas TEA did not elicit such effects. The effects of 4-AP are significantly more pronounced in FPR-rs3 expressing VSNs than in control neurons (Figure 5Fiii–v).
In summary, these data demonstrate that multiple Kv channel subunits are expressed in FPR-rs3+ neurons. These different channel populations synergistically shape the firing properties of FPR-rs3 expressing VSNs. Moreover, with the notable exception of 4-AP-sensitive channel function during discharge, the Kv channel expression profile of FPR-rs3+ neurons is largely comparable to control VSNs.
Voltage-Gated Ca2+ Currents of FPR-rs3+ Neurons
Voltage-gated Ca2+ (CaV) channels are integral constituents of a neuron’s Ca2+ signaling toolkit (Berridge et al., 2003). As such, they are key signal transducers that transform electrical impulses (depolarization) into a biochemically relevant signal (Ca2+ influx) that regulates a wide variety of cellular events (Catterall, 2000b; Clapham, 2007). We therefore investigated CaV currents (ICav) in FPR-rs3+ neurons.
The ten functional vertebrate CaV channel subunits are divided into three subfamilies (CaV1 to CaV3) that differ in function and regulation (Triggle et al., 2006). Both within and between subfamilies, individual CaV channel isoforms are identified by their distinct biophysical properties and pharmacological profiles (Catterall, 2000b; Alexander et al., 2013). Thus, we isolated transient (T-type) currents mediated by members of the CaV3 subfamily by digital subtraction of ICav recorded in response to depolarizing voltage steps (−100 mV to +45 mV; 100 ms duration; 5 mV increment) from two different prepulse potentials (−100 mV and −25 mV, respectively; Figure 6Ai, inset). Based on steady-state inactivation of CaV3 channels at −25 mV (Catterall et al., 2005), the fraction of low voltage activated (LVA) Ca2+ channels becomes readily apparent after subtraction (Figure 6Ai). As expected, these T-type currents rapidly inactivate and the underlying activation and inactivation kinetics become faster with increasing depolarization (Perez-Reyes et al., 1998). The resulting current-voltage relationship (Figure 6Aii) and normalized ICav activation curve (Figure 6Aiii) demonstrate an activation threshold of −60 mV and half-maximal current activation upon depolarization to −40 mV (V1/2 = −40.27 mV; n = 9), values typical for T-type currents.
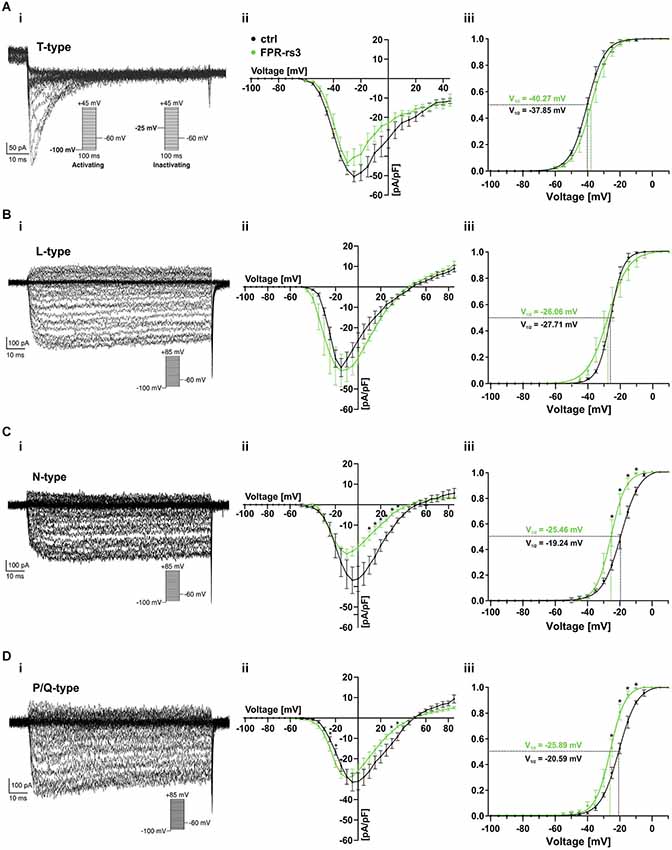
Figure 6. Voltage-gated Ca2+ currents. (A–D) Representative Ca2+ current traces isolated either biophysically (prepulse inactivation protocol; (Ai)) or pharmacologically (nifedipine (10 μM) (Bi); ω-conotoxin-GVIA (2 μM) (Ci); ω-agatoxin IVA (200 nM) (Di)). Step protocols as indicated. Absolute (Aii–Dii) and normalized (Aiii–Diii) peak current densities are plotted as a function of membrane depolarization. Activation curves (Aiii–Diii) are fitted according to a sigmoidal Boltzmann-type equation. Membrane voltage inducing half-maximal activation (V½) as indicated. Data are mean ± SEM; *p < 0.01, two-tailed Student’s t-test.
Next, we investigated functional expression of high voltage activated (HVA) CaV channels in FPR-rs3+ neurons. All four members of the CaV1 subfamily are characterized by both long-lasting and large (L-type) Ca2+ currents and high sensitivity to dihydropyridines, such as nifedipine (Catterall et al., 2005). Therefore, to examine L-type ICav, we recorded responses to depolarizing voltage steps (−100 mV to +85 mV; 100 ms duration; 5 mV increment) and isolated nifedipine-sensitive currents by digital subtraction (Figure 6Bi). As expected for L-type currents, isolated ICav shows relatively slow, though lasting activation upon depolarization ≥ −45 mV (Figure 6Bii). Half-maximal activation is observed upon more pronounced depolarization (V1/2 = −26.06 mV; n = 7; Figure 6Biii).
Members of the CaV2 subfamily of HVA Ca2+ channels are selectively sensitive to peptide neurotoxins from spider and cone snail venoms (Catterall, 2000a). Using ω-conotoxin-GVIA, we next isolated conotoxin-sensitive N-type ICav from FPR-rs3+ neurons (Figure 6Ci). N-type currents activate upon depolarizations ≥ −40 mV (Figure 6Cii). At approximately −25 mV, N-type ICav is half-maximally activated (V1/2 = −25.46 mV; n = 7; Figure 6Ciii). Surprisingly, recordings from control VSNs reveal substantially larger conotoxin-sensitive currents (Figure 6Cii–iii). While T- and L-type ICav in FPR-rs3+ VSNs did not significantly differ from control neurons, maximum N-type current density was −24.05 ± 2.37 pA/pF in fluorescently labeled cells (n = 7), but −36.96 ± 6.50 pA/pF in control VSNs (n = 8). Moreover, half-maximal activation in controls was shifted to more positive values (V1/2 = −19.24 mV; n = 8; Figure 6Ciii).
A slight, though also significant difference between FPR-rs3+ and control neurons was observed for P/Q-type Ca2+ currents that were pharmacologically isolated using ω-agatoxin IVA (Randall and Tsien, 1995; Catterall, 2011). P/Q-type currents revealed relatively slow activation and slight inactivation. Compared to control recordings, both the current-voltage relationship (Figure 6Dii) and the sigmoidal activation curve (Figure 6Diii) of P/Q-type ICav in FPR-rs3+ neurons was left-shifted to more negative potentials. Maximum current density, however, did not significantly differ between FPR-rs3+ VSNs (−29.50 ± 3.31 pA/pF; n = 8) and control neurons (−31.46 ± 4.34 pA/pF; n = 5).
In summary, the above data show that FPR-rs3+ neurons exhibit a variety of CaV currents, both LVA and HVA. Since both N- and P/Q-type currents show somewhat different properties in FPR-rs3 expressing VSNs, these two CaV2 channel isoforms might play distinct roles in FPR-rs3+ neurophysiology.
Discussion
For most mammals, the VNO is crucial for intra- and interspecific chemical communication. While the basic biophysical properties of both V1R- and V2R-expressing vomeronasal neurons have been described (Liman and Corey, 1996; Trotier and Døving, 1996; Fieni et al., 2003; Shimazaki et al., 2006; Ukhanov et al., 2007; Hagendorf et al., 2009), VSNs that express members of the recently discovered family of vomeronasal FPR-rs proteins (Liberles et al., 2009; Rivière et al., 2009) remain physiologically unexplored. Here, we describe a transgenic mouse model (Fpr-rs3-i-Venus) in which expression of one member of the FPR-rs family (FPR-rs3) is marked by Venus fluorescence. This mouse strain allows identification and electrophysiological analysis of FPR-rs3-expressing neurons in acute VNO tissue slices. Thus, we provide an in-depth analysis of both passive and active membrane properties, including detailed characterization of several types of voltage-activated conductances and action potential discharge patterns, in fluorescently labeled vs. unmarked vomeronasal neurons. Our results reveal a number of similarities, but also some differences in the basic (electro) physiological architecture of transgene-expressing vs. non-expressing neurons.
Vomeronasal transgene expression in Fpr-rs3-i-Venus mice faithfully recapitulates the punctate apical expression pattern of endogenous FPR-rs3 (Rivière et al., 2009; Dietschi et al., 2013). Furthermore, bicistronic expression of the tau-Venus fusion protein additionally targets the fluorescent marker to axons and axon terminals in the AOB. We therefore propose that Fpr-rs3-i-Venus mice not only provide a useful tool for physiological studies of FPR-rs3+ neurons in the VNO (as described here), but also for studies of axon targeting and glomerular innervation in the AOB. While, based on the experimental strategy used here, we cannot exclude that FPR-rs3+ VSNs additionally express other vomeronasal receptor genes, this appears unlikely since the negative feedback signal that ensures gene exclusion in apical VSNs is also maintained by exogenous expression of another receptor gene, even an OR (Capello et al., 2009).
The specific biophysical profile of FPR-rs3+ VSNs is a critical determinant of their sensory input-output function. Passive membrane properties, such as Rinput, Cmem and τmem, are therefore crucial functional descriptors of FPR-rs3+ neuron physiology. Cmem and dendritic geometry together determine the amplitude of the receptor potential as well as, being inversely proportional, the speed of signal propagation along the dendrite (Gentet et al., 2000). Cmem values obtained for FPR-rs3+ neurons are broadly consistent with previously reported data (Liman and Corey, 1996; Shimazaki et al., 2006; Ukhanov et al., 2007) and do not differ from values recorded from randomly chosen control VSNs from wild type C57BL/6 mice. The remarkably high input resistance previously reported for VSNs (Liman and Corey, 1996; Fieni et al., 2003; Shimazaki et al., 2006; Dibattista et al., 2008; Sagheddu et al., 2010) is shared by FPR-rs3+ neurons. Thus, FPR-rs3-dependent receptor currents of even a few picoamperes will be sufficient to trigger action potential discharge. We therefore propose that the primary signal transduction machinery in FPR-rs3+ neurons must be balanced by proper gain/offset control mechanisms to avoid false-positive output. In this context, the rather narrow tuning range of the input-output function of FPR-rs3+ neurons (and control VSNs) is noticeable. Frequency coding accommodates spike rates between 0 and ~15 Hz that encode receptor currents ranging to a maximum of ~25 pA (note that the “linear” dynamic range of the f-I curve is considerably more narrow). Similar values have previously been reported (Liman and Corey, 1996; Ukhanov et al., 2007). The relatively long τmem values (~25 ms) we obtained for both FPR-rs3+ and control neurons ensure that brief stimulatory events will not generate significant output, in line with the idea that stimulus exchange in the VNO is relatively slow probably allowing prolonged VSN receptor-ligand interaction.
Detailed spike waveform analysis revealed rather slow and broad action potentials in line with previously published results (Shimazaki et al., 2006; Hagendorf et al., 2009). Moreover, hyperpolarizing current injection triggers rebound depolarizations resulting in a pronounced “voltage sag” (Robinson and Siegelbaum, 2003; Dibattista et al., 2008). Mediated by HCN channels, we and others observed increasing “sag” amplitudes with membrane potentials becoming more hyperpolarized (Ukhanov et al., 2007; Dibattista et al., 2008). Thus, active membrane properties of FPR-rs3+ neurons do not segregate these neurons from the “general” VSN population.
We used the pufferfish toxin TTX to isolate whole-cell currents mediated by voltage-gated NaV channels. FPR-rs3+ VSNs express one or more TTX-sensitive NaV channel isoform(s), i.e., Nav1.1, 1.2, 1.3, 1.4, or 1.7 (Hille, 2001), which exhibit relatively slow activation upon membrane depolarization >−65 mV with half-maximal and complete activation at ~−50 mV and −30 mV, respectively. Notably, the slope of the steady-state inactivation curve is relatively shallow, revealing that full channel inactivation only occurs at positive potentials and, in addition, resulting in a substantial “window current” that ranges from approximately −60 mV to −5 mV.
Similar pharmacological approaches were used to isolate currents mediated by KV and CaV channels, respectively. At least three different and probably heterogeneous populations of KV channels were identified according to their sensitivity to 4-AP and different TEA concentrations, respectively (Liman and Corey, 1996). Interestingly, while 4-AP-sensitive currents lacked a prominent transient component typical for A-type K+ currents (Mei et al., 1995; Amberg et al., 2003), this KV channel population exerted considerable effects on action potential waveform. Moreover, these effects on upstroke kinetics (TTP) and spike width (FDHM/duration) where different between FPR-rs3+ neurons and control VSNs. In addition to NaV and KV channels, several types of CaV channels were identified in FPR-rs3+ neurons. T-, L-, N-, and P/Q-type ICaV was isolated, either pharmacologically (L-, N-, P/Q-type) or by prepulse inactivation (T-type). While T- and L-type ICav in FPR-rs3+ VSNs did not significantly differ from control neurons, we find that both N- and P/Q-type currents show somewhat different properties in FPR-rs3 expressing VSNs. We can only speculate about the mechanisms that might link FPR-rs3 expression to altered expression and/or functionality of either N- or P/Q-type CaV channels. The scope of possible explanations ranges from altered Cacna1a/Cacna1b transcription by random transgene insertion to direct binding of Gβ/γ to the α1 subunit of either CaV2 channel (Currie, 2010), complex co-regulation scenarios of, for example, accessory channel subunits (Neely and Hidalgo, 2014), or unknown intrinsic properties of a potential subpopulation of neurons that express FPR-rs3 instead of a “native” receptor. Whatever the mechanistic basis, the interpretation of future experiments will have to take potential physiological differences into account, which could arise from transgenic vs. endogenous expression.
The Fpr-rs3-i-Venus mouse model we introduce and the basic electrophysiological characterization we performed provide a foundation for future functional studies of FPR-rs neurophysiology. In analogy to FPR signaling in the immune system, current concepts of FPR-rs function suggest a role as chemoreceptors for inflammation-associated and pathogen-related compounds (Rivière et al., 2009; Chamero et al., 2011; Bufe et al., 2012). Immune system FPRs are broadly tuned detectors of either host- or pathogen-derived inflammatory signals (Le et al., 2002; Migeotte et al., 2006; He et al., 2014). Somewhat controversial results have been reported on the tuning profile(s) of recombinantly expressed vomeronasal FPR-rs proteins (Rivière et al., 2009; Bufe et al., 2012). Fpr-rs3-i-Venus mice will likely prove useful for studying FPR-rs3-ligand interaction in homologous cells.
Conflict of Interest Statement
The authors declare that the research was conducted in the absence of any commercial or financial relationships that could be construed as a potential conflict of interest.
Acknowledgments
This work was funded by grants of the Volkswagen Foundation (I/83533), the Deutsche Forschungsgemeinschaft (SP724/6-1) and by the Excellence Initiative of the German federal and state governments and the Swiss National Science Foundation grants 31003A-149753 and 310030E-135910. MS is a Lichtenberg Professor of the Volkswagen Foundation. We thank Corinna H. Engelhardt and Susanne Lipartowski (RWTH-Aachen University) for excellent technical assistance.
Footnotes
- ^ Available at http://www.stanford.edu/~cpatton/webmaxcS.htm
References
Adams, D. R. (1992). Fine structure of the vomeronasal and septal olfactory epithelia and of glandular structures. Microsc. Res. Tech. 23, 86–97. doi: 10.1002/jemt.1070230108
Pubmed Abstract | Pubmed Full Text | CrossRef Full Text | Google Scholar
Alexander, S. P. H., Benson, H. E., Faccenda, E., Pawson, A. J., Sharman, J. L., Catterall, W. A., et al. (2013). The concise guide to pharmacology 2013/14: ion channels. Br. J. Pharmacol. 170, 1607–1651. doi: 10.1111/bph.12447
Pubmed Abstract | Pubmed Full Text | CrossRef Full Text | Google Scholar
Amberg, G. C., Koh, S. D., Imaizumi, Y., Ohya, S., and Sanders, K. M. (2003). A-type potassium currents in smooth muscle. Am. J. Physiol. Cell Physiol. 284, C583–C595. doi: 10.1152/ajpcell.00301.2002
Pubmed Abstract | Pubmed Full Text | CrossRef Full Text | Google Scholar
Barry, P. H. (1994). JPCalc, a software package for calculating liquid junction potential corrections in patch-clamp, intracellular, epithelial and bilayer measurements and for correcting junction potential measurements. J. Neurosci. Methods 51, 107–116. doi: 10.1016/0165-0270(94)90031-0
Pubmed Abstract | Pubmed Full Text | CrossRef Full Text | Google Scholar
Belluscio, L., Koentges, G., Axel, R., and Dulac, C. (1999). A map of pheromone receptor activation in the mammalian brain. Cell 97, 209–220. doi: 10.1016/s0092-8674(00)80731-x
Pubmed Abstract | Pubmed Full Text | CrossRef Full Text | Google Scholar
Berridge, M. J., Bootman, M. D., and Roderick, H. L. (2003). Calcium signalling: dynamics, homeostasis and remodelling. Nat. Rev. Mol. Cell Biol. 4, 517–529. doi: 10.1038/nrm1155
Pubmed Abstract | Pubmed Full Text | CrossRef Full Text | Google Scholar
Boschat, C., Pélofi, C., Randin, O., Roppolo, D., Lüscher, C., Broillet, M.-C., et al. (2002). Pheromone detection mediated by a V1r vomeronasal receptor. Nat. Neurosci. 5, 1261–1262. doi: 10.1038/nn978
Pubmed Abstract | Pubmed Full Text | CrossRef Full Text | Google Scholar
Bozza, T., Feinstein, P., Zheng, C., and Mombaerts, P. (2002). Odorant receptor expression defines functional units in the mouse olfactory system. J. Neurosci. 22, 3033–3043.
Brechbühl, J., Klaey, M., and Broillet, M.-C. (2008). Grueneberg ganglion cells mediate alarm pheromone detection in mice. Science 321, 1092–1095. doi: 10.1126/science.1160770
Pubmed Abstract | Pubmed Full Text | CrossRef Full Text | Google Scholar
Bufe, B., Schumann, T., and Zufall, F. (2012). Formyl peptide receptors from immune and vomeronasal system exhibit distinct agonist properties. J. Biol. Chem. 287, 33644–33655. doi: 10.1074/jbc.m112.375774
Pubmed Abstract | Pubmed Full Text | CrossRef Full Text | Google Scholar
Capello, L., Roppolo, D., Jungo, V. P., Feinstein, P., and Rodriguez, I. (2009). A common gene exclusion mechanism used by two chemosensory systems. Eur. J. Neurosci. 29, 671–678. doi: 10.1111/j.1460-9568.2009.06630.x
Pubmed Abstract | Pubmed Full Text | CrossRef Full Text | Google Scholar
Catterall, W. A. (2000a). Structure and regulation of voltage-gated Ca2+ channels. Annu. Rev. Cell Dev. Biol. 16, 521–555. doi: 10.1146/annurev.cellbio.16.1.521
Pubmed Abstract | Pubmed Full Text | CrossRef Full Text | Google Scholar
Catterall, W. A. (2000b). From ionic currents to molecular mechanisms: the structure and function of voltage-gated sodium channels. Neuron 26, 13–25. doi: 10.1016/S0896-6273(00)81133-2
Catterall, W. A. (2011). Voltage-gated calcium channels. Cold Spring Harb Perspect. Biol. 3:a003947. doi: 10.1101/cshperspect.a003947
Pubmed Abstract | Pubmed Full Text | CrossRef Full Text | Google Scholar
Catterall, W. A., Perez-reyes, E., Snutch, T. P., and Striessnig, J. (2005). International union of pharmacology. XLVIII. Nomenclature and structure-function relationships of voltage-gated calcium channels. Pharmacol. Rev. 57, 411–425. doi: 10.1124/pr.57.4.5
Pubmed Abstract | Pubmed Full Text | CrossRef Full Text | Google Scholar
Chamero, P., Katsoulidou, V., Hendrix, P., Bufe, B., Roberts, R. W., Matsunami, H., et al. (2011). G protein G(alpha)o is essential for vomeronasal function and aggressive behavior in mice. Proc. Natl. Acad. Sci. U S A 108, 12898–12903. doi: 10.1073/pnas.1107770108
Pubmed Abstract | Pubmed Full Text | CrossRef Full Text | Google Scholar
Chamero, P., Leinders-Zufall, T., and Zufall, F. (2012). From genes to social communication: molecular sensing by the vomeronasal organ. Trends Neurosci. 35, 597–606. doi: 10.1016/j.tins.2012.04.011
Pubmed Abstract | Pubmed Full Text | CrossRef Full Text | Google Scholar
Chamero, P., Marton, T. F., Logan, D. W., Flanagan, K., Cruz, J. R., Saghatelian, A., et al. (2007). Identification of protein pheromones that promote aggressive behaviour. Nature 450, 899–902. doi: 10.1038/nature05997
Pubmed Abstract | Pubmed Full Text | CrossRef Full Text | Google Scholar
Clapham, D. E. (2007). Calcium signaling. Cell 131, 1047–1058. doi: 10.1016/j.cell.2007.11.028
Pubmed Abstract | Pubmed Full Text | CrossRef Full Text | Google Scholar
Currie, K. P. M. (2010). G protein modulation of CaV2 voltage-gated calcium channels. Channels (Austin) 4, 497–509. doi: 10.4161/chan.4.6.12871
Dibattista, M., Mazzatenta, A., Grassi, F., Tirindelli, R., and Menini, A. (2008). Hyperpolarization-activated cyclic nucleotide-gated channels in mouse vomeronasal sensory neurons. J. Neurophysiol. 100, 576–586. doi: 10.1152/jn.90263.2008
Pubmed Abstract | Pubmed Full Text | CrossRef Full Text | Google Scholar
Dietschi, Q., Assens, A., Challet, L., Carleton, A., and Rodriguez, I. (2013). Convergence of FPR-rs3-expressing neurons in the mouse accessory olfactory bulb. Mol. Cell. Neurosci. 56, 140–147. doi: 10.1016/j.mcn.2013.04.008
Pubmed Abstract | Pubmed Full Text | CrossRef Full Text | Google Scholar
Dulac, C., and Axel, R. (1995). A novel family of genes encoding putative pheromone receptors in mammals. Cell 83, 195–206. doi: 10.1016/0092-8674(95)90161-2
Pubmed Abstract | Pubmed Full Text | CrossRef Full Text | Google Scholar
Dulac, C., and Torello, A. T. (2003). Molecular detection of pheromone signals in mammals: from genes to behaviour. Nat. Rev. Neurosci. 4, 551–562. doi: 10.1038/nrn1140
Pubmed Abstract | Pubmed Full Text | CrossRef Full Text | Google Scholar
Ferrero, D. M., Moeller, L. M., Osakada, T., Horio, N., Li, Q., Roy, D. S., et al. (2013). A juvenile mouse pheromone inhibits sexual behaviour through the vomeronasal system. Nature 502, 368–371. doi: 10.1038/nature12579
Pubmed Abstract | Pubmed Full Text | CrossRef Full Text | Google Scholar
Fieni, F., Ghiaroni, V., Tirindelli, R., Pietra, P., and Bigiani, A. (2003). Apical and basal neurones isolated from the mouse vomeronasal organ differ for voltage-dependent currents. J. Physiol. 552, 425–436. doi: 10.1113/jphysiol.2003.052035
Pubmed Abstract | Pubmed Full Text | CrossRef Full Text | Google Scholar
Firestein, S. (2001). How the olfactory system makes sense of scents. Nature 413, 211–218. doi: 10.1038/35093026
Pubmed Abstract | Pubmed Full Text | CrossRef Full Text | Google Scholar
Fuss, S. H., Omura, M., and Mombaerts, P. (2005). The Grueneberg ganglion of the mouse projects axons to glomeruli in the olfactory bulb. Eur. J. Neurosci. 22, 2649–2654. doi: 10.1111/j.1460-9568.2005.04468.x
Pubmed Abstract | Pubmed Full Text | CrossRef Full Text | Google Scholar
Gentet, L. J., Stuart, G. J., and Clements, J. D. (2000). Direct measurement of specific membrane capacitance in neurons. Biophys. J. 79, 314–320. doi: 10.1016/s0006-3495(00)76293-x
Pubmed Abstract | Pubmed Full Text | CrossRef Full Text | Google Scholar
Grosmaitre, X., Fuss, S. H., Lee, A. C., Adipietro, K. A., Matsunami, H., Mombaerts, P., et al. (2009). SR1, a mouse odorant receptor with an unusually broad response profile. J. Neurosci. 29, 14545–14552. doi: 10.1523/jneurosci.2752-09.2009
Pubmed Abstract | Pubmed Full Text | CrossRef Full Text | Google Scholar
Grosmaitre, X., Vassalli, A., Mombaerts, P., Shepherd, G. M., and Ma, M. (2006). Odorant responses of olfactory sensory neurons expressing the odorant receptor MOR23: a patch clamp analysis in gene-targeted mice. Proc. Natl. Acad. Sci. U S A 103, 1970–1975. doi: 10.1073/pnas.0508491103
Pubmed Abstract | Pubmed Full Text | CrossRef Full Text | Google Scholar
Hagendorf, S., Fluegge, D., Engelhardt, C., and Spehr, M. (2009). Homeostatic control of sensory output in basal vomeronasal neurons: activity-dependent expression of ether-à-go-go-related gene potassium channels. J. Neurosci. 29, 206–221. doi: 10.1523/jneurosci.3656-08.2009
Pubmed Abstract | Pubmed Full Text | CrossRef Full Text | Google Scholar
He, H.-Q., Liao, D., Wang, Z.-G., Wang, Z.-L., Zhou, H.-C., Wang, M.-W., et al. (2013). Functional characterization of three mouse formyl peptide receptors. Mol. Pharmacol. 83, 389–398. doi: 10.1124/mol.112.081315
Pubmed Abstract | Pubmed Full Text | CrossRef Full Text | Google Scholar
He, H.-Q., Troksa, E. L., Caltabiano, G., Pardo, L., and Ye, R. D. (2014). Structural determinants for the interaction of formyl Peptide receptor 2 with Peptide ligands. J. Biol. Chem. 289, 2295–2306. doi: 10.1074/jbc.m113.509216
Pubmed Abstract | Pubmed Full Text | CrossRef Full Text | Google Scholar
Herrada, G., and Dulac, C. (1997). A novel family of putative pheromone receptors in mammals with a topographically organized and sexually dimorphic distribution. Cell 90, 763–773. doi: 10.1016/s0168-9525(97)89832-0
Pubmed Abstract | Pubmed Full Text | CrossRef Full Text | Google Scholar
Hille, B. (2001). Ion Channels of Excitable Membranes. 3rd Edn. ed B. Hille Sunderland, MA: Sinauer Associates, Inc.
Isogai, Y., Si, S., Pont-Lezica, L., Tan, T., Kapoor, V., Murthy, V. N., et al. (2011). Molecular organization of vomeronasal chemoreception. Nature 478, 241–245. doi: 10.1038/nature10437
Pubmed Abstract | Pubmed Full Text | CrossRef Full Text | Google Scholar
Jan, L. Y., and Jan, Y. N. (2012). Voltage-gated potassium channels and the diversity of electrical signalling. J. Physiol. 590, 2591–2599. doi: 10.1113/jphysiol.2011.224212
Pubmed Abstract | Pubmed Full Text | CrossRef Full Text | Google Scholar
Kaur, A. W. W., Ackels, T., Kuo, T.-H., Cichy, A., Dey, S., Hays, C., et al. (2014). Murine pheromone proteins constitute a context-dependent combinatorial code governing multiple social behaviors. Cell 157, 676–688. doi: 10.1016/j.cell.2014.02.025
Pubmed Abstract | Pubmed Full Text | CrossRef Full Text | Google Scholar
Kimoto, H., Sato, K., Nodari, F., Haga, S., Holy, T. E., and Touhara, K. (2007). Sex- and strain-specific expression and vomeronasal activity of mouse ESP family peptides. Curr. Biol. 17, 1879–1884. doi: 10.1016/j.cub.2007.09.042
Pubmed Abstract | Pubmed Full Text | CrossRef Full Text | Google Scholar
Koos, D. S., and Fraser, S. E. (2005). The Grueneberg ganglion projects to the olfactory bulb. Neuroreport 16, 1929–1932. doi: 10.1097/01.wnr.0000186597.72081.10
Pubmed Abstract | Pubmed Full Text | CrossRef Full Text | Google Scholar
Le, Y., Murphy, P. M., and Wang, J. M. (2002). Formyl-peptide receptors revisited. Trends Immunol. 23, 541–548. doi: 10.1016/s1471-4906(02)02316-5
Pubmed Abstract | Pubmed Full Text | CrossRef Full Text | Google Scholar
Le, Y., Wang, J. M., Liu, X., Kong, Y., Hou, X., Ruan, L., et al. (2007). Biologically active peptides interacting with the G protein-coupled formylpeptide receptor. Protein Pept. Lett. 14, 846–853. doi: 10.2174/092986607782110211
Pubmed Abstract | Pubmed Full Text | CrossRef Full Text | Google Scholar
Leinders-Zufall, T., Brennan, P., Widmayer, P., S, P. C., Maul-Pavicic, A., Jäger, M., et al. (2004). MHC class I peptides as chemosensory signals in the vomeronasal organ. Science 306, 1033–1037. doi: 10.1126/science.1102818
Pubmed Abstract | Pubmed Full Text | CrossRef Full Text | Google Scholar
Leinders-Zufall, T., Ishii, T., Mombaerts, P., Zufall, F., and Boehm, T. (2009). Structural requirements for the activation of vomeronasal sensory neurons by MHC peptides. Nat. Neurosci. 12, 1551–1558. doi: 10.1038/nn.2452
Pubmed Abstract | Pubmed Full Text | CrossRef Full Text | Google Scholar
Leinders-Zufall, T., Lane, A. P., Puche, A. C., Ma, W., Novotny, M. V., Shipley, M. T., et al. (2000). Ultrasensitive pheromone detection by mammalian vomeronasal neurons. Nature 405, 792–796. doi: 10.1038/35015572
Pubmed Abstract | Pubmed Full Text | CrossRef Full Text | Google Scholar
Lévai, O., Feistel, T., Breer, H., and Strotmann, J. (2006). Cells in the vomeronasal organ express odorant receptors but project to the accessory olfactory bulb. J. Comp. Neurol. 498, 476–490. doi: 10.1002/cne.21067
Pubmed Abstract | Pubmed Full Text | CrossRef Full Text | Google Scholar
Liberles, S. D., Horowitz, L. F., Kuang, D., Contos, J. J., Wilson, K. L., Siltberg-Liberles, J., et al. (2009). Formyl peptide receptors are candidate chemosensory receptors in the vomeronasal organ. Proc. Natl. Acad. Sci. U S A 106, 9842–9847. doi: 10.1073/pnas.0904464106
Pubmed Abstract | Pubmed Full Text | CrossRef Full Text | Google Scholar
Liman, E. R., and Corey, D. P. (1996). Electrophysiological characterization of chemosensory neurons from the mouse vomeronasal organ. J. Neurosci. 16, 4625–4637.
Ma, M., Grosmaitre, X., Iwema, C. L., Baker, H., Greer, C. A., and Shepherd, G. M. (2003). Olfactory signal transduction in the mouse septal organ. J. Neurosci. 23, 317–324.
Martini, S., Silvotti, L., Shirazi, A., Ryba, N. J. P., and Tirindelli, R. (2001). Co-expression of putative pheromone receptors in the sensory neurons of the vomeronasal organ. J. Neurosci. 21, 843–848.
Matsunami, H., and Buck, L. B. (1997). A multigene family encoding a diverse array of putative pheromone receptors in mammals. Cell 90, 775–784. doi: 10.1016/s0092-8674(00)80537-1
Pubmed Abstract | Pubmed Full Text | CrossRef Full Text | Google Scholar
Matsuoka, M., Yoshida-Matsuoka, J., Iwasaki, N., Norita, M., Costanzo, R. M., and Ichikawa, M. (2001). Immunocytochemical study of Gi2alpha and Goalpha on the epithelium surface of the rat vomeronasal organ. Chem. Senses 26, 161–166. doi: 10.1093/chemse/26.2.161
Pubmed Abstract | Pubmed Full Text | CrossRef Full Text | Google Scholar
Mei, Y. A., Louiset, E., Vaudry, H., and Cazin, L. (1995). A-type potassium current modulated by A1 adenosine receptor in frog melanotrophs. J. Physiol. 489, 431–442.
Migeotte, I., Communi, D., and Parmentier, M. (2006). Formyl peptide receptors: a promiscuous subfamily of G protein-coupled receptors controlling immune responses. Cytokine Growth Factor Rev. 17, 501–519. doi: 10.1016/j.cytogfr.2006.09.009
Pubmed Abstract | Pubmed Full Text | CrossRef Full Text | Google Scholar
Mombaerts, P. (2004). Genes and ligands for odorant, vomeronasal and taste receptors. Nat. Rev. Neurosci. 5, 263–278. doi: 10.1038/nrn1365
Pubmed Abstract | Pubmed Full Text | CrossRef Full Text | Google Scholar
Munger, S. D. (2009). Noses within noses. Nature 459, 521–522. doi: 10.1038/459521a
Pubmed Abstract | Pubmed Full Text | CrossRef Full Text | Google Scholar
Nagai, T., Ibata, K., Park, E. S., Kubota, M., Mikoshiba, K., and Miyawaki, A. (2002). A variant of yellow fluorescent protein with fast and efficient maturation for cell-biological applications. Nat. Biotechnol. 20, 87–90. doi: 10.1038/nbt0102-87
Pubmed Abstract | Pubmed Full Text | CrossRef Full Text | Google Scholar
Narahashi, T., Anderson, N. C., and Moore, J. W. (1966). Tetrodotoxin does not block excitation from inside the nerve membrane. Science 153, 765–767. doi: 10.1126/science.153.3737.765
Pubmed Abstract | Pubmed Full Text | CrossRef Full Text | Google Scholar
Neely, A., and Hidalgo, P. (2014). Structure-function of proteins interacting with the α1 pore-forming subunit of high-voltage-activated calcium channels. Front. Physiol. 5:209. doi: 10.3389/fphys.2014.00209
Pubmed Abstract | Pubmed Full Text | CrossRef Full Text | Google Scholar
Nodari, F., Hsu, F.-F., Fu, X., Holekamp, T. F., Kao, L.-F., Turk, J., et al. (2008). Sulfated steroids as natural ligands of mouse pheromone-sensing neurons. J. Neurosci. 28, 6407–6418. doi: 10.1523/jneurosci.1425-08.2008
Pubmed Abstract | Pubmed Full Text | CrossRef Full Text | Google Scholar
Novotny, M. V. (2003). Pheromones, binding proteins and receptor responses in rodents. Biochem. Soc. Trans. 31, 117–122. doi: 10.1042/bst0310117
Pubmed Abstract | Pubmed Full Text | CrossRef Full Text | Google Scholar
Oka, Y., Katada, S., Omura, M., Suwa, M., Yoshihara, Y., and Touhara, K. (2006). Odorant receptor map in the mouse olfactory bulb: in vivo sensitivity and specificity of receptor-defined glomeruli. Neuron 52, 857–869. doi: 10.1016/j.neuron.2006.10.019
Pubmed Abstract | Pubmed Full Text | CrossRef Full Text | Google Scholar
Pacifico, R., Dewan, A., Cawley, D., Guo, C., and Bozza, T. (2012). An olfactory subsystem that mediates high-sensitivity detection of volatile amines. Cell Rep. 2, 76–88. doi: 10.1016/j.celrep.2012.06.006
Pubmed Abstract | Pubmed Full Text | CrossRef Full Text | Google Scholar
Perez-Reyes, E., Cribbs, L. L., Daud, A., Lacerda, A. E., Barclay, J., Williamson, M. P., et al. (1998). Molecular characterization of a neuronal low-voltage-activated T-type calcium channel. Nature 391, 896–900.
Randall, A., and Tsien, R. (1995). Pharmacological dissection of multiple types of Ca2+ channel currents in rat cerebellar granule neurons. J. Neurosci. 15, 2995–3012.
Rivière, S., Challet, L., Fluegge, D., Spehr, M., and Rodriguez, I. (2009). Formyl peptide receptor-like proteins are a novel family of vomeronasal chemosensors. Nature 459, 574–577. doi: 10.1038/nature08029
Pubmed Abstract | Pubmed Full Text | CrossRef Full Text | Google Scholar
Robinson, R. B., and Siegelbaum, S. A. (2003). Hyperpolarization-activated cation currents: from molecules to physiological function. Annu. Rev. Physiol. 65, 453–480. doi: 10.1146/annurev.physiol.65.092101.142734
Pubmed Abstract | Pubmed Full Text | CrossRef Full Text | Google Scholar
Rodriguez, I., Feinstein, P., and Mombaerts, P. (1999). Variable patterns of axonal projections of sensory neurons in the mouse vomeronasal system. Cell 97, 199–208. doi: 10.1016/s0092-8674(00)80730-8
Pubmed Abstract | Pubmed Full Text | CrossRef Full Text | Google Scholar
Roppolo, D., Ribaud, V., Jungo, V. P., Lüscher, C., and Rodriguez, I. (2006). Projection of the Grueneberg ganglion to the mouse olfactory bulb. Eur. J. Neurosci. 23, 2887–2894. doi: 10.1111/j.1460-9568.2006.04818.x
Pubmed Abstract | Pubmed Full Text | CrossRef Full Text | Google Scholar
Ryba, N. J. P., and Tirindelli, R. (1997). A new multigene family of putative pheromone receptors. Neuron 19, 371–379. doi: 10.1016/s0896-6273(00)80946-0
Pubmed Abstract | Pubmed Full Text | CrossRef Full Text | Google Scholar
Sagheddu, C., Boccaccio, A., Dibattista, M., Montani, G., Tirindelli, R., and Menini, A. (2010). Calcium concentration jumps reveal dynamic ion selectivity of calcium-activated chloride currents in mouse olfactory sensory neurons and TMEM16b-transfected HEK 293T cells. J. Physiol. 588, 4189–4204. doi: 10.1113/jphysiol.2010.194407
Pubmed Abstract | Pubmed Full Text | CrossRef Full Text | Google Scholar
Schmid, A., Pyrski, M., Biel, M., Leinders-Zufall, T., and Zufall, F. (2010). Grueneberg ganglion neurons are finely tuned cold sensors. J. Neurosci. 30, 7563–7568. doi: 10.1523/jneurosci.0608-10.2010
Pubmed Abstract | Pubmed Full Text | CrossRef Full Text | Google Scholar
Serizawa, S., Miyamichi, K., Takeuchi, H., Yamagishi, Y., Suzuki, M., and Sakano, H. (2006). A neuronal identity code for the odorant receptor-specific and activity-dependent axon sorting. Cell 127, 1057–1069. doi: 10.1016/j.cell.2006.10.031
Pubmed Abstract | Pubmed Full Text | CrossRef Full Text | Google Scholar
Shimazaki, R., Boccaccio, A., Mazzatenta, A., Pinato, G., Migliore, M., and Menini, A. (2006). Electrophysiological properties and modeling of murine vomeronasal sensory neurons in acute slice preparations. Chem. Senses 31, 425–435. doi: 10.1093/chemse/bjj047
Pubmed Abstract | Pubmed Full Text | CrossRef Full Text | Google Scholar
Silvotti, L., Moiani, A., Gatti, R., and Tirindelli, R. (2007). Combinatorial co-expression of pheromone receptors, V2Rs. J. Neurochem. 103, 1753–1763. doi: 10.1111/j.1471-4159.2007.04877.x
Pubmed Abstract | Pubmed Full Text | CrossRef Full Text | Google Scholar
Soehnlein, O., and Lindbom, L. (2010). Phagocyte partnership during the onset and resolution of inflammation. Nat. Rev. Immunol. 10, 427–439. doi: 10.1038/nri2779
Pubmed Abstract | Pubmed Full Text | CrossRef Full Text | Google Scholar
Spehr, J., Hagendorf, S., Weiss, J., Spehr, M., Leinders-Zufall, T., and Zufall, F. (2009). Ca2+-calmodulin feedback mediates sensory adaptation and inhibits pheromone-sensitive ion channels in the vomeronasal organ. J. Neurosci. 29, 2125–2135. doi: 10.1523/jneurosci.5416-08.2009
Pubmed Abstract | Pubmed Full Text | CrossRef Full Text | Google Scholar
Spehr, M., Spehr, J., Ukhanov, K., Kelliher, K. R., Leinders-Zufall, T., and Zufall, F. (2006). Parallel processing of social signals by the mammalian main and accessory olfactory systems. Cell. Mol. Life Sci. 63, 1476–1484. doi: 10.1007/s00018-006-6109-4
Pubmed Abstract | Pubmed Full Text | CrossRef Full Text | Google Scholar
Triggle, D. J., Gopalakrishnan, M., Rampe, D., and Zheng, W. (2006). Voltage-Gated Ion Channels as Drug Targets. eds D. J. Triggle, M. Gopalakrishnan, D. Rampe and W. Zheng Weinheim: Wiley-VCH Verlag GmbH.
Trotier, D., and Døving, K. B. (1996). Direct influence of the sodium pump on the membrane potential of vomeronasal chemoreceptor neurones in frog. J. Physiol. 490, 611–621.
Ukhanov, K., Leinders-Zufall, T., and Zufall, F. (2007). Patch-clamp analysis of gene-targeted vomeronasal neurons expressing a defined V1r or V2r receptor: ionic mechanisms underlying persistent firing. J. Neurophysiol. 98, 2357–2369. doi: 10.1152/jn.00642.2007
Pubmed Abstract | Pubmed Full Text | CrossRef Full Text | Google Scholar
Veitinger, S., Veitinger, T., Cainarca, S., Fluegge, D., Engelhardt, C. H., Lohmer, S., et al. (2011). Purinergic signalling mobilizes mitochondrial Ca2+ in mouse Sertoli cells. J. Physiol. 589, 5033–5055. doi: 10.1113/jphysiol.2011.216309
Pubmed Abstract | Pubmed Full Text | CrossRef Full Text | Google Scholar
Wu, C. H., and Narahashi, T. (1988). Mechanism of action of novel marine neurotoxins on ion channels. Annu. Rev. Pharmacol. Toxicol. 28, 141–161. doi: 10.1146/annurev.pharmtox.28.1.141
Pubmed Abstract | Pubmed Full Text | CrossRef Full Text | Google Scholar
Yellen, G. (1984). Ionic permeation and blockade in Ca2+-activated K+ channels of bovine chromaffin cells. J. Gen. Physiol. 84, 157–186. doi: 10.1085/jgp.84.2.157
Pubmed Abstract | Pubmed Full Text | CrossRef Full Text | Google Scholar
Keywords: vomeronasal receptor, formyl peptide receptor, vomeronasal organ, sensory neurons, VNO, olfaction
Citation: Ackels T, von der Weid B, Rodriguez I and Spehr M (2014) Physiological characterization of formyl peptide receptor expressing cells in the mouse vomeronasal organ. Front. Neuroanat. 8:134. doi: 10.3389/fnana.2014.00134
Received: 29 August 2014; Accepted: 01 November 2014;
Published online: 21 November 2014.
Edited by:
Pablo Chamero, University of Saarland, GermanyReviewed by:
Diego Restrepo, University of Colorado Anschutz, USAXavier Grosmaitre, CNRS, France
Johannes Reisert, Monell Chemical Senses Center, USA
Copyright © 2014 Ackels, von der Weid, Rodriguez and Spehr. This is an open-access article distributed under the terms of the Creative Commons Attribution License (CC BY). The use, distribution and reproduction in other forums is permitted, provided the original author(s) or licensor are credited and that the original publication in this journal is cited, in accordance with accepted academic practice. No use, distribution or reproduction is permitted which does not comply with these terms.
*Correspondence: Tobias Ackels, Department of Chemosensation, RWTH Aachen University, Worringerweg 3, 52074 Aachen, Germany e-mail: t.ackels@sensorik.rwth-aachen.de