 Hao Chen1* Zhimin Liu1 Suzhen Gong1 Xingjun Wu1 William L. Taylor2 Robert W. Williams3 Shannon G. Matta1 Burt M. Sharp1*
- 1 Department of Pharmacology, University of Tennessee Health Science Center, Memphis, TN, USA
- 2 Molecular Resource center, University of Tennessee Health Science Center, Memphis, TN, USA
- 3 Department of Anatomy and Neurobiology, University of Tennessee Health Science Center, Memphis, TN, USA
The cellular heterogeneity of brain poses a particularly thorny issue in genome-wide gene expression studies. Because laser capture microdissection (LCM) enables the precise extraction of a small area of tissue, we combined LCM with neuronal track tracing to collect nucleus accumbens shell neurons that project to ventral pallidum, which are of particular interest in the study of reward and addiction. Four independent biological samples of accumbens projection neurons were obtained. Approximately 500 pg of total RNA from each sample was then amplified linearly and subjected to Affymetrix microarray and Applied Biosystems sequencing by oligonucleotide ligation and detection (SOLiD) transcriptome sequencing (RNA-seq). A total of 375 million 50-bp reads were obtained from RNA-seq. Approximately 57% of these reads were mapped to the rat reference genome (Baylor 3.4/rn4). Approximately 11,000 unique RefSeq genes and 100,000 unique exons were identified from each sample. Of the unmapped reads, the quality scores were 4.74 ± 0.42 lower than the mapped reads. When RNA-seq and microarray data from the same samples were compared, Pearson correlations were between 0.764 and 0.798. The variances in data obtained for the four samples by microarray and RNA-seq were similar for medium to high abundance genes, but less among low abundance genes detected by microarray. Analysis of 34 genes by real-time polymerase chain reaction showed higher correlation with RNA-seq (0.66) than with microarray (0.46). Further analysis showed 20–30 million 50-bp reads are sufficient to provide estimates of gene expression levels comparable to those produced by microarray. In summary, this study showed that picogram quantities of total RNA obtained by LCM of ∼700 individual neurons is sufficient to take advantage of the benefits provided by the transcriptome sequencing technology, such as low background noise, high dynamic range, and high precision.
Introduction
Many methods have been developed to measure gene expression levels in the central nervous system. Some of these methods, such as real-time polymerase chain reaction (RT-PCR), although accurate, is relatively low in throughput. High-throughput methods, such as DNA microarrays, are capable of measuring tens of thousands of genes in one sample. However, data from microarrays usually require confirmation by a second method (e.g., RT-PCR) because gene expression levels are derived from nucleotide hybridization, which is prone to false signal (Okoniewski and Miller, 2006). Another inherent limitation of microarrays is that newly discovered genes or their variants are often not present on the platform, limiting the scope of research.
Recently, ultra-high-throughput DNA sequencing techniques have become viable alternatives to microarrays in measuring genome-wide transcript expression levels. Several competing platforms are commercially available through Illumina, Roche, and Applied Biosystems (AB). These techniques have been collectively called RNA-seq. The AB sequencing by oligonucleotide ligation and detection (SOLiD) technology is unique in that it employs a two-base encoding system where each color encodes two nucleotides and each nucleotide is detected twice in a sequencing run. As a result, rather than the conventional “nucleotide space,” raw data from SOLiD sequencing are recorded in “color space.” Recent versions of the technology are capable of providing 300–500 million 50 bp short reads in a single run. In addition to genome sequencing or re-sequencing (Lupski et al., 2010), the SOLiD technology has been used in transcriptomic (Bradford et al., 2010), or epigenetic (Johannes et al., 2010) studies. Several recent reviews have summarized the advantages of RNA-seq over other gene expression profiling methods (Wang et al., 2009; Wilhelm and Landry, 2009; Costa et al., 2010; Ozsolak and Milos, 2011). Among them, low background noise, capable of detecting novel transcripts and alternative splicing forms, exonal and nucleotide resolution, high dynamic range in detection, high precision, and high reproducibility all have been noted.
The cellular heterogeneity of brain poses a particularly thorny issue in the measurement of gene expression. Not only are neurons intermixed with glial cells, but each is composed of diverse phenotypes. Neurons can be classified based on many criteria, such as the neurotransmitter they produce, their morphology, or their projection region. Glial cells are much smaller, but much more abundant than neurons in most regions of the brain. Thus, the level of a particular gene transcript expressed in brain tissue is determined by its expression level in each of the cell types present in the tissue. Laser capture microdissection (LCM) is a technology that enables the precise extraction of a small area (e.g., 10–30 μm in diameter) of tissue mounted on a microscope slide. When combined with various visualization methods, such as fluorescent immunohistochemistry, or neuronal track tracing, it enables the collection of phenotype-specific neurons from brain tissue.
We report herein a comparison of microarray and RNA-seq, using the same set of samples (i.e., nucleus accumbens shell neurons projecting specifically to ventral pallidum) enriched by LCM for neuronal phenotype and projection region. We found that the correlation of gene expression levels from these two platforms were highly significant. RNA-seq data showed a higher correlation with RT-PCR data when evaluated using 34 genes, with a wide range of expression levels.
Materials and Methods
Animals and Surgeries
Lewis rats were bred in the lab using breeders purchased from Harlan Laboratories (Indianapolis, IN, USA). Adolescent male Lewis rats (postnatal day 35) were anesthetized with ketamine/xylazine (90 and 10 mg/kg, respectively, i.p.) and then placed in a stereotaxic frame. Fluorogold (2% in sterile saline, Fluorochrome, Englewood, CO, USA) was deposited into ventral pallidum (AP: −0.22, ML: ±2.2, DV: −8.0) bilaterally by ionotophoretic injection using a Midgard high voltage current source (Stoelting Co., Wood Dale, IL, USA). The current was set at +5 μA (7 s on, 7 s off, for 5 min). Micropipettes were left in place for 15 min before the scalp incision was sutured. Five days later, rats were killed, brains removed, immediately frozen, and stored at −70°C. All procedures were conducted in accordance with the NIH Guidelines Concerning the Care and Use of Laboratory Animals and were approved by the Animal Care and Use Committee of the University of Tennessee.
Laser Capture Microdissection
Brains were sectioned in a Leica cryostat at 10μm, and sections were mounted onto uncharged glass slides. Slides were dehydrated by immersion in: 100% methanol (3 min), 95% ethanol (2 min), 100% ethanol (1 min, twice) and finally xylene (5 min, twice), and then air dried (15 min). Arcturus XT (Life Technologies) was used to capture Fluorogold-labeled neurons. The infrared laser was adjusted to produce spots approximately 15 μm in diameter, which allowed consistent capture of neurons onto CapSure LCM caps (Life Technologies). Approximately 1,500 labeled neurons were captured from each animal.
RNA Extraction and Amplification
RNA trapped in the CapSure LCM caps was extracted using the PicoPure RNA isolation kit (Life technologies); RNA was eluted with 13 μl nuclease-free water. RNA quality was analyzed using Bioanalyzer (model 2100, Agilent, Foster City, CA, USA). The mean concentration of the four samples was 496 pg/μl. From each sample, two aliquots (∼500 pg total) of RNA were taken for Affymetrix microarray and ABI SOLiD sequencing, respectively.
Affymetrix Microarray
Total RNA were amplified by Nugen Ovation Pico WTA system, followed by cDNA synthesis using the WT Ovation Exon module. Ovation Biotin kits were then used to fragment and label the cDNA (Ovation reagents: NuGen Inc., San Carlos, CA, USA). The labeled cDNA was then hybridized to the Rat Gene ST 1.0 array (Affymetrix), according to the manufacturer’s protocols for Whole Transcriptome arrays. Microarrays were then processed on a Fluidics Station 450 and scanned by the Affymetrix GeneChip 3000 7G Scanner.
ABI Solid Transcriptome Sequencing
Total RNA (500 pg) extracted from laser-captured neurons was amplified using the Ovation RNA-seq system (NuGen). The amplified cDNAs were end repaired using the End-It™ (Epicenter) kit, and ligated to the P1 and P2 adaptors used for SOLiD sequencing. The P2 adapter contains the “bar-codes” that allow multiplexing of assays. The standard sequencing protocol, provided by Applied Biosystems, was followed, thereafter. Briefly, the bar-coded libraries were pooled and size-selected before preparing emulsions of templated beads. The emulsion was then transferred to a 96-well plate and thermocycled, using the recommended conditions. The beads were then enriched and deposited onto a slide for sequencing, using manufacturer’s protocols.
Real-Time PCR
Quantitative PCR of 34 genes was performed on the Biomark PCR system with 48.48 Dynamic Array (Fluidigm Corp.) to provide an independent evaluation of gene expression. cDNAs, amplified using the Nugen Ovation Pico WTA system (for microarray) and Ovation RNA-seq (for transcriptome sequencing), were used. These cDNAs were subjected to 14 cycles of specific target amplification using TaqMan PreAmp Mastermix (Applied Biosystems), according to the manufacturer’s protocols. The samples were then diluted (1:5) in TE buffer. The sample mixtures were prepared by combining the samples with TaqMan Universal Master Mix with Rox (Roche Applied Science) and Gene Expression sample loading reagent (Fluidigm Corp.). The assay mixtures contained 200 nM of each primer and 100 nM of the probe in Dynamic Array Assay Loading Reagent (Fluidigm Corp). All primers and probes for the 34 genes have been tested, demonstrating linear amplification. The sample and assay mixtures were loaded into appropriate inlets before the Dynamic Array was placed on the NanoFlex™ 4-IFC Controller to distribute the sample and assay mixture. The loaded Dynamic Array was then inserted into the BioMark™ RT-PCR System. The cycling program consisted of 10 min at 95°C followed by 40 cycles of 95°C for 15 s and then 60°C for 1 min. Data were analyzed using Fluidigm RT-PCR Analysis software to obtain Ct values. To permit comparison of CT values with microarray and RNA-seq data at log2 scale, an arbitrary unit was designed by taking the negative of the normalized CT values.
Data Analysis
Microarray data were analyzed using the xps package of the Bioconductor data analysis software (Gentleman et al., 2004). Background signals estimated by the antigenomic probes were subtracted from each probe set. Data were normalized using RMA method. Only probe sets that were classified as “present” by the dagb.call function were analyzed further.
RNA-seq data were alignment to the rat reference genome (Baylor 3.4/rn4, Nov. 2004) using SHRiMP2 (Ver. 2.1.1b; Rumble et al., 2009). Sequences were aligned in color space with default parameters on a Dell T7500 work station with two X5680 Intel Xeon processors (6 cores each) and 48 GB of RAM. SHRiMP2 was used because of its high sensitivity, accuracy and reasonable speed (David et al., 2011). However, SHRiMP2 is not capable of mapping reads that are located on the exon–exon junctions. TopHat (Ver. 1.2.0) was used to align the reads to both the reference genome and to all known splice junction sites (based on RefSeq annotation file in GTF format downloaded from UCSC genome browser on April 06 2011). Reads aligned to the splices sites were then selected based on the CIGAR code (N) in the resulting SAM file (Li et al., 2009). The genomic alignments from SHRiMP2 and splice site alignments for each sample were then combined. The Cufflinks program (Ver. 0.9.3; Trapnell et al., 2010; Roberts et al., 2011) was then used to estimate gene expression levels in reads per kilobase per million (RPKM). For exon level analysis, the SAM files and the GTF files were first converted to the BED format using a custom Perl script. The annotateBed command in the BEDTools suite (Quinlan and Hall, 2010) was then used to obtain the number of reads for each exon.
Results
Microarray
Approximately 1,400 GABAergic neurons, located in nucleus accumbens shell and projecting to ventral pallidum, were captured from each rat. RNA was extracted and its quality was examined with an Agilent 2100 Bioanalyzer. The RNA integrity numbers (RIN) were 8.9, 8.2, 8.1, and 7, respectively, for the four samples, indicating minimal RNA degradation.
Half of each sample was amplified and then hybridized to Affymetrix GeneChip ST 1.0 microarrays. The data were normalized using the RMA method, and fluorescence intensities were converted to log2 scale. A total of 722,000 probes, representing 27,000 different genes, were present on the array. The dabg.call function of the xps package determined 2,182 genes were not detected. The remaining 25,181 genes were used for subsequent analysis. The median intensity was 6.76, 6.79, 6.80, and 6.79 on log2 scale for the four samples, respectively. The distribution of the RMA signal intensities is shown in Figure 1.
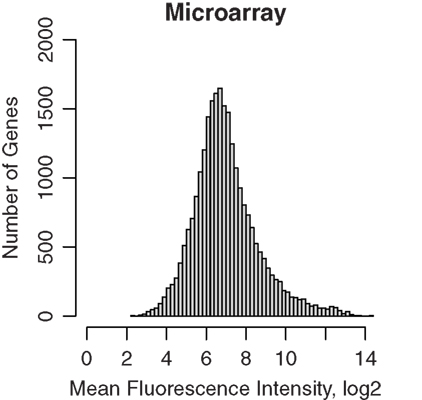
Figure 1. Microarray gene expression profiles of GABAergic neurons projecting from nucleus accumbens shell to ventral pallidum. These projection neurons were labeled retrogradely by Fluorogold and were obtained by laser capture microdissection. RNA were extracted and amplified before hybridization to Affymetrix rat ST 1.0 microarrays. Background noise, estimated using the antigenomic controls, were subtracted and signals were normalized using the Bioconductor xps package. The distribution of mean microarray signal intensities for all gene transcripts detected in four rat samples from nucleus accumbens of inbred Lewis rats were plotted. The median fluorescence signal intensity was 6.78. Thus, LCM samples provided sufficient RNA for amplification and reliable detection of the transcriptome.
Pair-wise Pearson correlation coefficients, comparing the fluorescence intensities of all genes between pairs of samples, are greater than 0.95. Scatter plots comparing the arithmetic mean fluorescence intensity of each gene in the four samples to the values in each sample are shown in Figure 2. Pearson correlation coefficients are >0.98. These high correlation coefficients suggest that the techniques used, including retrograde neuronal track tracing, LCM, whole transcriptome amplification, and microarray detection are highly precise.
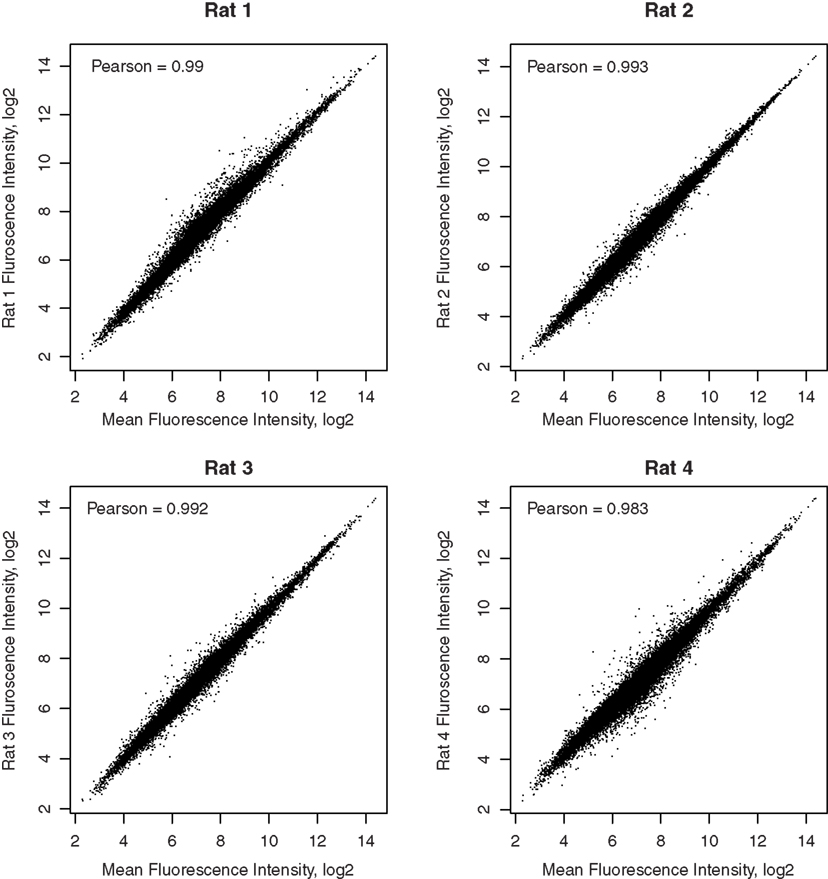
Figure 2. Correlation of each microarray sample with the mean of all samples. The correlation coefficients between the gene expression levels in each rat and the mean expression levels of the four rats are reported in the respective graphs. The high correlations demonstrated the reliability of detection of microarays.
RNA-Seq
To compare transcriptome expression levels determined by RNA-seq vs microarray, an aliquot of the same sample was used in each study. Total RNA from each of four samples was first amplified and then bar-coded sequencing libraries were prepared for the SOLiD platform. A total of 375 million 50-bp reads was obtained from the four samples. The number of reads for each rat sample (i.e., Total Tags) is shown in Table 1.
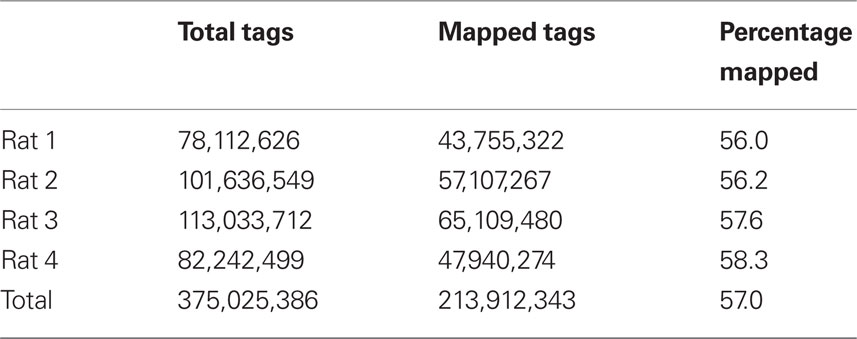
Table 1. Genome mapping.
Four accumbens shell GABAergic projection neuron RNA samples were “bar-coded” and sequenced in one SOLiD run. The 50-bp tags were aligned to rat reference genome (Baylor 3.4/rn4, Nov. 2004) using the SHRiMP program in color space mode. The reads aligned to known splicing sites were obtained from the TopHat program. The combined genomic and splice site alignments were shown for each rat.
The SHRiMP program was used to map these 50-bp reads to the rat reference genome (Baylor 3.4/rn4, Nov. 2004). For each rat, the number of mapped reads is shown in Table 1. We attempted to determine why approximately 40% of reads were not mapped. We first ruled out the possibility that these reads were inadvertent inclusions of sequences from other species that might present in the lab during the amplification procedure. Because the percentage of mapped reads was similar in the four samples, only data from rat 1 were used for analysis. We found only 1.5 and 3.1% of the unmapped reads align with human and mouse reference genomes, respectively. Thus, contamination is unlikely the cause of large number of unmapped reads. We then compared the quality scores of the mapped vs the unmapped reads (Figure 3). There was a gradual decrease in the mean quality score from base 1 to base 50 in both the mapped and the unmapped reads. Additionally, the mapped reads consistently had higher mean quality scores than the unmapped reads at every base position (mean difference: 4.74 ± 0.42). Therefore, it is likely low read quality is the reason a large fraction of the reads were not mapped.
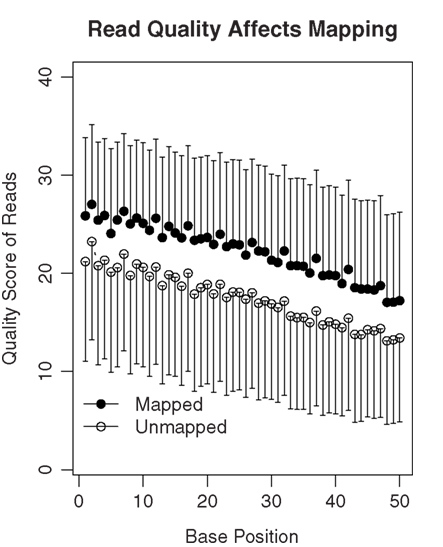
Figure 3. The quality of sequencing reads affects mapping. A total of 78 million 50-bp reads were obtained for rat 1. Among them, 35.8 million reads were mapped to the genome or known splicing sites. The mean quality scores of the mapped vs the unmapped reads were plotted. In general, the quality scores declined over the sequencing runs (i.e., from base 1 to 50). On average, the unmapped reads had quality scores 4.74 ± 0.42 lower than those that were mapped. Thus, lower quality of the read data is likely one of the reasons many reads are not mappable.
The Cufflinks software was then used to assign the mapped reads to genes. The RefSeq annotation file, downloaded from UCSC genome browser (http://genome.ucsc.edu), was used as the reference annotation to estimate gene expression levels. Cufflinks provided estimates of gene expression abundance and normalized the raw data to RPKM. A total of 12,136, 11,901, 12,170, and 11,648 unique genes are detected in the four samples, respectively. The median RPKM for the four samples are 4.71, 3.52, 3.67, and 3.74, respectively. The histogram of mean RPKM (log2) values for all genes in the four samples is shown in Figure 4A. We also counted the number of reads for each known exon using the BEDTools software. A total of 110,419, 106,789, 110,590, and 98,405 unique exons were detected for the four samples, respectively. The distribution of the mean reads for the exons were plotted in Figure 4B.
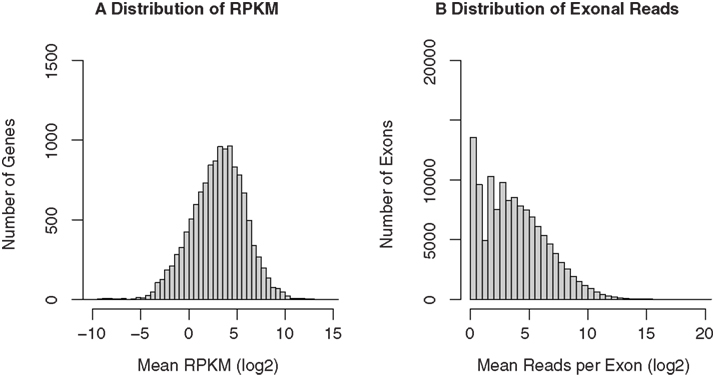
Figure 4. RNA-seq gene expression profiles of GABAergic neurons projecting from nucleus accumbens shell to ventral pallidum. The same RNA samples used in the microarray study were amplified before “bar-coded” cDNA libraries were prepared for SOLiD sequencing. All four samples were then pooled and sequenced in the same run. The 50-bp sequencing reads were mapped to the rat reference genome and known splicing sites using the SHRiMP and TopHat programs, respectively. Gene expression levels (normalized to RPKM) were obtained using the Cufflinks program. A total of 11,000 unique RefSeq genes and 100,000 unique exons were detected. The distribution of mean RPKM for these genes (A) and exons (B) was plotted.
Reads per kilobase per million is highly correlated between the four biological replicates with the minimal Person coefficient of 0.974. The Pearson correlation coefficients, comparing each of the four samples to the mean of the four samples, are 0.991, 0.995, 0.996, and 0.997, respectively, as shown in Figure 5.
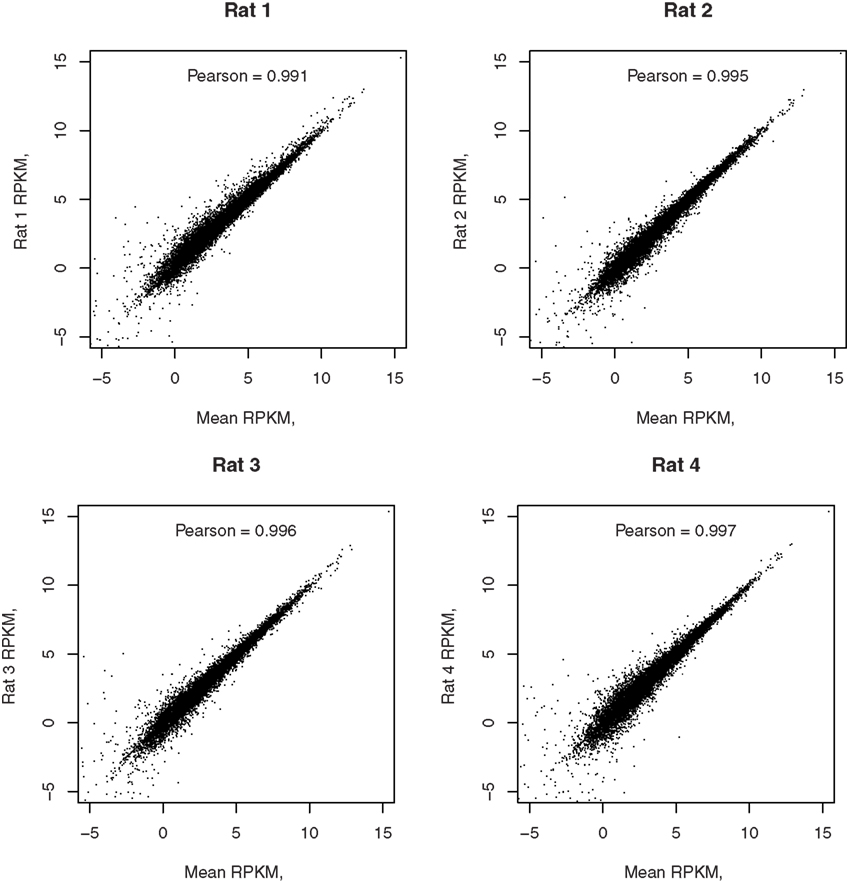
Figure 5. Correlation of each RNA-seq sample with the mean of all samples. The correlation coefficients between the gene expression levels from each rat and the mean expression levels of the four rats are reported in their respective graphs. The high correlation demonstrated the reliability of detection of RNA-seq.
Ribosomal RNAs (rRNA) constitute a large fraction of total RNA and are usually removed by dedicated steps in the RNA-seq laboratory protocol. However, the amounts of RNA obtained from LCM samples comprised of individual cells were, as expected, in the picogram range. With these highly limited quantities, there is no suitable method to specifically remove rRNA without sacrificing a large fraction of the mRNA. However, the RNA amplification method we used incorporates the RiboSPIA method, which preferentially amplifies mRNA. We found that reads from rRNA constitute less than 2% of the total reads in our samples. Therefore, the amplification approach we used selectively reduces the amount of rRNA in the amplified product.
Comparison of Microarray with RNA-Seq
Both microarray and RNA-seq data were available for 10,413, 10,204, 10,442, and 9,983 genes from the four rats, respectively. The scatter plots (Figure 5), directly comparing these two technologies, show a strong correlation in the reported gene expression levels. However, the relationship does not appear to be linear and is dependent on gene expression levels. We thus split the data using the mean RPKM for each sample. Correlation analysis shows that genes expressed at higher levels are better correlated across both platforms than those expressed at lower abundance, although both are highly significant (p < 2.2E-16). The Pearson correlation coefficients for the four rats ranged from 0.698 to 0.764, as shown in Figure 6.
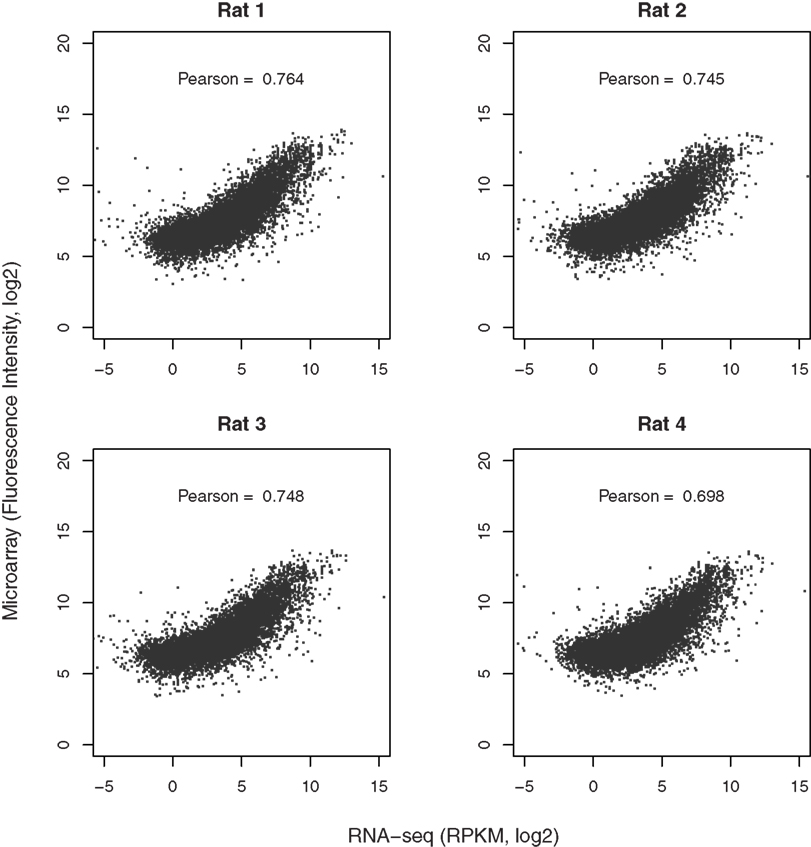
Figure 6. Comparison of microarray with RNA-seq data. The gene expression levels obtained from microarray and RNA-seq for each rat were matched based on RefSeq IDs. Over 11,000 genes were detected by both techniques. The correlation coefficients were provided in the respective graphs. In general, genes expressed at higher abundance tend to be better correlated than those expressed at lower abundance levels. More importantly, the dynamic range of RNA-seq is much higher than that of microarray (from −4 to 10 vs from 5 to 15 on log2 scale for RNA-seq and microarray, respectively, representing ∼2–3 orders of magnitude in difference). This enhanced dynamic range is likely to provide better accuracy in detecting the differences between samples or treatments.
The variance in the data obtained from either microarray or RNA-seq was compared after scaling the two data sets so that they have the same median to allow the coefficient of variation (CV) be compared. In Figures 7A,B, we plotted these CVs for each gene against their mean expression values. To better display the relationships, the mean expression values (i.e., fluorescence intensity and RPKM) were shown in log2 scale. In both microarray and RNA-seq platforms, there was less variation between the biological replicates when genes are expressed at higher levels. This variation increased progressively with decreasing levels of gene expression in RNA-seq. However, compared to RNA-seq, the CVs for microarray data were less for low intensity genes. We thus divided each data set by their median. The distribution of CV for high abundance genes was almost identical between microarray and RNA-seq (Figure 7C). For low abundance genes, there were more genes with high CV (>0.2) in the RNA-seq than microarray data set (Figure 7D).
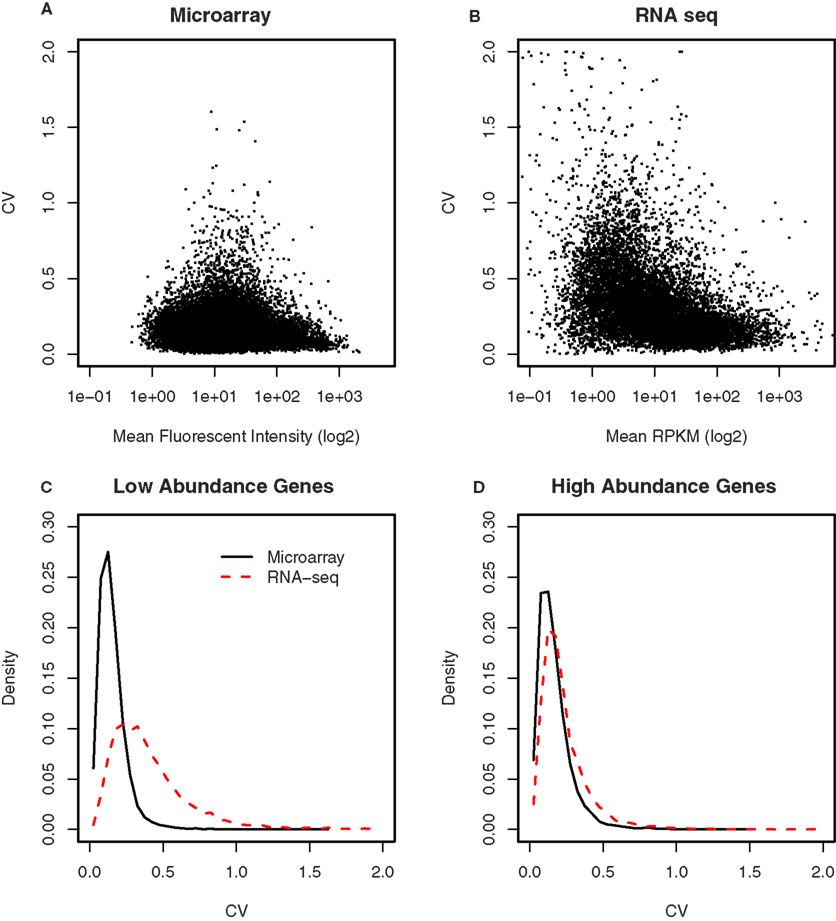
Figure 7. Comparison of the variances between microarray and RNA-seq. (A) The coefficient of variation for each gene was plotted against its signal intensity obtained from microarray. (B) The coefficient of variation for each gene was plotted against its signal intensity obtained from RNA-seq. (C) The distribution of the CVs for low abundance genes showed microarray has less genes with high CVs (e.g., greater than 0.2) than RNA-seq. (D) The distribution of the CVs for high abundance genes were similar between microarray and RNA-seq. These data suggest that the samples size of RNA-seq experiments need to be the same or larger (for low abundance genes) than those of microarray experiments.
Because the samples were obtained from LCM neurons, it was expected that marker genes for GABAergic neurons will be enriched. Table 2 listed some markers of astrocytes, microglia, GABAergic, and glutamatergic neurons. As recently demonstrated (Okaty et al., 2011), laser-captured samples indeed was contaminated with other types of cells. It is worth noting, however, that the ratio of GABAergic markers to other cellular markers was much larger in the RNA-seq data set. For example, the linear ratio of Gad1 and Gad2 to Vglut1 and Vglut2 are approximately 56 in the RNA-seq data but was about 9 in the microarray data. The low level expression of Vglut1 and Vglut2 are likely from dopaminergic neurons (El Mestikawy et al., 2011). The relatively high levels of Vglut detected on microarray potentially could be due to cross hybridization from other mRNAs. Similarly, the ratio of GABAergic to oligodendritic markers was approximately 4 in the RNA-seq data and was only 2 in the microarray data. These results suggest RNA-seq is a more sensitive method in detecting differences in gene expression levels.
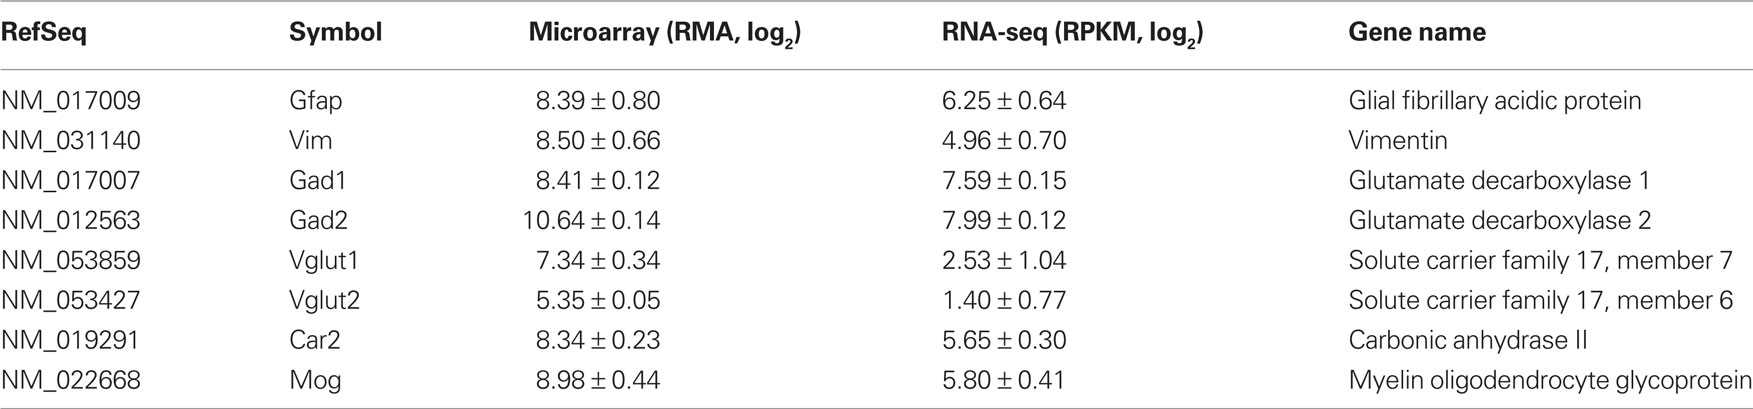
Table 2. Expression of cellular marker genes.
We obtained approximately 80–110 million 50-bp reads from each of the samples. To estimate if fewer reads could still provide reliable estimates of gene expression levels, we randomly sampled different numbers of reads from rat 1 and compared the gene expression levels of these samples with the full data set. As shown in Figure 8A, we first counted the number of unique genes detected from these subsets. Although fewer genes are detected as the number of reads decreases, the decline is relatively gradual until approximately 11.3 million reads where it appeared to steepen. For example, at 26 and 19.5 million reads (i.e., 1/3 and 1/4 of the total reads available in rat 1), 90.4 and 87% of the total genes are identified, respectively. In Figure 8B, the ordinate shows the correlation coefficients for the RPKM values obtained from each of these subsets of rat 1 reads compared to the complete set of reads, while the abscissa shows different gene expression levels. The correlation remained steadily at ∼0.9 when RPKM is above ∼23, despite gradual decreasing the number of reads to 9.8 million. Because one of the advantages of RNA-seq is the availability of expression data at the exon level, we plotted the effect of read depth and number of unique exons detected in Figure 8C. Fewer exons were detected as the number of reads decrease. The decline was at the same rate as genes: 90.4 and 87% at 1/3 and 1/4 of the reads, respectively. Figure 8D showed the correlation of exonal reads from the subsets and the original data set. For exons with more than 25 reads, the correlation was >0.9 despite the decrease in reads. At 20 million reads, exons with eight reads still had correlation of ∼0.7 with values obtained from the entire data set. These results suggest that approximately 15–20 million reads are sufficient to generate estimates of gene expression levels that are similar to those obtained from 70 to 80 million reads. With the availability of “bar-codes,” this will allow multiplexing of ∼20 samples on a single slide, using the SOLiD Ver. 4 hardware.
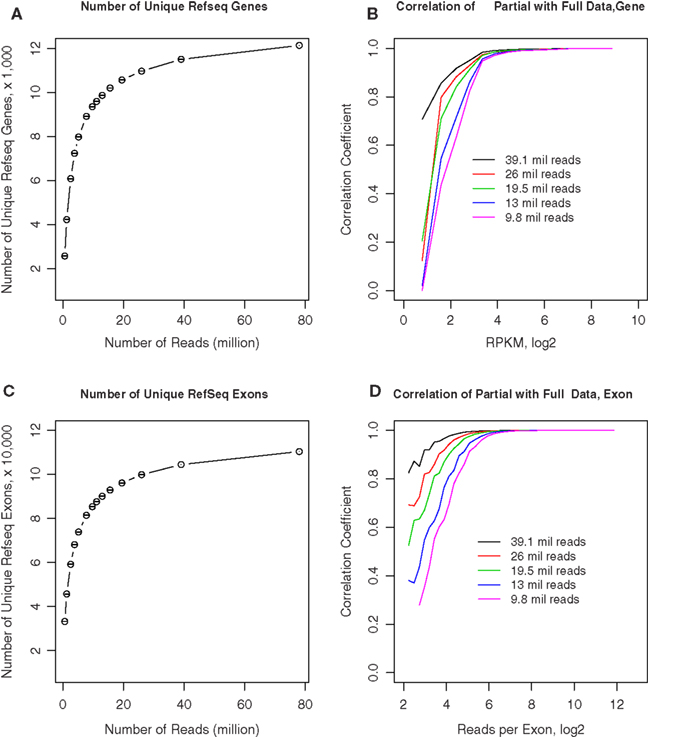
Figure 8. Effect of sequencing depth on RNA-seq data quality. (A) We obtained 78 million 50-bp reads from rat 1. Different numbers of reads were randomly sampled from the full data set of 78 million reads. The number of unique RefSeq genes was calculated from the full and randomly sampled subsets. The total number of unique genes remained stable when greater than 9.8 million reads were analyzed. (B) Gene expression levels calculated from these randomly selected subsets were highly correlated with the full data set when RPKM is above ∼23, despite gradual decreasing the number of reads to 9.8 million. (C) The number of unique exons detected were calculated for the entire and randomly sampled subsets. The total number of exons remained stable when greater than 9.8 million reads were analyzed. (D) The number of reads for each exon obtained from the randomly sampled data sets were correlated to the entire data set. The correlation for exons with more than ∼25 reads was greater than 0.9 despite the decrease in reads to 9.8 million. At 19.5 million reads, exons with ∼8 reads still had correlation of ∼0.7 with values obtained from the entire data set. These results suggest that ∼15–20 million reads are sufficient to generate estimates of gene expression levels that are similar to those obtained from 70 to 80 million reads.
To validate the data from microarray and RNA-seq, we selected 34 genes with different abundance levels and measured them using RT-PCR. PCR reactions were performed using the same amplified RNA that was used in the microarray and RNA-seq experiments. All primers were tested and showed amplification efficiencies close to 2. All the threshold cycle (CT) values were normalized for different input amount by subtracting the geometric mean of three reference genes (i.e., HPRT, SDNA, and PGK1). As shown in Figure 9, the correlation between PCR and RNA-seq is −0.66, while the correlation between PCR and microarray is −0.47 (The negative correlation is due to the use of cycle number for PCR data).
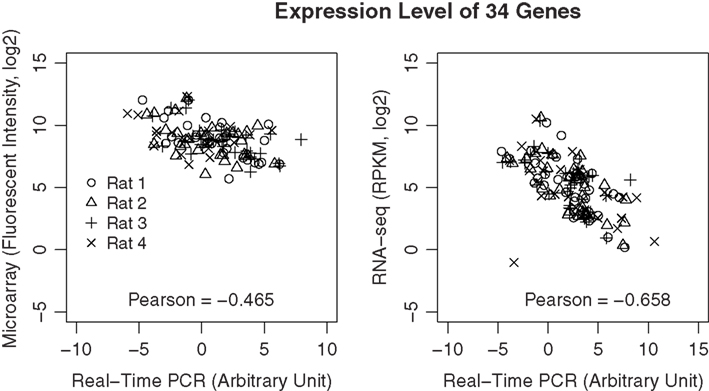
Figure 9. Validation of gene expression data using real-time PCR. A total of 34 genes were selected across a wide dynamic range. Real-time PCR was performed using the amplified cDNA from each of the microarray and RNA-seq samples. The correlations of the expression levels of these genes measured using real-time PCR and the respective microarray or RNA-seq measures were highly significant (p < 8.1E-08 and p > 4.4E-16, respectively). However, the overall correlation is higher for RNA-seq than microarray, suggesting data from RNA-seq is likely to be more accurate than those obtained from microarray.
Discussion
This research describes a process for selective transcriptome profiling of a highly heterogenous organ, the brain. Retrograde neuronal track tracing was applied to a brain region almost entirely composed of GABAergic neurons in order to identify a subset within NAcc that specifically innervate the ventral pallidium. A relatively small number of these labeled neurons were excised by laser-capture microdissection, and high quality RNA was extracted and amplified prior to transcriptome-wide measurements of mRNA levels by microarray and RNA-seq. Using this approach, we obtained reliable genome-wide gene expression data from approximately 700 labeled neurons. When compared to data obtained by RT-PCR, the gold-standard for measuring gene expression levels, RNA-seq showed a higher correlation than microarray. Lastly, our analysis showed that the total number of unique gene transcripts detected by RNA-seq is not significantly degraded by reducing the total number of reads from ∼80 million to ∼20 million. This allows for concurrent measurement of 20–30 samples on a single slide, using the current SOLiD technology (Ver. 4).
We used LCM to obtain GABAergic projection neurons labeled by a retrograde track tracer. Although the neurons were clearly defined when they were captured, our data showed contaminations form glial cells. This is in agreement with the lack of cellular specificity reported recently by others (Okaty et al., 2011). The difference of GABAergic vs glial marker in general is two-fold or larger in the RNA-seq than in the microarray data set. This suggests RNA-seq is a more sensitivity method in measuring gene expressing. The low background in detection and high dynamic range (see below) make RNA-seq a better method for detecting difference between samples.
One of the major challenges of applying RNA-seq to small RNA samples, such as those obtained by LCM, is to enrich the mRNA used in the sequencing library. Current methods for mRNA enrichment, which directly select mRNA or remove rRNA, require microgram quantities of total RNA. We used linear amplification to generate sufficient amounts of cDNA to construct libraries for sequencing. This amplification process preferentially amplifies mRNA, thereby reducing the amount of rRNA present in the final amplified sample. We found that less than 2% of the mapped reads are rRNA. This suggests that linear amplification can be used as an alternative method to reduce the amount of rRNA. One trade-off is that the orientation or, the “strandedness” of the RNA was lost during the RiboSPIA amplification procedure, complicating, to some extent, the downstream analysis.
We found good overall correlations in the gene expression levels measured by microarray and RNA-seq in all four biological replicates. Pearson correlations ranged from 0.698 to 0.764, which were in line with other published reports (ranging from 0.509 to 0.84; Mortazavi et al., 2008; Wang et al., 2009). One of the known disadvantages of microarray technology is that probes may also hybridize to off-target transcripts, affecting the measurement of transcript abundance (Okoniewski and Miller, 2006). Although RNA-seq can also be skewed by reads that align to incorrect loci due to sequencing errors, a recent study found that only 3–6 exons on the Y chromosome falsely aligned with more than one read in a female sample, suggesting the error rate is extremely low (Bradford et al., 2010). The present study also found that the dynamic range of signal intensity is ∼2–3 orders of magnitude larger in RNA-seq than in microarray (Figure 6). Lastly, we used RT-PCR to evaluate the abundance of 34 genes from each of the four samples. Compared to the RT-PCR data, RNA-seq shows a higher correlation than microarray (−0.66 vs −0.47; Figure 8). Together, these findings suggest RNA-seq is capable of providing gene expression estimates that are comparable to microarray-based genome-wide gene expression data from picogram quantities of total RNA; the quality of data is similar to or better than microarray. The moderate correlation co-efficiency compared to those reported in other studies (Nagalakshmi et al., 2008; Mane et al., 2009) could be due to the noise introduced in the amplification steps that are necessary for picograms of starting RNA or the relative small number of genes studied.
Several studies have found that RNA-seq is highly accurate and has low technical variance (Mane et al., 2009). Therefore, we compared the biological variance obtained from microarray and RNA-seq, using four samples from inbred strains of rat (Figures 7A,B). It appears that high abundance genes have similar CV values between the two platforms, while low abundance gens have higher variation from RNA-seq. This observation is in agreement with a recent estimate that the reproducibility of RNA-seq data is comparable to microarrays for genes that have been detected by at least 100 reads (Mane et al., 2009) and is confirmed when all the genes were divided at the median expressing levels into high and low abundance categories. The distribution of CVs (Figures 7C,D) showed RNA-seq has larger variation for the low abundance genes. This is likely due to the combination of two factors: (1) RNA-seq has reduced accuracy for low abundance genes; and (2) The microarray data contains some degree of background signal that is stable and might be higher than the gene-specific signals obtained from low abundance genes. The presence of this background signal can be inferred from the fact that the lowest value in gene expression is not zero, rather, it is somewhere around 3–4 on log2 scale. Therefore, the seemingly smaller CVs for low abundance genes on microarray is potentially due to the relatively low contribution of gene-specific signal to the total signal.
High-throughput sequencing is emerging as an attractive platform for whole transcriptome analysis. One of the main advantages of a sequencing-based method is that it does not rely on a predetermined set of probes designed against known target sequences, thereby allowing novel transcripts to be studied. Further, the digital nature of the sequencing process makes it more accurate than hybridization based methods. In summary, this study showed that RNA-seq can provide genome-wide transcriptome expression data using picograms of total RNA obtained from LCM. Furthermore, 20–30 million 50-bp reads are sufficient to provide estimates of gene expression levels that are comparable to those produced by Affymetrix microarrays.
Conflict of Interest Statement
The authors declare that the research was conducted in the absence of any commercial or financial relationships that could be construed as a potential conflict of interest.
Acknowledgments
This research was supported by DA-028962. We thank Lorne A. Rose, Katie A. Hiler and Qingling Wu for their technical assistance.
References
Bradford, J. R., Hey, Y., Yates, T., Li, Y., Pepper, S. D., and Miller, C. J. (2010). A comparison of massively parallel nucleotide sequencing with oligonucleotide microarrays for global transcription profiling. BMC Genomics 11, 282. doi: 10.1186/1471-2164-11-282
Costa, V., Angelini, C., De Feis, I., and Ciccodicola, A. (2010). Uncovering the complexity of transcriptomes with RNA-Seq. J. Biomed. Biotechnol. 2010, 853916.
David, M., Dzamba, M., Lister, D., Ilie, L., and Brudno, M. (2011). SHRiMP2: sensitive yet practical SHort Read Mapping. Bioinformatics 27, 1011–1012.
El Mestikawy, S., Wallen-Mackenzie, A., Fortin, G. M., Descarries, L., and Trudeau, L. E. (2011). From glutamate co-release to vesicular synergy: vesicular glutamate transporters. Nat. Rev. Neurosci. 12, 204–216.
Gentleman, R. C., Carey, V. J., Bates, D. M., Bolstad, B., Dettling, M., Dudoit, S., Ellis, B., Gautier, L., Ge, Y., Gentry, J., Hornik, K., Hothorn, T., Huber, W., Iacus, S., Irizarry, R., Leisch, F., Li, C., Maechler, M., Rossini, A. J., Sawitzki, G., Smith, C., Smyth, G., Tierney, L., Yang, J. Y., and Zhang, J. (2004). Bioconductor: open software development for computational biology and bioinformatics. Genome Biol. 5, R80.
Johannes, F., Wardenaar, R., Colome-Tatche, M., Mousson, F., De Graaf, P., Mokry, M., Guryev, V., Timmers, H. T., Cuppen, E., and Jansen, R. C. (2010). Comparing genome-wide chromatin profiles using ChIP-chip or ChIP-seq. Bioinformatics 26, 1000–1006.
Li, H., Handsaker, B., Wysoker, A., Fennell, T., Ruan, J., Homer, N., Marth, G., Abecasis, G., and Durbin, R. (2009). The sequence alignment/map format and SAMtools. Bioinformatics 25, 2078–2079.
Lupski, J. R., Reid, J. G., Gonzaga-Jauregui, C., Rio Deiros, D., Chen, D. C., Nazareth, L., Bainbridge, M., Dinh, H., Jing, C., Wheeler, D. A., Mcguire, A. L., Zhang, F., Stankiewicz, P., Halperin, J. J., Yang, C., Gehman, C., Guo, D., Irikat, R. K., Tom, W., Fantin, N. J., Muzny, D. M., and Gibbs, R. A. (2010). Whole-genome sequencing in a patient with Charcot-Marie-Tooth neuropathy. N. Engl. J. Med. 362, 1181–1191.
Mane, S. P., Evans, C., Cooper, K. L., Crasta, O. R., Folkerts, O., Hutchison, S. K., Harkins, T. T., Thierry-Mieg, D., Thierry-Mieg, J., and Jensen, R. V. (2009). Transcriptome sequencing of the microarray quality control (MAQC) RNA reference samples using next generation sequencing. BMC Genomics 10, 264. doi: 10.1186/1471-2164-10-264
Mortazavi, A., Williams, B. A., Mccue, K., Schaeffer, L., and Wold, B. (2008). Mapping and quantifying mammalian transcriptomes by RNA-Seq. Nat. Methods 5, 621–628.
Nagalakshmi, U., Wang, Z., Waern, K., Shou, C., Raha, D., Gerstein, M., and Snyder, M. (2008). The transcriptional landscape of the yeast genome defined by RNA sequencing. Science 320, 1344–1349.
Okaty, B. W., Sugino, K., and Nelson, S. B. (2011). A quantitative comparison of cell-type-specific microarray gene expression profiling methods in the mouse brain. PLoS ONE 6, e16493. doi: 10.1371/journal.pone.0016493
Okoniewski, M. J., and Miller, C. J. (2006). Hybridization interactions between probesets in short oligo microarrays lead to spurious correlations. BMC Bioinformatics 7, 276. doi: 10.1186/1471-2105-7-276
Ozsolak, F., and Milos, P. M. (2011). RNA sequencing: advances, challenges and opportunities. Nat. Rev. Genet. 12, 87–98.
Quinlan, A. R., and Hall, I. M. (2010). BEDTools: a flexible suite of utilities for comparing genomic features. Bioinformatics 26, 841–842.
Roberts, A., Trapnell, C., Donaghey, J., Rinn, J. L., and Pachter, L. (2011). Improving RNA-Seq expression estimates by correcting for fragment bias. Genome Biol. 12, R22.
Rumble, S. M., Lacroute, P., Dalca, A. V., Fiume, M., Sidow, A., and Brudno, M. (2009). SHRiMP: accurate mapping of short color-space reads. PLoS Comput. Biol. 5, e1000386. doi: 10.1371/journal.pcbi.1000386
Trapnell, C., Williams, B. A., Pertea, G., Mortazavi, A., Kwan, G., Van Baren, M. J., Salzberg, S. L., Wold, B. J., and Pachter, L. (2010). Transcript assembly and quantification by RNA-Seq reveals unannotated transcripts and isoform switching during cell differentiation. Nat. Biotechnol. 28, 511–515.
Wang, Z., Gerstein, M., and Snyder, M. (2009). RNA-Seq: a revolutionary tool for transcriptomics. Nat. Rev. Genet. 10, 57–63.
Keywords: transcriptome sequencing, GABAergic, nucleus accumbens, microarray, laser capture microdissection, GABA, RNA sequencing
Citation: Chen H, Liu Z, Gong S, Wu X, Taylor WL, Williams RW, Matta SG and Sharp BM (2011) Genome-wide gene expression profiling of nucleus accumbens neurons projecting to ventral pallidum using both microarray and transcriptome sequencing. Front. Neurosci. 5:98. doi: 10.3389/fnins.2011.00098
Received: 24 November 2010;
Accepted: 25 July 2011;
Published online: 15 August 2011.
Edited by:
Edward S. Lein, Allen Institute for Brain Science, USAReviewed by:
Edward S. Lein, Allen Institute for Brain Science, USAOleg Evgrafov, University of Southern California, USA
Copyright: © 2011 Chen, Liu, Gong, Wu, Taylor, Williams, Matta and Sharp. This is an open-access article subject to a non-exclusive license between the authors and Frontiers Media SA, which permits use, distribution and reproduction in other forums, provided the original authors and source are credited and other Frontiers conditions are complied with.
*Correspondence: Hao Chen and Burt M. Sharp, Department of Pharmacology, University of Tennessee Health Science Center, 874 Union Avenue, Memphis, TN 38163, USA. e-mail: hchen@uthsc.edu; bsharp@uthsc.edu