Prediction of task-related BOLD fMRI with amplitude signatures of resting-state fMRI
- 1 Department of Radiology, New Jersey Medical School, University of Medicine and Dentistry of New Jersey, Newark, NJ, USA
- 2 School of Behavioral and Brain Sciences, University of Texas at Dallas, Dallas, TX, USA
Blood oxygen contrast-functional magnetic resonance imaging (fMRI) signals are a convolution of neural and vascular components. Several studies indicate that task-related (T-fMRI) or resting-state (R-fMRI) responses linearly relate to hypercapnic task responses. Based on the linearity of R-fMRI and T-fMRI with hypercapnia demonstrated by different groups using different study designs, we hypothesized that R-fMRI and T-fMRI signals are governed by a common physiological mechanism and that resting-state fluctuation of amplitude (RSFA) should be linearly related to T-fMRI responses. We tested this prediction in a group of healthy younger humans where R-fMRI, T-fMRI, and hypercapnic (breath hold, BH) task measures were obtained form the same scan session during resting state and during performance of motor and BH tasks. Within individual subjects, significant linear correlations were observed between motor and BH task responses across voxels. When averaged over the whole brain, the subject-wise correlation between the motor and BH tasks showed a similar linear relationship within the group. Likewise, a significant linear correlation was observed between motor-task activity and RSFA across voxels and subjects. The linear rest–task (R–T) relationship between motor activity and RSFA suggested that R-fMRI and T-fMRI responses are governed by similar physiological mechanisms. A practical use of the R–T relationship is its potential to estimate T-fMRI responses in special populations unable to perform tasks during fMRI scanning. Using the R–T relationship determined from the first group of 12 healthy subjects, we predicted the T-fMRI responses in a second group of 7 healthy subjects. RSFA in both the lower and higher frequency ranges robustly predicted the magnitude of T-fMRI responses at the subject and voxel levels. We propose that T-fMRI responses are reliably predictable to the voxel level in situations where only R-fMRI measures are possible, and may be useful for assessing neural activity in task non-compliant clinical populations.
Introduction
The majority of functional magnetic resonance imaging (fMRI) studies using blood oxygen level dependent (BOLD) contrast have been performed in “task-based” study designs. Task-based fMRI (T-fMRI) measures BOLD signal changes between task-stimulated states and control states. However recent study designs also measure “resting-state” fMRI (R-fMRI) signals. R-fMRI signals are the BOLD signal fluctuations observed when the subject remains in a relaxed state, wherein they are not required to perform any tasks (Biswal et al., 1995). R-fMRI signals contain various physiological and non-physiological sources such as respiration, heart rate, and noise from scanner hardware (Dagli et al., 1999; Wise et al., 2004; Jo et al., 2010). The temporal coherence of low frequency R-fMRI signal (<0.1 Hz) between brain regions are believed to reflect functional networks that are active in that region during task performance (Biswal et al., 1995, 2010; Lowe et al., 1998; Cordes et al., 2000; Raichle et al., 2001; Greicius et al., 2004; Fox et al., 2005; Damoiseaux et al., 2006; Fox and Raichle, 2007; Zang et al., 2007; Roy et al., 2009). R-fMRI and T-fMRI acquisitions are routinely performed in basic and clinical research. The temporal structures of the R-fMRI signals are used to investigate properties of resting-state functional connectivity (RSFC) networks within the brain. However, the amplitude signatures within R-fMRI have received less attention (but see, e.g., Kannurpatti and Biswal, 2008; Kannurpatti et al., 2011; Liu et al., 2011).
Blood oxygen level dependent-fMRI responses are convolutions of neural and non-neural (vascular) components and R-fMRI responses, like T-fMRI responses, correlate linearly with hypercapnic task responses. Individual variability of vascular sensitivity to T-fMRI activation has been observed but with a linear relationship between task-induced and hypercapnia-induced BOLD responses (Liau and Liu, 2009). On the other hand, vascular sensitivity within the R-fMRI response has been indicated by hypercapnia-induced BOLD responses correlating strongly at the voxel level with the resting-state fluctuation of amplitude (RSFA), the amplitude component of the R-fMRI signal (Kannurpatti and Biswal, 2008). While T-fMRI and R-fMRI relationships with hypercapnic task responses have been determined separately by different studies (Biswal et al., 2007; Handwerker et al., 2007; Kannurpatti and Biswal, 2008; Liau and Liu, 2009; Kannurpatti et al., 2011), they have not been determined within a single study session where the inter-relationships between T-fMRI, R-fMRI, and hypercapnic tasks can be assessed from the responses obtained from a single scan session. Based on the linearity of R-fMRI and T-fMRI with hypercapnia demonstrated by different groups, using a variety of study designs, we hypothesized that R-fMRI and T-fMRI signals are governed by a common physiological mechanism and that the amplitude of the R-fMRI response, RSFA, should be linearly related to T-fMRI responses.
In a group of 12 younger normal human subjects from whom T-fMRI, R-fMRI, and hypercapnic task responses were obtained, robust linear correlations among R-fMRI vs hypercapnia, T-fMRI vs hypercapnia, and R-fMRI vs T-fMRI response amplitudes were observed. We defined the linear relationship between R-fMRI and T-fMRI response amplitudes as the “rest-task” (R–T) relationship. The linearity in the R–T relationship was observed at both the subject- and voxel-levels. On the basis of these observations we hypothesized that rest-related and task-related activity are governed by a common physiological mechanism, intrinsic to the brain.
Rest–task relationships have practical significance in determining how a subject or a brain region responds to a task knowing the amplitude signature of the R-fMRI signal. Understanding this relationship can be useful in scenarios where T-fMRI responses cannot be obtained, particularly in comatose patients and clinical subjects that are non-compliant or otherwise unable to perform motor or cognitive tasks in the scanner. The R–T relationship obtained from the first group of 12 subjects was used to predict the T-fMRI responses in a different group of 7 subjects. T-fMRI responses matched R-fMRI responses within a 5–10% error limit for high frequency RSFA and 20–30% for low frequency RSFA at the subject level. At the voxel-level, the high frequency RSFA robustly predicted T-fMRI responses in significantly higher numbers of voxels than low frequency RSFA.
Materials and Methods
Nineteen healthy young subjects with no history of head trauma or neurological disease were scanned. They were separated into two groups. The first group consisted of 12 subjects (6 M and 6 F; mean age = 24 years) and the second group consisting of 7 subjects (4 M and 3 F; mean age = 23 years). All experimental procedures were approved by The University of Texas at Dallas and The University of Medicine and Dentistry of New Jersey–New Jersey Medical School Institutional Review Boards. Written informed consent was obtained from all subjects and paid on an hourly basis during the study.
Each subject performed a bilateral fingertapping (FTAP) and a breath hold (BH) task. R-fMRI scans were also obtained for all the subjects. The subjects were instructed verbally through a microphone and speaker system at the time of the onset of each of the separate tasks. Participants sequentially touched each finger of each hand to its respective thumb making one touch and release, as best they could. The FTAP paradigm consisted of an initial 10 s rest period followed by four repetitions of alternate epochs of 20 s of bilateral fingertapping and 20 s of rest. The BH experiment consisted of a 40-s rest period (normal breathing) followed by three repetitions of alternate epochs of 20 s of BH and 40 s of normal breathing. Subjects performed an end-inspirational BH inhaling a similar volume of air, which they would in a normal breathing cycle (Kannurpatti et al., 2002; Biswal et al., 2007). Subjects were trained on the BH technique a few minutes prior to the actual scanning session and consciously avoided the inhalation of larger than the normal volume of air prior to BH. During the resting-state MR-scan, subjects remained relaxed with their eyes closed.
Magnetic resonance imaging in the first group of 12 subjects was performed on a Philips Achieva 3T scanner equipped with an eight-element, SENSE, receive-only head coil and a fixed asymmetric head gradient coil. MRI on the second group of seven subjects was performed on a Siemens Allegra 3T scanner equipped with a fixed asymmetric head gradient coil and a shielded end cap quadrature transmit/receive birdcage radio-frequency coil. Subjects were positioned in a supine position on the gantry with head in a midline location in the coil. Foam padding and a pillow were used to minimize head motion. High-resolution anatomical images using an MPRAGE sequence 1 mm isovoxel; sagittal; TE = 3.7 ms; flip angle = 12°. Gradient echo-EPI images were subsequently obtained during rest, FTAP and the BH task. Thirty-two slices were obtained in the axial plane covering the entire brain. Imaging parameters were: FOV of 220 mm, 64 × 64 matrix, TR/TE = 2000/30 ms and slice thickness of 4 mm. A flip angle of 80° was used to minimize flow weighting. Ninety, 150, and 120 EPI images were obtained during each of FTAP, BH, and rest scans respectively. Imaging parameters were kept the same for all three runs.
All fMRI data were preprocessed using AFNI (Cox, 1996). The EPI images were corrected for motion using a rigid-body volume registration algorithm available in AFNI. The motion correction algorithm calculated motion in six directions of rotation and translation throughout each run. The maximal displacement (D) was computed after considering motion in all six directions to obtain a single D value for each volume (Jiang et al., 1995). EPI data sets with D > 2 mm were omitted from further analysis. Analysis was done only on the voxels that represented the brain tissue. All the data sets were detrended to remove quadratic trends. MR saturation effects at the beginning of the scan were accounted for by eliminating the first four images in all calculations. Data from one subject in the first group of 12 subjects was not considered for further analysis due to excess motion. Images from each subject were transformed to standard stereotaxic space based on the Talairach and Tournoux atlas(Talairach and Tournoux, 1998).
To determine activated areas during each task, a gamma-variate function was convolved with the task reference function and cross correlated with the BOLD signal on a voxel-wise basis. FTAP activation was determined using a threshold of 0.30, and DSST activation using a threshold of 0.20, corresponding to a Bonferroni corrected P < 0.01 (Bandettini et al., 1993). To minimize false positives, a minimum cluster size of 20 voxels was considered for generating the activation maps at the subject level during all tasks. BOLD signal change in every voxel was computed as the temporal SD of the time series with and without filtering depending on the analysis. Temporal SD estimated from the respective time series were defined as BOLD signal response amplitude (ΔBOLD). For the motor and BH tasks ΔBOLDtask = SDtask, for the resting-state ΔBOLDrest = SDrest, i.e., RSFA (Figure 1).
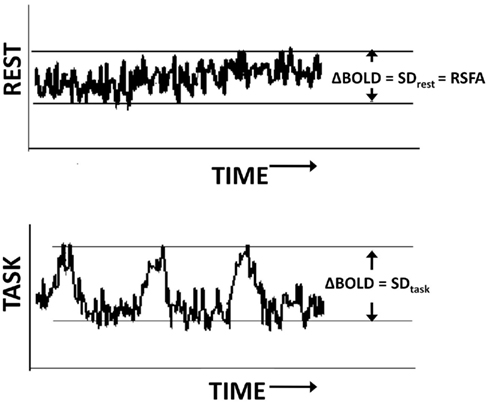
Figure 1. Estimation of the BOLD amplitude change during the resting state (top) and task (bottom) using the temporal SD of the time series.
Results
Spatiotemporal Characteristics of R-fMRI, T-fMRI, Hypercapnic (BH) Responses, and their Voxel-Wise Relationship
There was excellent spatial correspondence between the R-fMRI response (i.e., RSFA), T-fMRI response (i.e., BOLD signal amplitude SD) during the motor-task, and the hypercapnia response (i.e., BOLD signal amplitude SD) during the BH task as observed from typical subjects within areas activated by the motor task (Figures 2A–C). Evident from the maps in Figures 2A–C, areas with larger RSFA during the resting state also had larger BOLD signal amplitude response during the motor and BH tasks. Such a spatial correspondence between R-fMRI, T-fMRI, and hypercapnia was observed over all subjects. Figures 2D–F show the representative BOLD signal time courses of the R-fMRI, T-fMRI, and BH respectively from a gray matter voxel within the motor-task region of interest (ROI). Figures 2G–I show the representative BOLD signal time courses of the R-fMRI, T-fMRI, and BH respectively from a white matter voxel within the motor-task ROI. As shown in Figures 3A,B, the spatiotemporal correspondence between R-fMRI, T-fMRI, and BH signals within the brain was linear across voxels. Within a subject, a voxel-level linear relationship was observed between motor vs BH (r = 0.91; p < 10−7) and motor vs RSFA (r = 0.84; P < 10−7).
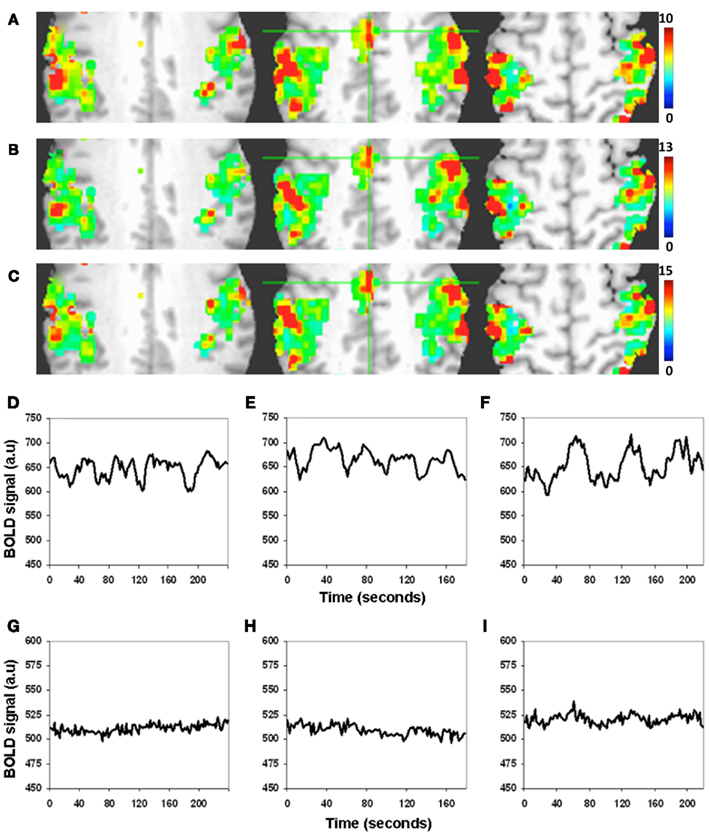
Figure 2. Spatiotemporal structure of the BOLD amplitude change (SD) from the motor-task region of interest (ROI). (A–C) Spatial and (D–I) temporal. (A) Resting state, (B) motor task, and (C) BH task. Voxels with large RSFA also tend to have large BOLD amplitude change during the motor and BH tasks. Such a spatial correspondence between R-fMRI, T-fMRI, and hypercapnia was observed over all subjects. (Different color scales have been used to visually normalize the color maps across the different experimental conditions). (D–F) BOLD signal time courses of the R-fMRI, T-fMRI, and hypercapnia respectively from a typical gray matter voxel within the motor-task ROI. (G–I) BOLD signal time courses of the R-fMRI, T-fMRI, and hypercapnia respectively from a typical white matter voxel within the motor-task ROI.
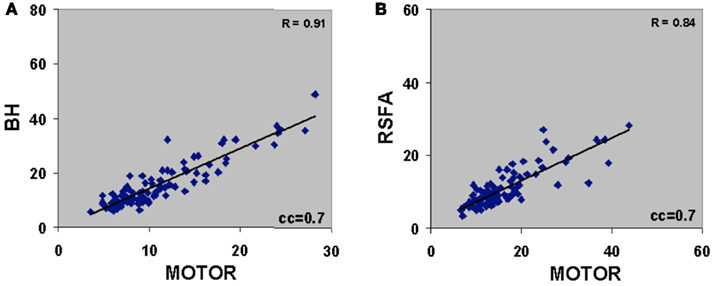
Figure 3. (A) Voxel-level relationship between motor vs BH (r = 0.91; P < 10−7) and (B) motor vs RSFA (r = 0.84; P < 10−7). Voxels were derived after cross correlating the BOLD response time courses with the gamma-variate convolved motor-task reference vector. Voxels with cross-correlation coefficient (cc) ≥0.7 corresponding to a Bonferroni corrected P < 10−5 was used to generate the correlations. Plots are representative of a typical subject.
Temporal coherence of R-fMRI signal fluctuations in the low frequency range (<0.1 Hz) signifying resting-state functional connectivity (RSFC; Biswal et al., 1995) are indicated to represent spontaneous neural activity; Shmuel and Leopold, 2008). However, frequency domain analyses of the T-fMRI responses that selectively omit the task-frequency band show relatively better voxel-level correlations between the hypercapnic (BH) responses and T-fMRI responses in selected low frequency bands (e.g., 0.04 Hz) compared to higher frequency bands (e.g., 0.3 Hz; Biswal et al., 2007). Thus we hypothesized that that low and high frequency RSFA would also have a relatively different contribution from vascular related signals. In order to test if RSFA in the lower and higher bandwidths would distinctly relate to T-fMRI responses, we explored the relationship between the low (<0.1 Hz) and high frequency (0.1–0.25 Hz) RSFA after filtering the R-fMRI BOLD time series. The voxel-level relationship between the low and high frequency RSFA with T-fMRI responses are shown in Figures 4A,B for a typical subject and Table 1 for all subjects. A significantly higher linear correlation was observed between low frequency RSFA vs T-fMRI responses (Figure 4A; Table 1; P < 0.004) than high frequency RSFA vs T-fMRI responses (Figure 4B; Table 1). We have earlier observed strong correlations between hypercapnic (BH) responses and RSFA in its full bandwidth (Kannurpatti and Biswal, 2008; also apparent in the results in this study; Figure 3). In order to ascertain which band of RSFA had a higher vascular component, we obtained the relationship between BH and RSFA at both lower and higher frequencies. The linear correlation of BH vs low frequency RSFA was significantly stronger than BH vs high frequency RSFA (Figures 4C,D; Table 1; P < 0.02). Additionally, the linear relationship of RSFA vs motor responses was not significantly different than RSFA vs BH (Table 1). These results along with previous RSFC studies correlating spontaneous neural activity strongly indicate that low frequency RSFA not only contains a strong neural component but also a considerable non-neural (vascular) component.
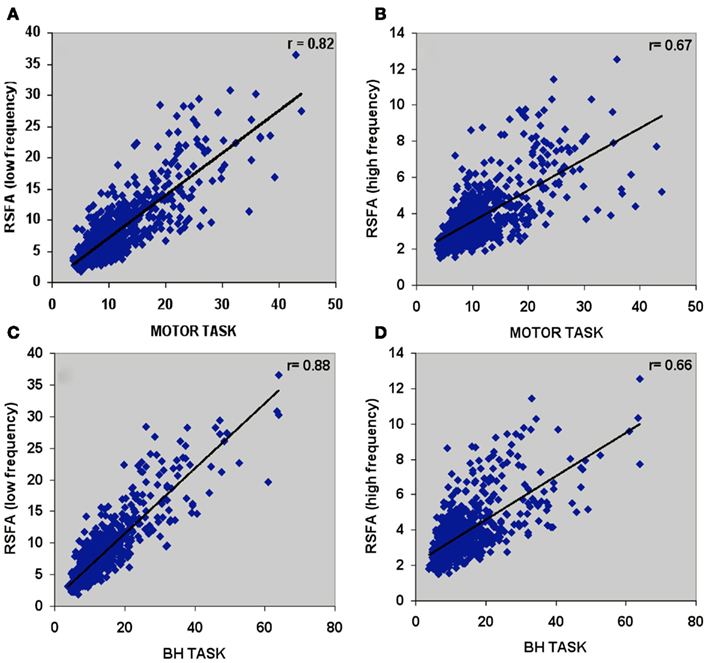
Figure 4. Voxel-wise relationship between R-fMRI, T-fMRI, and hypercapnic (BH) responses in a typical subject. (A) Low frequency RSFA vs motor task (r = 0.82; P < 10−8), (B) high frequency RSFA vs motor task (r = 0.67; P < 10−8), (C) low frequency RSFA vs BH (r = 0.88; P < 10−8), and (D) high frequency RSFA vs BH (r = 0.66; P < 10−8).
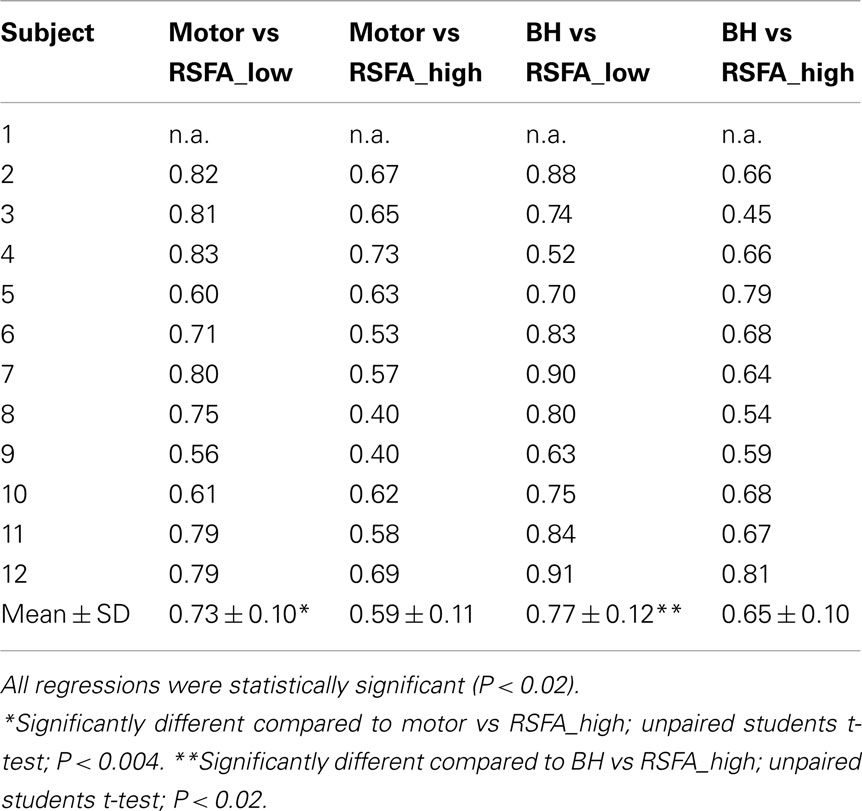
Table 1. Correlation coefficient values after linear regression of the task-induced BOLD signal amplitude with low and high frequency RSFA in 12 healthy subjects.
Subject-Level Relationships between R-fMRI, T-fMRI, and Hypercapnic (BH) Responses
Subject-wise linear relationships between T-fMRI responses and hypercapnia induced by breathing CO2 has been observed in younger humans (Liau and Liu, 2009). We explored the subject-wise relationship within our study design that included the R-fMRI response. Subject averaged motor-task related response was regressed with hypercapnic (BH), low, and high frequency RSFA. T-fMRI vs BH had a high linear correlation (Figure 5A; r = 0.57). However unlike the voxel-level relationship (Figure 4; Table 1), the high frequency RSFA correlated relatively better (r = 0.58; P < 0.04) than low frequency RSFA (r = 0.50; P < 0.05) with the T-fMRI response. Subject-level linear correlations were also observed between the low and high frequency RSFA and with hypercapnic (BH) responses (Figures 6A–C). Further, the subject-level linear relationship between low frequency RSFA and hypercapnic (BH) responses was relatively stronger than high frequency RSFA (Figures 6B,C). This was similar to that observed at the voxel levels (Figures 4C,D).
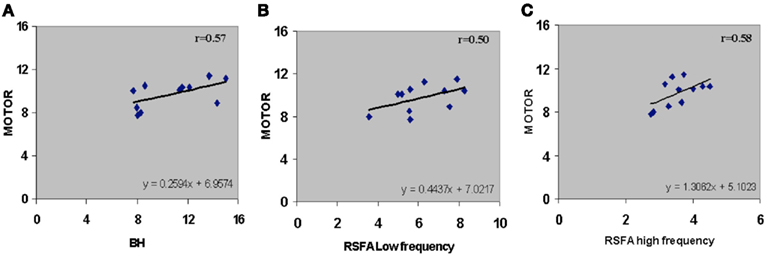
Figure 5. Subject-wise relationship between R-fMRI, T-fMRI and hypercapnic (BH) responses. (A) T-fMRI vs BH (r = 0.57; P < 0.04), (B) T-fMRI vs low frequency RSFA (r = 0.50; P < 0.05), and (C) T-fMRI vs high frequency RSFA (r = 0.58; P < 0.04). A strong linear relationship was observed from the voxel-averaged BOLD signals at the subject level. The relationships shown in (B) and (C) were subsequently used to predict T-fMRI responses from a second group of subjects scanned at a different site.
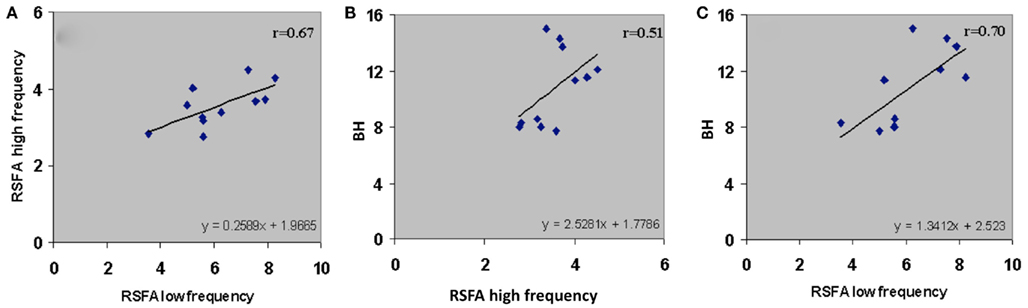
Figure 6. Subject-wise relationship of the low and high frequency components of RSFA between themselves and BH. (A) High frequency RSFA vs low frequency RSFA (r = 0.67; P < 0.02), (B) BH vs high frequency RSFA (r = 0.51; P < 0.05), and (C) BH vs low frequency RSFA (r = 0.70; P < 0.01). A strong linear relationship was observed from the voxel-averaged BOLD signals at the subject level. The relationship indicates a significantly higher vascular component in the low frequency RSFA compared to high frequency RSFA.
Prediction of T-fMRI Responses at the Voxel Level Using the R–T Relationship
The R–T relationship was used to predict T-fMRI responses spread over voxels within the motor-task activated ROI in a randomly selected subject. The predicted and measured BOLD response in the activated region was used to compute the prediction error for every voxel within the ROI. Both low and high frequency RSFA predicted T-fMRI responses in about 25% of the active voxels with an accuracy of 90% and about 50% of the active voxels with an accuracy of 75% over all subjects tested from the first group of 12 subjects (Figure 7). High frequency RSFA however had a relatively better predictive power than low frequency RSFA accurately predicting T-fMRI responses in a significantly higher number of voxels (P < 0.02 and P < 0.001; paired t-test; Figure 7). The R–T relationships derived at the subject level, though robust in predicting voxel-level T-fMRI responses in at least a quarter of the activated ROI, deviated in the majority of activated voxels. This result suggests that there exists substantial variation in the T-fMRI and R-fMRI signal relationships across voxels. In other words, the R–T relationship observed at the subject level is made up of several unique voxel-wise R–T dependencies that considerably vary among themselves within the task activated ROI.
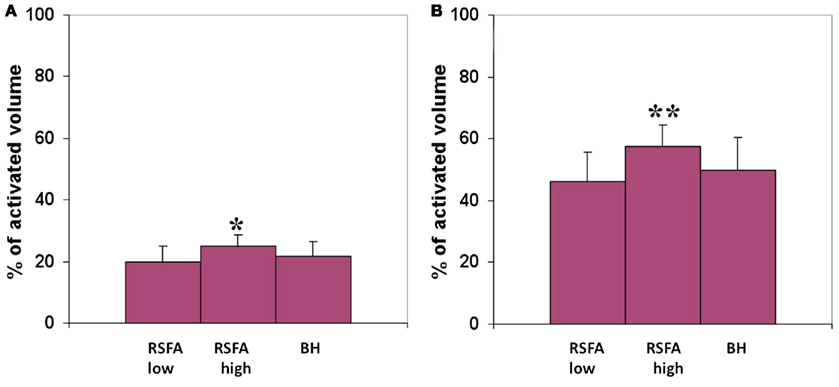
Figure 7. Predicted volume of the motor-task activated ROI with an accuracy of (A) 90% and above, (B) 75% and above. T-fMRI responses across voxels were predicted using the subject-wise R–T relationship in the low and high frequency RSFA derived from the first group of subjects. *Significantly different with respect to low frequency RSFA; paired t-test, P < 0.02. **Significantly different with respect to high frequency RSFA; paired t-test, P < 0.001.
Prediction of the T-fMRI Response in any Subject Using the Subject-Level R–T Relationship
The R–T relationship may have practical significance in determining task-related BOLD activity in scenarios where only R-fMRI data is available. These situations can arise in clinical populations such as comatose patients and other special populations unable to perform motor or cognitive tasks in order to obtain T-fMRI responses. In a different cohort of seven healthy subjects (scanned at a different site), T-fMRI responses were predicted from the R–T relationship determined from the first group of subjects for both RSFA frequencies (shown in Figures 5B,C). The predicted and estimated responses were compared to determine the prediction error. Table 2 shows the measured and predicted response for T-fMRI along with the measured low and high frequency RSFA. Over all subjects within the second group, T-fMRI BOLD responses could be predicted with a mean error of 7% using high frequency RSFA and 20% using low frequency RSFA.
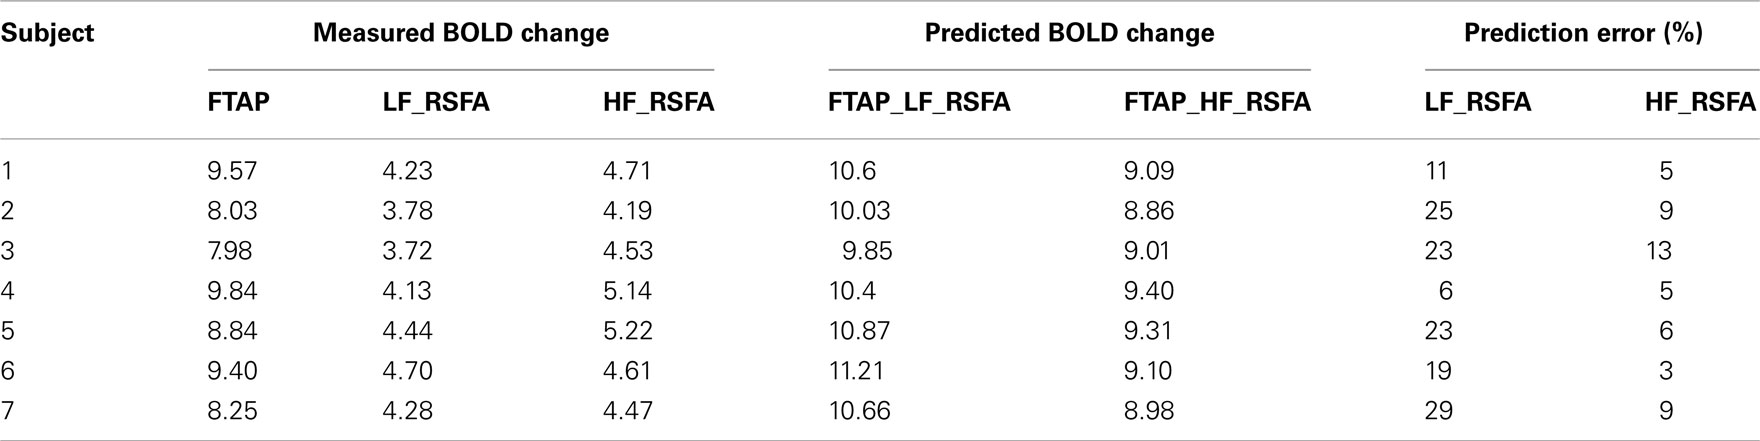
Table 2. Prediction of task-induced response from the BH and RSFA signals in the second group of healthy subjects.
Discussion
Linearity of R-fMRI and T-fMRI with hypercapnia has been demonstrated by different groups, using a variety of study designs. This led us to hypothesize that R-fMRI and T-fMRI signals are governed by a common physiological mechanism and that R-fMRI responses should be linearly related to T-fMRI responses. We tested the hypothesis by measuring the T-fMRI, R-fMRI, and hypercapnic (BH) responses obtained from the same scan session. We determined a linear relationship between the resting-state and task-induced responses at both voxel and subject-levels which we defined as the (R–T) relationship. With potential practical use of the R–T relationship to predict T-fMRI responses in patients unable to perform tasks, robustness of the subject-level R–T relationship was tested for its ability to predict T-fMRI responses in a second group of subjects scanned at a different site.
Earlier Contexts of T-fMRI and Hypercapnic (BH) Relationships
Functional magnetic resonance imaging-BOLD contrast change during brain activation is a convolution of neural and vascular components. The neural component of T-fMRI responses receives its strongest contribution from voxels representing microvascular structures (arterioles, capillaries, etc.) whereas the vascular component receives a stronger contribution from voxels representing venous structures and draining veins within the brain. Because BOLD contrast change depends on the vessel caliber with larger weighting for bigger vessels (Boxerman et al., 1995), T-fMRI responses carry with them varying vascular signatures from the respective voxel locations. Linear relationships between T-fMRI and hypercapnia (BH) have been empirically determined from experimental observations in humans (Biswal et al., 2007; Handwerker et al., 2007; Liau and Liu, 2009). Voxel- and subject-wise differences in T-fMRI responses depend on the physical shapes of the underlying vascular structures in addition to local differences in baseline physiological variables such as cerebral blood volume (CBV), cerebral blood flow (CBF), and the extent of vasoreactivity (Biswal et al., 2007; Lu et al., 2010). To account for differences from vascular components within T-fMRI responses, several fMRI research groups have developed hypercapnic scaling methods where the vascular sensitive component can be scaled out at the voxel- or subject-level yielding T-fMRI contrast changes representing the neural component (Biswal et al., 2007, in review; Handwerker et al., 2007; Thomason and Glover, 2008; Liau and Liu, 2009).
Earlier Contexts of R-fMRI and Hypercapnic (BH) Relationships
Vascular contribution within RSFA signal may arise from respiration related BOLD fluctuations that are sensitive to fluctuations in arterial carbon dioxide (Wise et al., 2004; Chang and Glover, 2009) and cardiac fluctuations (Dagli et al., 1999). We have shown that the spectral amplitude of the low frequency resting signal at 0.04 Hz correlates best with BH or CO2 induced BOLD signal change (Biswal et al., 2007). Frequencies in the same range (0.03 Hz) have been related to respiratory variations that have been suggested to improve RSFC maps when regressed out (Birn et al., 2006). Also, the spectral amplitudes of the low frequencies have been shown to be higher near large vessels (Zou et al., 2008) where the BOLD signal weighting is also larger (Boxerman et al., 1995). Recently we determined that the R-fMRI signal amplitude, RSFA, has a robust vascular component which performed comparably with other established hypercapnic scaling variable such as CO2 or BH (Kannurpatti and Biswal, 2008; Kannurpatti et al., 2011). The use of RSFA in lieu of hypercapnic tasks such as breathing CO2 or BH is important since RSFA can be easily obtained from the R-fMRI measures in patients who may not be able to hold their breath or tolerate a gas-mask for extended periods or in special populations such as chronic obstructive pulmonary disease (COPD) patients who cannot be administered CO2 to produce hypercapnic states.
Inter-Relationships between T-fMRI, R-fMRI, and Hypercapnic (BH) for Prediction of T-fMRI
While prior studies have explored the relationships between T-fMRI and hypercapnia or R-fMRI and hypercapnia, the inter-relationships between R-FMRI, T-fMRI, and hypercapnic (BH) responses have not yet been determined within a single systematic study. The present study design allowed the estimation of T-fMRI and R-fMRI and hypercapnic (BH) responses within a single session so that their inter-relationships could be determined. The results indicate that R-fMRI and T-fMRI correlate strongly with hypercapnic (BH) responses reproducing earlier studies determining these relationships. Further, a robust linear relationship between R-fMRI and T-fMRI responses were observed indicating that they arise from similar physiological mechanisms.
We tested the relative vascular make up of the low and high frequency RSFA, the RSFA in the temporal domain (i.e., the BOLD fluctuations) in the low and high frequency bands after low and high pass filtering (cutoff of 0.1 Hz) were regressed with the BH induced BOLD response in every subject. As shown in Figure 6A, there was a high correlation (r = 0.67) between the low and high frequency RSFA themselves. Further, the high frequency RSFA showed a relatively lower correlation with BH than low frequency RSFA at the voxel-level (Figures 4C,D) and subject levels (Figures 6B,C). These results indicate that there were subtle vascular related differences between the two frequency ranges with a relatively larger vascular weighting within the low frequency RSFA. These results are in accordance with earlier observations from our group and others where the low frequency spectral amplitude (LFSA) at 0.04 Hz correlated best with hypercapnic responses induced by BH or breathing CO2 (Biswal et al., 2007) and 0.03 Hz BOLD variations matched with respiratory variations in spontaneously breathing humans (Birn et al., 2006).
Similarly, when low and high frequency RSFAs were regressed with T-fMRI responses, the linear relationship of low frequency RSFA was significantly stronger than high frequency RSFA (Figures 4A,B; Table 1). This maybe due to the relatively greater vascular sensitivity of low frequency RSFA compared to high frequency RSFA.
As the subjects were instructed to close their eyes and stay relaxed during the resting-state scans, it is unlikely that any residual stimulus may have significantly modulated the low frequency resting-state signals within the motor cortices (Logothetis et al., 2009). As determined by the strength of the relationships, the subject level, task-induced response could be predicted in a different cohort of subjects with an average accuracy of 7% using high frequency RSFA and 20% using low frequency RSFA (Table 2). The robust predictive power with selective use of appropriate frequency bands within RSFA indicates the feasibility to predict T-fMRI responses in subjects or selective regions in task non-compliant populations.
Baseline Neural Modulations and their Effects on the Prediction
Despite robust prediction accuracy at the subject-level, voxel-level RSFA could predict BOLD response in about 25% of the active voxels at 90% accuracy and about 50% of the active voxels with 75% accuracy (Figure 7). The decrease in prediction accuracy across many voxels may arise from several factors:
(i) The R–T relationship may vary across voxels and regions of the brain and the linear model derived from the voxel average may lose its accuracy within many voxels.
The baseline neural activity defines the state of any voxel’s R-fMRI fluctuation. Further, baseline neural activity state can also modulate the outcome of the T-fMRI response (Maandag et al., 2007). Thus neural modulations may dynamically perturb the R–T relationship within certain voxels to significant levels affecting prediction accuracy.
(ii) Global baseline neural activity contributing to global BOLD fluctuations in a significant manner (Schölvinck et al., 2010), leads to the R–T relationship diversity within voxels.
The presence of robust correlations of the amplitudes at the voxel and subject levels have been repeatedly demonstrated (including the present results) that do not normalize the resting-state signals with the global mean (Biswal et al., 2007; Kannurpatti and Biswal, 2008). Thus normalizing the R-fMRI signals with the global mean would not only eliminate essential neural components (Hyder and Rothman, 2010), but also eliminate the diversity of the neural component across voxels that may make the amplitude correlations robust. For example in a recent study of young adult humans that normalized the R-fMRI signals with the global mean, a low subject-level correlation was observed between the amplitude of the R-fMRI and T-fMRI signals in the visual cortex as opposed to a strong correlation between the coherence of the resting-state signal and amplitude of the task-induced response (Liu et al., 2011). But coherence of the R-fMRI signals and their correlation with T-fMRI responses in voxels do not seem to be significantly affected after normalization with the global mean of the R-fMRI signal (Mennes et al., 2010; Liu et al., 2011). Thus the amplitudes might be more sensitive to normalization with the global mean than the temporal characteristics of the R-fMRI signal. While further work is needed to quantitatively ascertain the effects of pre-processing on RSFA amplitudes within stringent experimental designs (Logothetis et al., 2009), the effects of pre-processing by different studies suggests that the R–T relationship may naturally vary across different voxels and brain regions and that the low prediction for amplitude across voxels may not be a surprise. Our results suggest that the amplitude diversity of the R-fMRI signals across voxels are conserved in the absence of normalization with the global mean signal that may contribute to the robust R–T relationship.
(iii) Analysis of fluctuations and changes in signals from an arbitrary baseline as opposed to a calibrated approach.
Despite confounds of the modulatory effects of anesthesia (Logothetis et al., 2009), results from animal models indicate resting-state fluctuations maybe governed by neural activity at multiple frequency ranges (Lu et al., 2007; Shmuel and Leopold, 2008) and physiological states (Kannurpatti et al., 2008). Because the baseline state is subtracted from the mean task-evoked signal (thus removing a large component of baseline activity) to identify suprathreshold task-related voxels, the baseline state might have played a modulatory role in defining the outcome of the T-fMRI response. Such modulation might not be accurately captured by analyzing signal changes either through the fluctuation of amplitudes or differencing the pre-stimulus baseline and task-induced signal levels. Calibrated fMRI (Davis et al., 1998; Hoge et al., 1999) in this point of view takes into account the baseline activity. Calibrated fMRI in animal models indicates a linear dependence of neuronal activity with hyperemic components including BOLD, CBV, and CBF (Sanganahalli et al., 2009). Neuronal activity during an evoked task reaches the same level irrespective of the baseline and is reliably predicted by the percent change in CMRO2 (Hyder and Rothman, 2011). In other words, the difference in neuronal activity and hence ΔCMRO2 will be larger or smaller for the same task depending on the baseline-state level (Pasley et al., 2007). This baseline-state dependence might be overlooked by the present approach because it considers only the fluctuation of amplitudes and not the total baseline activity within the ROI. However, based on calibrated fMRI experiments, a 1% resting-state BOLD variation corresponds approximately to 10% variation in CMRO2 from the baseline (Hoge and Pike, 2001). While baseline differences might have a negligible impact on the fluctuations in normal humans, the consideration of only fluctuations from an arbitrary baseline probably could affect prediction.
In summary, the present empirical results demonstrated a linear relationship between R-fMRI and T-fMRI responses in spontaneously breathing humans at the voxel- and subject levels. R-fMRI amplitudes reliably predicted T-fMRI responses at individual-subject and voxel levels. The predictive power of R-fMRI with selective use of appropriate frequency bands within RSFA demonstrates the feasibility of estimating T-fMRI responses in selected regions in task non-compliant populations. The results also demonstrate that each voxel and brain region may be characterized by a unique R–T relationship depending on the modulatory role of the resting state on the evoked task response.
Conflict of Interest Statement
The authors declare that the research was conducted in the absence of any commercial or financial relationships that could be construed as a potential conflict of interest.
Acknowledgments
This study was supported by National Institute of Health through grants NS049176-01A2 (Bharat B. Biswal), AG029523-02 (Bart Rypma), and American Heart Association grant 0930132N (Sridhar S. Kannurpatti).
References
Bandettini, P. A., Jesmanowicz, A., Wong, E. C., and Hyde, J. S. (1993). Processing strategies for the time-course data sets in fMRI of the human brain. Magn. Reson. Med. 30, 161–173.
Birn, R. M., Diamond, J. B., Smith, M. A., and Bandettini, P. A. (2006). Separating respiratory-variation-related fluctuations from neuronal-activity-related fluctuations in fMRI. Neuroimage 31, 1536–1548.
Biswal, B., Yetkin, F. Z., Haughton, V. M., and Hyde, J. S. (1995). Functional connectivity in the motor cortex of resting human brain using echo-planar MRI. Magn. Reson. Med. 34, 537–541.
Biswal, B. B., Eldreth, D. A., Motes, M. A., and Rypma, B. (2010). Task-dependent individual differences in prefrontal connectivity. Cereb. Cortex 20, 2188–2197.
Biswal, B. B., Kannurpatti, S. S., and Rypma, B. (2007). Hemodynamic scaling of fMRI-BOLD signal: validation of low-frequency spectral amplitude as a scalability factor. Magn. Reson. Imaging 25, 1358–1369.
Boxerman, J. L., Bandettini, P. A., Kwong, K. K., Baker, J. R., Davis, T. L., Rosen, B. R., and Weisskoff, R. M. (1995). The intravascular contribution to fMRI signal change: Monte Carlo modeling and diffusion-weighted studies in vivo. Magn. Reson. Med. 34, 4–10.
Chang, C., and Glover, G. H. (2009). Relationship between respiration, end-tidal CO2, and BOLD signals in resting-state fMRI. Neuroimage 47, 1381–1393.
Cordes, D., Haughton, V. M., Arfanakis, K., Wendt, G. J., Turski, P. A., Moritz, C. H., Quigley, M. A., and Meyerand, M. E. (2000). Mapping functionally related regions of brain with functional connectivity MR imaging. AJNR Am. J. Neuroradiol. 21, 1636–1644.
Cox, R. W. (1996). AFNI: software for analysis and visualization of functional magnetic resonance neuroimages. Comput. Biomed. Res. 29, 162–173.
Dagli, M. S., Ingeholm, J. E., and Haxby, J. V. (1999). Localization of cardiac-induced signal change in fMRI. Neuroimage 9, 407–415.
Damoiseaux, J. S., Rombouts, S. A., Barkhof, F., Scheltens, P., Stam, C. J., Smith, S. M., and Beckmann, C. F. (2006). Consistent resting-state networks across healthy subjects. Proc. Natl. Acad. Sci. U.S.A. 103, 13848–13853.
Davis, T., Kwong, K., Weisskoff, R., and Rosen, B. R. (1998). Calibrated functional MRI: mapping the dynamics of oxidative metabolism. Proc. Natl. Acad. Sci. U.S.A. 95, 1834–1839.
Fox, M. D., Snyder, A. Z., Vincent, J. L., Corbetta, M., Van Essen, D. C., and Raichle, M. E. (2005). The human brain is intrinsically organized into dynamic, anticorrelated functional networks. Proc. Natl. Acad. Sci. U.S.A. 102, 9673–9678.
Fox, M. D., and Raichle, M. E. (2007). Spontaneous fluctuations in brain activity observed with functional magnetic resonance imaging. Nat. Rev. Neurosci. 8, 700–711.
Greicius, M. D., Srivastava, G., Reiss, A. L., and Menon, V. (2004). Default-mode network activity distinguishes Alzheimer’s disease from healthy aging: evidence from functional MRI. Proc. Natl. Acad. Sci. U.S.A. 101, 4637–4642.
Handwerker, D. A., Gazzaley, A., Inglis, B. A., and D’Esposito, M. (2007). Reducing vascular variability of fMRI data across aging populations using a breathholding task. Hum. Brain Mapp. 28, 846–859.
Hoge, R. D., Atkinson, J., Gill, B., Crelier, G. R., Marrett, S., and Pike, G. B. (1999). Investigation of BOLD signal dependence on cerebral blood flow and oxygen consumption: the deoxyhemoglobin dilution model. Magn. Reson. Med. 42, 849–863.
Hoge, R. D., and Pike, G. B. (2001). Oxidative metabolism and the detection of neuronal activation via imaging. J. Chem. Neuroanat. 22, 43–52.
Hyder, F., and Rothman, D. L. (2010). Neuronal correlate of BOLD signal fluctuations at rest: err on the side of the baseline. Proc. Natl. Acad. Sci. U.S.A. 107, 10773–10774.
Hyder, F., and Rothman, D. L. (2011). Evidence for the importance of measuring total brain activity in neuroimaging. Proc. Natl. Acad. Sci. U.S.A. 108, 5475–5476.
Jiang, A., Kennedy, D. N., Baker, J. R., Weisskoff, R. M., Tootell, R. B. H., Woods, R. P., Benson, R. R., Kwong, K. K., Brady, T. J., Rosen, B. R., and Belliveau, J. W. (1995). Motion detection and correction in functional MR imaging. Hum. Brain Mapp. 3, 224–235.
Jo, H. J., Saad, Z. S., Simmons, W. K., Milbury, L. A., and Cox, R. W. (2010). Mapping sources of correlation in resting state FMRI, with artifact detection and removal. Neuroimage 52, 571–582.
Kannurpatti, S. S., and Biswal, B. B. (2008). Detection and scaling of task-induced fMRI-BOLD response using resting state fluctuations. Neuroimage 40, 1567–1574.
Kannurpatti, S. S., Biswal, B. B., and Hudetz, A. G. (2002). Differential fMRI-BOLD signal response to apnea in humans and anesthetized rats. Magn. Reson. Med. 47, 864–870.
Kannurpatti, S. S., Biswal, B. B., Kim, Y. R., and Rosen, B. R. (2008). Spatio-temporal characteristics of low-frequency BOLD signal fluctuations in isoflurane-anesthetized rat brain. Neuroimage 40, 1738–1747.
Kannurpatti, S. S., Motes, M. A., Rypma, B., and Biswal, B. B. (2011). Increasing measurement accuracy of age-related BOLD signal change: minimizing vascular contributions by resting-state-fluctuation-of-amplitude scaling. Hum. Brain Mapp. 32, 1125–1140.
Liau, J., and Liu, T. T. (2009). Inter-subject variability in hypercapnic normalization of the BOLD fMRI response. Neuroimage 45, 420–430.
Liu, X., Zhu, X. H., and Chen, W. (2011). Baseline BOLD correlation predicts individuals’ stimulus-evoked BOLD responses. Neuroimage 54, 2278–2286.
Logothetis, N. K., Murayama, Y., Augath, M., Steffen, T., Werner, J., and Oeltermann, A. (2009). How not to study spontaneous activity. Neuroimage 45, 1080–1089.
Lowe, M. J., Mock, B. J., and Sorenson, J. A. (1998). Functional connectivity in single and multislice echoplanar imaging using resting-state fluctuations. Neuroimage 7, 119–132.
Lu, H., Yezhuvath, U. S., and Xiao, G. (2010). Improving fMRI sensitivity by normalization of basal physiologic state. Hum. Brain Mapp. 31, 80–87.
Lu, H., Zuo, Y., Gu, H., Waltz, J. A., Zhan, W., Scholl, C. A., Rea, W., Yang, Y., and Stein, E. A. (2007). Synchronized delta oscillations correlate with the resting-state functional MRI signal. Proc. Natl. Acad. Sci. U.S.A. 104, 18265–18269.
Maandag, N. J., Coman, D., Sanganahalli, B. G., Herman, P., Smith, A. J., Blumenfeld, H., Shulman, R. G., and Hyder, F. (2007). Energetics of neuronal signaling and fMRI activity. Proc. Natl. Acad. Sci. U.S.A. 104, 20546–20551.
Mennes, M., Kelly, C., Zuo, X. N., Martino, A. D., Biswal, B., Castellanos, F. X., and Milham, M. P. (2010). Inter-individual differences in resting state functional connectivity predict task-induced BOLD activity. Neuroimage 50, 1690–1701.
Pasley, B. N., Inglis, B. A., and Freeman, R. D. (2007). Analysis of oxygen metabolism implies a neural origin for the negative BOLD response in human visual cortex. Neuroimage 36, 269–276.
Raichle, M. E., MacLeod, A. M., Snyder, A. Z., Powers, W. J., Gusnard, D. A., and Shulman, G. L. (2001). A default mode of brain function. Proc. Natl. Acad. Sci. U.S.A. 98, 676–682.
Roy, A. K., Shehzad, Z., Margulies, D. S., Kelly, A. M., Uddin, L. Q., Gotimer, K., Biswal, B. B., Castellanos, F. X., and Milham, M. P. (2009). Functional connectivity of the human amygdala using resting state fMRI. Neuroimage 45, 614–626.
Sanganahalli, B. G., Herman, P., Blumenfeld, H., and Hyder, F. (2009). Oxidative neuroenergetics in event-related paradigms. J. Neurosci. 29, 1707–1718.
Schölvinck, M. L., Maier, A., Ye, F. Q., Duyn, J. H., and Leopold, D. A. (2010). Neural basis of global resting-state fMRI activity. Proc. Natl. Acad. Sci. U.S.A. 107, 10238–10243.
Shmuel, A., and Leopold, D. A. (2008). Neuronal correlates of spontaneous fluctuations in fMRI signals in monkey visual cortex: implications for functional connectivity at rest. Hum. Brain Mapp. 29, 751–761.
Talairach, J., and Tournoux, P. (1998). Co-planar Stereotaxic Atlas of the Human Brain. New York: Theime Medical.
Thomason, M. E., and Glover, G. H. (2008). Controlled inspiration depth reduces variance in breath-holding-induced BOLD signal. Neuroimage 39, 206–214.
Wise, R. G., Ide, K., Poulin, M. J., and Tracey, I. (2004). Resting fluctuations in arterial carbon dioxide induce significant low frequency variations in BOLD signal. Neuroimage 16, 52–64.
Zang, Y. F., He, Y., Zhu, C. Z., Cao, Q. J., Sui, M. Q., Liang, M., Tian, L. X., Jiang, T. Z., and Wang, Y. F. (2007). Altered baseline brain activity in children with ADHD revealed by resting-state functional MRI. Brain Dev. 29, 83–91.
Keywords: breath hold, resting-state fluctuations, BOLD, fMRI, hypercapnia, motor cortex, prediction, vascular
Citation: Kannurpatti SS, Rypma B and Biswal BB (2012) Prediction of task-related BOLD fMRI with amplitude signatures of resting-state fMRI. Front. Syst. Neurosci. 6:7. doi: 10.3389/fnsys.2012.00007
Received: 07 November 2011; Paper pending published: 04 December 2011;
Accepted: 04 February 2012; Published online: 06 March 2012.
Edited by:
Robert Turner, Max Planck Institute for Human Cognitive and Brain Sciences, GermanyReviewed by:
Stefano Panzeri, Italian Institute of Technology, ItalyFahmeed Hyder, Yale University, USA
Copyright: © 2012 Kannurpatti, Rypma and Biswal. This is an open-access article distributed under the terms of the Creative Commons Attribution Non Commercial License, which permits non-commercial use, distribution, and reproduction in other forums, provided the original authors and source are credited.
*Correspondence: Bharat B. Biswal, Department of Radiology, New Jersey Medical School, University of Medicine and Dentistry of New Jersey, ADMC Building 5, Suite 575, 30 Bergen Street, Newark, NJ 07103, USA. e-mail: bbiswal@yahoo.com