 John A. Haley1
 Erica Ullman
 John D. Haley
- 1Department of Biomedical Sciences, LIU Post, Brookville, NY, USA
- 2Regeneron Pharmaceuticals Inc., Tarrytown, NY, USA
- 3Infectious Disease Division, Memorial Sloan Kettering Cancer Center, New York, NY, USA
- 4Department of Pathology, Cancer Center, Stony Brook School of Medicine, Stony Brook, NY, USA
Background: The capacity of cancer cells to undergo epithelial mesenchymal trans-differentiation has been implicated as a factor driving metastasis, through the acquisition of enhanced migratory/invasive cell programs and the engagement of anti-apoptotic mechanisms promoting drug and radiation resistance. Our aim was to define molecular signaling changes associated with mesenchymal trans-differentiation in two KRas mutant NSCLC models. We focused on central transcription and epigenetic regulators predicted to be important for mesenchymal cell survival.
Experimental design: We have modeled trans-differentiation and cancer stemness in inducible isogenic mutant-KRas H358 and A549 non-small cell lung cell backgrounds. As expected, our models show mesenchymal-like tumor cells acquire novel mechanisms of cellular signaling not apparent in their epithelial counterparts. We employed large-scale quantitative phosphoproteomic, proteomic, protein–protein interaction, RNA-Seq, and network function prediction approaches to dissect the molecular events associated with the establishment and maintenance of the mesenchymal state.
Results: Gene-set enrichment and pathway prediction indicated BMI1, KDM5B, RUNX2, MYC/MAX, NFκB, LEF1, and HIF1 target networks were significantly enriched in the trans-differentiation of H358 and A549 NSCLC models. Physical overlaps between multiple networks implicate NR4A1 as an overlapping control between TCF and NFκB pathways. Enrichment correlations also indicated marked decrease in cell cycling, which occurred early in the EMT process. RNA abundance time course studies also indicated early expression of epigenetic and chromatin regulators within 8–24 h, including CITED4, RUNX3, CMBX1, and SIRT4.
Conclusion: Multiple transcription and epigenetic pathways where altered between epithelial and mesenchymal tumor cell states, notably the polycomb repressive complex-1, HP1γ, and BAF/Swi-Snf. Network analysis suggests redundancy in the activation and inhibition of pathway regulators, notably factors controlling epithelial cell state. Through large-scale transcriptional and epigenetic cell reprograming, mesenchymal trans-differentiation can promote diversification of signaling networks potentially important in resistance to cancer therapies.
Introduction
Cellular plasticity in epithelial cancers is associated with a progression to a metastatic state (1, 2) and resistance to anti-cancer therapies (3, 4). Over 90% of cancer patient deaths are attributable to complications arising from metastatic dissemination of cancer cells to distant organ sites. Tumor plasticity associated with epithelial mesenchymal transition (EMT) (5, 6) contributes to metastasis, drug resistance and is correlated with poor prognosis (7, 8). The epigenetic reprograming associated with EMT promotes the disassembly of epithelial cell-junctions, a loss of epithelial polarity (4, 9), and the formation of molecular assemblies allowing cell migration and invasion (10). In multiple model systems, EMT-derived mesenchymal cells can show the properties of cancer stem cells including tumor initiation at low cell inoculation in vivo, sphere formation in vitro, and CD44high, CD24low, and ALDH1active pluripotent stem cell markers (11, 12). Despite advances in the treatment of non-small cell lung cancers (NSCLC), for example, the development of EGFR tyrosine kinase inhibitors (EGFR TKIs) for patients with activating EGFR mutations, survival rates for patients with mutant-KRas lung cancer are poor. Mutant-KRas is observed in ~20% of NSCLC cases and is generally independent of EGFR mutations (13). In a recent clinical study, the median survival time of patients treated with standard of care was 7.7 months in NSCLC patients with mutant-KRas, in marked contrast to 38 months in patients with mutant EGFR (14). Several studies suggest tumor cells harboring mutant-KRas may be primed to undergo epithelial mesenchymal trans-differentiation, for example (15, 16). These mesenchymal-like carcinoma cells have been shown to be resistant to many conventional lung cancer therapies, including taxanes, pemetrexed, gemcitabine, and EGFR TKIs (8, 12, 17). Chemotherapy has been shown to promote selection for EMT-derived cells in a number of solid tumor types (7, 17, 18) and conversely markers of EMT appears to contribute to chemotherapy resistance (19) and predict response to EGFR and PI3K inhibitors (20). Similar data show EMT-derived cells can serve as reservoirs for cancer recurrence in relevant genetically engineered models (21, 22). Therapies are needed that specifically target drug resistant mesenchymal-like tumor cells. However, survival signaling networks in EMT–derived cells appear heterogeneous and critical dependencies common to mesenchymal tumor cells remain ill defined. Current inhibitors of mesenchymal stem-like tumor cells have been largely restricted to specific tumor and driver types, for example, JAK or PDGFR inhibitors. Since mesenchymal trans-differentiation involves an epigenetic reprograming, the pharmacological use of epigenetic modulators would appear attractive. However, initial therapeutic successes with single agent DNA methyltransferase inhibitors, HDAC inhibitors, and EZH2 inhibitors have been more pronounced in the hematologic malignancies, as opposed to epithelial-derived carcinomas, which can undergo EMT.
In order to understand and identify transcriptional and epigenetic networks in a mutant-KRas mesenchymal cell context, we have modeled metastable reversible EMT in two NSCLC cell backgrounds. “Metastable” refers to a reversible EMT, achieved for example by withdrawal of inducer (23), where in intermediate stages cells can express both epithelial and mesenchymal markers (24). Here, we compared CD44low A549 cells with isogenic CD44high A549/transforming growth factor beta (TGFβ) cells and CDH1/E-cadherinhigh H358 cells with isogenic CDH1low H358/dox-TGFβ cells. As expected both models reversibly undergo EMT and are less responsive to paclitaxel, gemcitabine, and erlotinib in the mesenchymal state (data not shown). These models confirm the clinical observations and show that tumor cells that have undergone EMT show increased resistance to standard of care cancer treatments. Importantly, upon undergoing EMT tumor cells acquire novel mechanisms of cellular signaling and resistance to apoptosis not apparent in their epithelial counterparts.
We sought to define at signaling network changes distinguishing epithelial and mesenchymal tumor states, with an aim of identifying key nodes important in mesenchymal cell survival. Pharmacological blockade of mesenchymal survival pathways may overcome a limitation of current therapies, which preferentially impact tumor cells with an epithelial phenotype (17). We used a combination of RNA-Seq, phosphoproteomic, and bioinformatics approaches to identify transcriptional and epigenetic networks modulated as a consequence of epithelial mesenchymal transition (EMT). We employed TGFβ to induce EMT in the A549 and H358 NSCLC models, where cells were preselected for a starting epithelial state. TGFβ is a physiologically relevant inducer of EMT (25) associated with a macrophage/monocyte rich inflammatory microenvironment (26). Detailed RNA, protein, and phosphopeptide abundance datasets were obtained. Using pathway prediction and gene-set enrichment approaches, and protein–protein interaction data we observed altered regulation of transcriptional, epigenetic, and chromatin modulators and explored intersections between key pathways.
Materials and Methods
Cell Culture Conditions
Parental H358 and A549 cells were obtained from the ATCC and maintained in RPMI 1640 containing 10% FCS. Both H358 and A549 are related adenocarcinoma NSCLC lines, where both express an activated KRas oncogene, with mutations at G12C and G12S, respectively. H358 cells harbor pathogenic mutations in CTNNB1, KRAS, LIMK1, MAX, MED12, MSH3, PML, RNF212, RUNX2, SATB2, SF3B1, SGK3, TP63, and USP2. A549 adenocarcinoma NSCLC cells harbor pathogenic mutations in DCLK3, FRMD6, KEAP1, KRAS, PTPN21, and TCEA2 (27). Both cell lines undergo EMT in response to TGFβ. All cells were kept at 37°C with 5% CO2. The TGFβ inducible variant of H358 and its dox-vector control line were both engineered from a single H358 cell clone with marker expression CDH1high and epithelial cell-junctions. Multiple H358-dox-TGFβ cell lines were isolated (23, 24) using the doxycycline inducible CMV promoter (pTRE2puro; invitrogen.com) using the two vector TET repressor/TET activator system (ptTS, prTA; blaR) based on Ref. (28). H358-dox-TGFβ clones were maintained in RPMI 1640, 10% tetracycline-free FCS (clontech.com), L-glutamine (1 mM), sodium pyruvate (1 mM), D-glucose (4.5 g/l), 10 mM HEPES, blasticidin (10 μg/ml), and doxycycline (0.5 μg/ml). Doxycycline (0.5 μg/ml) induction of transgene expression was verified by immunoblot and was shown to correctly modulate EMT marker expression (Figure S1 in Supplementary Material). Inducible RNA expression (log2 FC = 4.6) is shown in Table S1 in Supplementary Material. Parental A549 cells were anti-CD44 antibody selected using magnetic beads into a CD44low starting epithelial population, which was subsequently induced with TGFβ (10 ng/ml) to yield a uniformly mesenchymal cell population after 7 days.
RNA-Seq
Duplicate cell samples (~3 × 10⁶ cells) were lyzed in 600 μl Qiagen RLT buffer, 1% β-mercaptoethanol, followed by column isolation (qiagen.com). RNA isolation, library construction, and RNA-Seq essentially followed Illumina protocols (illumina.com). cDNA was prepared from total RNA with globin RNA reduction, followed by library generation (Illumina True Seq). cDNA libraries were immobilized (Illumina, Standard Cluster Generation Kit) and sequenced on an Illumina HySeq instrument. Read depths for H358 and A549 were 30 million and 25 million, respectively. RNA-Seq was performed on Illumina HySeq instrument1. FASTQ file reads passing Illumina purity filter (PF reads) were aligned and quantitation performed by RSEM (29), generating files where normalized counts for each detected gene and isoform (UCSC Known Gene). Aligned RNAs (27976 genes; 48241 isoforms) passing QC thresholds were used to calculate mesenchymal–epithelial transcript abundance ratios followed by log2 linear scaling. Additional analysis was performed using Cufflinks (30) on BAM files aligned to hg19. For RNA-Seq data were selected where log2 fold change (FC) was ≥1.0 and where rsem reads were >5 in any sample. In difference analysis where either numerators or denominators were equal to zero, values were generated (specified as >5 or <5) in gene lists if differences >10 rsem reads were observed in both H358 and A549 models with concordant log2 signs. Concordance required >2 FC in three out of four samples (Mes-1 and Mes-2 over Epi-ave) for both A549 and H358 cell models.
Preparation of Cell Extracts and Phosphorylation Directed Affinity Chromatography
Essentially, site-specific serine and threonine phosphorylation changes were measured by SILAC labeling of proteins, trypsin digestion, ion-exchange fractionation, and TiO2 affinity selection in the presence of 1 M lactic acid to minimize acidic peptide binding followed by nano LC-MS/MS. Site-specific tyrosine phosphorylation was measured by SILAC labeling, peptide anti-phosphotyrosine selection, and nano LC-MS/MS. Total protein changes were assessed by SILAC labeling, ion-exchange fractionation, and LC-MS/MS.
Approximately 5 × 10⁸ H358 or A549 mesenchymal and epithelial cells were cultured in RPMI 1640 media containing heavy (13C6) arginine and lysine or light (12C) arginine and lysine, respectively [SILAC; (31)]. Cells from five biological replicates were extracted in 8 M urea, 50 mM HEPES, 2.5 mM sodium pyrophosphate, 1 mM β-glycerophosphate, 1 mM sodium orthovanadate, and phosphatase inhibitor cocktails 1 and 2 (1:100 dilution; sigmaaldrich.com). Heavy and light extracts were mixed, sonicated for 2 × 30 s and centrifuged at 10,000 × g. The combined supernatant was subjected to reduction (5 mM tributyl phosphine), alkylation (15 mM iodoacetamide), proteolysis with trypsin, desalting on C18 resin (Sep-Pak C18; waters.com) and lyophilization. Peptides were immunoprecipitated with anti-phosphotyrosine affinity resin essentially as described (32), with C18 cartridge (Opti-Lynx 40 μg C18AQ; optimizetech.com) desalting with a 10 min gradient elution with inline UV absorbance detection at 220 nm using a 250 nl flow cell. Peptides were lyophilized, resuspended in 0.1% formic acid, and analyzed by LC-MS/MS.
Anti-phosphotyrosine flow through peptides were separated by SCX ion-exchange chromatography (SampliQ resin 150 mg; agilent.com) in 10 mM KH2PO4 pH 3.0, 25% acetonitrile step eluted with increasing KCl (20, 40, 60, 80, 100, 125, 150, 200, 350, 500 mM KCl) yielding ten fractions. Samples were desalted by C18 step chromatography (OASIS 60mg C18; waters.com), followed by TiO2 affinity chromatography (10 u beads; glsciences.com) using 3 mg TiO2 beads per fraction in 100 ul 0.1% TFA, 50% acetonitrile (ACN), where 1 M lactic acid was used to suppress non-specific binding. Phosphopeptides were eluted with 50 mM KH2PO4 pH 10.5 (pH adjusted with NH4OH), immediately neutralized with 5% formic acid, 50% acetonitrile, and lyophilized. Peptide fractions were resuspended in 0.1% FA and analyzed by LC-MS/MS. Peptides not binding to TiO2 (flow through fraction) were desalted (OASIS 60 mg C18; waters.com), lyophilized and protein concentration determined by micro BCA assay (piercenet.com). Peptide fractions were resuspended in 2% ACN, 0.1% FA, and analyzed by LC-MS/MS.
Peptide Identification and Quantification by LC-Tandem MS
LC-MS/MS was performed essentially as previously described (33, 34). Two (A549) or three (H358) LC-MS/MS experiments were performed for each fraction (1 fraction for pY, 10 fractions for SCX/TiO2, and 10 fractions for SCX/total peptide). Proteins were identified from survey and product ion spectra data, using the Paragon algorithm of ProteinPilot [v4.0; (35)] and GPM [(36) v2.2.1]. Two missed tryptic cleavages were allowed and posttranslational modifications considered included cysteine derivitization, STY phosphorylation, deamidation, carbamylation, oxidation, and SILAC labels. Database searches used the human UniProt FASTA database (10-2012; 70,391 sequences including common contaminants). When multiple protein isoforms were identified, Protein Pilot allowed only peptides specific to each detected isoform to be used, which factored in ion counts for weighting in the protein ratio calculation (37). Parsimony of protein results was assured by rigorous protein inference with the ProGroup algorithm. Protein identification complied with the guidelines of Bradshaw et al. (38) where two or more unique isoform-specific peptides were required for inclusion. False discovery rates of phosphotyrosine peptide capture experiments were <1%. False positive rates for the high complexity TiO2 and total peptide assignments ranged between 1.4 and 0.8%. For statistical analysis we required four or more peptides with individual peptide assignments at >95% confidence. Phosphopeptide peak areas were normally distributed by log10 + 1 conversion followed by paired t-test. Phosphopeptides sites identified four or more times are listed in Table S2 in Supplementary Material and coordinate changes in phosphopeptide abundance between H358 and A549 models were observed for 73 unique sites are listed in Table S3 in Supplementary Material. Fifty-eight protein abundance changes were coordinately associated with H358 and A549 trans-differentiation, with two or more unique peptides also at 95% peptide ID confidence are listed in Table S4 in Supplementary Material. Co-correlation of overlapping peptides from skipped cleavage and multiple charge states were used to further reduce false discovery rates and correctly bin previously defined benchmark peptides from E-cadherin, vimentin, and fibronectin to their respective epithelial or mesenchymal cell states.
Functional Analysis and Performance Parameters
A schema for the statistical and categorical analysis of protein, phosphopeptide, and RNA transcript data is provided in Figure 1. Changes in the abundance of proteins, phosphopeptides, and RNA transcripts were compared between fractions, experiments, and models where membership within specific signaling networks only was established using two or more independent lines of evidence. Cross-correlation between two independent isogenic KRas models was used to reduce noise and reduce false positives. Proteins, phosphopeptides, and RNA transcripts differentially expressed between EMT-like cell states were grouped by function using literature, gene-set enrichment (GSEA) (v14; broadinstitute.org/gsea), Gene Pattern (v3.8.1; broadinstitute.org/cancer/software/genepattern), DAVID2, and Ingenuity pathway prediction (IPA; ingenuity.com). In the functional illustrations of complexes modulated during EMT, proteins were assembled by protein–protein contacts [BioGrid; thebiogrid.org/ (39); STRING; string-db.org] and further grouped manually by biological systems or “machines.” The function of individual peptide phosphosites was evaluated using PhosphoSite [phosphosite.org; (40)] and published literature. Venn overlaps were calculated using (bioinformatics.psb.ugent.be/webtools/Venn/).
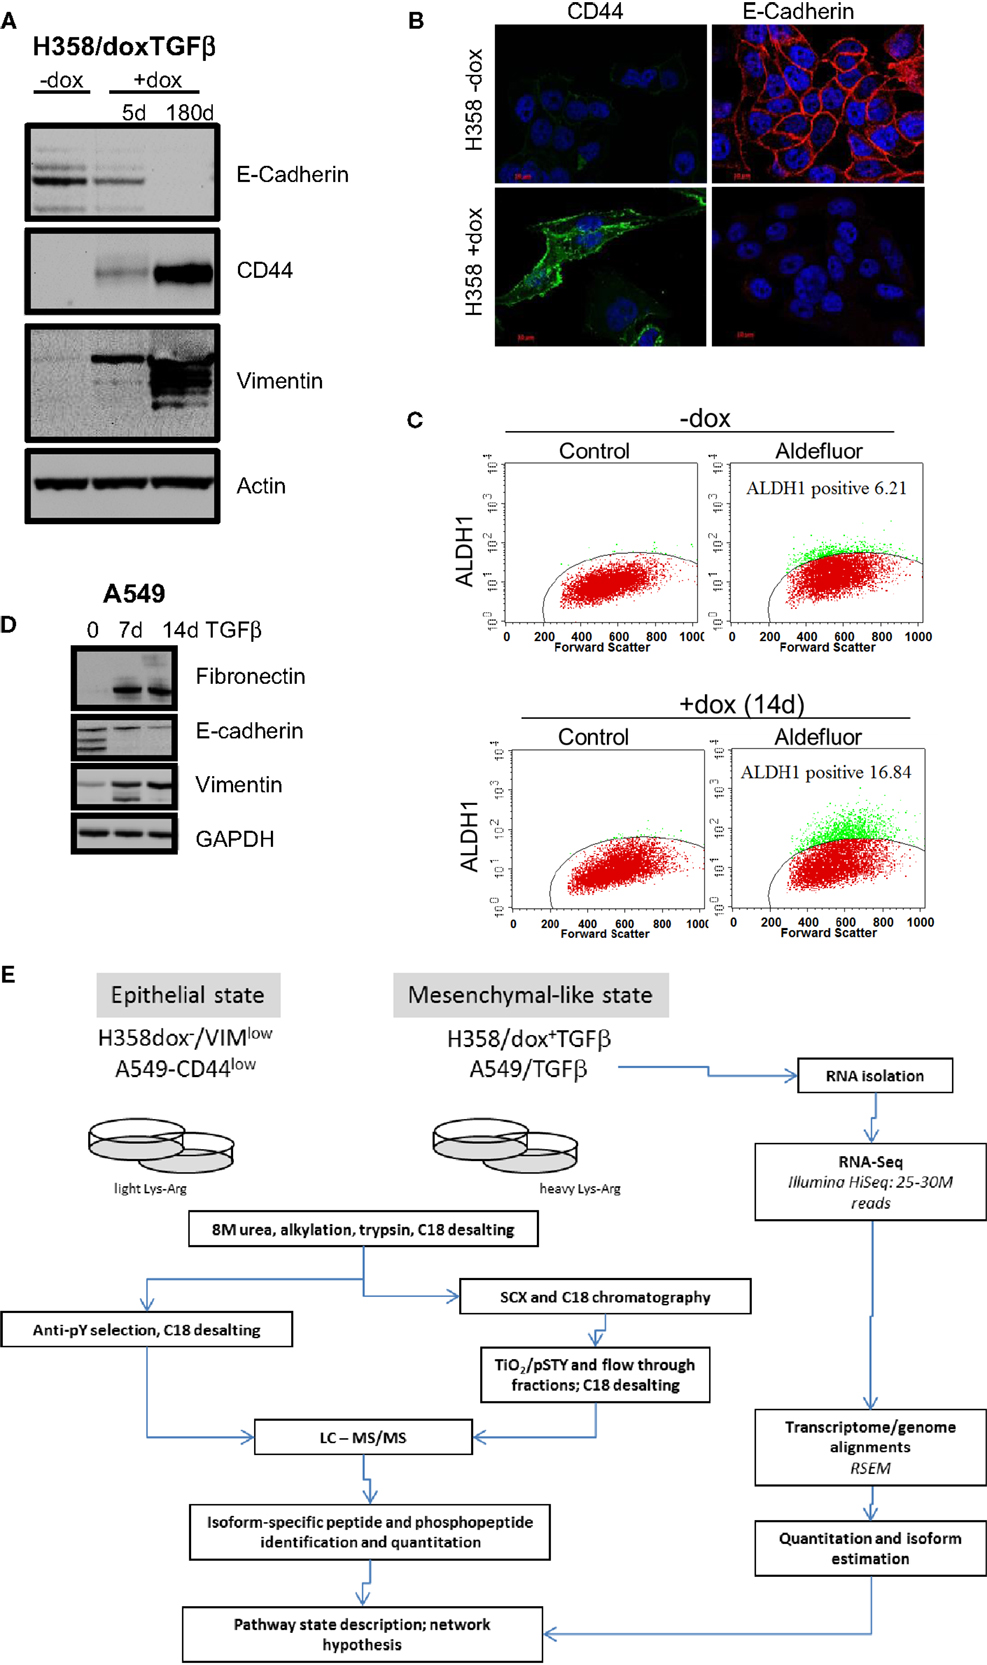
Figure 1. Marker expression in H358 and A549 isogenic mesenchymal trans-differentiation models. (A) Immunoblot staining for E-cadherin, CD44, vimentin, and actin (control) in the H358-dox-TGFβ model in epithelial (−dox) or mesenchymal (+dox) states (5 days and ~180 days on doxycycline). (B) Deconvoluted fluorescence microscopy image for CD44 (green) and E-cadherin (red) in the H358-dox-TGFβ model in epithelial (−dox) or mesenchymal (+dox) states. (C) H358 cells induced to express TGFβ for 14 days (bottom panels) show increased aldefluor activity, a marker of aldehyde dehydrogenase activity and stemness, relative to control cells (top panels), as measured by FACS. (D) Immunoblot staining for fibronectin, E-cadherin, vimentin, and GAPDH (control) in the A549 cell in the presence or absence of exogenous TGFβ (10 ng/ml) for 7 or 14 days. (E) A workflow schema for RNA, protein, phosphopeptide abundance measurement, and cross-correlation.
Reporter Plasmid Transfection
SuperTOP plasmid is a TCF–LEF responsive promoter driving expression of luciferase (addgene.com). The control superFOP contains mutated TCF/LEF promoter binding sites and serves as a negative control. The TK-renilla plasmid serves to normalize for DNA uptake. Plasmids were isolated from DH5a E. coli using an endotoxin-free isolation (qiagen.com). H358-dox-TGFβ cells were plated into 12 well plates (~2 × 10⁵ cells/well). Super TOP, super FOP, and control Renilla plasmids (promega.com), were transfected using Lipofectamine 2000 (lifetechnologies.com) and reporter assays conducted as defined by the manufacturer (promega.com). After normalization to Renilla control signal, TOP and FOP data were expressed in relative light units (RLUs).
Immunblot and Immunofluorescence
Gel electrophoresis and immunoblot of H358 and A549 cell extracts were performed under standard conditions using ECL Plus Western Blotting Substrate (piercenet.com) using vimentin (1:5000 dilution; bdbiosciences.com) and E-cadherin antibodies (1:1000 dilution; cellsignal.com). Immunofluorescence was performed under standard conditions using β-catenin (1:100 dilution), E-cadherin (1:200 dilution), and CD44 antibodies (1:400 dilution), all from Cell Signaling Technologies (cellsignal.com) with DAPI staining. Cells were imaged using a Zeiss Axiovert inverted fluorescence microscope at 60× magnification.
Results
Characterization and Validation of H358 and A549 Mutant-KRas Models
Two KRas mutant adenocarcinoma NSCLC cell lines H358 and A549 were used as model systems to molecularly define transcriptional and epigenetic reprograming following mesenchymal trans-differentiation. H358 and A549 cells can spontaneously generate populations of CDH1high/CD44low and CDH1low/CD44high, with epithelial and mesenchymal-like phenotypes, respectively (41). Spontaneous inter-conversion has been previously reported (42, 43). H358 contain relatively rare (estimated at ~2–4%) CDH1low/CD44high cells while A549 are typically a more mixed population of each phenotype. As such, all H358 experiments were initiated from epithelial CDH1high/VIMlow clones with predominant epithelial cell-junctions, from which subsequent H358/dox-TGFβ clones were derived. Doxycycline (0.5 μg/ml) induction of transgene expression, a constitutively active form of TGFβ1 (37), was verified by immunoblot and was shown to correctly modulate EMT marker expression (CDH1low, CD44high, and VIMhigh) as shown in Figure 1A. Fluorescence microscopy (Figure 1B) showed loss of E-cadherin membrane localization and gain of CD44 expression in H358/dox-TGFβ cells relative to the minus dox control. Multiple H358/dox-TGFβ clones exhibited correct isogenic mesenchymal trans-differentiation and in contrast vector control cells remained epithelial in the presence of doxycycline (24). Similarly, the percentage of aldefluor positive cells, a marker of aldehyde dehydrogenase activity and putative stemness, was increased after mesenchymal trans-differentiation with TGFβ for 14 days. The percentage of aldefluor positive cells was 6.2% in the −dox control H358 cells and 16.8% in the +dox H358/TGFβ producing cells (Figure 1C). A549 cells were anti-CD44 antibody counter selected using magnetic beads into a CD44low starting epithelial population, which was subsequently induced with TGFβ (10 ng/ml) to yield a uniformly mesenchymal cell population after 14 days. This allowed a more direct comparison of the CD44low starting population with the TGFβ-induced mesenchymal population, which became CD44high. Immunoblot for fibronectin, E-cadherin, and vimentin confirmed an EMT transition after 7 and 14 days exposure to TGFβ in A549 cells (10 ng/ml; Figure 1D). EMT occurs in H358 and A549 epithelial CDH1+/CD44low subclones exposed to TGFβ over a prolonged period.
Integration of RNA, Protein, and Phosphoprotein EMT State-Specific Measurements
In order the globally assess differences between isogenic epithelial and mesenchymal cell states, we measured RNA, protein, and phosphorylation changes as outlined in Figure 1E. RNA-Seq (44) was performed where non-zero ratios with RSEM reads ≥5 for any condition are listed in Table S1 in Supplementary Material (20,443 genes). Correlation between biological replicate RNA-Seq samples was r2 = 0.90 and r2 = 0.84 for H358 and A549 models, respectively (Figure 2A). Protein and phosphopeptide changes between epithelial and mesenchymal cell states were measured using SILAC labeling (31) in H358 and A549 TGFβ-treated or control. Analysis of RNA and protein abundance (Figure 2B) confirmed the gain of vimentin (VIM), fibronectin (FN1), and loss of keratin-8 (KRT8) and S100A6, expected RNA and protein changes occurring with mesenchymal trans-differentiation. We focused on changes in RNAs encoding transcription regulators, where 82 transcripts were coordinately regulated in comparing mesenchymal and epithelial cell states for both isogenic H358 and A549 models (Figure 2C).
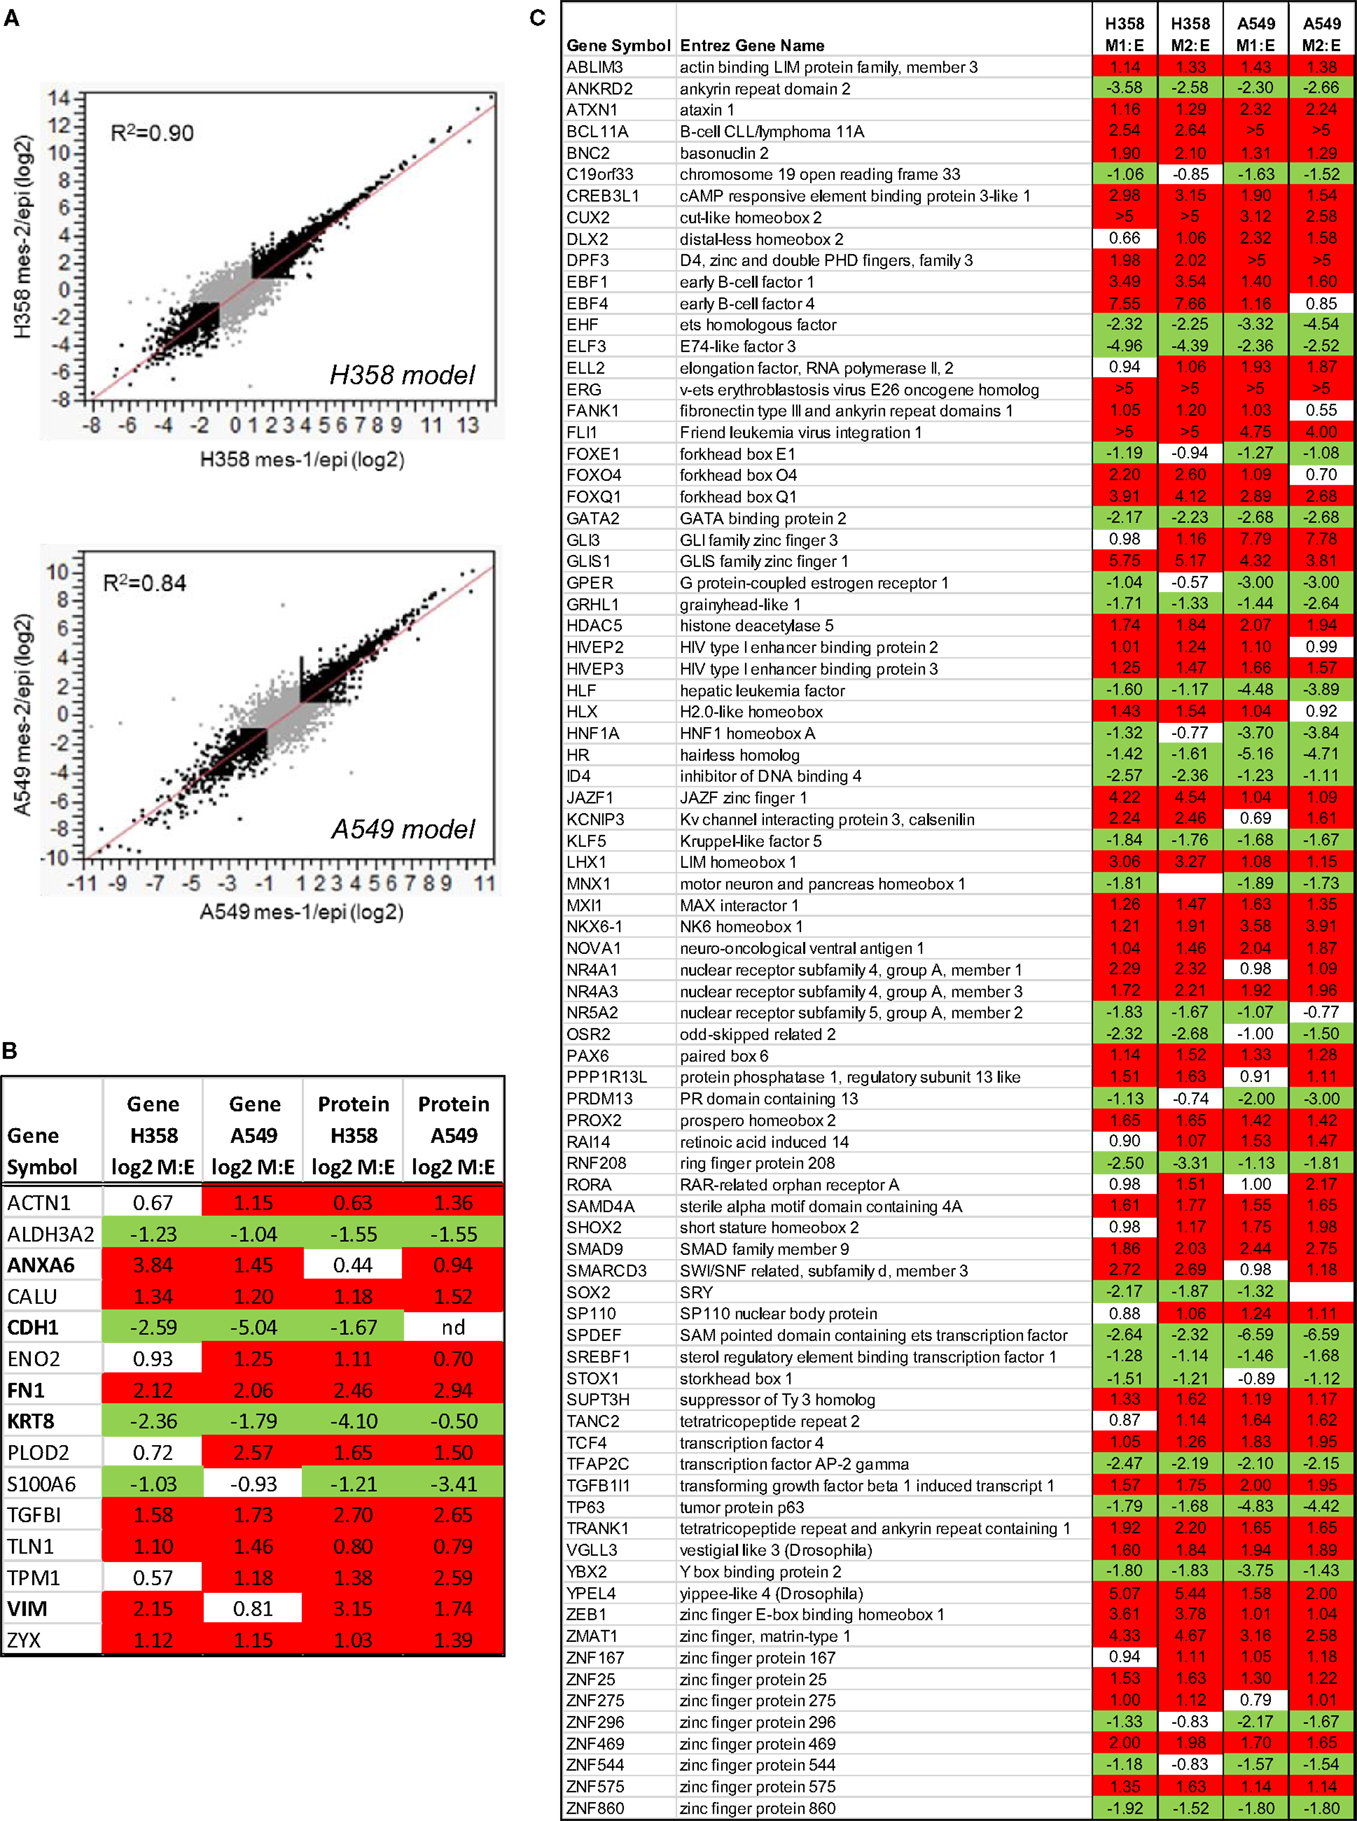
Figure 2. (A) Regression analysis of duplicate mesenchymal RNA-Seq samples expressed at a ratio to the mean epithelial control for both H358 and A549 models (greater than twofold changes are indicated in black). (B) Concordant RNA and protein changes for both isogenic H358 and A549 models. (C) Transcription associated RNA transcripts with differential abundance between epithelial and mesenchymal cell states in both H358 and A549 models.
Functional Annotation of Transcription and Epigenetic Networks
Functional association with RNA abundance changes was assessed by GSEA. As expected multiple signatures associated with KRas transformation, stemness, and mesenchymal trans-differentiation were significantly enriched (Table S5 in Supplementary Material), with normalized enrichment score (NES) p-value <0.05 and the false discovery rate (FDR) q-value <0.05. Similarly pathway prediction analysis predicted activation of TGFβ signaling (45), and inhibition of DKK1 and SMAD7 signaling. These findings further served as validation benchmarks for the GSEA and pathway prediction approaches. Similarly benchmark RNA expression values for transcriptional regulators, which can induce EMT [Snail, Slug, Twist, and Zeb (9, 46–48)] were markedly increased in a model dependent manner (Table S6 in Supplementary Material).
Transcriptional signatures surrounding LEF1, NFκB, and BMI1 were highly enriched in datasets comparing H358 and A549 epithelial and mesenchymal-like cell states using GSEA and/or pathway prediction analysis (Table 1). We considered other predicted activated or inhibited nodes common to both KRas trans-differentiation models. Pathway prediction analysis was used to model signaling activation or inhibition based on transcription factor response. Table 2 summarizes pathway state based on H358 and A549 RNA-Seq datasets. Expected activation or Snail (H358), Twist (A549), and STAT pathways [H358 and A549 via increased IL11 and IL6; (23, 49)] was expected but highlight model heterogeneity, even within closely related NSCLC systems. Interestingly, RNA expression correlated the mesenchymal state with KDM5B, SMARCA4, and EGR1 pathway activation, and Myc/Max, SIN3A, and SPDEF pathway inhibition.
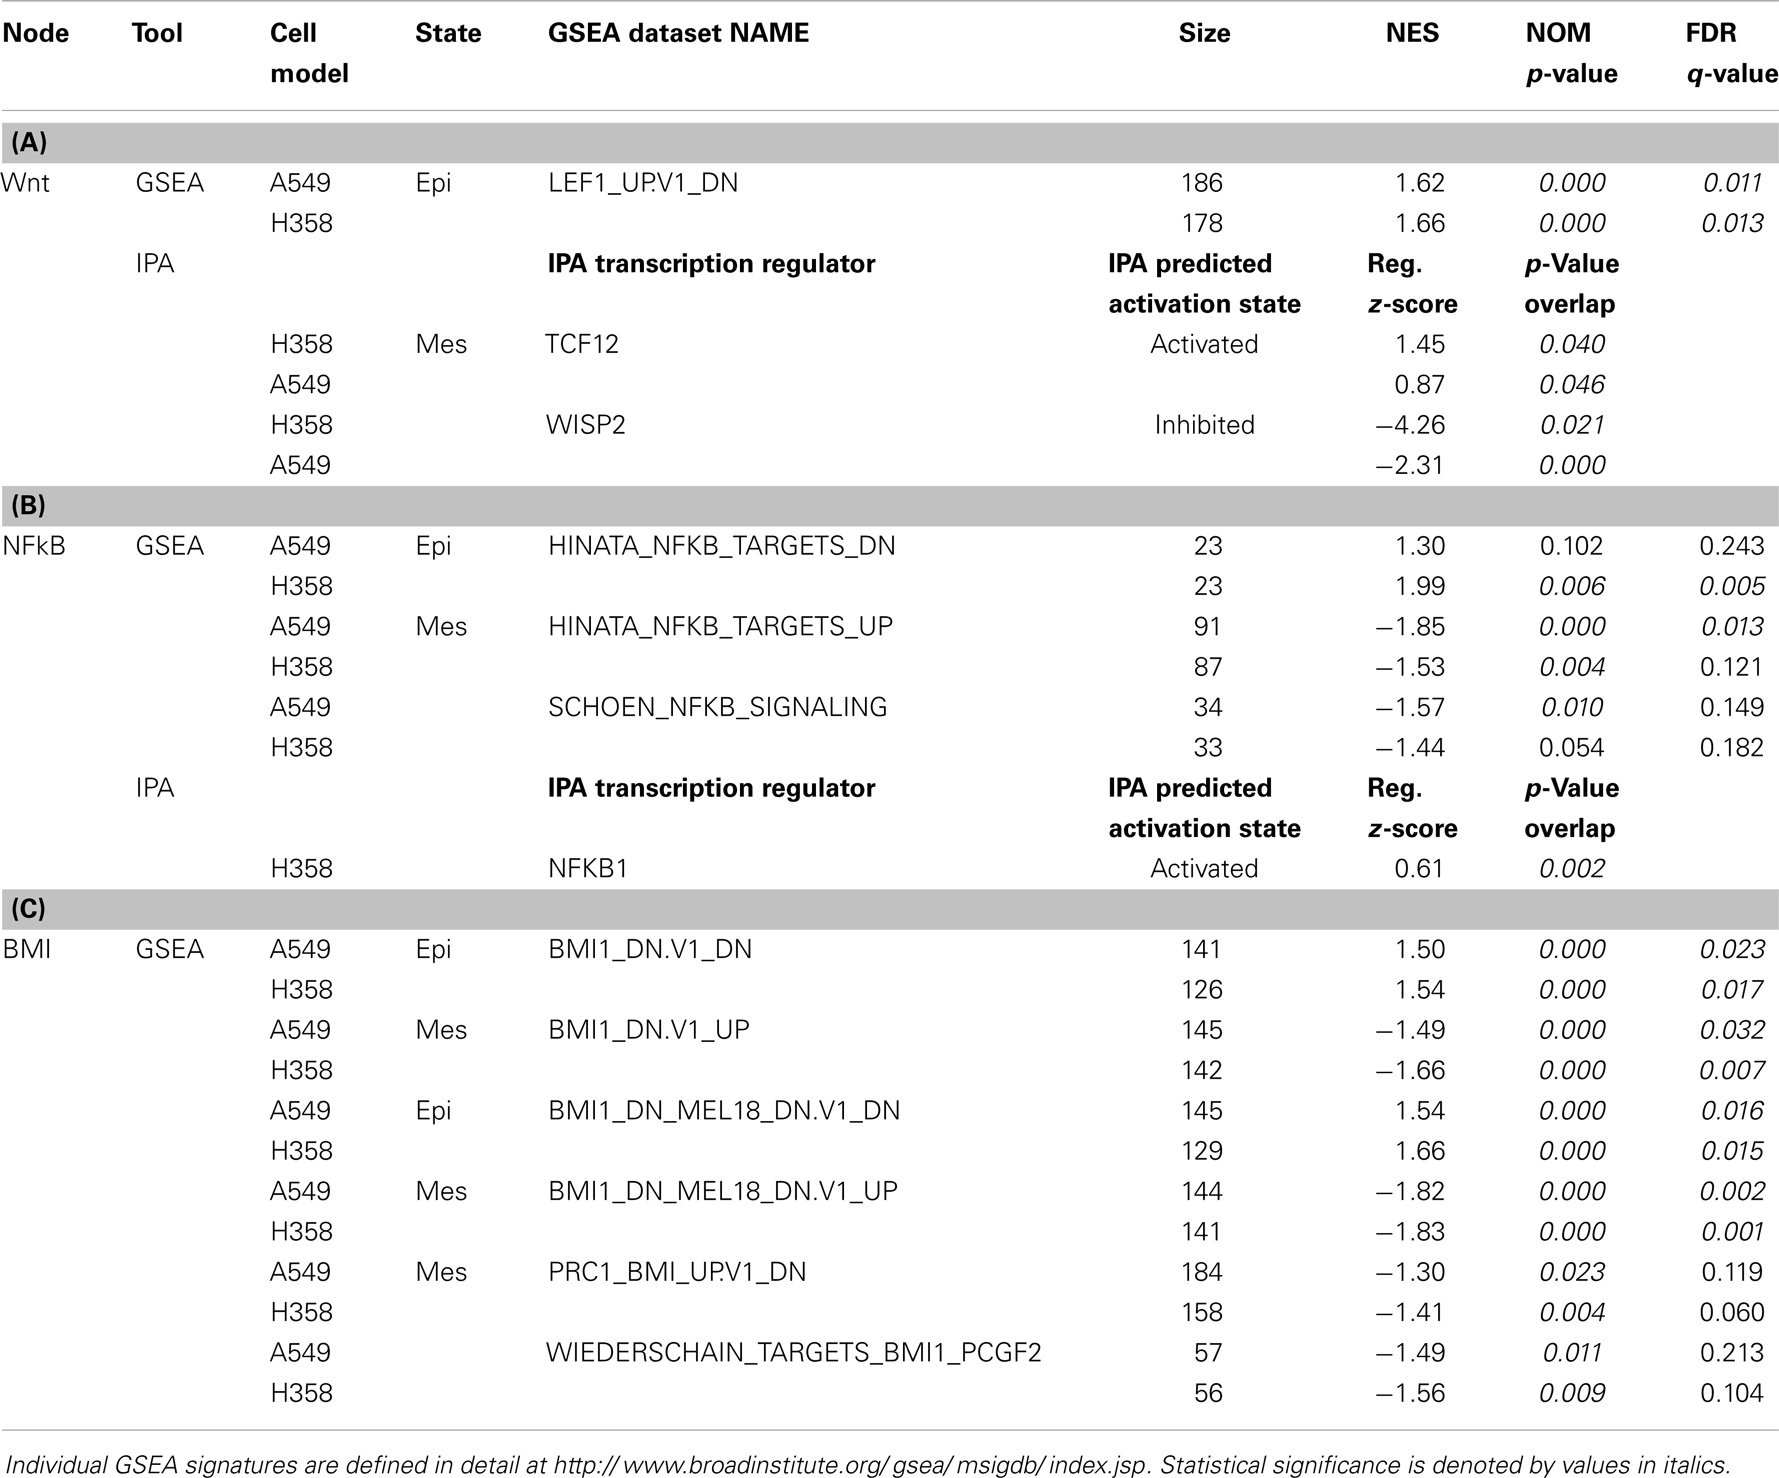
Table 1. RNA changes correlating with gene-set enrichment (GSEA) signatures and/or pathway prediction analysis (IPA) for (A) Wnt/LEF1, (B) NFκB, and (C) BMI1 signaling networks in H358 and A549 KRas NSCLC models comparing isogenic epithelial and mesenchymal cell states.
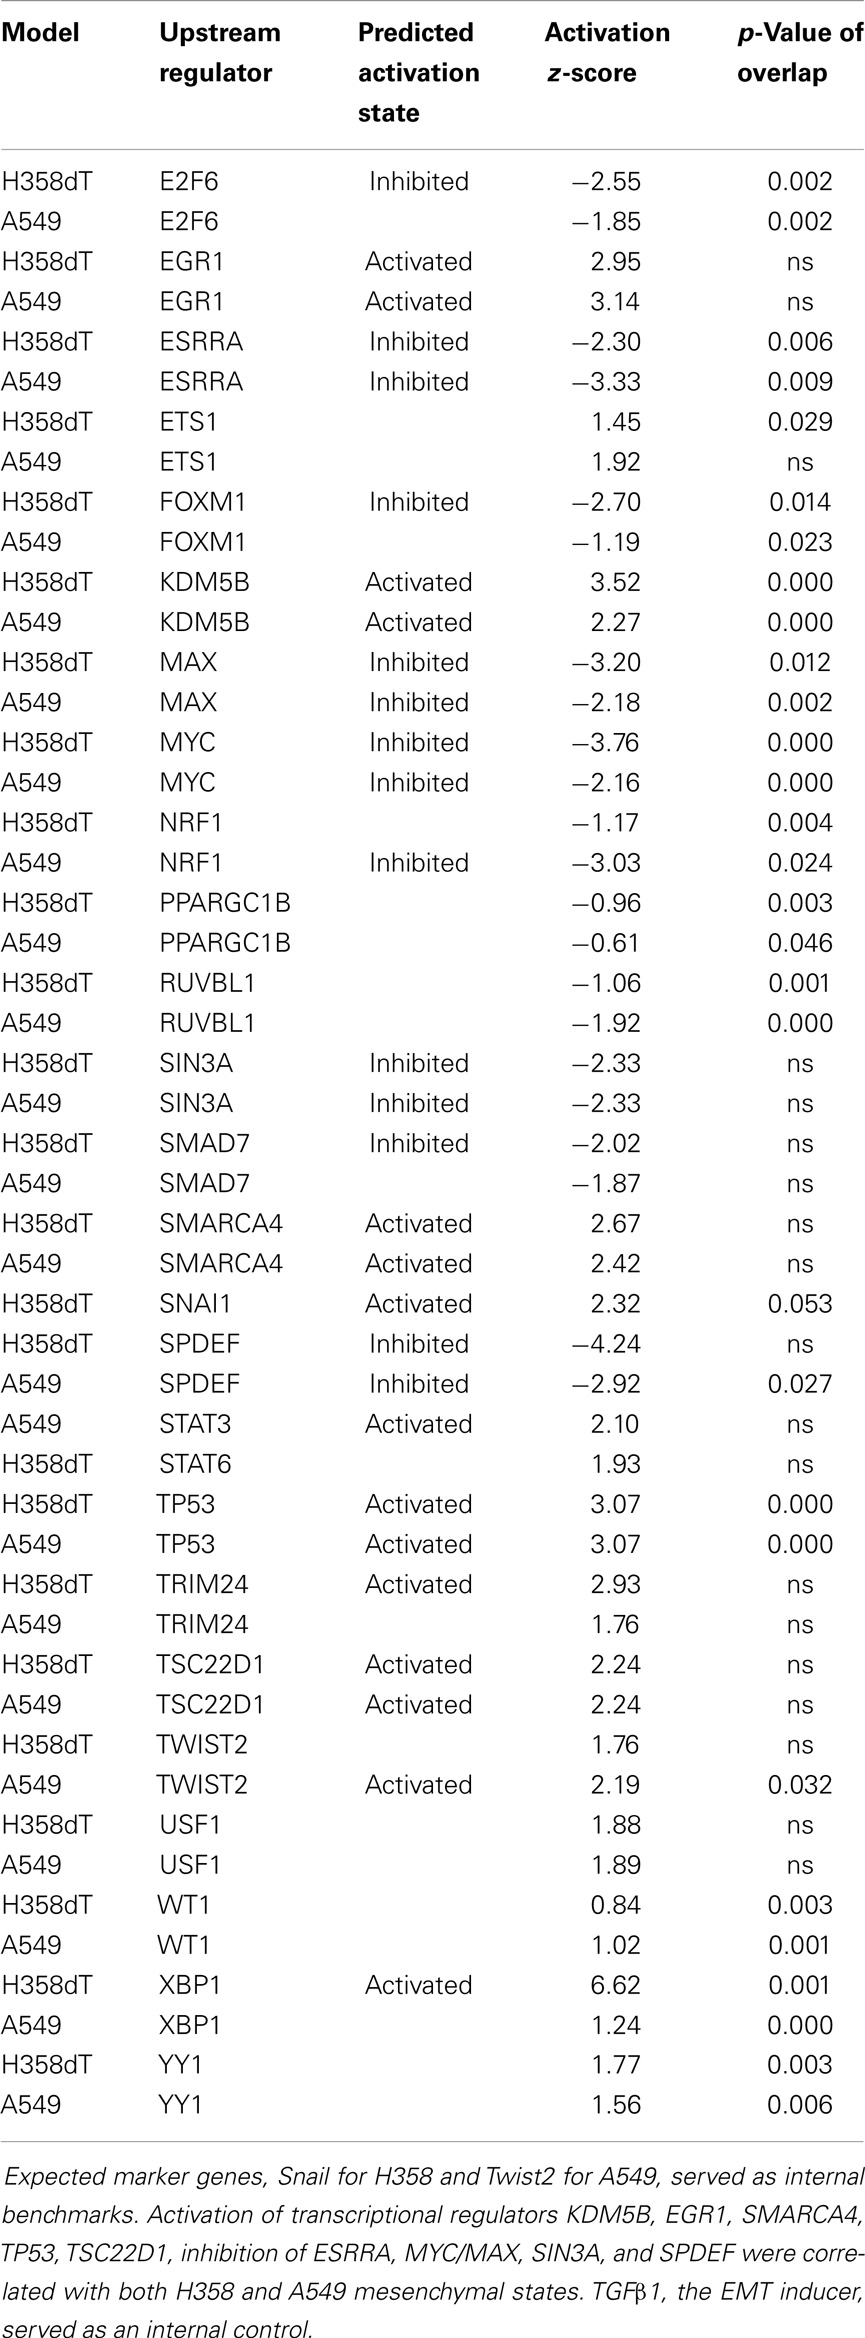
Table 2. Transcription pathway prediction (IPA) based on differential RNA expression between mesenchymal and epithelial cell states for both A549 and H358 models.
Altered TCF/LEF and NFκB Networks with the Mesenchymal Cell State
Canonical Wnt signaling leads to the nuclear translocation of β-catenin and the activation of TCF and LEF family transcription factors, which in turn promote pro-survival gene expression programs. The activation of the Wnt/β-catenin/TCF–LEF axis has been implicated in epithelial mesenchymal transition and metastatic behavior (50, 51). GSEA correlations predict LEF1 pathway activation in the mesenchymal state (Table 1). Figure 3A shows GSEA plots of genes down-regulated by overexpression of LEF1 in epithelial DLD1 cells (52), positively correlating with the epithelial cell state. Correlations between the H358 and A549 RNA abundance changes and LEF1 gene signatures were statistically significant (p < 0.0001 and FDR q-value <0.02; Table 1A). The top 20 positively and negatively correlated genes were identified and heat mapped for H358 (Figure 3B; control and TGFβ duplicate samples) and for A549 (Figure 3C; control and TGFβ duplicate samples). The data suggested TCF/LEF1 signaling were up-regulated in EMT-derived mesenchymal lung tumor cells. We asked whether EMT state in H358 or A549 cells might alter the abundance of RNA transcripts encoding components of the Wnt signaling pathway itself, where log2 ratios are shown for duplicate samples comparing 44 Wnt pathway components between mesenchymal and epithelial states (Figure 4A). Both positively acting and negatively acting Wnt pathway encoded RNAs were observed. The Wnt pathway positive regulators TCF4/TCF7L1/LEF1 and WNT5A/5B were found to be up-regulated in either H358 or A549 mesenchymal cell states, while the negative regulators DKK1 and NDK2 were down-regulated in mesenchymal cell states.
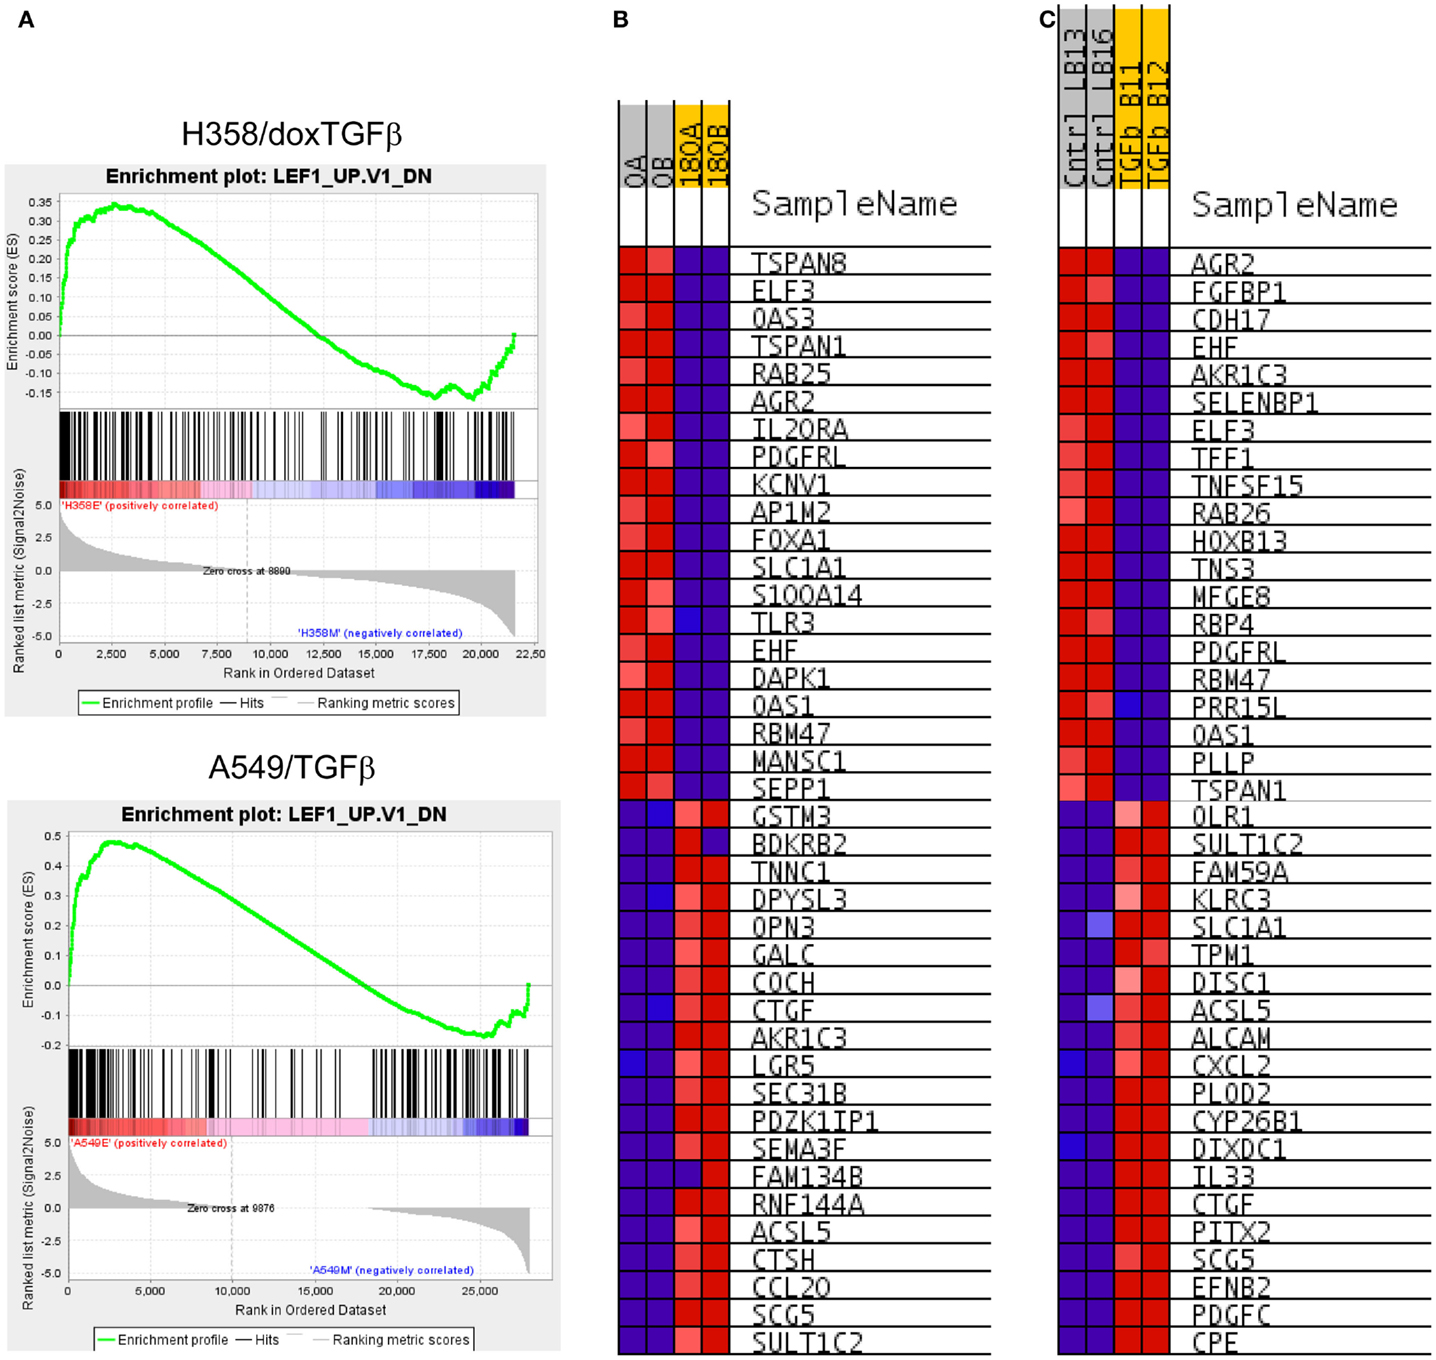
Figure 3. (A) Correlation of H358 and A549 EMT regulated genes with the LEF1 signature from LEF1 over-expressing epithelial DLD1 cells (from GSE3229). Normalized enrichment score (NES) was 2.63, nominal p-value, FDR q-value, and FWER p-value were <0.001. (B) The top 20 positively and negatively correlated genes were identified and heat mapped for H358 (B) control [0; A, B] and TGFβ [180; A, B] duplicate samples) and (C) for A549 (control [Cntrl; LB13, LB16] and TGFβ [TGFb; B11, B12] duplicate samples).
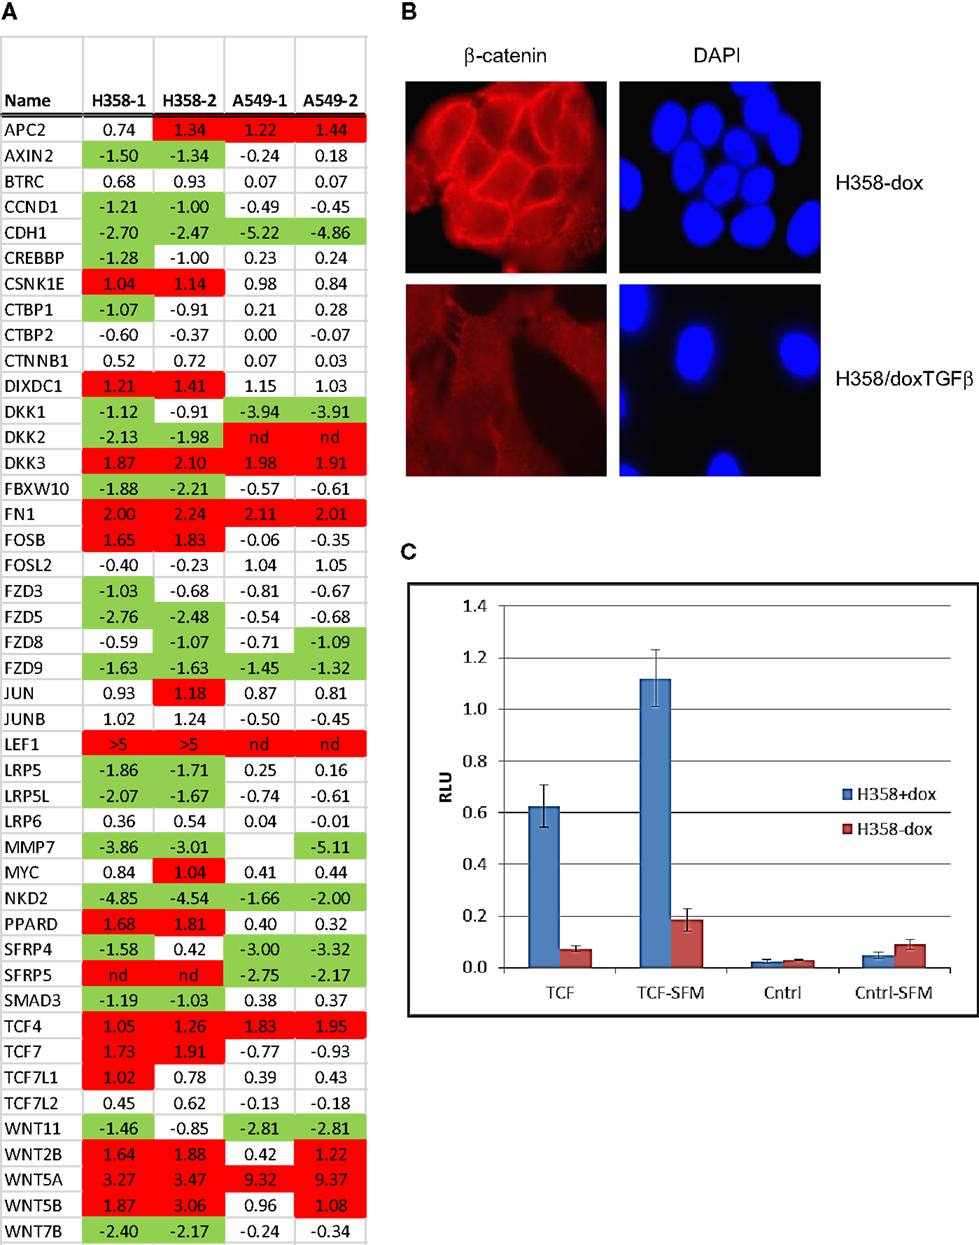
Figure 4. Nuclear translocation of β-catenin and TCF/LEF activation in steady-state mesenchymal H358 cells expressing Wnt5A. (A) Heat map of RNA abundance of Wnt signaling components and target genes in H358 and A549 isogenic models (mesenchymal/epithelial; log2) from duplicate samples. (B) Loss of membrane β-catenin localization and gain of punctate nuclear localization in mesenchymal H358/dox-TGFβ cells. Top panels: H358 cells in the absence of doxycycline. Bottom panels: H358/dox-TGFβ cells in a mesenchymal-like state. Cells were labeled with β-catenin antibody (red) and DAPI (blue) and imaged (60X). (C) Co-transfection of sTOP-TCF/LEF-luciferase (“TCF”) or control FOP-luciferase (“Cntrl”) was used to measure the activity of the TCF–LEF pathway. Renilla-luciferase was used to normalize transfection efficiency. H358/dox-TGFβ cells, in the presence or absence of doxycycline, were transfected and after 48 h luciferase measurements preformed under standard conditions. Both steady-state serum and 24 h serum starvation conditions (“-SFM”) were used with similar results. The y-axis units are relative light units (RLU). The means of two independent experiments are shown, each in triplicate, where the error bars reflect the standard error of the mean.
Nuclear β-catenin localization has been shown to correlate with neoplastic transformation and cancer patient outcome (53). In normal epithelial cells β-catenin forms a complex with α-catenin and E-cadherin on the inner side of the plasma membrane, important for cell–cell interaction. By immunofluorescence microscopy, we observed that β-catenin was localized at cell–cell-junctions on the inner side of the plasma membrane in the epithelial cell state, as expected (Figure 4B; top panels). In the mesenchymal cell state, β-catenin staining was lost from the cell membrane, with expected (54) diffuse cytoplasmic and speckled nuclear staining (Figure 4B; bottom panels). We asked whether signaling through the Wnt/β-catenin pathway might show a change in activity between epithelial and mesenchymal lung states. H358 cells were transfected with TCF promoter–reporter plasmid (sTOP), measuring TCF/LEF dependent transcription, or control (FOP) plasmid with mutated TCF/LEF binding sites. A control TK-renilla plasmid was used to control for transfection efficiency. Triplicate biological experiments were performed, each run in triplicate, which were normalized to the TK-renilla control and averaged (Figure 4C). We observed the signal from the TCF/LEF reporter was increased 8.5-fold in the mesenchymal state relative to the epithelial state in all experiments (p = 0.02). Similar findings were observed following serum removal for 24 prior to transfection and maintained for 48 h following transfection, where TCF/LEF reporter activity was increased in the mesenchymal state 6.1-fold (p = 0.004). The mutated control reporter showed minimal activity relative to TCF [p = 0.02 in serum and p = 0.002 in serum-free conditions (SFM)]. The use of LEF signatures and TCF/LEF reporter data serves in part to validate the informatics approach, further supported by correlation with expected gene signatures (Table S5 in Supplementary Material) for TGFβ, stem cell, and KRas pathways.
Gene-set enrichment and pathway prediction analysis of RNAs altered in abundance with mesenchymal trans-differentiation, indicated potential activation of the NFκB pathway, particularly in A549 (Table 1B; Figure 5A). The Hinata NFκB signature was derived from normal keratinocytes over-expressing NFKB1 and RELA (52). The Schoen NFκB signature reflects genes down-regulated in mesenchymal-like A375 melanoma cells treated with an NFκB inhibitor (55). The top 20 positively and negatively correlated genes form the Hinata signature correlation were identified and heat mapped for A549 (Figure 5B). RNAs encoding components of the pathway, notably IL1, TLR5, and TLR9, were markedly increased in the mesenchymal state (Figure 5C). It is beyond the scope of this study to fully define upstream signaling pathways, which promote the transcriptional and epigenetic changes observed in H358 and A549 models. However, network predictions from RNA sequencing datasets, phosphoproteomic analysis, and kinase activity immunoblots all suggest pronounced activation of ERK1/2 (56, 57) and casein kinase-2 (CK2) and the inhibition of glycogen synthase-3 (GSK3) protein kinase activities in both A549 and H358 mesenchymal states. Phosphorylation of GSK3beta on the kinase activating site Y216 is reduced in H358 mesenchymal cells (data not shown). The inhibition of GSK3 has been shown to stabilize Snail, which in turn increases Zeb1 expression, while CK2 kinase activity has been correlated with NFκB activation (58). Wnt5A is a transcriptional target of NFκB, which is increased in the mesenchymal state in both H358 and A549 models. Wnt5A driven TCF/LEF targets are known to include CD44 and Snail, further reinforcing the establishment of the mesenchymal state. Interaction nodes between TCF/LEF and NFκB pathways were mapped using protein–protein interaction data (BioGrid; Figure 5D). The orphan nuclear receptor NR4A1/TR3/Nur77 was identified as an up-regulated common component of the LEF1 and NFκB 1 protein–protein interaction networks. NR4A1 showed coordinate regulation with redox sensitive genes, e.g., TXNDC5, suggesting NR4A1 may regulate oxidative stress as has been observed in pancreas cancer models (59). Low NR4A1 levels have been correlated with cisplatin resistance (60). The elevated RNA abundance for NR4A1 in the mesenchymal state, suggest mesenchymal-like tumor cells may be more sensitive to cisplatin. Our previous studies have shown mesenchymal H358 and A549 cells are relatively resistant to EGFR (8, 61, 62) and IGF1R/IR (63) TKIs and to gemcitabine and paclitaxel, while retaining sensitivity to cisplatin in vitro.
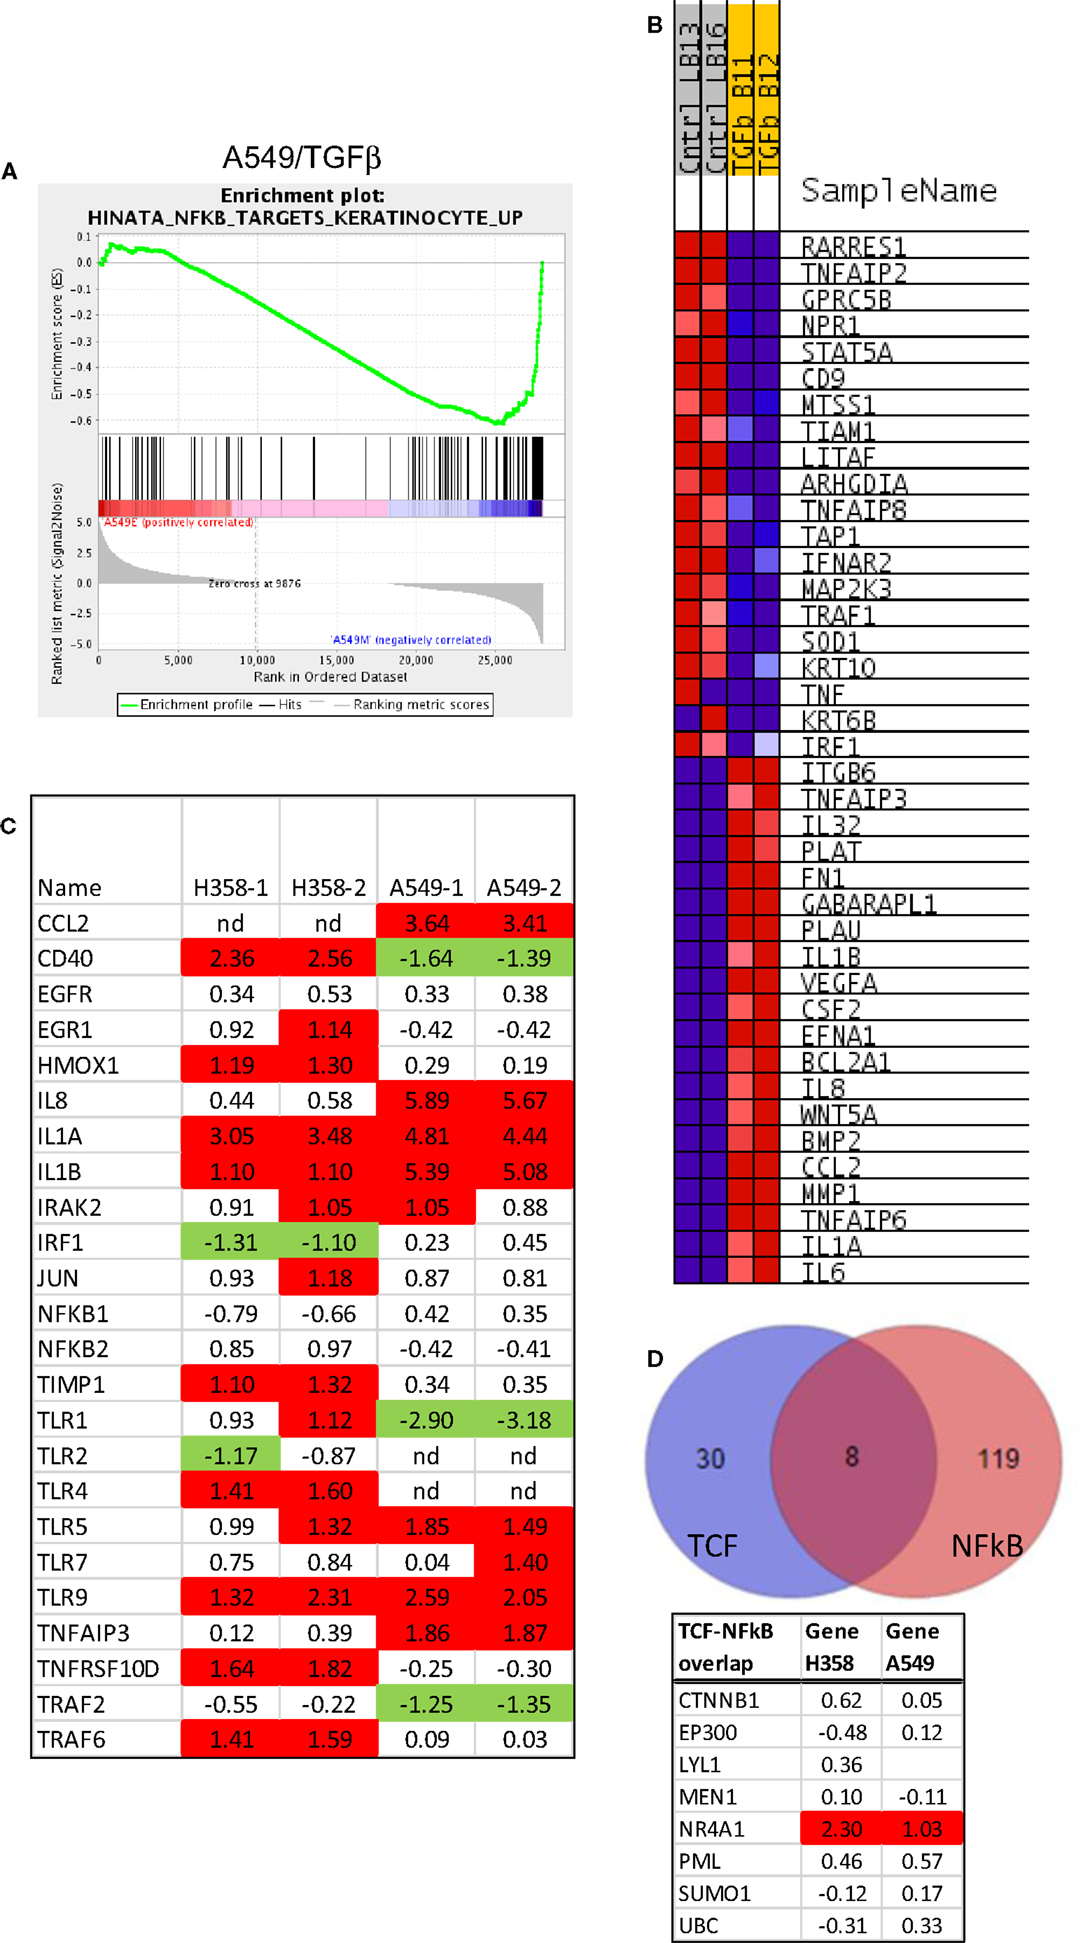
Figure 5. Activation of the NFκB pathway in mesenchymal H358. (A) Correlation of A549 EMT regulated genes with the NFκB signature from NFκB and RELA over-expression in keratinocytes (52). Normalized enrichment score (NES) was −1.85, nominal p-value <0.001, FDR q-value 0.01. (B) The top 20 positively and negatively correlated genes were identified and heat mapped for A549, as defined in Figure 4. (C) Heat map of RNA abundance of NFκB signaling components and target genes in H358 and A549 isogenic models (mesenchymal/epithelial; log2). (D) Protein–protein overlaps between TCF4 and NFκB protein interaction datasets from BioGrid, showing NR4A1 as a common physical node between the two pathways.
Altered Transcription and Epigenetic Networks
BMI1 is a component of the polycomb repressive complex (PRC1), formed by complexes with heterochromatin adaptor family proteins (e.g., CBX8). PRC1 functions as an inhibitor of transcription during embryogenesis and in neoplastic transformation, as a tumor suppressor. BMI1 is required for Twist mediated EMT (64). Multiple GSEA signatures associated with changes in BMI1 target gene expression were observed (Table 2C), with the majority showing stringent statistical significance (p < 0.05 and FDR q-value <0.05). The BMI_DN and Wiederschain signatures reflect genes up-regulated the stem-like medulloblastoma line DAOY by knockdown of BMI1 with or without co-knockdown of the polycomb ring finger gene PCGF2/Mel-18 (65). In contrast, the PRC1_BMI signature (66) is derived by knockdown of BMI1 in fibroblasts, cells of mesodermal origin, showed a reversed correlation. The GSEA plots correlating BMI1 knockdown with the H358 and A549 mesenchymal cell state are shown (Figure 6A). The top 20 positively and negatively correlated genes were identified and heat mapped for H358 (Figure 6B) and for A549 (Figure 6C), suggesting altered regulation of the BMI1 pathway with EMT in the two mutant-KRas NSCLC models. Interestingly, the GSEA indicated better correlation with inhibition of BMI1 target genes with the mesenchymal cell phenotype. However, direct analysis of up-regulated and down-regulated BMI1 target genes showed enrichment in both H358 and A549 epithelial and mesenchymal cell states (Table S7 in Supplementary Material), which also was observed by GSEA (anti-correlation) at lower statistical stringency. These findings suggest additional factor(s) likely contribute to BMI1 target gene recognition and/or the directionality of regulation between epithelial and mesenchymal cell states. Non-PRC1 components may modify the directionality BMI1 output, for example, CtBP, E2F6, NFκB, and Cited2 (67).
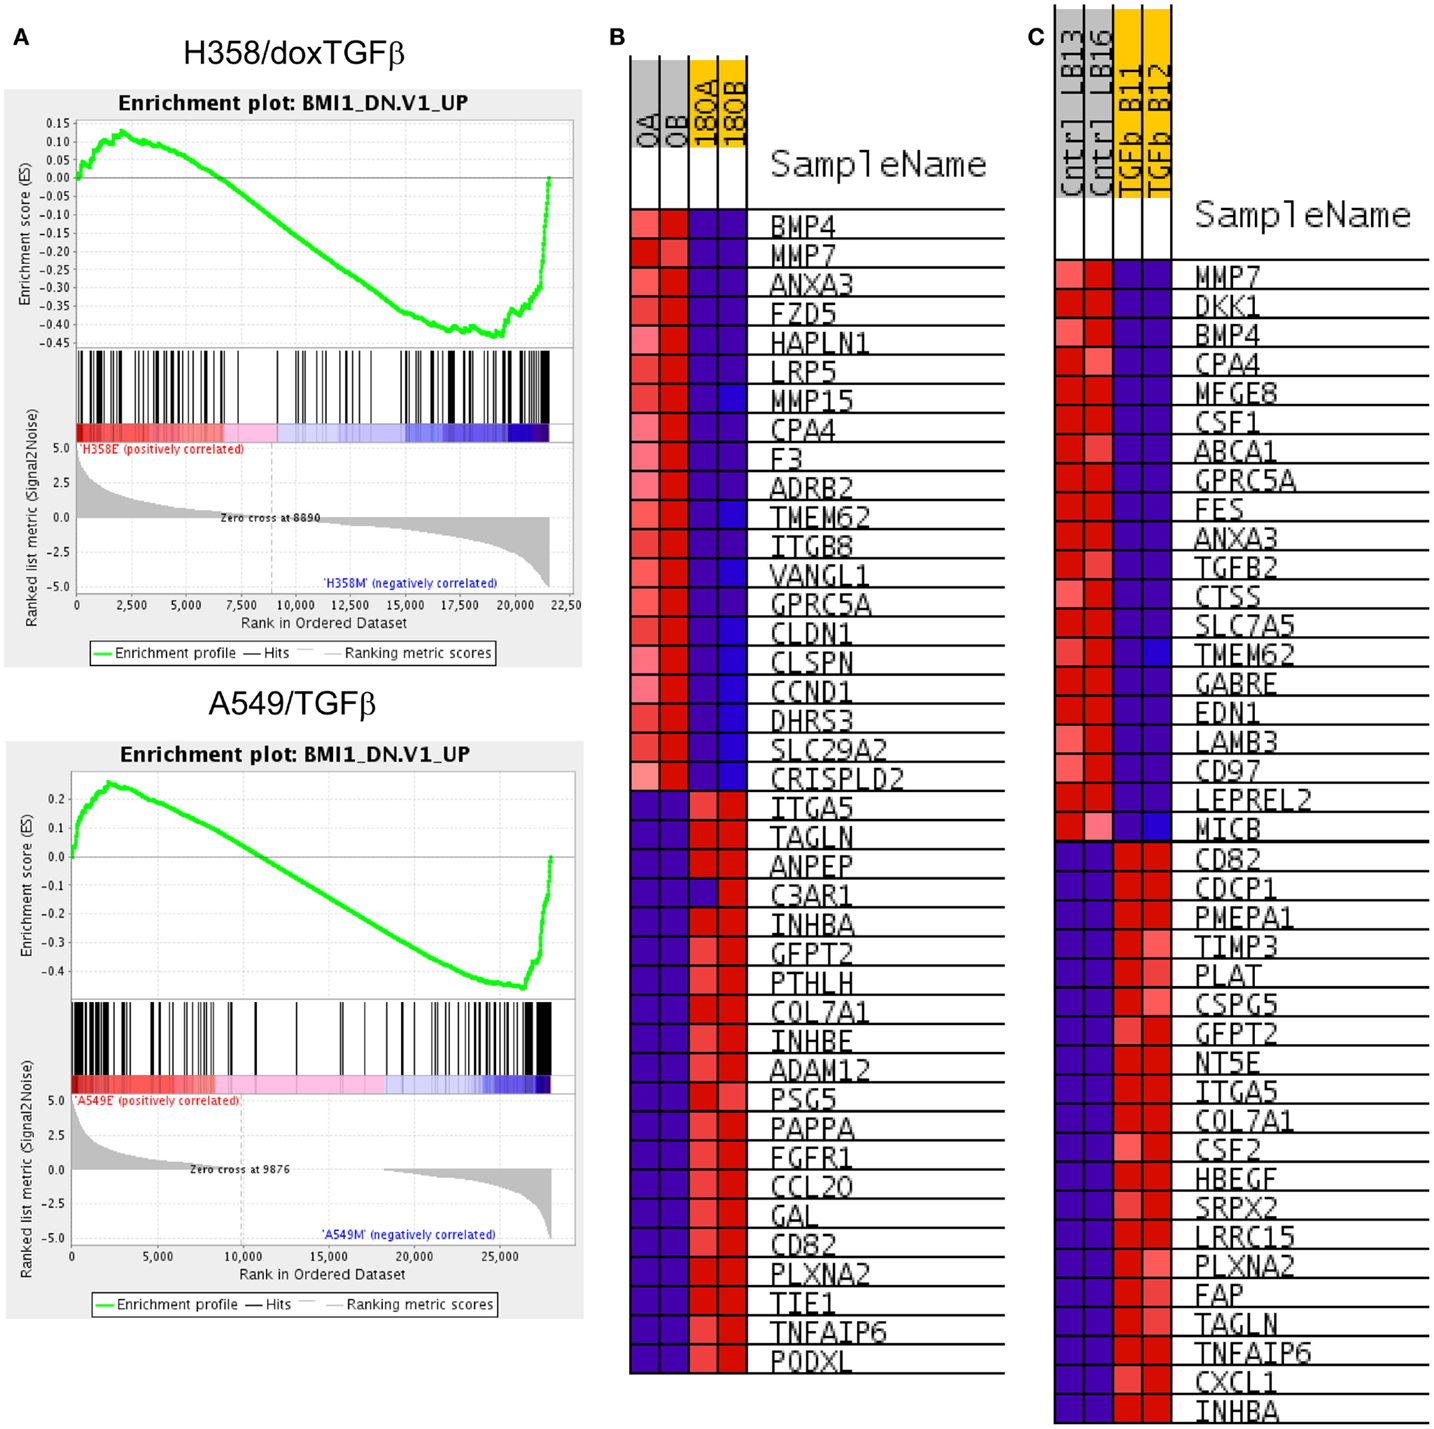
Figure 6. (A) Increased BMI target gene enrichment from RNA-Seq datasets comparing differential RNA expression between H358 and A549 cell states. Statistical significance (p < 0.0001 and FDR q-value <0.04 was observed. (B) The top 20 positively and negatively correlated genes were identified and heat mapped for H358 and (C) for A549, with labels as defined in Figure 3.
Runx family transcription factors contain a conserved Runt DNA binding domain and are developmentally regulated. RUNX2 and RUNX3 are overexpressed in the A549 and H358 models, respectively. RUNX3, previously thought to function as a tumor suppressor, has recently been associated with cancer progression (68) and cooperative induction with NFκB of the inflammatory cytokine IL23 (69). In NSCLC overexpression of RUNX2 has been observed in comparisons of tumor and normal tissues and was implicated with poor outcome (70). The overexpression of exogenous RUNX2 also has been shown to promote EMT (71, 72), increase migratory and invasive behavior (73), and increase expression of Twist and Slug, both of which are markedly increased with EMT in the A549 background. We examined interaction networks around RUNX2 and RUNX3, where proteins forming direct contacts and potentially establishing signaling complexes, are shown in Figure 7. In H358 RUNX3 RNA expression was correlated with increased expression for potential protein–protein interactors SP110, NOTCH1, DLG4, JUN, KAT2B, HIVEP3, and HDAC5 and decreased expression and potential interaction with EZH2, SUV39H1, RBM14, CREBBP, and SMAD3. This also was associated with an increased SP110 phosphorylation of S256. In A549, Runx2 expression correlated with increased KAT2B, HIVEP3, ETS1, SP110, and HDAC5 expression and decreased expression of STAT3 and FOS.
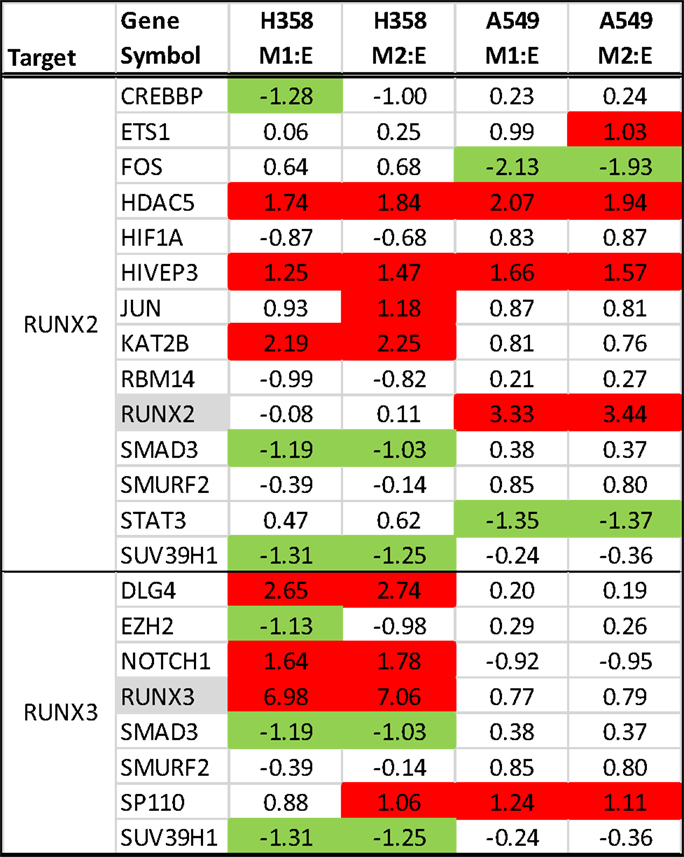
Figure 7. RNA expression ratios comparing H358 and A549 mesenchymal/epithelial cell states in duplicate. Complexes associated with RUNX2 (top) and RUNX3 (bottom) are shown.
Multiple transcription factors associated with the maintenance of the epithelial state were markedly decreased with EMT in both models. Grainyhead-like 1 (GRHL1) RNA expression is decreased in both mesenchymal models and GRHL2 is reduced in the H358 model. GRHL2 and GRHL1 share ~70% homology and GRHL2 has been associated with the maintenance of an epithelial state (74, 75), as a target repressed by Zeb1. Similarly transcription factor AP-2 gamma (TFAP2C), a transcription factor associated with estrogen receptor signaling in breast cancer (76), showed reduced expression in the mesenchymal state. Emerging data indicate TFAP2C is important for the normal luminal epithelial differentiation (77) where knockdown promotes mesenchymal transition (78). Conversely, overexpression of the TFAP2C cDNA reduced CD44 expression, and high TFAP2C expression was correlated with response to neoadjuvant chemotherapy (79). EHF, an ETS family transcription factor, also has been associated with an epithelial differentiation program and EHF RNA expression was decreased (74). Interestingly, the epithelial-specific splicing factors ESRP1 and ESRP2 (80) are markedly attenuated with EMT in the H358 model, but their expression is absent in both epithelial and mesenchymal A549 states, again indicating considerable heterogeneity in EMT programs within closely related NSCLC models. Finally, Odd-skipped related 2 (OSR2) is a Smad3/4 down-regulated palate and limb developmental gene (81), reduced in the both mesenchymal models.
Epithelial mesenchymal transition state was correlated with statistically significant changes in site-specific phosphorylation (Table 3). Several members of the BAF SWI/SNF complex chromatin remodeling proteins were altered in their pattern of site-specific phosphorylation dependent on EMT state. Notably SMARCC1 showed increased phosphorylation at positions S328 and S330, and ARID1A was increased in phosphorylation at position S696. CBX3/HP1γ is a chromatin remodeling factor implicated in euchromatin silencing in embryonic stem cells (82) and in transcription elongation by RNA polymerase II on heterochromatic genes (83). CBX3/HP1γ has shown overexpression in NSCLC (84) as compared with normal adjacent tissue, and expression was correlated with poor survival rate [p = 0.02; (85)]. Phosphorylation measurements also suggested EMT state may be regulated in part by increased phosphorylation of CBX3/HP1 at position S95 (p < 0.001) and likely S93 (p = 0.10; not shown) in the central region between chromo and chromoshadow domains. CBX3/HP1 functions as a transcriptional silencer through histone H3 K9 interaction, where phosphorylation at S93, likely by PKA, results in a reduction of CBX3/HP1 mediated silencing and transcription elongation (86). Change in phosphorylation of CBX8, a component of the PRC1 complex, at position S191 within the atrophin-1 domain also was observed (Table 3). Phosphorylation of HDAC2 was increased at positions S422 and S424 in the mesenchymal state. S422 and S424 are known CK2a sites, associated with inhibition of deacetylase activity (87). S394 is also a CK2a phosphosite increased in H358, decreased in A549. The reported role S394 in activation (88) and inhibition (87) of HDAC2 may be context dependent through as yet undefined factors.
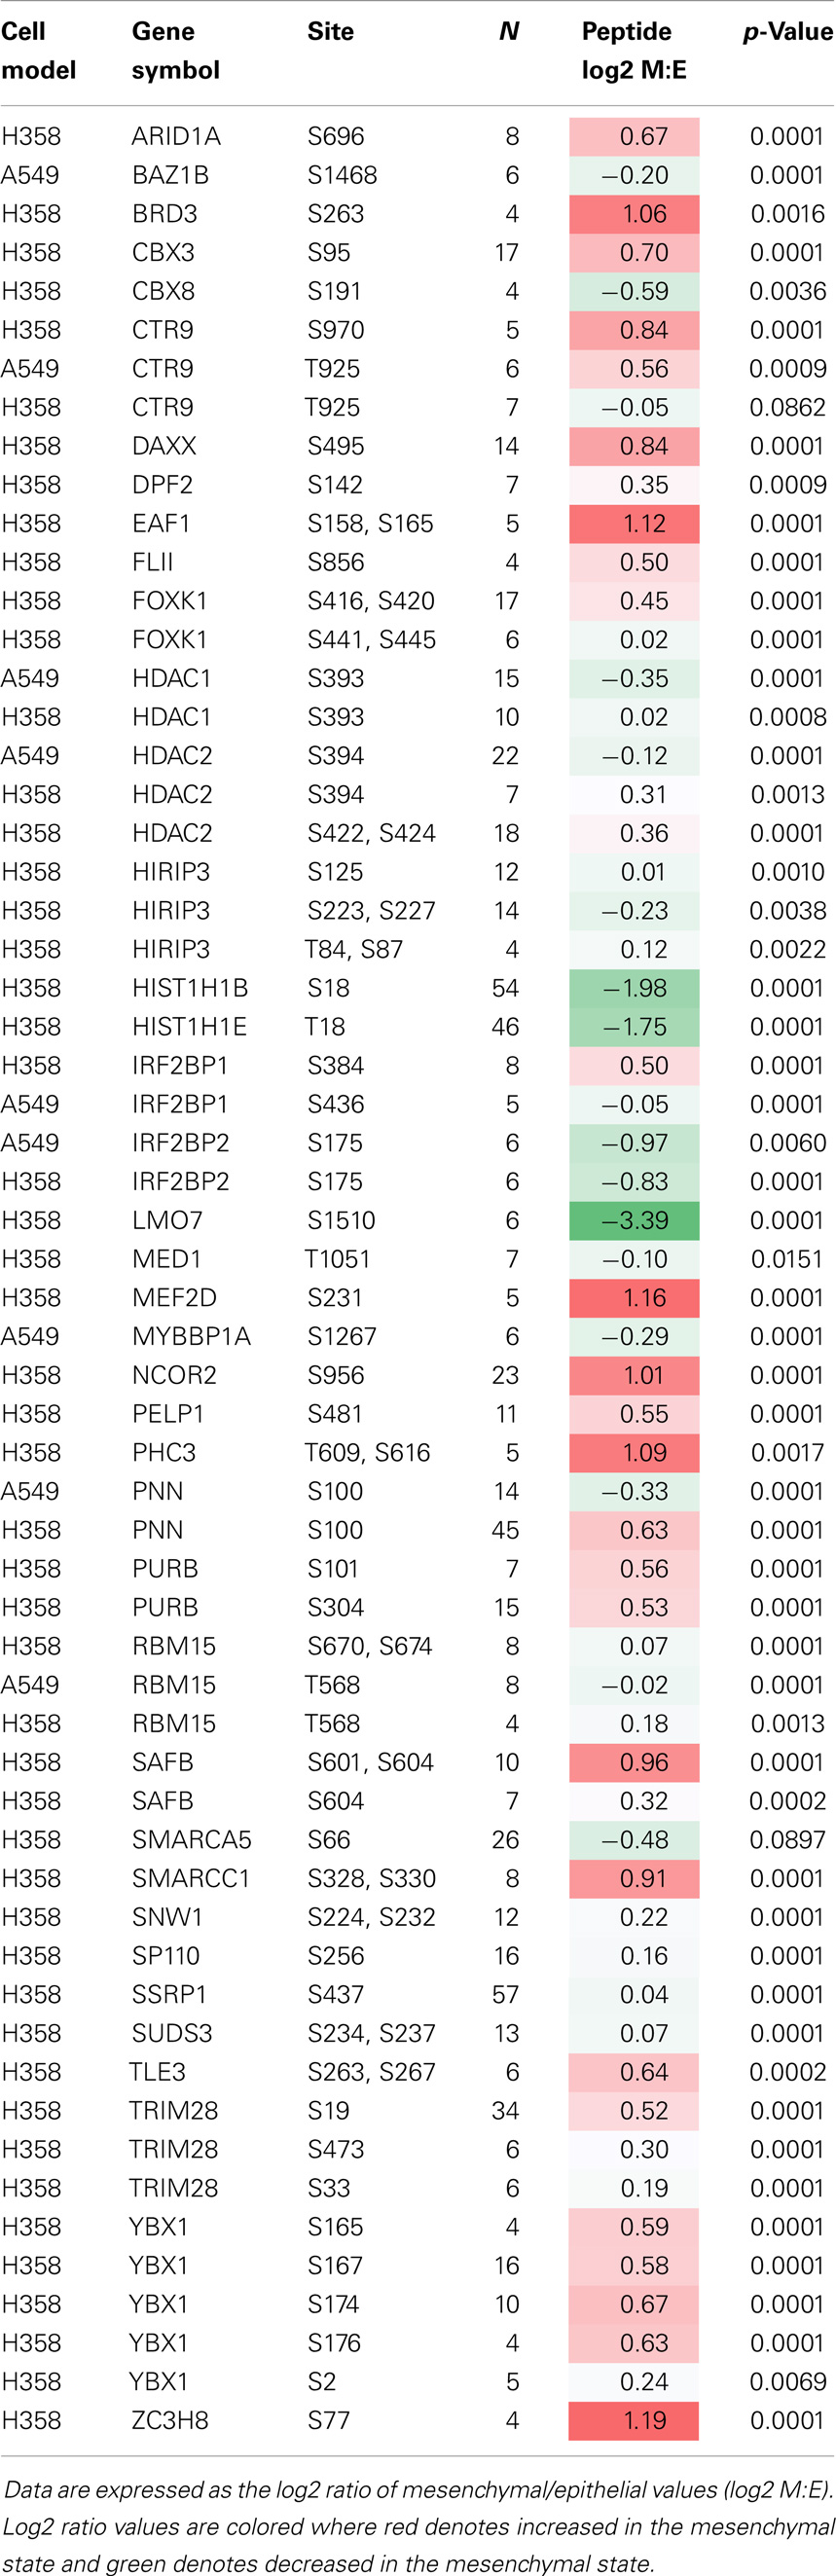
Table 3. Statistical analysis of phosphopeptide changes with EMT state, from proteins specifically associated with transcriptional function (where N ≥ 4).
The PAF1 complex protein CTR9/SH2BP1, which plays a role in the maintenance of ESC pluripotency showed phosphosite regulation at T925 (A549) and S970 (H358) (Table 3). Additional transcriptional and epigenetic regulators were found to be modified by phosphorylation, including NCOR2/SMRT, MEF2D, FOXK1, BRD3, and the PRC1 component PHC3. Decreased phosphorylation of the bromodomain protein kinase BAZ1B/WSTF at position S1468, increased phosphorylation of EAF1 at sites S158 and S165 were observed. The phosphorylation of TRIM28/KAP1 S473, likely by CHK2, inhibits co-repression of CDKN1A/p21 (89), and may contribute the observed attenuation of cell cycling. ZC3H8 functions as a repressor of GATA3 and shows increased phosphorylation at position S77 in mesenchymal H358 cells, where GATA3 has been associated with the TGFβ growth suppression response (90).
Early Transcriptional Events in the Trans-Differentiation of Mutant-KRas NSCLC Models
We asked whether key transcription factors, highlighted by GSEA correlations, might show coordinate early expression during mesenchymal transition. RNA samples were isolated from the H358 model following TGFβ induction at 0, 1, 2, 4, 8, 16, 24, 72 h, 7 days (~168 h), 21 days (~500 h), and the long term/steady-state condition (>4500 h), and duplicate samples sequenced. TGFβ1 served as an internal control, where expression was observed within 1 h after addition of doxycycline.
The exchange of cell cycle inhibition with migratory and invasive gene activation programs is a hallmark of metastable mesenchymal trans-differentiation. Reduced RNA expression of cell cycle activators and increased expression of inhibitors was observed and served as a benchmark (Table 4). Early in the EMT epigenetic reprograming, inhibition of E2F family, MCM family, CCNE1 and CDCA7L gene products, and an increase in BTG2 expression was observed. This was accompanied by reduced phosphorylation of Histone H1B and H1E at positions S18 and T18, respectively (Table 3). Both sites are cell cycle sensitive, where T18 is a known CDK1 and CDK2 site.
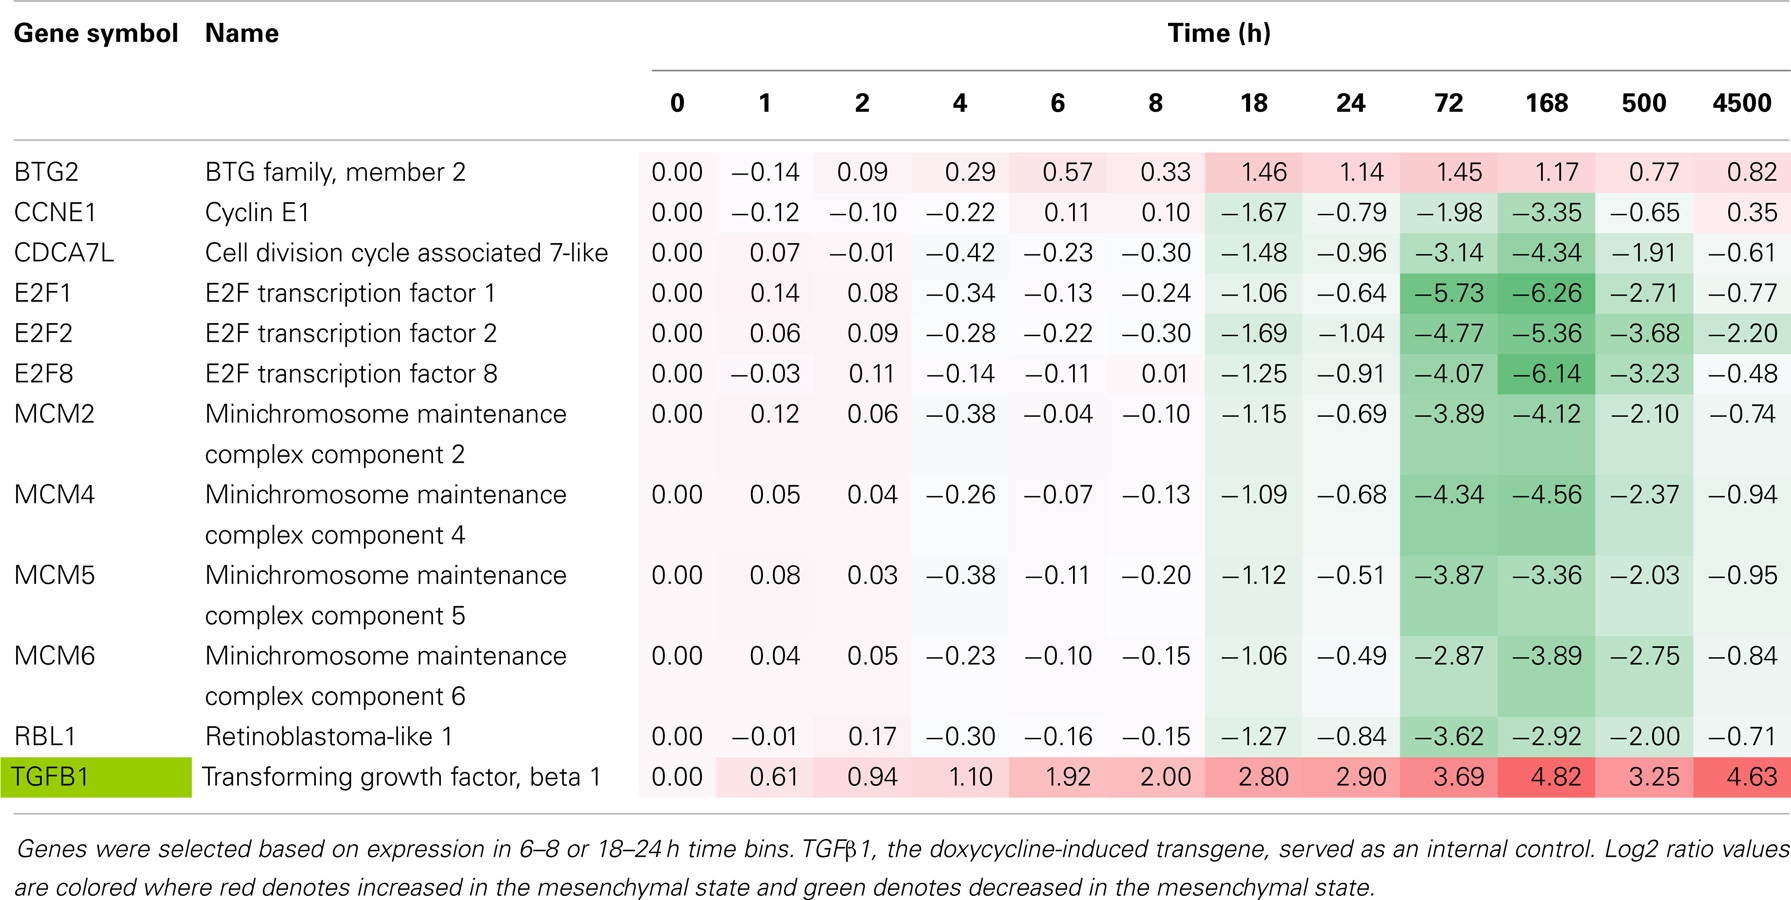
Table 4. Time course of cell cycle regulator RNA expression, comparing H358 mesenchymal–epithelial RNA abundance (log2 ratios).
We then examined changes in RNA abundance for encoded transcriptional and epigenetic regulators. We identified 81 transcriptional and epigenetic regulators expressed at early time points in primarily two time bins (6–8 and 18–24 h; Table 5). ELF3, ATOH8, EAF2, MYC, IRX5, CITED2, and ID2 showed relatively rapid repression ~8 h after induction, which was continued at later time points. ELF3 encodes an E74-like domain transcription factor, which is epithelial-specific. FOXS1, STAT5A, and HIC1 were increased at the early, continuing on to later time points. By 18–24 h HR, FOXR2, SOX2, RORA, and VSX1 showed a decrease in RNA abundance, while FOXS1, DMBX1, CDMBX1, CITED4, RORC, VGLL3, RUNX3, and BHLHE40 were markedly increased. The homeodomain transcription factor DMBX1 has been shown to be required for reprograming of induced pluripotent stem cells, and for midbrain development (91). Several transcription regulators showed biphasic expression, where an early decrease in RNA abundance was followed by an increase at the >6 months steady-state time point for the helix-loop-helix dominant negative E-box binding inhibitor ID2 and RAR-related orphan receptor RORA, while the reverse was true for PBX/knotted 1 homeobox 2 (PKNOX2), which was increased at early time points and markedly attenuated by 21 days (Table 5).
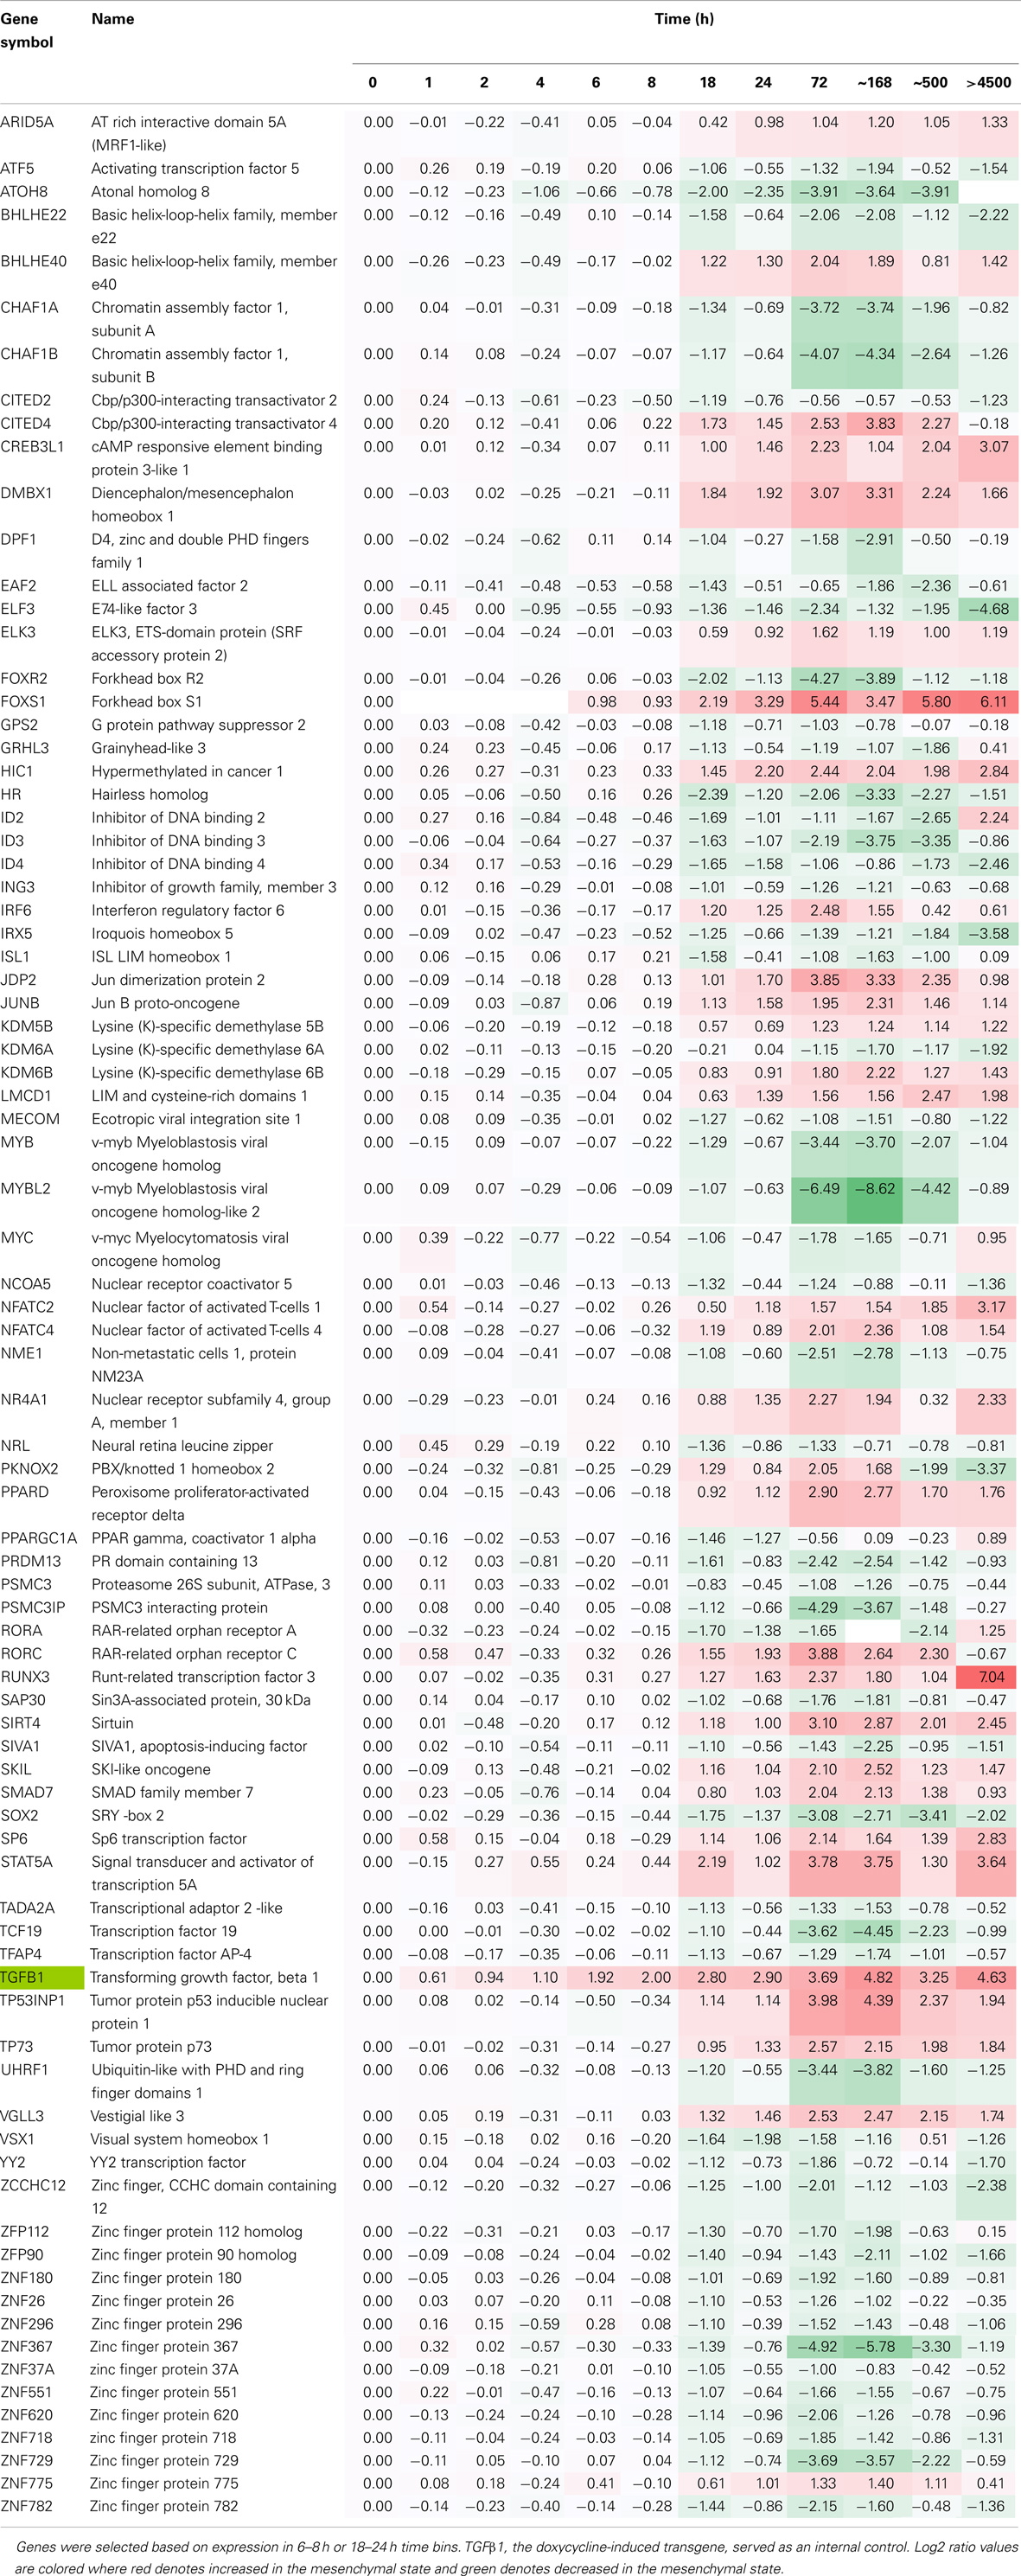
Table 5. Time course of transcription factor RNA expression, comparing H358 mesenchymal–epithelial RNA abundance (log2 ratios).
Genes from the 6–8 and 18–24 h sets (16,058 genes each) were used for GSEA correlations using oncogene and curated signature datasets. The top ranked gene signatures, divided into functional families and correlating with early and middle time points are shown in Table 6. The LEF1 and NFκB activation signatures and BMI1 and EZH2 inhibition signatures were correlated with the mesenchymal state at early time points. Interestingly, HOXA9 target gene inhibition also was correlated with the mesenchymal state, where crosstalk between HOXA9 and BMI1 can impact cell cycling and senescence programs (92). The positive correlation of the mesenchymal state with HIF1 hypoxia signaling, embryonic stem cell programs, and STAT signaling were observed at the early time points. A mesenchymal correlation with Myc target inhibition also was an early event (Table 6). Multiple cell cycle signatures correlated the mesenchymal state with cell cycle inhibition at early time points, consistent with previous complete EMT endpoint data (Tables 1 and 2).
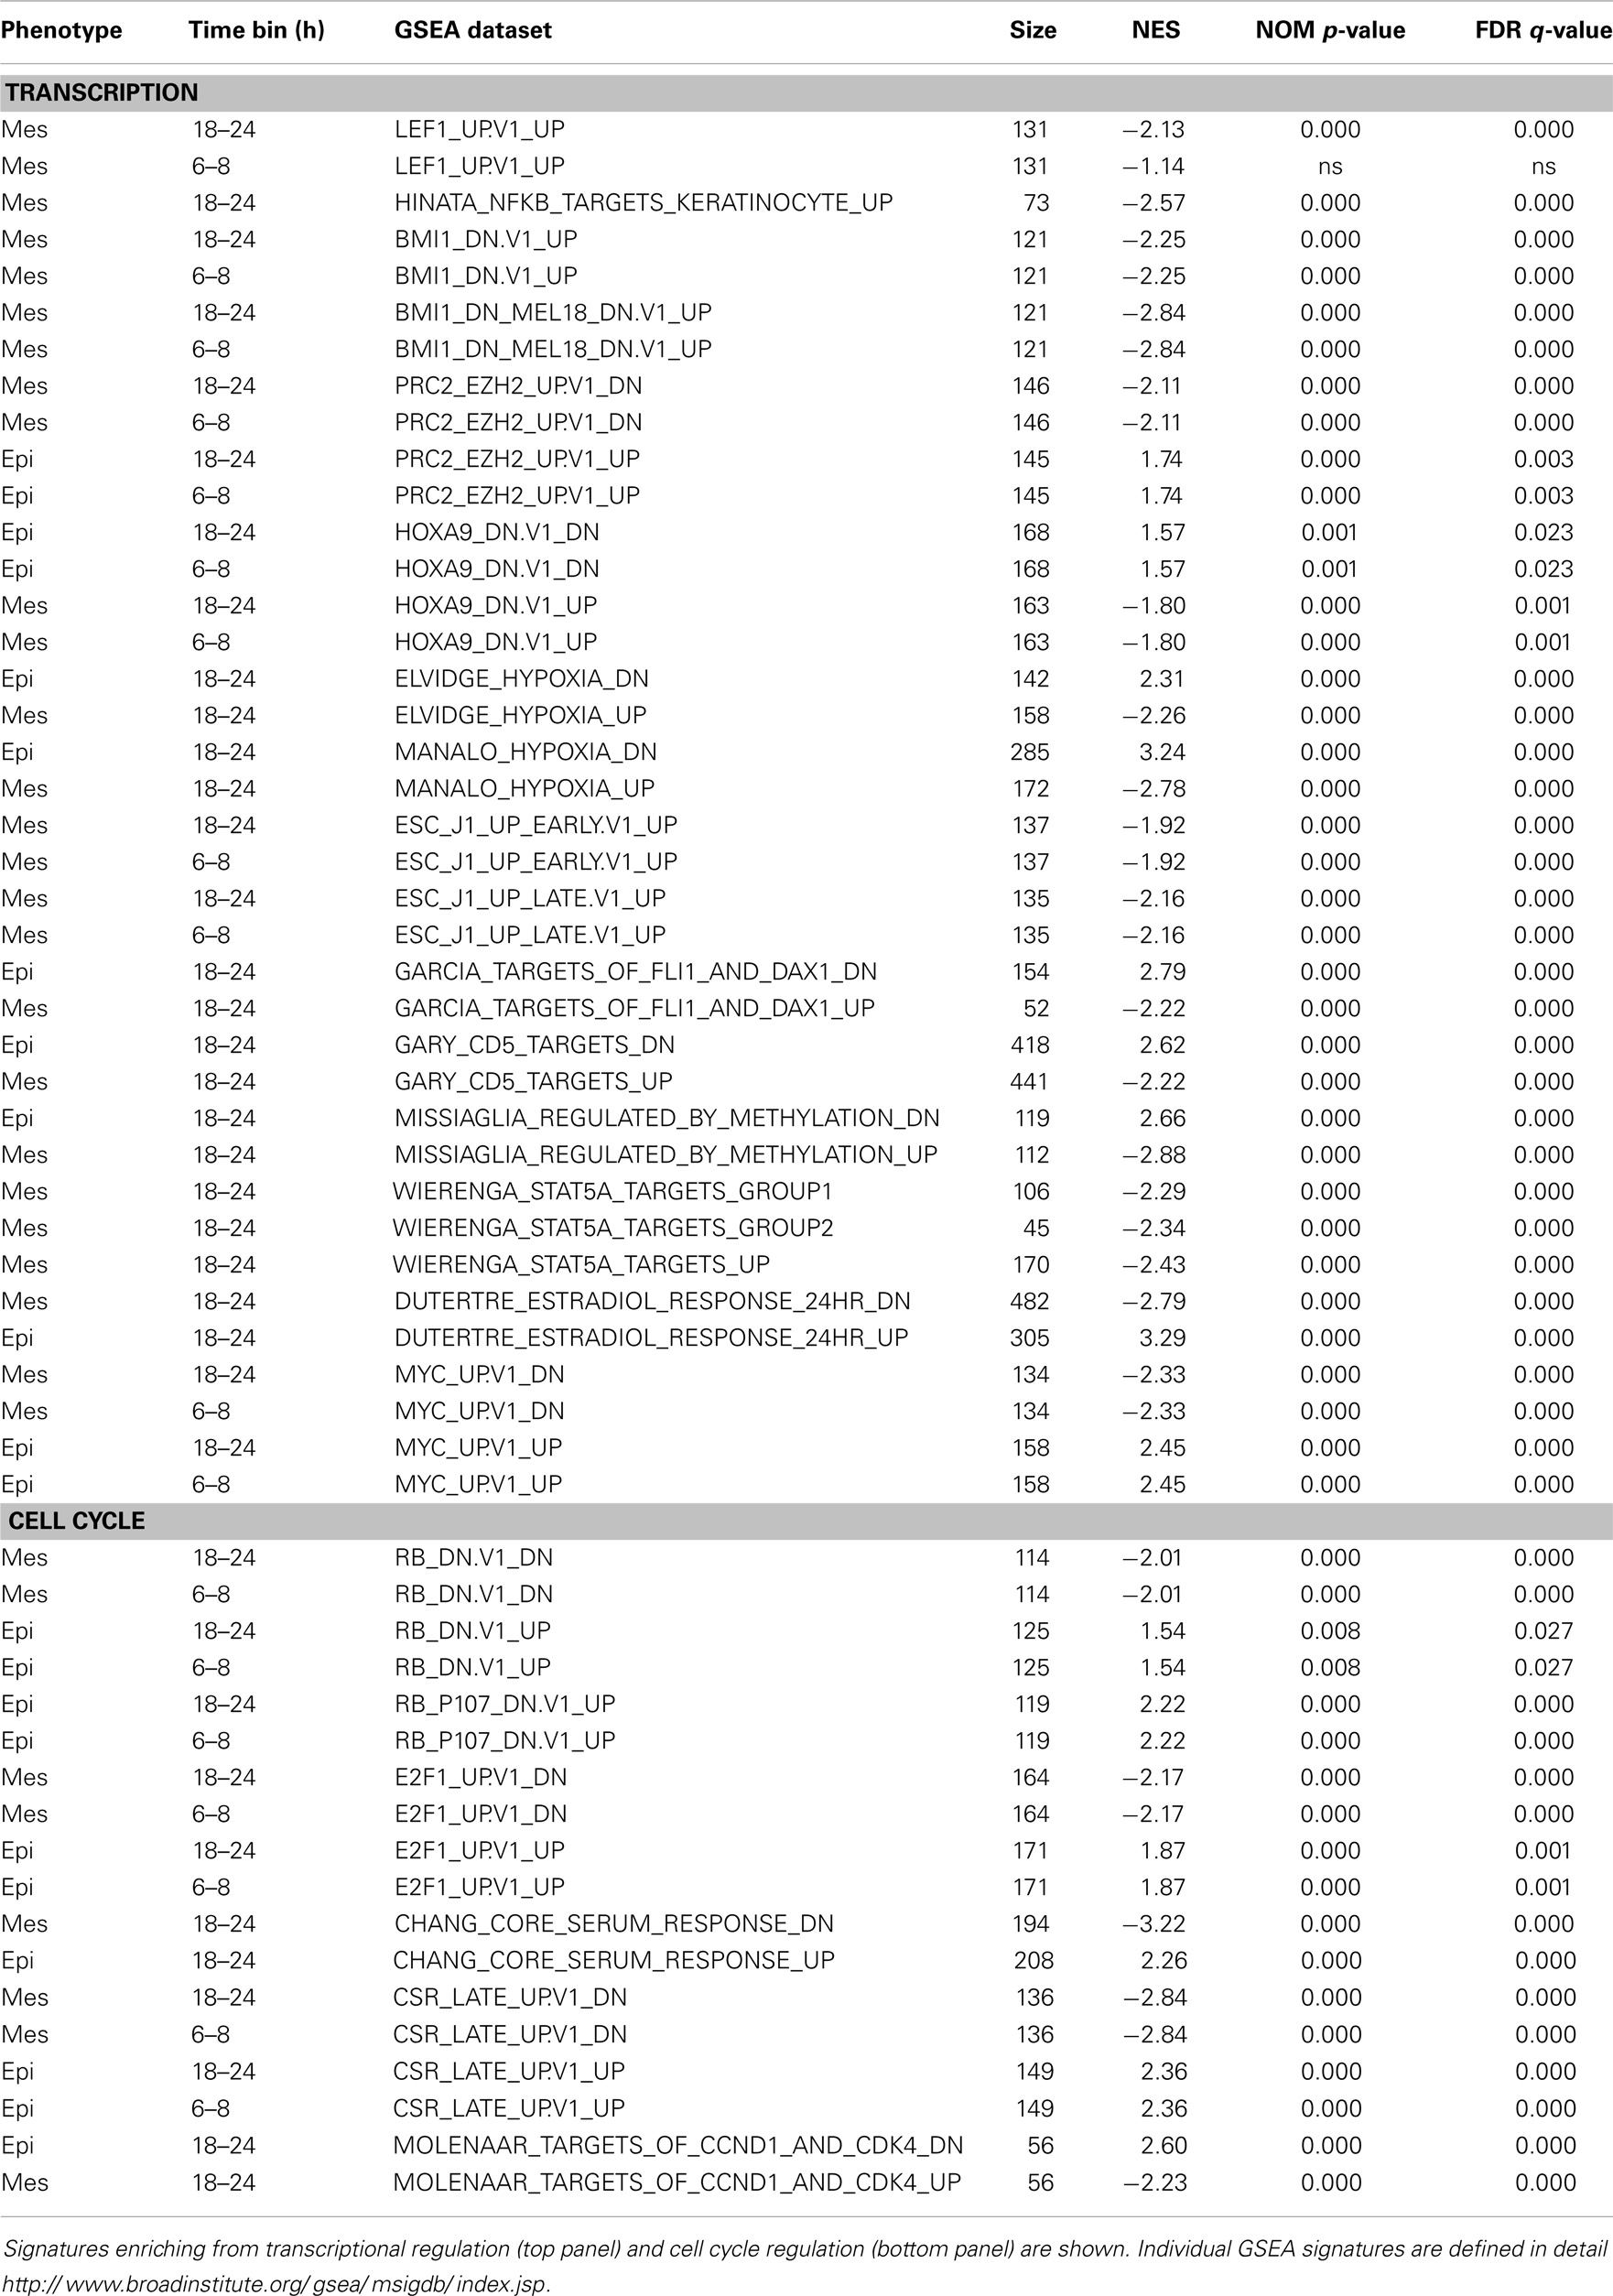
Table 6. Gene-set enrichment (GSEA) for RNA showing a close to or greater than twofold change between mesenchymal and epithelial cell states, by 6–8 h or by 18–24 h time bins.
Discussion
A detailed investigation of molecular differences contrasting isogenic epithelial and stem-like mesenchymal tumor cell states has been undertaken in isogenic lung adenocarcinoma cell models harboring mutant-KRas. Our observations reinforce the important role that cancer stemness and EMT can have in driving drug resistance in tumor cells (7, 8, 12, 17, 93) and highlight the wide diversity of mechanisms (94) that can be used by tumor cells to evade targeted- and chemo-therapies. Agents and combinations successfully targeting mutant-KRas containing tumor cells, in an epithelial or mesenchymal cell context, would have a marked impact in the treatment of NSCLC and particularly pancreas cancer where trans-differentiation is a frequent event (22). An understanding of these mechanisms and molecular contexts will have important implications in driving combinatorial drug therapy in cancer patients in the future.
Mutation of the KRas oncoprotein leads to the interaction and activation of BRaf/CRaf and Mek1/2 kinases and phosphorylation of Erk1/2 on the activation segment. Erk1/2 phosphorylation on the loop TXY motif activated Erk1/2 catalytic activity and leads to downstream cytoplasmic and nuclear pro-survival substrate target phosphorylation. In both A549 and H358 models, a markedly increased Erk active site phosphorylation was observed in the mesenchymal state (Table S3 in Supplementary Material). Similar to the H358 and A549 models described here we have observed TGFβ mediated induction of EMT in mt-EGFR NSCLC adenocarcinoma lines HCC4006 and HCC827 (data not shown). A common feature in both mt-KRas and mt-EGFR models is an elevated activation of the Erk1/2 kinases. These data support a hypothesis that chronic Erk activation may contribute to the initiation of EMT, and once EMT has occurred, Erk is further activated in part through integrin/paxillin/FAK and TGFbetaR1 signaling networks. Thus we suggest that KRas, through Erk, may act as both to prime initiation of EMT and to maintain the mesenchymal state once a transition has occurred. Preliminary RNA interference studies indicate enhanced mesenchymal cell sensitivity to Erk1/2 knockdown. Interestingly, synthetic lethality in multiple mt-KRas backgrounds has been observed with knockdown of Snail2/Slug (95).
Though our principle interest is in identifying key survival targets required for the viability of cells in the mesenchymal state, we considered that druggable transcriptional or epigenetic regulators acting early in the EMT process might serve as useful candidates. Previous studies have highlighted the heterogeneity of distinct EMT programs and the plethora of potential targets, for example, FGFR (57), Axl (96), PDGFR (97), JAK-STAT (98, 99), FAK (100), contributing to the viability of mesenchymal-like tumor cells in a model specific manner. Given the complex nature of epigenetic changes occurring as cells transition from epithelial to mesenchymal states, we specifically defined networks, which can modulate epigenetic states. The rationale is that pharmacological modulation of epigenetic regulators can alter the expression of many potential mesenchymal drug targets, potentially overcoming the redundancy and heterogeneity of mesenchymal therapeutic targets. Here, we have identified multiple epigenetic regulatory networks, for example, the PRC1 complex, HP1γ, and BAF/Swi-Snf complex, which can contribute to the formation and maintenance of epithelial and mesenchymal tumor cell states. Overlapping transcriptional programs also were observed, for example, the redundant loss of epithelial state transcription (GRHL2, TRAPC2, EHF, and OSR2) and splicing (ESRP1 and ESRP2) factors. This theme of modulation of overlapping or redundant network components was also observed for enhancers of the mesenchymal cell state (e.g., overlapping Zeb1/2, Snail1/2, Twist) and chromatin reprograming machinery. Synthetic lethality and therapeutic reprograming of the mt-KRas NSCLC models can be investigated by future RNAi or CRISPR approaches and/or cDNA overexpression studies, using the transcriptional and epigenetic nodes defined.
Conflict of Interest Statement
The authors declare that the research was conducted in the absence of any commercial or financial relationships that could be construed as a potential conflict of interest.
Acknowledgments
We thank Melissa Monaghan, Wei Li, and Jiang Wang for technical assistance.
Supplementary Material
The Supplementary Material for this article can be found online at http://www.frontiersin.org/Journal/10.3389/fonc.2014.00344/abstract
Table S1. Excel format table of RSEM normalized H358 and A549 genes from RNA-Seq, edited where any read is non-zero.
Table S2. Excel file of H358 and A549 phosphopeptides identified at 95% confidence from ProteinPilot v4.0, where individual peptide spectra were acquired four or more times.
Table S3. Excel file of concordant phosphopeptide changes in the H358 and A549 models (where N ≥ 4).
Table S4. Concordant protein changes between A549 and H358 models. All proteins were identified at >95% confidence with two or more unique peptides to conform to recommendations of Bradshaw et al. ( 38). Protein isoform abundance was measured by LC-MS/MS of SILAC labeled peptides and ratios between mesenchymal and epithelial cell states log2 linear scaled. Log2 ratio values in italics reflect p < 0.05. The number of unique peptides identified at 95% confidence, not shared with related proteins, are shown.
Table S5. Expected benchmark GSEA and pathway prediction signatures (IPA) for stemness, TGFβ signaling, and mutant-KRas signaling in H358 and A549 KRas NSCLC models comparing isogenic epithelial and mesenchymal cell states. These correlations serve as expected benchmarks for (A) stemness (Mani, Thomson ref), active TGFβ signaling (EMT inducer in both models) and (B) KRas signaling (KRas oncogene in both models). KRas signatures were enhanced in the mesenchymal cell state relative to the isogenic epithelial state, consistent with enhanced phospho-Erk in mesenchymal A549 and H358 cell states (23, 57). Individual GSEA signatures are defined in detail at http://www.broadinstitute.org/gsea/msigdb/index.jsp.
Table S6. Reference RNA expression of transcriptional inducers of EMT (top panel) and potential markers of stemness (bottom panel).
Table S7. GSEA and pathway prediction analysis (IPA) shows statistically significant enrichment of BMI1 target genes altered with EMT state. Manual analysis of BMI1 target RNA expression indicating divergence in the direction of signaling between H358 and A549 and divergence within each model, suggesting while BMI1 target genes are enriched and differentially expressed with changing EMT state, the direction is not uniform and other factor(s) likely contribute along with BMI1.
Figure S1. Immunoblot staining for fibronectin, E-cadherin, vimentin, the doxycycline-induced TGFβ1 transgene, and actin (control) in the H358-dox-TGFβ model in epithelial (−dox) or mesenchymal (+dox) states (5 days on doxycycline).
Footnotes
References
1. Chaffer CL, Weinberg RA. A perspective on cancer cell metastasis. Science (2011) 331(6024):1559–64. doi: 10.1126/science.1203543
2. Gupta GP, Massague J. Cancer metastasis: building a framework. Cell (2006) 127(4):679–95. doi:10.1016/j.cell.2006.11.001
Pubmed Abstract | Pubmed Full Text | CrossRef Full Text | Google Scholar
3. Hanahan D, Weinberg RA. Hallmarks of cancer: the next generation. Cell (2011) 144(5):646–74. doi:10.1016/j.cell.2011.02.013
4. Kalluri R, Weinberg RA. The basics of epithelial-mesenchymal transition. J Clin Invest (2009) 119(6):1420–8. doi:10.1172/JCI39104
Pubmed Abstract | Pubmed Full Text | CrossRef Full Text | Google Scholar
5. Thiery JP. Epithelial-mesenchymal transitions in tumour progression. Nat Rev Cancer (2002) 2(6):442–54. doi:10.1038/nrc822
6. Thiery JP, Acloque H, Huang RY, Nieto MA. Epithelial-mesenchymal transitions in development and disease. Cell (2009) 139(5):871–90. doi:10.1016/j.cell.2009.11.007
Pubmed Abstract | Pubmed Full Text | CrossRef Full Text | Google Scholar
7. Sequist LV, Waltman BA, Dias-Santagata D, Digumarthy S, Turke AB, Fidias P, et al. Genotypic and histological evolution of lung cancers acquiring resistance to EGFR inhibitors. Sci Transl Med (2011) 3(75):75ra26. doi:10.1126/scitranslmed.3002003
Pubmed Abstract | Pubmed Full Text | CrossRef Full Text | Google Scholar
8. Thomson S, Buck E, Petti F, Griffin G, Brown E, Ramnarine N, et al. Epithelial to mesenchymal transition is a determinant of sensitivity of non-small-cell lung carcinoma cell lines and xenografts to epidermal growth factor receptor inhibition. Cancer Res (2005) 65(20):9455–62. doi:10.1158/0008-5472.CAN-05-1058
Pubmed Abstract | Pubmed Full Text | CrossRef Full Text | Google Scholar
9. Moreno-Bueno G, Portillo F, Cano A. Transcriptional regulation of cell polarity in EMT and cancer. Oncogene (2008) 27(55):6958–69. doi:10.1038/onc.2008.346
Pubmed Abstract | Pubmed Full Text | CrossRef Full Text | Google Scholar
10. Yamaguchi H, Wyckoff J, Condeelis J. Cell migration in tumors. Curr Opin Cell Biol (2005) 17(5):559–64. doi:10.1016/j.ceb.2005.08.002
11. Brabletz T, Jung A, Spaderna S, Hlubek F, Kirchner T. Opinion: migrating cancer stem cells – an integrated concept of malignant tumour progression. Nat Rev Cancer (2005) 5(9):744–9. doi:10.1038/nrc1694
Pubmed Abstract | Pubmed Full Text | CrossRef Full Text | Google Scholar
12. Mani SA, Guo W, Liao MJ, Eaton EN, Ayyanan A, Zhou AY, et al. The epithelial-mesenchymal transition generates cells with properties of stem cells. Cell (2008) 133(4):704–15. doi:10.1016/j.cell.2008.03.027
Pubmed Abstract | Pubmed Full Text | CrossRef Full Text | Google Scholar
13. Pao W, Wang TY, Riely GJ, Miller VA, Pan Q, Ladanyi M, et al. KRAS mutations and primary resistance of lung adenocarcinomas to gefitinib or erlotinib. PLoS Med (2005) 2(1):e73. doi:10.1371/journal.pmed.0020073
Pubmed Abstract | Pubmed Full Text | CrossRef Full Text | Google Scholar
14. Sun JM, Hwang DW, Ahn JS, Ahn MJ, Park K. Prognostic and predictive value of KRAS mutations in advanced non-small cell lung cancer. PLoS One (2013) 8(5):e64816. doi:10.1371/journal.pone.0064816
Pubmed Abstract | Pubmed Full Text | CrossRef Full Text | Google Scholar
15. Oft M, Peli J, Rudaz C, Schwarz H, Beug H, Reichmann E. TGF-beta1 and Ha-Ras collaborate in modulating the phenotypic plasticity and invasiveness of epithelial tumor cells. Genes Dev (1996) 10(19):2462–77. doi:10.1101/gad.10.19.2462
Pubmed Abstract | Pubmed Full Text | CrossRef Full Text | Google Scholar
16. Shao DD, Xue W, Krall EB, Bhutkar A, Piccioni F, Wang X, et al. KRAS and YAP1 converge to regulate EMT and tumor survival. Cell (2014) 158(1):171–84. doi:10.1016/j.cell.2014.06.004
Pubmed Abstract | Pubmed Full Text | CrossRef Full Text | Google Scholar
17. Creighton CJ, Li X, Landis M, Dixon JM, Neumeister VM, Sjolund A, et al. Residual breast cancers after conventional therapy display mesenchymal as well as tumor-initiating features. Proc Natl Acad Sci U S A (2009) 106(33):13820–5. doi:10.1073/pnas.0905718106
Pubmed Abstract | Pubmed Full Text | CrossRef Full Text | Google Scholar
18. Herschkowitz JI, Zhao W, Zhang M, Usary J, Murrow G, Edwards D, et al. Comparative oncogenomics identifies breast tumors enriched in functional tumor-initiating cells. Proc Natl Acad Sci U S A (2012) 109(8):2778–83. doi:10.1073/pnas.1018862108
Pubmed Abstract | Pubmed Full Text | CrossRef Full Text | Google Scholar
19. Domingo-Domenech J, Vidal SJ, Rodriguez-Bravo V, Castillo-Martin M, Quinn SA, Rodriguez-Barrueco R, et al. Suppression of acquired docetaxel resistance in prostate cancer through depletion of notch- and hedgehog-dependent tumor-initiating cells. Cancer Cell (2012) 22(3):373–88. doi:10.1016/j.ccr.2012.07.016
Pubmed Abstract | Pubmed Full Text | CrossRef Full Text | Google Scholar
20. Byers LA, Diao L, Wang J, Saintigny P, Girard L, Peyton M, et al. An epithelial-mesenchymal transition gene signature predicts resistance to EGFR and PI3K inhibitors and identifies Axl as a therapeutic target for overcoming EGFR inhibitor resistance. Clin Cancer Res (2013) 19(1):279–90. doi:10.1158/1078-0432.CCR-12-1558
Pubmed Abstract | Pubmed Full Text | CrossRef Full Text | Google Scholar
21. Moody SE, Perez D, Pan TC, Sarkisian CJ, Portocarrero CP, Sterner CJ, et al. The transcriptional repressor Snail promotes mammary tumor recurrence. Cancer Cell (2005) 8(3):197–209. doi:10.1016/j.ccr.2005.07.009
Pubmed Abstract | Pubmed Full Text | CrossRef Full Text | Google Scholar
22. Rhim AD, Mirek ET, Aiello NM, Maitra A, Bailey JM, McAllister F, et al. EMT and dissemination precede pancreatic tumor formation. Cell (2012) 148(1–2):349–61. doi:10.1016/j.cell.2011.11.025
Pubmed Abstract | Pubmed Full Text | CrossRef Full Text | Google Scholar
23. Thomson S, Petti F, Sujka-Kwok I, Mercado P, Bean J, Monaghan M, et al. A systems view of epithelial-mesenchymal transition signaling states. Clin Exp Metastasis (2010) 28(2):137–55. doi:10.1007/s10585-010-9367-3
Pubmed Abstract | Pubmed Full Text | CrossRef Full Text | Google Scholar
24. Argast GM, Krueger JS, Thomson S, Sujka-Kwok I, Carey K, Silva S, et al. Inducible expression of TGFbeta, snail and Zeb1 recapitulates EMT in vitro and in vivo in a NSCLC model. Clin Exp Metastasis (2011) 28(7):593–614. doi:10.1007/s10585-011-9394-8
Pubmed Abstract | Pubmed Full Text | CrossRef Full Text | Google Scholar
25. Bhowmick NA, Ghiassi M, Bakin A, Aakre M, Lundquist CA, Engel ME, et al. Transforming growth factor-beta1 mediates epithelial to mesenchymal transdifferentiation through a RhoA-dependent mechanism. Mol Biol Cell (2001) 12(1):27–36. doi:10.1091/mbc.12.1.27
Pubmed Abstract | Pubmed Full Text | CrossRef Full Text | Google Scholar
26. Qian BZ, Pollard JW. Macrophage diversity enhances tumor progression and metastasis. Cell (2010) 141(1):39–51. doi:10.1016/j.cell.2010.03.014
Pubmed Abstract | Pubmed Full Text | CrossRef Full Text | Google Scholar
27. Liu J, Lee W, Jiang Z, Chen Z, Jhunjhunwala S, Haverty PM, et al. Genome and transcriptome sequencing of lung cancers reveal diverse mutational and splicing events. Genome Res (2012) 22(12):2315–27. doi:10.1101/gr.140988.112
Pubmed Abstract | Pubmed Full Text | CrossRef Full Text | Google Scholar
28. Gossen M, Bonin AL, Freundlieb S, Bujard H. Inducible gene expression systems for higher eukaryotic cells. Curr Opin Biotechnol (1994) 5(5):516–20. doi:10.1016/0958-1669(94)90067-1
Pubmed Abstract | Pubmed Full Text | CrossRef Full Text | Google Scholar
29. Li B, Dewey CN. RSEM: accurate transcript quantification from RNA-Seq data with or without a reference genome. BMC Bioinformatics (2011) 12:323. doi:10.1186/1471-2105-12-323
Pubmed Abstract | Pubmed Full Text | CrossRef Full Text | Google Scholar
30. Trapnell C, Williams BA, Pertea G, Mortazavi A, Kwan G, van Baren MJ, et al. Transcript assembly and quantification by RNA-Seq reveals unannotated transcripts and isoform switching during cell differentiation. Nat Biotechnol (2010) 28(5):511–5. doi:10.1038/nbt.1621
Pubmed Abstract | Pubmed Full Text | CrossRef Full Text | Google Scholar
31. Ong SE, Blagoev B, Kratchmarova I, Kristensen DB, Steen H, Pandey A, et al. Stable isotope labeling by amino acids in cell culture, SILAC, as a simple and accurate approach to expression proteomics. Mol Cell Proteomics (2002) 1(5):376–86. doi:10.1074/mcp.M200025-MCP200
32. Rush J, Moritz A, Lee KA, Guo A, Goss VL, Spek EJ, et al. Immunoaffinity profiling of tyrosine phosphorylation in cancer cells. Nat Biotechnol (2005) 23(1):94–101. doi:10.1038/nbt1046
Pubmed Abstract | Pubmed Full Text | CrossRef Full Text | Google Scholar
33. Petti F, Thelemann A, Kahler J, McCormack S, Castaldo L, Hunt T, et al. Temporal quantitation of mutant kit tyrosine kinase signaling attenuated by a novel thiophene kinase inhibitor OSI-930. Mol Cancer Ther (2005) 4(8):1186–97. doi:10.1158/1535-7163.MCT-05-0114
Pubmed Abstract | Pubmed Full Text | CrossRef Full Text | Google Scholar
34. Thelemann A, Petti F, Griffin G, Iwata K, Hunt T, Settinari T, et al. Phosphotyrosine signaling networks in epidermal growth factor receptor overexpressing squamous carcinoma cells. Mol Cell Proteomics (2005) 4(4):356–76. doi:10.1074/mcp.M400118-MCP200
Pubmed Abstract | Pubmed Full Text | CrossRef Full Text | Google Scholar
35. Shilov IV, Seymour SL, Patel AA, Loboda A, Tang WH, Keating SP, et al. The paragon algorithm, a next generation search engine that uses sequence temperature values and feature probabilities to identify peptides from tandem mass spectra. Mol Cell Proteomics (2007) 6(9):1638–55. doi:10.1074/mcp.T600050-MCP200
Pubmed Abstract | Pubmed Full Text | CrossRef Full Text | Google Scholar
36. Craig R, Cortens JP, Beavis RC. Open source system for analyzing, validating, and storing protein identification data. J Proteome Res (2004) 3(6):1234–42. doi:10.1021/pr049882h
Pubmed Abstract | Pubmed Full Text | CrossRef Full Text | Google Scholar
37. Muraoka RS, Koh Y, Roebuck LR, Sanders ME, Brantley-Sieders D, Gorska AE, et al. Increased malignancy of Neu-induced mammary tumors overexpressing active transforming growth factor beta1. Mol Cell Biol (2003) 23(23):8691–703. doi:10.1128/MCB.23.23.8691-8703.2003
Pubmed Abstract | Pubmed Full Text | CrossRef Full Text | Google Scholar
38. Bradshaw RA, Burlingame AL, Carr S, Aebersold R. Reporting protein identification data: the next generation of guidelines. Mol Cell Proteomics (2006) 5(5):787–8. doi:10.1074/mcp.E600005-MCP200
39. Stark C, Breitkreutz BJ, Reguly T, Boucher L, Breitkreutz A, Tyers M. BioGRID: a general repository for interaction datasets. Nucleic Acids Res (2006) 34(Database issue):D535–9. doi:10.1093/nar/gkj109
Pubmed Abstract | Pubmed Full Text | CrossRef Full Text | Google Scholar
40. Hornbeck PV, Kornhauser JM, Tkachev S, Zhang B, Skrzypek E, Murray B, et al. PhosphoSitePlus: a comprehensive resource for investigating the structure and function of experimentally determined post-translational modifications in man and mouse. Nucleic Acids Res (2012) 40(Database issue):D261–70. doi:10.1093/nar/gkr1122
Pubmed Abstract | Pubmed Full Text | CrossRef Full Text | Google Scholar
41. Blick T, Hugo H, Widodo E, Waltham M, Pinto C, Mani SA, et al. Epithelial mesenchymal transition traits in human breast cancer cell lines parallel the CD44(hi/)CD24 (lo/-) stem cell phenotype in human breast cancer. J Mammary Gland Biol Neoplasia (2010) 15(2):235–52. doi:10.1007/s10911-010-9175-z
Pubmed Abstract | Pubmed Full Text | CrossRef Full Text | Google Scholar
42. Buck E, Eyzaguirre A, Barr S, Thompson S, Sennello R, Young D, et al. Loss of homotypic cell adhesion by epithelial-mesenchymal transition or mutation limits sensitivity to epidermal growth factor receptor inhibition. Mol Cancer Ther (2007) 6(2):532–41. doi:10.1158/1535-7163.MCT-06-0462
Pubmed Abstract | Pubmed Full Text | CrossRef Full Text | Google Scholar
43. Gupta PB, Fillmore CM, Jiang G, Shapira SD, Tao K, Kuperwasser C, et al. Stochastic state transitions give rise to phenotypic equilibrium in populations of cancer cells. Cell (2011) 146(4):633–44. doi:10.1016/j.cell.2011.07.026
Pubmed Abstract | Pubmed Full Text | CrossRef Full Text | Google Scholar
44. Mercer TR, Gerhardt DJ, Dinger ME, Crawford J, Trapnell C, Jeddeloh JA, et al. Targeted RNA sequencing reveals the deep complexity of the human transcriptome. Nat Biotechnol (2012) 30(1):99–104. doi:10.1038/nbt.2024
Pubmed Abstract | Pubmed Full Text | CrossRef Full Text | Google Scholar
45. Schmierer B, Hill CS. TGFbeta-SMAD signal transduction: molecular specificity and functional flexibility. Nat Rev Mol Cell Biol (2007) 8(12):970–82. doi:10.1038/nrm2297
Pubmed Abstract | Pubmed Full Text | CrossRef Full Text | Google Scholar
46. De Craene B, Gilbert B, Stove C, Bruyneel E, van Roy F, Berx G. The transcription factor snail induces tumor cell invasion through modulation of the epithelial cell differentiation program. Cancer Res (2005) 65(14):6237–44. doi:10.1158/0008-5472.CAN-04-3545
Pubmed Abstract | Pubmed Full Text | CrossRef Full Text | Google Scholar
47. Peinado H, Olmeda D, Cano A. Snail, Zeb and bHLH factors in tumour progression: an alliance against the epithelial phenotype? Nat Rev Cancer (2007) 7(6):415–28. doi:10.1038/nrc2131
Pubmed Abstract | Pubmed Full Text | CrossRef Full Text | Google Scholar
48. Spaderna S, Schmalhofer O, Wahlbuhl M, Dimmler A, Bauer K, Sultan A, et al. The transcriptional repressor ZEB1 promotes metastasis and loss of cell polarity in cancer. Cancer Res (2008) 68(2):537–44. doi:10.1158/0008-5472.CAN-07-5682
Pubmed Abstract | Pubmed Full Text | CrossRef Full Text | Google Scholar
49. Sullivan NJ, Sasser AK, Axel AE, Vesuna F, Raman V, Ramirez N, et al. Interleukin-6 induces an epithelial-mesenchymal transition phenotype in human breast cancer cells. Oncogene (2009) 28(33):2940–7. doi:10.1038/onc.2009.180
Pubmed Abstract | Pubmed Full Text | CrossRef Full Text | Google Scholar
50. Herzig M, Savarese F, Novatchkova M, Semb H, Christofori G. Tumor progression induced by the loss of E-cadherin independent of beta-catenin/Tcf-mediated Wnt signaling. Oncogene (2007) 26(16):2290–8. doi:10.1038/sj.onc.1210029
Pubmed Abstract | Pubmed Full Text | CrossRef Full Text | Google Scholar
51. Kim K, Daniels KJ, Hay ED. Tissue-specific expression of beta-catenin in normal mesenchyme and uveal melanomas and its effect on invasiveness. Exp Cell Res (1998) 245(1):79–90. doi:10.1006/excr.1998.4238
Pubmed Abstract | Pubmed Full Text | CrossRef Full Text | Google Scholar
52. Hinata K, Gervin AM, Jennifer Zhang Y, Khavari PA. Divergent gene regulation and growth effects by NF-kappa B in epithelial and mesenchymal cells of human skin. Oncogene (2003) 22(13):1955–64. doi:10.1038/sj.onc.1206198
Pubmed Abstract | Pubmed Full Text | CrossRef Full Text | Google Scholar
53. Dolled-Filhart M, McCabe A, Giltnane J, Cregger M, Camp RL, Rimm DL. Quantitative in situ analysis of beta-catenin expression in breast cancer shows decreased expression is associated with poor outcome. Cancer Res (2006) 66(10):5487–94. doi:10.1158/0008-5472.CAN-06-0100
Pubmed Abstract | Pubmed Full Text | CrossRef Full Text | Google Scholar
54. Birchmeier W, Weidner KM, Behrens J. Molecular mechanisms leading to loss of differentiation and gain of invasiveness in epithelial cells. J Cell Sci Suppl (1993) 17:159–64. doi:10.1242/jcs.1993.Supplement_17.23
Pubmed Abstract | Pubmed Full Text | CrossRef Full Text | Google Scholar
55. Schön M, Wienrich BG, Kneitz S, Sennefelder H, Amschler K, Vöhringer V, et al. KINK-1, a novel small-molecule inhibitor of IKKbeta, and the susceptibility of melanoma cells to antitumoral treatment. J Natl Cancer Inst (2008) 100(12):862–75. doi:10.1093/jnci/djn174
Pubmed Abstract | Pubmed Full Text | CrossRef Full Text | Google Scholar
56. Kim HD, Meyer AS, Wagner JP, Alford SK, Wells A, Gertler FB, et al. Signaling network state predicts twist-mediated effects on breast cell migration across diverse growth factor contexts. Mol Cell Proteomics (2011) 10(11):M111008433. doi:10.1074/mcp.M111.008433
Pubmed Abstract | Pubmed Full Text | CrossRef Full Text | Google Scholar
57. Thomson S, Petti F, Sujka-Kwok I, Epstein D, Haley JD. Kinase switching in mesenchymal-like non-small cell lung cancer lines contributes to EGFR inhibitor resistance through pathway redundancy. Clin Exp Metastasis (2008) 25(8):843–54. doi:10.1007/s10585-008-9200-4
Pubmed Abstract | Pubmed Full Text | CrossRef Full Text | Google Scholar
58. Brown MS, Diallo OT, Hu M, Ehsanian R, Yang X, Arun P, et al. CK2 modulation of NF-kappaB, TP53, and the malignant phenotype in head and neck cancer by anti-CK2 oligonucleotides in vitro or in vivo via sub-50-nm nanocapsules. Clin Cancer Res (2010) 16(8):2295–307. doi:10.1158/1078-0432.CCR-09-3200
Pubmed Abstract | Pubmed Full Text | CrossRef Full Text | Google Scholar
59. Lee SO, Jin UH, Kang JH, Kim SB, Guthrie AS, Sreevalsan S, et al. The orphan nuclear receptor NR4A1 (Nur77) regulates oxidative and endoplasmic reticulum stress in pancreatic cancer cells. Mol Cancer Res (2014) 12(4):527–38. doi:10.1158/1541-7786.MCR-13-0567
Pubmed Abstract | Pubmed Full Text | CrossRef Full Text | Google Scholar
60. Wilson AJ, Liu AY, Roland J, Adebayo OB, Fletcher SA, Slaughter JC, et al. TR3 modulates platinum resistance in ovarian cancer. Cancer Res (2013) 73(15):4758–69. doi:10.1158/0008-5472.CAN-12-4560
Pubmed Abstract | Pubmed Full Text | CrossRef Full Text | Google Scholar
61. Witta SE, Gemmill RM, Hirsch FR, Coldren CD, Hedman K, Ravdel L, et al. Restoring E-cadherin expression increases sensitivity to epidermal growth factor receptor inhibitors in lung cancer cell lines. Cancer Res (2006) 66(2):944–50. doi:10.1158/0008-5472.CAN-05-1988
Pubmed Abstract | Pubmed Full Text | CrossRef Full Text | Google Scholar
62. Yauch RL, Januario T, Eberhard DA, Cavet G, Zhu W, Fu L, et al. Epithelial versus mesenchymal phenotype determines in vitro sensitivity and predicts clinical activity of erlotinib in lung cancer patients. Clin Cancer Res (2005) 11(24 Pt 1):8686–98. doi:10.1158/1078-0432.CCR-05-1492
Pubmed Abstract | Pubmed Full Text | CrossRef Full Text | Google Scholar
63. Buck E, Eyzaguirre A, Rosenfeld-Franklin M, Thomson S, Mulvihill M, Barr S, et al. Feedback mechanisms promote cooperativity for small molecule inhibitors of epidermal and insulin-like growth factor receptors. Cancer Res (2008) 68(20):8322–32. doi:10.1158/0008-5472.CAN-07-6720
Pubmed Abstract | Pubmed Full Text | CrossRef Full Text | Google Scholar
64. Yang WH, Lan HY, Huang CH, Tai SK, Tzeng CH, Kao SY, et al. RAC1 activation mediates Twist1-induced cancer cell migration. Nat Cell Biol (2012) 14(4):366–74. doi:10.1038/ncb2455
Pubmed Abstract | Pubmed Full Text | CrossRef Full Text | Google Scholar
65. Wiederschain D, Chen L, Johnson B, Bettano K, Jackson D, Taraszka J, et al. Contribution of polycomb homologues Bmi-1 and Mel-18 to medulloblastoma pathogenesis. Mol Cell Biol (2007) 27(13):4968–79. doi:10.1128/MCB.02244-06
Pubmed Abstract | Pubmed Full Text | CrossRef Full Text | Google Scholar
66. Bracken AP, Dietrich N, Pasini D, Hansen KH, Helin K. Genome-wide mapping of polycomb target genes unravels their roles in cell fate transitions. Genes Dev (2006) 20(9):1123–36. doi:10.1101/gad.381706
Pubmed Abstract | Pubmed Full Text | CrossRef Full Text | Google Scholar
67. Silva J, García JM, Peña C, García V, Domínguez G, Suárez D, et al. Implication of polycomb members Bmi-1, Mel-18, and Hpc-2 in the regulation of p16INK4a, p14ARF, h-TERT, and c-Myc expression in primary breast carcinomas. Clin Cancer Res (2006) 12(23):6929–36. doi:10.1158/1078-0432.CCR-06-0788
Pubmed Abstract | Pubmed Full Text | CrossRef Full Text | Google Scholar
68. Kurklu B, Whitehead RH, Ong EK, Minamoto T, Fox JG, Mann JR, et al. Lineage-specific RUNX3 hypomethylation marks the preneoplastic immune component of gastric cancer. Oncogene (2014). doi:10.1038/onc.2014.233
Pubmed Abstract | Pubmed Full Text | CrossRef Full Text | Google Scholar
69. Hor YT, Voon DC, Koo JK, Wang H, Lau WM, Ashktorab H, et al. A role for RUNX3 in inflammation-induced expression of IL23A in gastric epithelial cells. Cell Rep (2014) 8(1):50–8. doi:10.1016/j.celrep.2014.06.003
Pubmed Abstract | Pubmed Full Text | CrossRef Full Text | Google Scholar
70. Li H, Zhou RJ, Zhang GQ, Xu JP. Clinical significance of RUNX2 expression in patients with nonsmall cell lung cancer: a 5-year follow-up study. Tumour Biol (2013) 34(3):1807–12. doi:10.1007/s13277-013-0720-4
Pubmed Abstract | Pubmed Full Text | CrossRef Full Text | Google Scholar
71. Niu DF, Kondo T, Nakazawa T, Oishi N, Kawasaki T, Mochizuki K, et al. Transcription factor Runx2 is a regulator of epithelial-mesenchymal transition and invasion in thyroid carcinomas. Lab Invest (2012) 92(8):1181–90. doi:10.1038/labinvest.2012.84
Pubmed Abstract | Pubmed Full Text | CrossRef Full Text | Google Scholar
72. Mercado-Pimentel ME, Hubbard AD, Runyan RB. Endoglin and Alk5 regulate epithelial-mesenchymal transformation during cardiac valve formation. Dev Biol (2007) 304(1):420–32. doi:10.1016/j.ydbio.2006.12.038
Pubmed Abstract | Pubmed Full Text | CrossRef Full Text | Google Scholar
73. Boregowda RK, Olabisi OO, Abushahba W, Jeong BS, Haenssen KK, Chen W, et al. RUNX2 is overexpressed in melanoma cells and mediates their migration and invasion. Cancer Lett (2014) 348(1–2):61–70. doi:10.1016/j.canlet.2014.03.011
Pubmed Abstract | Pubmed Full Text | CrossRef Full Text | Google Scholar
74. Kohn KW, Zeeberg BM, Reinhold WC, Pommier Y. Gene expression correlations in human cancer cell lines define molecular interaction networks for epithelial phenotype. PLoS One (2014) 9(6):e99269. doi:10.1371/journal.pone.0099269
Pubmed Abstract | Pubmed Full Text | CrossRef Full Text | Google Scholar
75. Cieply B, Farris J, Denvir J, Ford HL, Frisch SM. Epithelial-mesenchymal transition and tumor suppression are controlled by a reciprocal feedback loop between ZEB1 and Grainyhead-like-2. Cancer Res (2013) 73(20):6299–309. doi:10.1158/0008-5472.CAN-12-4082
Pubmed Abstract | Pubmed Full Text | CrossRef Full Text | Google Scholar
76. Woodfield GW, Chen Y, Bair TB, Domann FE, Weigel RJ. Identification of primary gene targets of TFAP2C in hormone responsive breast carcinoma cells. Genes Chromosomes Cancer (2010) 49(10):948–62. doi:10.1002/gcc.20807
Pubmed Abstract | Pubmed Full Text | CrossRef Full Text | Google Scholar
77. Ruiz M, Troncoso P, Bruns C, Bar-Eli M. Activator protein 2alpha transcription factor expression is associated with luminal differentiation and is lost in prostate cancer. Clin Cancer Res (2001) 7(12):4086–95.
78. Cyr AR, Kulak MV, Park JM, Bogachek MV, Spanheimer PM, Woodfield GW, et al. TFAP2C governs the luminal epithelial phenotype in mammary development and carcinogenesis. Oncogene (2014). doi:10.1038/onc.2013.569
Pubmed Abstract | Pubmed Full Text | CrossRef Full Text | Google Scholar
79. Spanheimer PM, Askeland RW, Kulak MV, Wu T, Weigel RJ. High TFAP2C/low CD44 expression is associated with an increased rate of pathologic complete response following neoadjuvant chemotherapy in breast cancer. J Surg Res (2013) 184(1):519–25. doi:10.1016/j.jss.2013.04.042
Pubmed Abstract | Pubmed Full Text | CrossRef Full Text | Google Scholar
80. Warzecha CC, Sato TK, Nabet B, Hogenesch JB, Carstens RP. ESRP1 and ESRP2 are epithelial cell-type-specific regulators of FGFR2 splicing. Mol Cell (2009) 33(5):591–601. doi:10.1016/j.molcel.2009.01.025
Pubmed Abstract | Pubmed Full Text | CrossRef Full Text | Google Scholar
81. Kawai S, Amano A. Negative regulation of odd-skipped related 2 by TGF-beta achieves the induction of cellular migration and the arrest of cell cycle. Biochem Biophys Res Commun (2012) 421(4):696–700. doi:10.1016/j.bbrc.2012.04.064
Pubmed Abstract | Pubmed Full Text | CrossRef Full Text | Google Scholar
82. Kwon SH, Workman JL. The heterochromatin protein 1 (HP1) family: put away a bias toward HP1. Mol Cells (2008) 26(3):217–27.
83. Vakoc CR, Mandat SA, Olenchock BA, Blobel GA. Histone H3 lysine 9 methylation and HP1gamma are associated with transcription elongation through mammalian chromatin. Mol Cell (2005) 19(3):381–91. doi:10.1016/j.molcel.2005.06.011
Pubmed Abstract | Pubmed Full Text | CrossRef Full Text | Google Scholar
84. Han SS, Kim WJ, Hong Y, Hong SH, Lee SJ, Ryu DR, et al. RNA sequencing identifies novel markers of non-small cell lung cancer. Lung Cancer (2014) 84(3):229–35. doi:10.1016/j.lungcan.2014.03.018
Pubmed Abstract | Pubmed Full Text | CrossRef Full Text | Google Scholar
85. Zhou J, Bi H, Zhan P, Chang C, Xu C, Huang X, et al. Overexpression of HP1gamma is associated with poor prognosis in non-small cell lung cancer cell through promoting cell survival. Tumour Biol (2014). doi:10.1007/s13277-014-2182-8
Pubmed Abstract | Pubmed Full Text | CrossRef Full Text | Google Scholar
86. Lomberk G, Bensi D, Fernandez-Zapico ME, Urrutia R. Evidence for the existence of an HP1-mediated subcode within the histone code. Nat Cell Biol (2006) 8(4):407–15. doi:10.1038/ncb1383
Pubmed Abstract | Pubmed Full Text | CrossRef Full Text | Google Scholar
87. Adenuga D, Rahman I. Protein kinase CK2-mediated phosphorylation of HDAC2 regulates co-repressor formation, deacetylase activity and acetylation of HDAC2 by cigarette smoke and aldehydes. Arch Biochem Biophys (2010) 498(1):62–73. doi:10.1016/j.abb.2010.04.002
Pubmed Abstract | Pubmed Full Text | CrossRef Full Text | Google Scholar
88. Tsai SC, Seto E. Regulation of histone deacetylase 2 by protein kinase CK2. J Biol Chem (2002) 277(35):31826–33. doi:10.1074/jbc.M204149200
Pubmed Abstract | Pubmed Full Text | CrossRef Full Text | Google Scholar
89. Shaltiel IA, Aprelia M, Saurin AT, Chowdhury D, Kops GJ, Voest EE, et al. Distinct phosphatases antagonize the p53 response in different phases of the cell cycle. Proc Natl Acad Sci U S A (2014) 111(20):7313–8. doi:10.1073/pnas.1322021111
Pubmed Abstract | Pubmed Full Text | CrossRef Full Text | Google Scholar
90. Chu IM, Lai WC, Aprelikova O, El Touny LH, Kouros-Mehr H, Green JE. Expression of GATA3 in MDA-MB-231 triple-negative breast cancer cells induces a growth inhibitory response to TGFss. PLoS One (2013) 8(4):e61125. doi:10.1371/journal.pone.0061125
Pubmed Abstract | Pubmed Full Text | CrossRef Full Text | Google Scholar
91. Ohtoshi A, Behringer RR. Neonatal lethality, dwarfism, and abnormal brain development in Dmbx1 mutant mice. Mol Cell Biol (2004) 24(17):7548–58. doi:10.1128/MCB.24.17.7548-7558.2004
Pubmed Abstract | Pubmed Full Text | CrossRef Full Text | Google Scholar
92. Smith LL, Yeung J, Zeisig BB, Popov N, Huijbers I, Barnes J, et al. Functional crosstalk between Bmi1 and MLL/Hoxa9 axis in establishment of normal hematopoietic and leukemic stem cells. Cell Stem Cell (2011) 8(6):649–62. doi:10.1016/j.stem.2011.05.004
Pubmed Abstract | Pubmed Full Text | CrossRef Full Text | Google Scholar
93. Creighton CJ, Massarweh S, Huang S, Tsimelzon A, Hilsenbeck SG, Osborne CK, et al. Development of resistance to targeted therapies transforms the clinically associated molecular profile subtype of breast tumor xenografts. Cancer Res (2008) 68(18):7493–501. doi:10.1158/0008-5472.CAN-08-1404
Pubmed Abstract | Pubmed Full Text | CrossRef Full Text | Google Scholar
94. Berx G, Raspé E, Christofori G, Thiery JP, Sleeman JP. Pre-EMTing metastasis? Recapitulation of morphogenetic processes in cancer. Clin Exp Metastasis (2007) 24(8):587–97. doi:10.1007/s10585-007-9114-6
Pubmed Abstract | Pubmed Full Text | CrossRef Full Text | Google Scholar
95. Wang Y, Ngo VN, Marani M, Yang Y, Wright G, Staudt LM, et al. Critical role for transcriptional repressor Snail2 in transformation by oncogenic RAS in colorectal carcinoma cells. Oncogene (2010) 29(33):4658–70. doi:10.1038/onc.2010.218
Pubmed Abstract | Pubmed Full Text | CrossRef Full Text | Google Scholar
96. Gjerdrum C, Tiron C, Høiby T, Stefansson I, Haugen H, Sandal T, et al. Axl is an essential epithelial-to-mesenchymal transition-induced regulator of breast cancer metastasis and patient survival. Proc Natl Acad Sci U S A (2010) 107(3):1124–9. doi:10.1073/pnas.0909333107
Pubmed Abstract | Pubmed Full Text | CrossRef Full Text | Google Scholar
97. Matei D, Emerson RE, Lai YC, Baldridge LA, Rao J, Yiannoutsos C, et al. Autocrine activation of PDGFRalpha promotes the progression of ovarian cancer. Oncogene (2006) 25(14):2060–9. doi:10.1038/sj.onc.1209232
Pubmed Abstract | Pubmed Full Text | CrossRef Full Text | Google Scholar
98. Gao SP, Mark KG, Leslie K, Pao W, Motoi N, Gerald WL, et al. Mutations in the EGFR kinase domain mediate STAT3 activation via IL-6 production in human lung adenocarcinomas. J Clin Invest (2007) 117(12):3846–56. doi:10.1172/JCI31871
Pubmed Abstract | Pubmed Full Text | CrossRef Full Text | Google Scholar
99. Yao Z, Fenoglio S, Gao DC, Camiolo M, Stiles B, Lindsted T, et al. TGF-beta IL-6 axis mediates selective and adaptive mechanisms of resistance to molecular targeted therapy in lung cancer. Proc Natl Acad Sci U S A (2010) 107(35):15535–40. doi:10.1073/pnas.1009472107
Pubmed Abstract | Pubmed Full Text | CrossRef Full Text | Google Scholar
100. Cicchini C, Laudadio I, Citarella F, Corazzari M, Steindler C, Conigliaro A, et al. TGFbeta-induced EMT requires focal adhesion kinase (FAK) signaling. Exp Cell Res (2008) 314(1):143–52. doi:10.1016/j.yexcr.2007.09.005
Pubmed Abstract | Pubmed Full Text | CrossRef Full Text | Google Scholar
Keywords: tumor heterogeneity, epigenetic, transcription, systems biology, EMT
Citation: Haley JA, Haughney E, Ullman E, Bean J, Haley JD and Fink MY (2014) Altered transcriptional control networks with trans-differentiation of isogenic mutant-KRas NSCLC models. Front. Oncol. 4:344. doi: 10.3389/fonc.2014.00344
Received: 29 September 2014; Paper pending published: 26 October 2014;
Accepted: 17 November 2014; Published online: 08 December 2014.
Edited by:
Pierre Savagner, Institut National de la Santé et de la Recherche Médicale, FranceReviewed by:
Markus A. N. Hartl, University of Innsbruck, AustriaNavneet Momi, Boston Medical Center, USA
Copyright: © 2014 Haley, Haughney, Ullman, Bean, Haley and Fink. This is an open-access article distributed under the terms of the Creative Commons Attribution License (CC BY). The use, distribution or reproduction in other forums is permitted, provided the original author(s) or licensor are credited and that the original publication in this journal is cited, in accordance with accepted academic practice. No use, distribution or reproduction is permitted which does not comply with these terms.
*Correspondence: John D. Haley, Department of Pathology, Cancer Center, Stony Brook School of Medicine, Stony Brook, NY 11794, USA e-mail: john.haley@stonybrook.edu;
Marc Y. Fink, Department of Biomedical Sciences, LIU Post, 720 Northern Blvd, Brookville, NY 11548, USA e-mail: marc.fink@liu.edu