 Amber Frick1*
 Oscar T. Suzuki1
 Cristina Benton1
 Bethany Parks2
 Yuri Fedoriw3,4
 Kristy L. Richards4,5Russell S. Thomas2,6
 Tim Wiltshire1,4
- 1Division of Pharmacotherapy and Experimental Therapeutics, Eshelman School of Pharmacy, University of North Carolina, Chapel Hill, NC, USA
- 2The Hamner Institutes for Health Sciences, Research Triangle Park, NC, USA
- 3Department of Pathology and Laboratory Medicine, School of Medicine, University of North Carolina, Chapel Hill, NC, USA
- 4Lineberger Comprehensive Cancer Center, School of Medicine, University of North Carolina, Chapel Hill, NC, USA
- 5Department of Genetics, School of Medicine, University of North Carolina, Chapel Hill, NC, USA
- 6National Center for Computational Toxicology, U.S. Environmental Protection Agency, Research Triangle Park, NC, USA
The role of the immune system in response to chemotherapeutic agents remains elusive. The interpatient variability observed in immune and chemotherapeutic cytotoxic responses is likely, at least in part, due to complex genetic differences. Through the use of a panel of genetically diverse mouse inbred strains, we developed a drug screening platform aimed at identifying genes underlying these chemotherapeutic cytotoxic effects on immune cells. Using genome-wide association studies (GWAS), we identified four genome-wide significant quantitative trait loci (QTL) that contributed to the sensitivity of doxorubicin and idarubicin in immune cells. Of particular interest, a locus on chromosome 16 was significantly associated with cell viability following idarubicin administration (p = 5.01 × 10⁻⁸). Within this QTL lies App, which encodes amyloid beta precursor protein. Comparison of dose-response curves verified that T-cells in App knockout mice were more sensitive to idarubicin than those of C57BL/6J control mice (p < 0.05). In conclusion, the cellular screening approach coupled with GWAS led to the identification and subsequent validation of a gene involved in T-cell viability after idarubicin treatment. Previous studies have suggested a role for App in in vitro and in vivo cytotoxicity to anticancer agents; the overexpression of App enhances resistance, while the knockdown of this gene is deleterious to cell viability. Further investigations should include performing mechanistic studies, validating additional genes from the GWAS, including Ppfia1 and Ppfibp1, and ultimately translating the findings to in vivo and human studies.
Introduction
The role of the immune system in cancer development is well established with the evasion of immune elimination described as one of Hanahan and Weinberg's hallmarks of cancer development (Hanahan and Weinberg, 2011). Developing tumors commonly avoid immune surveillance by inducing an immunosuppressive tumor microenvironment with regulatory T-cells, myeloid-derived suppressor cells, alternatively activated macrophages, and tolerant dendritic cells (Alizadeh and Larmonier, 2014). Thus, the induction, potency, and persistence of the patient's functional immune system is critical to combating tumor advancement (Raval et al., 2014).
The generation of an efficacious clinical antitumor response depends upon the successful initiation of several immune processes. In this regard, the adaptive immune system has been described as an ideal anticancer agent with features including diversity, specificity, and memory. Recent advances in immune-based therapeutic approaches have focused on boosting the adaptive antitumor immune response using various approaches, including vaccination, adoptive T-cell therapy, anti-tumor antibodies, and the advent of immune checkpoint blockade agents (Hodi et al., 2010; Brahmer et al., 2012; Kantoff et al., 2012; Topalian et al., 2012; Kalos and June, 2013). Clinically, monitoring T- and B-cell response may prove useful in correlating specific immune responses to patient outcomes (Raval et al., 2014). For instance, patients with denser T-cell infiltrates in a variety of cancer tumors have better clinical responses to traditional, cytotoxic chemotherapy agents compared to patients with smaller infiltrates (Galluzzi et al., 2012). Some cytotoxic chemotherapeutics, such as anthracyclines, promote immunogenic cell death by releasing molecules such as calreticulin, which subsequently primes T-cells to elicit an antitumor Th1 phenotype (Ma et al., 2011; Mattarollo et al., 2011). Therefore, assessing the functionality of the immune system is crucial for evaluating clinical responses to cytotoxic chemotherapy (Vanneman and Dranoff, 2012).
Previous studies have noted intersubject variability in chemotherapy-induced cytotoxicity within the immune system (van Kuilenburg et al., 2000; Stocco et al., 2008; Ross et al., 2011). Although several genes have been linked to the toxicity of anticancer chemotherapy on the innate immune system (i.e., neutropenia), the role of pharmacogenomics in the cytotoxicity of the adaptive immune system requires further investigation. Here, we examined the underlying genetic components that may be responsible for the differential immune cell sensitivity to anticancer drugs. A model organism approach was used to evaluate pharmacotherapeutic response, as the effects of chemotherapy on the normal immune system are difficult to ascertain in humans. We previously developed a cell-based screen using immune cells from 36 inbred mouse strains to measure phenotypic differences in immune cell sensitivity to anticancer therapeutics (Frick et al., 2015). We were able to identify robust interstrain variation in T- and B-cell viability to cytotoxic anthracycline agents, doxorubicin and idarubicin. This in vitro pharmacogenomics screen was also developed to facilitate identification of genetic biomarkers involved in immune cytotoxicity pathways. Thus, the aims of this study were to identify quantitative trait loci (QTL) that contribute to the sensitivity of T- and B-cells to the described anthracyclines using genome-wide association studies (GWAS) and to prioritize and validate candidate genes. Following GWAS, we identified a candidate gene, App (encoding amyloid beta precursor protein) that was further shown to be involved in mediating T-cell sensitivity to idarubicin.
Materials and Methods
Phenotype Determination
The methods and results of our drug-screening platform in normal, non-cancerous, murine immune cells have been previously described (Frick et al., 2015). Briefly, splenocytes were collected from a panel of 36 inbred mouse strains (n = 4 per strain, 129S1/SvImJ, 129X1/SvJ, A/J, AKR/J, BALB/cByJ, BTBR T+ Itpr3tf/J, BUB/BnJ, C3H/HeJ, C57BLKS/J, C57BL/6J, C57BR/cdJ, C58/J, CBA/J, CZECHII/EiJ, DBA/2J, FVB/NJ, I/LnJ, KK/HiJ, LG/J, LP/J, MA/MyJ, NOD/LtJ, NON/LtJ, NZB/BINJ, NZO/HiLtJ, NZW/LacJ, PERA/EiJ, PL/J, PWD/PhJ, PWK/PhJ, RIIIS/J, SEA/GnJ, SJL/J, SM/J, SWR/J, and WSB/EiJ), aged 10–12 weeks, obtained from The Jackson Laboratory Mouse Diversity Panel (Bar Harbor, ME). Splenocytes were isolated using standard procedures; spleens were excised and mechanically dissociated into a single-cell suspension, after which red blood cells were removed using ammonium-chloride-potassium lysing buffer (Gibco, Grand Island, NY, USA). Splenocytes at a density of 100,000 cells per mL and volume of 100 μL per well were then exposed to nine half-logarithmic concentrations of doxorubicin, idarubicin (Sigma-Aldrich, Milwaukee, WI, USA), BEZ-235 (provided by Novartis, Inc.), and selumetinib (ChemieTek, Indianapolis, IN, USA) ranging from 0.01 to 100 μM. At 4 h post-treatment, cells were sequentially incubated with physiological indicator dyes [i.e., 3.75 μL (0.19 μg) 7-AAD (BD Biosciences, San Jose, CA, USA), 3.75 μM CellEvent™ Caspase-3/7 Green Detection Reagent, and 125 nM Mitotracker® Deep Red (Invitrogen, Carlsbad, CA, USA) per 100 μL well] for 30 min at 37°C and 5% CO2 and cell surface marker antibodies [i.e., 0.05 μg V500 Syrian hamster anti-mouse CD-3e, 0.1 μg APC-H7 rat anti-mouse CD-19, 0.1 μg V450 rat anti-mouse CD-11b, and 0.1 μg PE-Cy7 rat anti- mouse Ly-6G per 100 μL well (all antibodies were obtained from BD Biosciences)] for 30 min at 4°C and then fixed with 4% paraformaldehyde (Thermo Fisher Scientific, Pittsburgh, PA, USA) for 15 min at room temperature. Samples were analyzed by flow cytometry using a BD FACSCanto™ II flow cytometer (BD Biosciences) equipped with three lasers (405 nm, 488 nm, and 640 nm) and Flow Jo software version X (TreeStar, Ashland, OR, USA). Dose-response curves with response normalized to the zero dose as a function of log concentration were generated. After detecting immune cell populations of interest (e.g., CD19+ B-cells, CD3e+ T-cells, and CD11b+ monocytes), cells positive for physiological indicator dyes in each subpopulation were gated. Dose-response curves with response normalized to the zero dose as a function of log concentration were generated using GraphPad Prism 6 (La Jolla, CA) and the Hill equation:
where Max is the maximum asymptote, Min is the minimum asymptote, γ is the Hill slope, and x is the drug concentration (Beam and Motsinger-Reif, 2013). Heritability or the percent of variability likely due to genetics was calculated by comparing intra- and interstrain variation in percent viability. The proportion of phenotype variation attributable to genetics was estimated with broad-sense heritability. Intrastrain correlations were estimated by
where r1 is the intrastrain correlation estimate, MSB is the mean square of the between-strain comparison, MSW is the mean square of the within-strain correlation, and n is the number of animals per strain (Nichols et al., 2014). Viability measurements of B-cells and T-cells exposed to the anthracyclines provided the most heritable phenotypes in this screen and thus underwent further QTL mapping analysis (Frick et al., 2015).
Quantitative Trait Loci (QTL) Mapping
GWAS were performed for half maximal inhibitory concentration (IC50) values and individual drug concentrations that corresponded to cell viability for splenic B-cells and T-cells exposed to doxorubicin and idarubicin. SNPster and efficient mixed-model association (EMMA) algorithms, which are well described elsewhere, were used for QTL mapping (McClurg et al., 2007; Kang et al., 2008). Briefly, SNPster performs QTL mapping analysis from an inferred haplotype structure determined by overlapping 3-SNP windows for each strain. Using One-Way ANOVA, an F-statistic is calculated following association analyses of phenotypic values with haplotypes. p-values are then estimated by bootstrapping phenotypic values 1 × 10⁶ times, providing a maximum –log(p) score of 6.0 (McClurg et al., 2007). EMMA uses F-tests for single marker association mapping while accounting for population structure and genetic relatedness (Kang et al., 2008). SNP genotypes used for GWAS were obtained from the Mouse Diversity Array set at the CGDSNPdb website (http://cgd.jax.org/cgsnpdb/) (Yang et al., 2011). The SNP panel was trimmed for redundancy (SNPs showing identical haplotype pattern at a locus), missingness (genotyping call rates <95%), and non-informative nature (SNPs without variation amongst the 36 strains), leaving a panel of 356,596 SNPs. Manhattan plots were visualized using R version 3.1.0 and the UCSC Mouse Genome Browser on the Mouse July 2007 (NCBI37/mm9) Assembly (https://genome.ucsc.edu) (Waterston et al., 2002). The threshold of significance for QTL mapping was adjusted using a conservative Bonferroni correction. QTL were considered significant when the −log(p) score was ≥6.85.
Candidate Gene Selection
QTL regions that overlapped using both association mapping algorithms, although both were not required to be genome-wide significant [−log(p) ≥ 6.85], were further selected for candidate gene selection. Candidate genes were prioritized based on the following: literature evidence for biological involvement with the immune system or anthracycline response, gene expression in spleens and immune cells across strains, correlation between phenotypic values and gene expression levels in spleens and immune cells, similarity in the haplotype structure between the QTL and the candidate gene, presence of potentially deleterious non-synonymous coding SNPs, and apoptotic or immune cell pathway involvement (Supplementary Figure 1) (Moreau and Tranchevent, 2012). Candidate genes were only included if they were expressed in the spleen, the tissue originally assayed to produce our phenotypes of interest. Expression levels were measured in spleens and immune cells from inbred strains of mice using the Affymetrix Mouse Genome 2.0 Array (Santa Clara, CA). Genes were considered expressed if their expression level was greater than 50 for at least one of the strains following data processing with the gcRMA algorithm. Non-synonymous coding SNPs were obtained from dbSNP (http://www.ncbi.nlm.nih.gov/projects/SNP/). The likely effect of amino acid substitutions in protein sequences was determined using PROVEAN (Protein Variation Effect Analyzer) version 1.1.3 (Choi et al., 2012) and PANTHER (Protein Analysis Through Evolutionary Relationships) version 9.0 software (Thomas et al., 2003; Mi et al., 2005). Using PROVEAN, a score of ≤−2.5 indicates a functional effect on the protein. For the PANTHER algorithm, a subSPEC (substitution position-specific evolutionary conservation) score of −3 corresponds to a 50% probability that a score is deleterious (Pdeleterious = 0.5). Chilibot (Chen and Sharp, 2004) (http://www.chilibot.net) was used to search the PubMed literature database for biological relevance of genes with regards to immune cell function or anthracycline response. Ingenuity® Pathway Analysis was used to gage the involvement of genes in apoptotic or various immune function pathways (http://www.ingenuity.com/). The haplotype structure for the interval and for specific genes was reviewed with the Mouse Phylogeny Viewer (https://msub.csbio.unc.edu/) (Wang et al., 2012).
App Gene Validation
Based on the criteria for candidate gene validation as described above, App was chosen for downstream validation studies. An in vitro knockout approach was used for validation of App. App knockout (B6.129S7-Apptm1Dbo/J, stock number: 004133) and C57BL/6J control (stock number: 000664) male mice aged 10–12 weeks were obtained from the Jackson Laboratory (Bar Harbor, ME). Other than a reduced body weight of 15–20% less than wildtype age-matched controls, mice homozygous for the targeted allele are viable without blatant physical and behavioral abnormalities at birth. At 14 weeks of age, an age beyond the range we included in our assay, the mice exhibit evidence of reactive gliosis with significantly reduced forearm grip strength and reduced locomotion (Zheng et al., 1995). For the validation study, mice were housed three per cage in polycarbonate cages on a 12 h light/dark cycle (lights on at 0700 h) with access to food and water ad libitum. Following 1 week of habituation, splenic immune cells from these knockout and control mice were obtained and underwent the cellular screening as described (Frick et al., 2015). All procedures were approved by the UNC Institutional Animal Care and Use Committee and followed the guidelines set forth by the National Institutes of Health Guide for the Care and Use of Laboratory Animals.
Statistical Analyses
Additional statistical analyses, including Pearson correlations, t-tests, and partial F-tests, were performed with SAS version 5.2 (Cary, NC) and GraphPad Prism 6 with p < 0.05 considered to be statistically significant. Pearson correlations were performed to determine the relatedness between metrics (Brown et al., 2011). Dose-response curves from knockout and control populations were compared using t-tests for IC50 and viability measurements. Finally, a partial F-test was used to determine if there was evidence that the knockout and control data sets differed from each other, necessitating the use of two separate dose-response curves to represent the conglomerate data.
Results
The results from our initial ex vivo assessment of drug sensitivity phenotypes have been previously discussed (Frick et al., 2015). Although we measured multiple cell health parameters, the cell viability phenotype was most robust and heritable and was subsequently used for GWAS. Figure 1 displays the interstrain phenotypic variation for the most heritable viability phenotypes: T-cells exposed to idarubicin (Figure 1A), B-cells exposed to doxorubicin (Figure 1B), and B-cells exposed to idarubicin (Figure 1C). Several strains repeatedly appeared to be more sensitive (e.g., C57BLKS/J and DBA/2J) or less sensitive (e.g., BALB/cByJ, KK/HiJ, and WSB/EiJ) to the cytotoxic effects of the different anthracycline agents across cell types. The concentrations (respectively 0.3, 1, and 3 μM) contained in black boxes corresponded to the phenotypic values that generated genome-wide significant QTL with respective heritability measurements of 70.6, 87.5, and 85%. The viability measurements at these concentrations significantly correlated with IC50 values obtained from our assay with respective Pearson correlations of 0.85942 (p < 0.0001), 0.82489 (p < 0.0001), and 0.92028 (p < 0.0001).
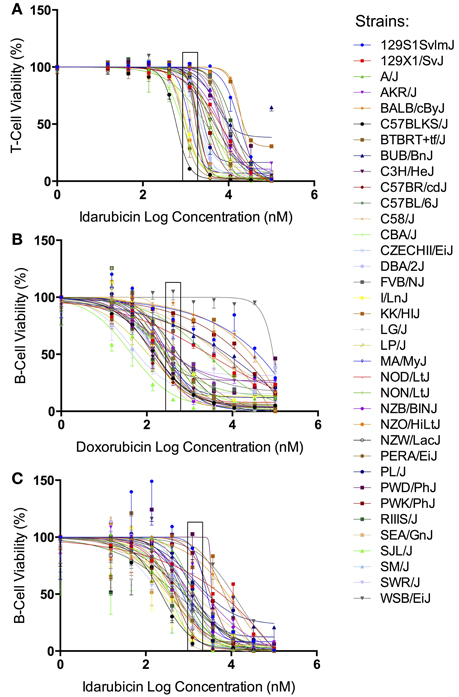
Figure 1. Phenotypes for GWAS. Dose-response curves reflecting interstrain variation in viability are shown for T-cells exposed to idarubicin (A), B-cells exposed to doxorubicin (B), and B-cells exposed to idarubicin (C). Thirty-six strains are represented: 129S1/SvImJ, 129X1/SvJ, A/J, AKR/J, BALB/cByJ, BTBR T+ Itpr3tf/J, BUB/BnJ, C3H/HeJ, C57BLKS/J, C57BL/6J, C57BR/cdJ, C58/J, CBA/J, CZECHII/EiJ, DBA/2J, FVB/NJ, I/LnJ, KK/HiJ, LG/J, LP/J, MA/MyJ, NOD/LtJ, NON/LtJ, NZB/BINJ, NZO/HiLtJ, NZW/LacJ, PERA/EiJ, PL/J, PWD/PhJ, PWK/PhJ, RIIIS/J, SEA/GnJ, SJL/J, SM/J, SWR/J, and WSB/EiJ. Concentrations used to generate genome-wide significant QTL (respectively 1, 0.3, and 3 μM) are enclosed with a black box.
Using a GWA approach, we identified four genome-wide significant QTLs that overlapped using both SNPster and EMMA algorithms: chr16 84.7–85.6 Mb for T-cells exposed to idarubicin (Figure 2A), chr6 146.5–147.5 Mb for B-cells exposed to doxorubicin (Figure 2B), and chr5 74.5–74.9 Mb and chr7 151.4–152.0 Mb for B-cells exposed to idarubicin (Figure 2C) with −log(p) scores of 7.34, 7.94, 12.08, and 10.98, respectively. Within these four QTL peaks, there were 25 genes that were further prioritized using the criteria described previously (Supplementary Figure 1). Only 16 out of 25 genes within genome-wide significant peaks were expressed in the spleen (expression level > 50) and were included for prioritization (Supplementary Table 1).
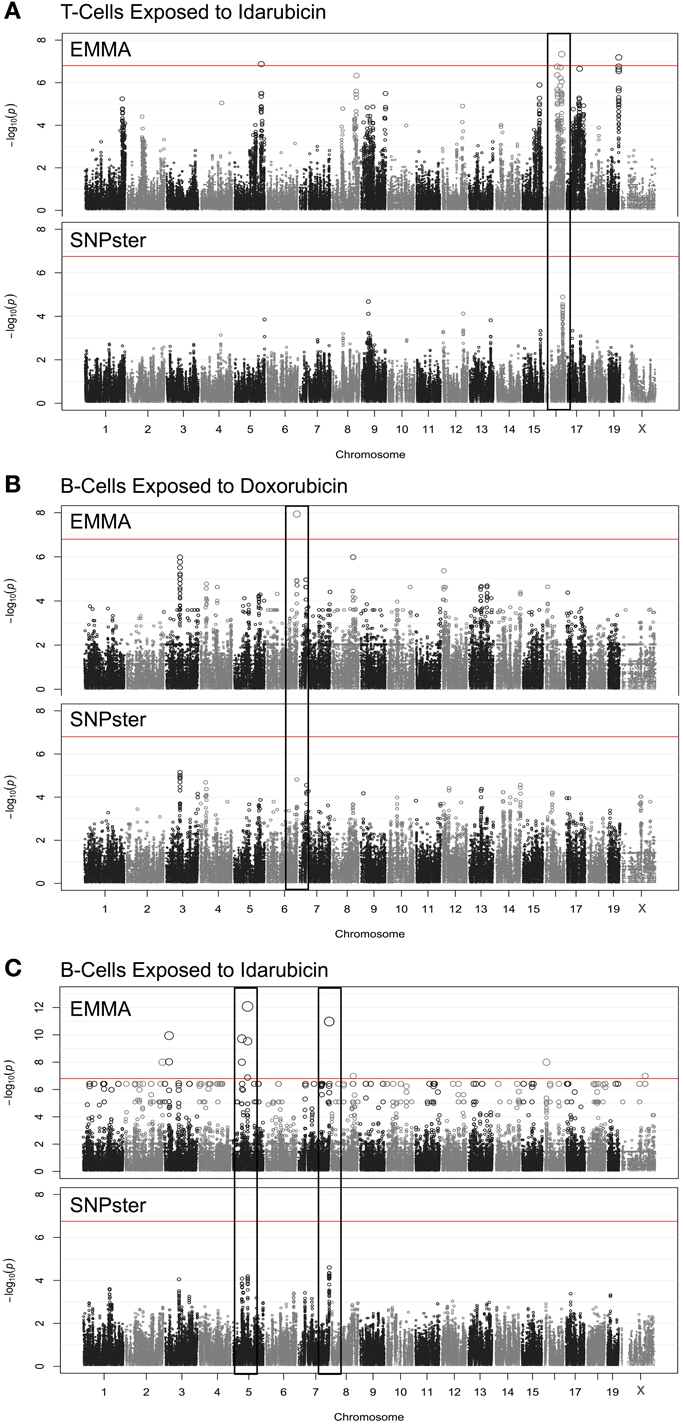
Figure 2. Manhattan plots for immune cell cytotoxicity to anthracycline agents. Manhattan plots were obtained from GWAS using EMMA and SNPster algorithms for T-cells exposed to idarubicin (A), B-cells exposed to doxorubicin (B), and B-cells exposed to idarubicin (C). Manhattan plots derived from EMMA are displayed above Manhattan plots obtained from SNPster. The threshold of genome-wide significance (−log(p) ≥ 6.85 following Bonferroni correction) is represented by the horizontal red line. The black boxes contain matching QTL peaks obtained from both EMMA and SNPster algorithms respectively on chromosomes 16 (A), 6 (B) 5, and 7 (C). The −log(p) scores for the respective QTL are 7.34, 7.94, 12.08, and 10.98.
The viability of splenic T-cells following idarubicin exposure is a robust phenotype exhibiting strong interstrain variability. This phenotype was strongly associated with a 0.9 Mb region (84.7–85.6 Mb) on chromosome 16 containing eight genes, six of which met criteria for candidate gene prioritization (Figure 3). Supplementary Table 1 lists characteristics for all candidate genes across various dose-response phenotypes. Briefly, of the six genes, App was one of four (i.e., Atp5j, Gabpa, and Mir155) that is involved in apoptosis and immune cell pathways according to Ingenuity® pathway analysis. Using Chilibot, App is the only gene with a known relation to anthracyclines and one of two genes (i.e., Mir155) that is associated in the literature with the immune system. The haplotype structure of App, Gabpa, and Mrpl39 contained groupings of strains corresponding to sensitive and resistant phenotypes. App and Mrpl39 have potentially deleterious SNPs. App is also the only gene under this peak that is differentially expressed (≥2 fold difference in expression levels) across our selected inbred mouse strains in the spleen, CD4+ cells, CD4+ Th1 cells, and macrophages. For these reasons, App, encoding amyloid beta precursor protein, was chosen for validation.
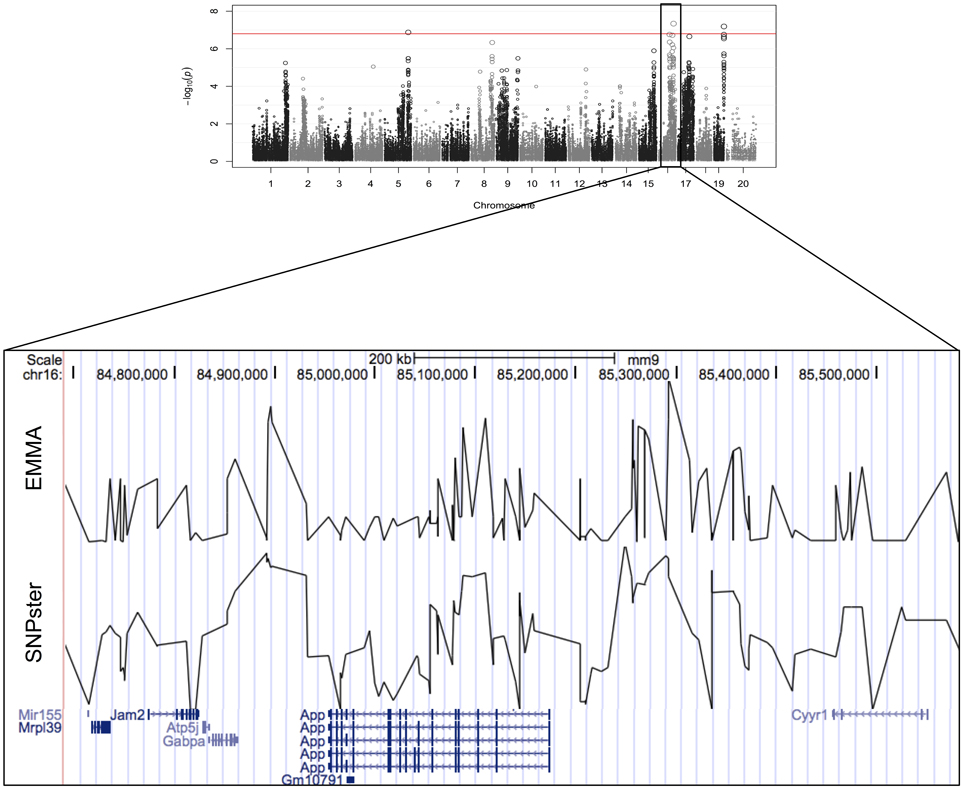
Figure 3. Genomic region associated with T-cell toxicity following idarubicin exposure. Potential candidate genes from the Reference Sequence database on chromosome 16 are displayed using Manhattan plots that were generated from both EMMA and SNPster algorithms. The candidate QTL within a 0.9 Mb region is visualized with the UCSC Genome Browser (http://genome.ucsc.edu) with the QTL region derived from EMMA displayed above the QTL region obtained from SNPster.
As shown in Figure 4, the haplotype structure of App illustrates similar groupings of sensitive and resistant strains as the one seen for the top peak (Figure 4A). Additionally, the gene does contain non-synonymous coding SNPs (Figure 4B), which introduce the following amino acid sequence changes in the protein: D516E, A480V, D309E, and G221S. Using PROVEAN and PANTHER algorithms, A480V and D309E were classified as likely deleterious to App (Figure 4C). Finally, based on literature review, although associated mutations and differences in expression in App have been historically linked primarily to Alzheimer's disease, there is evidence of a role for App in cytotoxicity involving chemotherapeutics (Uberti et al., 2007; Woods and Padmanabhan, 2013).
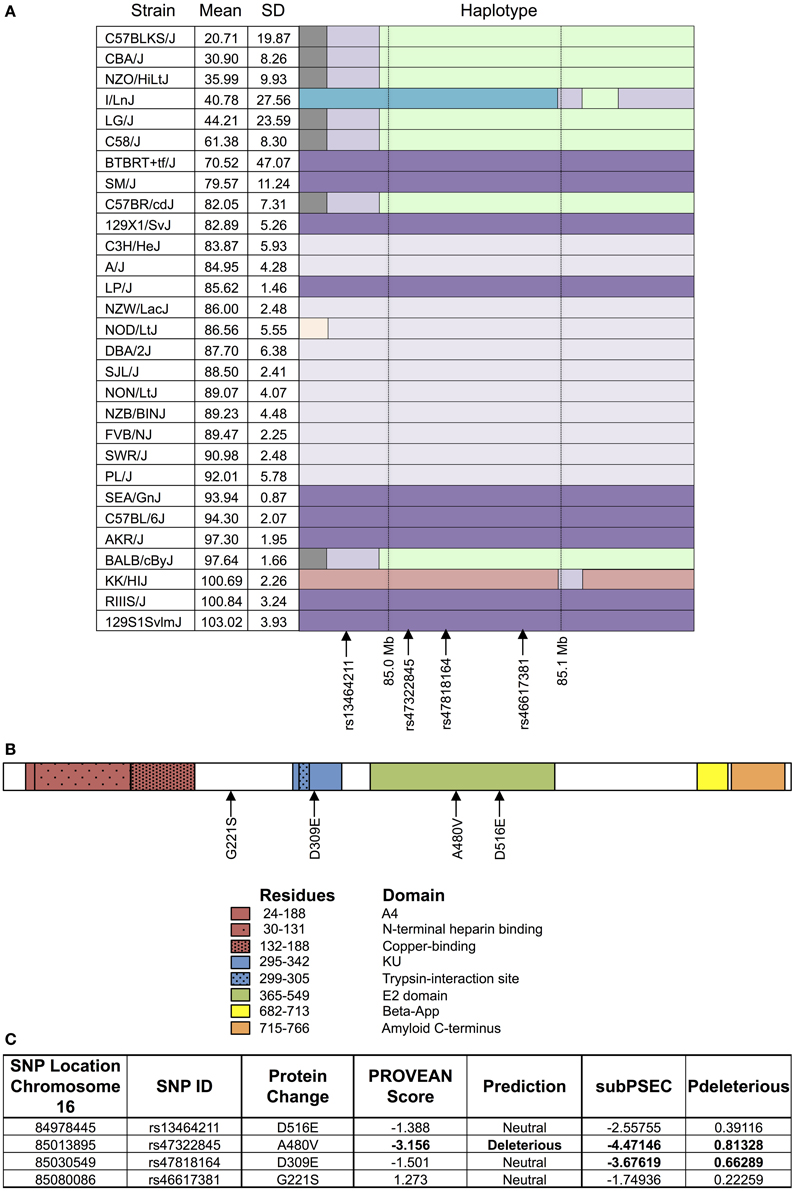
Figure 4. Haplotype and protein structure of App. The haplotype structure of the inbred mouse strains within App (A), the structure of App (B), and the likelihood of deleterious effects within App due to non-synonymous coding SNPs (C) are shown. Strains are arranged in descending order of phenotype (i.e., T-cell viability following exposure to 1 μM idarubicin) from most to least sensitive along with mean, standard deviation, and the haplotype structure (chr16 84.95 Mb–85.17 Mb). The haplotype structure was visualized with the Mouse Phylogeny Viewer (https://msub.csbio.unc.edu/). Within App, non-synonymous coding SNPs are indicated by arrows. The structure of App is provided with key domains and the sites of potential amino acid substitutions caused by non-synonymous coding SNPs. Non-synonymous coding SNPs within App were obtained from the Center for Genome Dynamics (http://cgd.jax.org/cgdsnpdb). The likelihood scores for these SNPs to cause deleterious effects within the associated protein's structure using PROVEAN and the PANTHER Classification System are displayed. Using PROVEAN, a score of ≤−2.5 indicates a functional effect on the protein. For the PANTHER algorithm, a subSPEC (substitution position-specific evolutionary conservation) score of −3 corresponds to a 50% probability that a score is deleterious (Pdeleterious = 0.5). Likely deleterious values have been bolded.
A gene validation study was performed using splenocytes from App knockout (B6.129S7-Apptm1Dbo/J) and C57BL/6J control mice, subjected to the same conditions within our cellular screen. Without drug exposure, the relative splenic T-cell composition and viability of App knockout vs. control mice were not statistically different using a t-test (p > 0.05, respectively p = 0.344 and p = 0.386). However, the mean viability of T-cells from App knockout mice was more than that of the control mice following exposure to idarubicin (Figure 5). Given that the log10(IC50) value for the control mice (3.48, 95% CI: 3.401–3.56) is significantly higher than the log10(IC50) value for the App knockout mice (3.28, 95% CI: 3.18–3.38), this result suggests that susceptibility to idarubicin-induced cytotoxicity on T-cells is greater with the absence of App (p < 0.05). Additionally, the knockout of App was significantly associated with increased cell toxicity as observed by the shift to the left in the dose-response curve from the control mice (partial F-test, p = 0.0056, Figure 5).
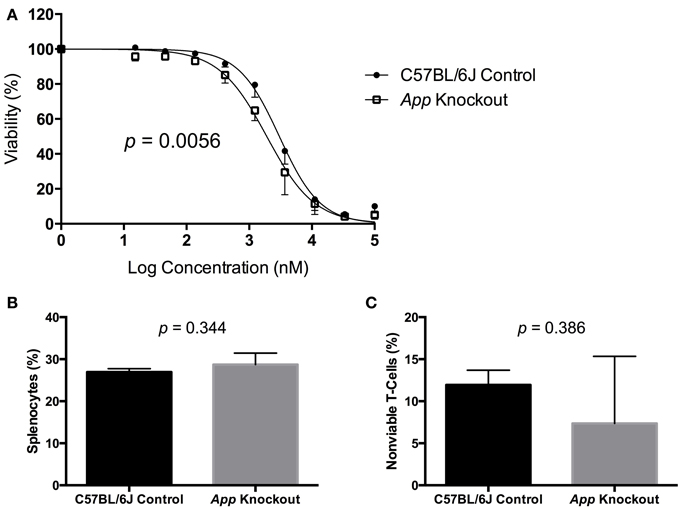
Figure 5. In vitro validation of App in T-cell toxicity following idarubicin exposure. Dose-response curves (A) and baseline splenic T-cell composition (B) and non-viable T-cells (C) are shown. Dose-response curves were generated following exposure of splenic T-cells from C57BL/6J control mice (N = 3) and App knockout mice (N = 3) to idarubicin. A significant shift to the left was observed in App knockout cells as calculated using a partial F-test (p = 0.0056). At the zero dose, the relative splenic T-cell composition and viability of App knockout vs. control mice were not statistically different using a t-test (p > 0.05, respectively p = 0.344 and p = 0.386).
Discussion
This investigation aimed to uncover genetic components of the normal immune system's sensitivity to chemotherapeutic agents. The importance of this comes from studies that implicate the uncompromised immune system in the efficacy of chemotherapeutic treatments (Hanahan and Weinberg, 2011). In this study, we assessed the resilience of immune function cells to potentially toxic drugs, including anticancer agents. As this investigation is difficult to conduct in human patients, we proposed a model system to examine cytotoxicity in healthy immune cells from inbred strains of mice with the objective of identifying genetic biomarkers of immune cytotoxicity (Frick et al., 2015).
Recently, standardization of pharmacogenomic screening has come under intense scrutiny, necessitating improvements in the design, application, and implementation of robust assays for phenotypic measurement (Haibe-Kains et al., 2014; Hatzis et al., 2014). For these GWAS, we examined IC50 values, AUC values, and individual viability concentrations (only results from the GWAS for individual viability concentrations are shown here). It is often not clear how to best represent the phenotype data when multiple varying dose-response curves are involved, and all three measurements used for GWAS present their own challenges and benefits. In this study, IC50 could not be estimated in some cases as necessary concentrations for 50% viability were outside of our selected, generic concentration range (15 nM–100 μM) and were far beyond physiological boundaries. While IC50 is a biologically relevant measurement if slopes are comparable, it can be regarded as a moving target and differs based on software and equations used to fit the dose-response curve. AUC measures can always be estimated from the dose-response curve and all points are used in data analysis. However, the appropriateness of this model in regards to its biology has been questioned (Brown et al., 2011; Fallahi-Sichani et al., 2013). The viability concentrations, which were located on either side of the mean logarithmic IC50 for all strains, provided precise, replicable, and robust measurements and the necessary interstrain variation for GWAS compared to IC50 and AUC values. Therefore, the cell viability data from these viability concentrations were used to compute the genome-wide significant QTL.
In this study, we uncovered four genome-wide significant QTL that were identified with two different GWA algorithms (EMMA and SNPster) using the same genotype and phenotype data. Because the two mapping approaches determine QTL using different methodologies, the use of both algorithms potentially helps to minimize identification of false positive QTLs. Results from both analyses identified four loci containing 25 candidate genes. These candidate genes subsequently underwent careful inspection to examine as much available data that can be garnered to rank these genes and select a “most likely” candidate for validation.
Here, we selected one gene for a validation study; App was validated ex vivo using knockout and control mice. App knockout mice are commercially available and viable, and only with a concurrent knockout of Aplp2 (amyloid precursor-like protein 2) is this loss of function perinatally lethal. The downstream processing of App is fairly complex, and the role of domains in addition to the plaque forming β-App, typically associated with Alzheimer's disease, is still under investigation. App consists of multiple domains (i.e., A4, N-terminal heparin-binding, copper-binding, KU, E2, β-App, and amyloid C-terminal domains as shown in Figure 4B) with numerous cleavage sites (Sherry et al., 2001). Alzheimer's disease has been suggested to result from an imbalance in the production and clearance of β-APP However, additional theories have been proposed, for instance suggesting β-APP is a marker of oxidation rather than a symptom of neurodegeneration (Dong et al., 2012).
APP has been studied primarily in the context of Alzheimer's disease, but knowledge of other biological functions has not been as well studied. This gene is ubiquitously expressed, suggesting roles outside of various neuronal functions and potentially in diseases likely to occur due to aberrant processes that are typically associated with APP. The extracellular portion of the protein has been implicated in cell adhesion, signaling, and growth, and the intracellular portion has been associated with cell signaling and apoptosis (Thinakaran and Koo, 2008; Dawkins and Small, 2014). Overexpression of APP, particularly the soluble N-terminal ectodomain (sAPP), has been linked to carcinogenesis, including cancers originating from the nasopharynx, oral cavity, lung, breast, thyroid, parathyroid, colon, testicles, and pancreas (Takagi et al., 2013; Yamada et al., 2013). Ryan et al. exposed rat hippocampus slice cultures to sAPP, which elicited an inflammatory and immune gene response that was suggested to cause a neuroprotective environment. Apoptotic pathways were downregulated, while cell proliferation and survival pathways were upregulated (Ryan et al., 2013). In addition, APP expression is indirectly linked to Ras/MAPK and PI3K/Akt pathways, which are often upregulated in various cancers (Ruiz-León and Pascual, 2004). These findings suggest a potential role of APP in cellular processes involved in cancer or in chemotherapy response.
Epidemiologically, an inverse comorbidity with cancer was found in two studies of 500 patients with Alzheimer's disease (Tabarés-Seisdedos and Rubenstein, 2013). This inverse correlation was hypothesized to be driven by molecular processes common to CNS disorders and cancer. Ibáñez et al. found a significant overlap between genes (e.g., PIN1, Wnt pathway, p53 pathway, and pathways related to protein folding and folding degradation) upregulated in CNS disorders (i.e., Alzheimer's disease, Parkinson's disease, and schizophrenia) and genes downregulated in cancer (i.e., lung, prostate, and colorectal cancers) and vice versa (Ibáñez et al., 2014). APP also may be affected by anticancer chemotherapeutics. A recent clinical observational study indicated that the risk of Alzheimer's disease was reduced following the administration of anticancer chemotherapy (Stong, 2013).
Additionally, in CHO cells, carmustine administration reduced β-APP and was suggested to cause altered intracellular trafficking and processing of APP with an increase in sAPP and immature APP levels at the cell surface (Hayes et al., 2013). APP overexpressing cell lines have also been found to have a higher resistance to cytotoxicity; overexpression of wild-type APP in HEK cells resulted in a conformational change in p53 and a subsequent reduced sensitivity to doxorubicin (Uberti et al., 2007). The link between APP and p53 has been previously suggested, and APP has been proposed to activate gene transcription in a similar way as Notch, a protein with roles in cell differentiation, cell proliferation, neuronal function, and T-cell lineage commitment (Thinakaran and Koo, 2008). Altogether, these findings suggest a potential role of APP in cancer and in anticancer drug response.
We have not yet determined the mechanism as to why a lack of App leads to enhanced toxicity to idarubicin. From the findings discussed above, we can hypothesize that an increase in wild type APP and subsequent sAPP leads to a decrease in functional proteins within the p53 pathway, which causes a downregulation in apoptotic processes, upregulation in cell survival, and subsequent resistance to toxic insults such as treatment with anticancer drugs. This situation could present a clinical conundrum in how to treat patients with cancers overexpressing APP and thus warrants further investigation (Lanni et al., 2012).
Genomic differences in molecular machinery processing APP could add additional layers of complexity. Full-length APP is processed by α-, β-, and γ-secretases to yield β-APP or sAPP in the extracellular domain and complementary membrane-tethered fragments that are further cleaved into smaller peptides. Alternative splicing generates several APP isoforms, often tissue-specific, ranging from 365 to 770 amino acids. The exact nature of these fragments is difficult to determine, but they can have functions independent of the parent protein. The effect of idarubicin on the profile of alternative APP variants and APP cleavage products remains to be determined. A number of post-translational modifications also occur in APP; APP is extensively glycosylated in extra- and intracellular domains and is phosphorylated at several residues in its cytoplasmic domain, which interacts with multiple proteins (Muresan and Ladescu Muresan, 2015). The intracellular concentrations of active drugs may be affected by these modifications in general (Marin et al., 2014); however, the effect of drugs, particularly idarubicin, on these processes in APP warrants further investigation.
In this study, the expression of App in the spleen and other immune cells did not correlate with the interstrain sensitivity of T-cells to idarubicin. Thus, the effect of App on anticancer cytotoxicity is not likely driven by App expression in this study. An additional study to explore the mechanism of App's effect on idarubicin toxicity may include creating specific polymorphisms introducing the potentially deleterious non-synonymous coding changes mentioned previously to see how the viability of T-cells exposed to idarubicin is affected. Furthermore, we have additional candidate genes from our screen for future validation. Of particular interest, Ppfia1 and Ppfibp1 were found using the viability of B-cells exposed to doxorubicin and idarubicin, respectively. These genes encode liprin-alpha-1 and liprin-beta-1, members of the LAR protein tyrosine phosphatase-interacting protein family, which orchestrate cell-matrix interactions (http://omim.org/, 2014). Future studies examining the roles of Ppfia1 and Ppfibp1 in immune-mediated cytotoxicity are needed to better understand this finding.
We achieved our aims by demonstrating that we can identify genes implicated in the immune cell survival after treatment with chemotherapeutic agents. Using a cellular screening approach, we identified and subsequently validated a gene involved in cytotoxic T-cell sensitivity to idarubicin. Further work would be required to define the precise mechanism by which APP mediates this sensitivity. In addition, it is very unlikely that this is the only gene that impacts the variable response to this chemotherapeutic agent. We identified additional candidate genes of interest that would also require a validation process, with the ultimate goal of translating these findings to clinical practice.
Conflict of Interest Statement
Dr. Kristy L. Richards received an honorarium from Celgene and is on the advisory board for Genentech. The authors declare that the research was conducted in the absence of any commercial or financial relationships that could be construed as a potential conflict of interest.
Acknowledgments
The project described was supported by the North Carolina Translational and Clinical Sciences Institute and the National Center for Research Resources and the National Center for Advancing Translational Sciences, National Institutes of Health, through Grant Award Number UL1TR000083. The content is solely the responsibility of the authors and does not necessarily represent the official views of the NIH. This project was also supported by the Pharmaceutical Research and Manufacturers of America Foundation Pre Doctoral Fellowship in Pharmacology/Toxicology.
Supplementary Material
The Supplementary Material for this article can be found online at: http://www.frontiersin.org/journal/10.3389/fphar.2015.00062/abstract
Supplementary Table 1. Candidate genes from the phenotypic screen. The gene symbol, full name, and genome-wide significant -log (p) score at the QTL peak are represented. The table also indicates if the gene is expressed (>50) or differentially expressed (>2 fold difference in expression levels) and if expression correlates with its phenotype (p < 0.05) within the spleen, CD4+ T-cells, CD4+ Th1 T-cells, and macrophages. Furthermore, the presence of a haplotype match with the QTL, potentially deleterious non-synonymous coding SNPs, involvement in biological pathways, and association with the immune system or anthracyclines is specified for each candidate gene.
Supplementary Figure 1. Schematic for candidate gene prioritization.
References
Alizadeh, D., and Larmonier, N. (2014). Chemotherapeutic targeting of cancer-induced immunosuppressive cells. Cancer Res. 74, 2663–2668. doi: 10.1158/0008-5472.CAN-14-0301
PubMed Abstract | Full Text | CrossRef Full Text | Google Scholar
Beam, A., and Motsinger-Reif, A. A. (2013). Beyond IC50s: towards robust statistical methods for in vitro association studies. J. Pharmacogenomics Pharmacoproteomics 5, 120. doi: 10.4172/2153-0645.1000121
PubMed Abstract | Full Text | CrossRef Full Text | Google Scholar
Brahmer, J. R., Tykodi, S. S., Chow, L. Q. M., Hwu, W. J., Topalian, S. L., Hwu, P., et al. (2012). Safety and activity of anti–PD-L1 antibody in patients with advanced cancer. N. Engl. J. Med. 366, 2455–2465. doi: 10.1056/NEJMoa1200694
PubMed Abstract | Full Text | CrossRef Full Text | Google Scholar
Brown, C., Havener, T. M., Everitt, L., McLeod, H., and Motsinger-Reif, A. A. (2011). A comparison of association methods for cytotoxicity mapping in pharmacogenomics. Front. Genet. 2:86. doi: 10.3389/fgene.2011.00086
PubMed Abstract | Full Text | CrossRef Full Text | Google Scholar
Chen, H., and Sharp, B. M. (2004). Content-rich biological network constructed by mining PubMed abstracts. BMC Bioinformatics 5:147. doi: 10.1186/1471-2105-5-147
PubMed Abstract | Full Text | CrossRef Full Text | Google Scholar
Choi, Y., Sims, G. E., Murphy, S., Miller, J. R., and Chan, A. P. (2012). Predicting the functional effect of amino acid substitutions and indels. PLoS ONE 7:e46688. doi: 10.1371/journal.pone.0046688
PubMed Abstract | Full Text | CrossRef Full Text | Google Scholar
Dawkins, E., and Small, D. H. (2014). Insights into the physiological function of the β-amyloid precursor protein: beyond Alzheimer's disease. J. Neurochem. 129, 756–769. doi: 10.1111/jnc.12675
PubMed Abstract | Full Text | CrossRef Full Text | Google Scholar
Dong, S., Duan, Y., Hu, Y., and Zhao, Z. (2012). Advances in the pathogenesis of Alzheimer's disease: a re-evaluation of amyloid cascade hypothesis. Transl. Neurodegener. 1, 18. doi: 10.1186/2047-9158-1-18
PubMed Abstract | Full Text | CrossRef Full Text | Google Scholar
Fallahi-Sichani, M., Honarnejad, S., Heiser, L. M., Gray, J. W., and Sorger, P. K. (2013). Metrics other than potency reveal systematic variation in responses to cancer drugs. Nat. Chem. Biol. 9, 708–714. doi: 10.1038/nchembio.1337
PubMed Abstract | Full Text | CrossRef Full Text | Google Scholar
Frick, A., Fedoriw, Y., Richards, K., Damania, B., Parks, B., Suzuki, O., et al. (2015). Immune cell-based screening assay for response to anti-cancer agents: applications in pharmacogenomics. Pharmacogenomics Person. Med. 8, 81–98. doi: 10.2147/PGPM.S73312
Galluzzi, L., Senovilla, L., Zitvogel, L., and Kroemer, G. (2012). The secret ally: immunostimulation by anticancer drugs. Nat. Rev. Drug Discov. 11, 215–233. doi: 10.1038/nrd3626
PubMed Abstract | Full Text | CrossRef Full Text | Google Scholar
Haibe-Kains, B., El-Hachem, N., Birkbak, N. J., Jin, A. C., Beck, A. H., Aerts, H. J. W. L., et al. (2014). Inconsistency in large pharmacogenomic studies. Nature 504, 389–393. doi: 10.1038/nature12831
Hanahan, D., and Weinberg, R. A. (2011). Hallmarks of cancer: the next generation. Cell 144, 646–674. doi: 10.1016/j.cell.2011.02.013
PubMed Abstract | Full Text | CrossRef Full Text | Google Scholar
Hatzis, C., Bedard, P. L., Birkbak, N. J., Beck, A. H., Aerts, H. J. W. L., Stern, D. F., et al. (2014). Enhancing reproducibility in cancer drug screening: how do we move forward? Cancer Res. 74, 4016–4023. doi: 10.1158/0008-5472.CAN-14-0725
PubMed Abstract | Full Text | CrossRef Full Text | Google Scholar
Hayes, C. D., Dey, D., Palavicini, J. P., Wang, H., Patkar, K. A., Minond, D., et al. (2013). Striking reduction of amyloid plaque burden in an Alzheimer's mouse model after chronic administration of carmustine. BMC Med. 11:81. doi: 10.1186/1741-7015-11-81
PubMed Abstract | Full Text | CrossRef Full Text | Google Scholar
Hodi, F. S., O'Day, S. J., McDermott, D. F., Weber, R. W., Sosman, J. A., Haanen, J. B., et al. (2010). Improved survival with ipilimumab in patients with metastatic melanoma. N. Engl. J. Med. 363, 711–723. doi: 10.1056/NEJMoa1003466
PubMed Abstract | Full Text | CrossRef Full Text | Google Scholar
Ibáñez, K., Boullosa, C., Tabarés-Seisdedos, R., Baudot, A., and Valencia, A. (2014). Molecular evidence for the inverse comorbidity between central nervous system disorders and cancers detected by transcriptomic meta-analyses. PLoS Genet. 10:e1004173. doi: 10.1371/journal.pgen.1004173
PubMed Abstract | Full Text | CrossRef Full Text | Google Scholar
Kalos, M., and June, C. H. (2013). Adoptive T cell transfer for cancer immunotherapy in the era of synthetic biology. Immunity 39, 49–60. doi: 10.1016/j.immuni.2013.07.002
PubMed Abstract | Full Text | CrossRef Full Text | Google Scholar
Kang, H. M., Zaitlen, N. A., Wade, C. M., Kirby, A., Heckerman, D., Daly, M. J., et al. (2008). Efficient control of population structure in model organism association mapping. Genetics 178, 1709–1723. doi: 10.1534/genetics.107.080101
PubMed Abstract | Full Text | CrossRef Full Text | Google Scholar
Kantoff, P. W., Higano, C. S., Shore, N. D., Berger, E. R., Small, E. J., Penson, D. F., et al. (2012). Sipuleucel-T immunotherapy for castration-resistant prostate cancer. N. Engl. J. Med. 363, 411–422. doi: 10.1056/NEJMoa1001294
Lanni, C., Racchi, M., Memo, M., Govoni, S., and Uberti, D. (2012). p53 at the crossroads between cancer and neurodegeneration. Free Radic. Biol. Med. 52, 1727–1733. doi: 10.1016/j.freeradbiomed.2012.02.034
PubMed Abstract | Full Text | CrossRef Full Text | Google Scholar
Ma, Y., Aymeric, L., Locher, C., Mattarollo, S. R., Delahaye, N. F., Pereira, P., et al. (2011). Contribution of IL-17-producing gamma delta T cells to the efficacy of anticancer chemotherapy. J. Exp. Med. 208, 491–503. doi: 10.1084/jem.20100269
PubMed Abstract | Full Text | CrossRef Full Text | Google Scholar
Marin, J. J. G., Monte, M. J., Blazquez, A. G., Macias, R. I. R., Serrano, M. A., and Briz, O. (2014). The role of reduced intracellular concentrations of active drugs in the lack of response to anticancer chemotherapy. Acta Pharmacol. Sin. 35, 1–10. doi: 10.1038/aps.2013.131
PubMed Abstract | Full Text | CrossRef Full Text | Google Scholar
Mattarollo, S. R., Loi, S., Duret, H., Ma, Y., Zitvogel, L., and Smyth, M. J. (2011). Pivotal role of innate and adaptive immunity in anthracycline chemotherapy of established tumors. Cancer Res. 71, 4809–4820. doi: 10.1158/0008-5472.CAN-11-0753
PubMed Abstract | Full Text | CrossRef Full Text | Google Scholar
McClurg, P., Janes, J., Wu, C., Delano, D. L., Walker, J. R., Batalov, S., et al. (2007). Genomewide association analysis in diverse inbred mice: power and population structure. Genetics 176, 675–683. doi: 10.1534/genetics.106.066241
PubMed Abstract | Full Text | CrossRef Full Text | Google Scholar
Mi, H., Lazareva-Ulitsky, B., Loo, R., Kejariwal, A., Vandergriff, J., Rabkin, S., et al. (2005). The PANTHER database of protein families, subfamilies, functions and pathways. Nucleic Acids Res. 33, D284–D288. doi: 10.1093/nar/gki078
PubMed Abstract | Full Text | CrossRef Full Text | Google Scholar
Moreau, Y., and Tranchevent, L. C. (2012). Computational tools for prioritizing candidate genes: boosting disease gene discovery. Nat. Rev. Genet. 13, 523–536. doi: 10.1038/nrg3253
PubMed Abstract | Full Text | CrossRef Full Text | Google Scholar
Muresan, V., and Ladescu Muresan, Z. (2015). Amyloid-β precursor protein: multiple fragments, numerous transportroutes and mechanisms. Exp. Cell Res. doi: 10.1016/j.yexcr.2014.12.014. [Epub ahead of print].
PubMed Abstract | Full Text | CrossRef Full Text | Google Scholar
Nichols, J. L., Gladwell, W., Verhein, K. C., Cho, H. Y., Wess, J., Suzuki, O., et al. (2014). Genome-wide association mapping of acute lung injury in neonatal inbred mice. FASEB J. 28, 2538–2550. doi: 10.1096/fj.13-247221
PubMed Abstract | Full Text | CrossRef Full Text | Google Scholar
Raval, R. R., Sharabi, A. B., Walker, A. J., Drake, C. G., and Padmanee, S. (2014). Tumor immunology and cancer immunotherapy: summary of the 2013 SITC primer. J. Immunother. Cancer 2:14. doi: 10.1186/2051-1426-2-14
PubMed Abstract | Full Text | CrossRef Full Text | Google Scholar
Ross, C., Visscher, H., Rassekh, S. R., Castro-Pastrana, L. I., Shereck, E., Carleton, B., et al. (2011). Pharmacogenomics of serious adverse drug reactions in pediatric oncology. J. Popul. Ther. Clin. Pharmacol. 18, e134–e151.
Ruiz-León, Y., and Pascual, A. (2004). Regulation of β-amyloid precursor protein expression by brain-derived neurotrophic factor involves activation of both the Ras and phosphatidylinositide 3-kinase signalling pathways. J. Neurochem. 88, 1010–1018. doi: 10.1046/j.1471-4159.2003.02226.x
PubMed Abstract | Full Text | CrossRef Full Text | Google Scholar
Ryan, M. M., Morris, G. P., Mockett, B. G., Bourne, K., Abraham, W. C., Tate, W. P., et al. (2013). Time-dependent changes in gene expression induced by secreted amyloid precursor protein-alpha in the rat hippocampus. BMC Genomics 14:376. doi: 10.1186/1471-2164-14-376
PubMed Abstract | Full Text | CrossRef Full Text | Google Scholar
Sherry, S. T., Ward, M. H., Kholodov, M., Baker, J., Phan, L., Smigielski, E. M., et al. (2001). dbSNP: the NCBI database of genetic variation. Nucleic Acids Res. 29, 308–311. doi: 10.1093/nar/29.1.308
PubMed Abstract | Full Text | CrossRef Full Text | Google Scholar
Stocco, G., Cheok, M. H., Crews, K. R., Dervieux, T., French, D., Pei, D., et al. (2008). Genetic polymorphism of inosine triphosphate pyrophosphatase is a determinant of mercaptopurine metabolism and toxicity during treatment for acute lymphoblastic leukemia. Clin. Pharmacol. Ther. 85, 164–172. doi: 10.1038/clpt.2008.154
PubMed Abstract | Full Text | CrossRef Full Text | Google Scholar
Stong, C. (2013). Cancer and chemotherapy are associated with a reduced Alzheimer's risk. Neurol. Rev. 21, 1–22.
Tabarés-Seisdedos, R., and Rubenstein, J. L. (2013). Inverse cancer comorbidity: a serendipitous opportunity to gain insight into CNS disorders. Nat. Rev. Neurosci. 14, 293–304. doi: 10.1038/nrn3464
PubMed Abstract | Full Text | CrossRef Full Text | Google Scholar
Takagi, K., Ito, S., Miyazaki, T., Miki, Y., Shibahara, Y., Ishida, T., et al. (2013). Amyloid precursor protein in human breast cancer: an androgen-induced gene associated with cell proliferation. Cancer Sci. 104, 1532–1538. doi: 10.1111/cas.12239
PubMed Abstract | Full Text | CrossRef Full Text | Google Scholar
Thinakaran, G., and Koo, E. H. (2008). Amyloid precursor protein trafficking, processing, and function. J. Biol. Chem. 283, 29615–29619. doi: 10.1074/jbc.R800019200
PubMed Abstract | Full Text | CrossRef Full Text | Google Scholar
Thomas, P. D., Campbell, M. J., Kejariwal, A., Mi, H., Karlak, B., Daverman, R., et al. (2003). PANTHER: a library of protein families and subfamilies indexed by function. Genome Res. 13, 2129–2141. doi: 10.1101/gr.772403
PubMed Abstract | Full Text | CrossRef Full Text | Google Scholar
Topalian, S. L., Hodi, F. S., Brahmer, J. R., Gettinger, S. N., Smith, D. C., McDermott, D. F., et al. (2012). Safety, activity, and immune correlates of anti–PD-1 antibody in cancer. N. Engl. J. Med. 366, 2443–2454. doi: 10.1056/NEJMoa1200690
PubMed Abstract | Full Text | CrossRef Full Text | Google Scholar
Uberti, D., Cenini, G., Olivari, L., Ferrari-Toninelli, G., Porrello, E., Cecchi, C., et al. (2007). Over-expression of amyloid precursor protein in HEK cells alters p53 conformational state and protects against doxorubicin. J. Neurochem. 103, 322–333. doi: 10.1111/j.1471-4159.2007.04757.x
PubMed Abstract | Full Text | CrossRef Full Text | Google Scholar
van Kuilenburg, A., Haasjes, J., Richel, D. J., Zoetekouw, L., Lenthe, H. V., Abreu, R., et al. (2000). Clinical implications of dihydropyrimidine dehydrogenase (DPD) deficiency in patients with severe 5-fluorouracil-associated toxicity: identification of new mutations in the DPD gene. Clin. Cancer Res. 6, 4705–4712.
Vanneman, M., and Dranoff, G. (2012). Combining immunotherapy and targeted therapies in cancer treatment. Nat. Rev. Cancer 12, 237–251. doi: 10.1038/nrc3237
PubMed Abstract | Full Text | CrossRef Full Text | Google Scholar
Wang, J. R., de Villena, F. P. M., and McMillan, L. (2012). Comparative analysis and visualization of multiple collinear genomes. BMC Bioinformatics 13:S13. doi: 10.1186/1471-2105-13-S3-S13
PubMed Abstract | Full Text | CrossRef Full Text | Google Scholar
Waterston, R. H., Lindblad-Toh, K., Birney, E., Rogers, J., Abril, J. F., Agarwal, P., et al. (2002). Initial sequencing and comparative analysis of the mouse genome. Nature 420, 520–562. doi: 10.1038/nature01262
Woods, N. K., and Padmanabhan, J. (2013). Inhibition of amyloid precursor protein processing enhances gemcitabine-mediated cytotoxicity in pancreatic cancer cells. J. Biol. Chem. 288, 30114–30124. doi: 10.1074/jbc.M113.459255
PubMed Abstract | Full Text | CrossRef Full Text | Google Scholar
Yamada, Y., Fujimura, T., Takahashi, S., Takayama, K., Urano, T., Murata, T., et al. (2013). Clinical significance of amyloid precursor protein in patients with testicular germ cell tumor. Adv. Urol. 2013:348438. doi: 10.1155/2013/348438
PubMed Abstract | Full Text | CrossRef Full Text | Google Scholar
Yang, H., Wang, J. R., Didion, J. P., Buus, R. J., Bell, T. A., Welsh, C. E., et al. (2011). Subspecific origin and haplotype diversity in the laboratory mouse. Nat. Genet. 43, 648–655. doi: 10.1038/ng.847
PubMed Abstract | Full Text | CrossRef Full Text | Google Scholar
Zheng, H., Jiang, M., Trumbauer, M. E., Sirinathsinghji, D., Hopkins, R., Smith, D. W., et al. (1995). p-amyloid precursor protein-deficient mice show reactive gliosis and decreased locomotor activity. Cell 81, 525–531. doi: 10.1016/0092-8674(95)90073-X
PubMed Abstract | Full Text | CrossRef Full Text | Google Scholar
Keywords: pharmacogenomics, genome-wide association studies, candidate genes, amyloid precursor protein, anthracyclines, immune cells
Citation: Frick A, Suzuki OT, Benton C, Parks B, Fedoriw Y, Richards KL, Thomas RS and Wiltshire T (2015) Identifying genes that mediate anthracyline toxicity in immune cells. Front. Pharmacol. 6:62. doi: 10.3389/fphar.2015.00062
Received: 23 January 2015; Accepted: 10 March 2015;
Published: 15 April 2015.
Edited by:
Amit V. Pandey, University of Bern, SwitzerlandReviewed by:
Collet Dandara, University of Cape Town, South AfricaNúria Camats, University Children's Hospital Bern, Switzerland
Copyright © 2015 Frick, Suzuki, Benton, Parks, Fedoriw, Richards, Thomas and Wiltshire. This is an open-access article distributed under the terms of the Creative Commons Attribution License (CC BY). The use, distribution or reproduction in other forums is permitted, provided the original author(s) or licensor are credited and that the original publication in this journal is cited, in accordance with accepted academic practice. No use, distribution or reproduction is permitted which does not comply with these terms.
*Correspondence: Amber Frick, Division of Pharmacotherapy and Experimental Therapeutics, Eshelman School of Pharmacy, University of North Carolina, Genetic Medicine Building, 120 Mason Farm Road, Chapel Hill, NC 27510, USA adfrick@email.unc.edu