Simulation of main plasma parameters of a cylindrical asymmetric capacitively coupled plasma micro-thruster using computational fluid dynamics
 Amelia Greig
 Christine Charles
 Roderick W. Boswell
- Space Plasma, Power and Propulsion Laboratory, Research School of Physics and Engineering, The Australian National University, Canberra, ACT, Australia
Computational fluid dynamics (CFD) simulations of a radio-frequency (13.56 MHz) electrothermal capacitively coupled plasma (CCP) micro-thruster have been performed using the commercial CFD-ACE+ package. Standard operating conditions of a 10 W, 1.5 Torr argon discharge were used to compare with previously obtained experimental results for validation. Results show that the driving force behind plasma production within the thruster is ion-induced secondary electrons ejected from the surface of the discharge tube, accelerated through the sheath to electron temperatures up to 33.5 eV. The secondary electron coefficient was varied to determine the effect on the discharge, with results showing that full breakdown of the discharge did not occur for coefficients less than or equal to 0.01.
1. Introduction
The development and use of micro-satellites, such as CubeSat's, has created a need for new micro-propulsion systems that are small, lightweight and low power [1]. The thrust produced needs to be of the order of a few μN to mN, with high propellant efficiency to reduce the need for excessive propellant to be carried on board. Currently, cold gas thrusters are widely used as micro-propulsion devices, where an inert gas is expelled through a nozzle to produce thrust. However, as there is no gas heating within the system the thrust produced per kilogram of propellant is low. Heating the gas through electric or chemical means increases the propellant efficiency or specific impulse (Isp) of the system. Electric heating, used in electric propulsion devices, has advantages over traditional chemical propulsion, due to a higher specific impulse (Isp) [2] and the ability to operate with green propellants, reducing the dangers associated with toxic propellants [3].
Current electric micro-thruster concepts in use or development include resistojets, arcjets, hollow cathode thrusters and a radio-frequency (rf) capillary discharge [1, 4–7]. Small diameter plasma discharges with high operating pressures are also being investigated for use as micro-thrusters, requiring low power densities to produce high density collisional plasmas in small volumes. Within a collisional plasma ion-neutral charge exchange collisions accelerate the background neutrals in a process termed “neutral pumping” [8–10], resulting in neutral gas heating and an increase in momentum of the neutral gas component of the plasma jet. Unlike larger diameter lower pressure plasma devices, such as the Helicon Double Layer Thruster (HDLT), that produce thrust through ion accerelation in an expanding plasma [11, 12], these smaller plasma systems rely on the neutral gas to produce the thrust, hence increasing the momentum of the neutral gas increases thrust. An example of a thruster designed on this principle is an asymmetric hollow cathode glow discharge, estimated to produce 1 mN of thrust for a 1 kW power input [7].
Another thruster based on the concept of neutral gas heating from ion-neutral charge exchange collisions, currently under development at The Australian National University, is an electrothermal radio-frequency (rf) capacitively coupled plasma (CCP) discharge device, known as “Pocket Rocket” [13, 14]. Recent rovibrational spectroscopy experiments have confirmed a neutral gas temperature around 1100 K in argon at 10 W for pressures between 0.5 Torr and 4.0 Torr [15] with heating occuring from collisions within the plasma volume and surface heating from ion bombardment [16]. Argon gas is the standard operating propellant and is used in this work. Nitrogen gas (N2) is occasionally used as the operating propellant for experimental spectroscopy diagnostics, however due to the higher number of internal degrees of freedom in a diatomic nitrogen molecule compared with atomic argon, the neutral gas temperature achieved is lower (~430 K for 10 W power input 15), hence the effectiveness as a thruster is reduced. Heavier noble elements such as krypton or xenon are also suitable propellant gases although more expensive.
The physical Pocket Rocket device currently consists of a 18 mm long, 4.2 mm inside diameter alumina tube, with a powered copper electrode placed at the midpoint and two grounded aluminum electrodes placed at either end of the tube, as shown in Figure 1. Operational rf power (13.56 MHz) in the order of a few tens of Watts is coupled to the CCP discharge within the tube. The use of rf power introduces some technical challenges in regards to power system size, such as miniaturizing the matching network, which are currently being overcome [17]. The discharge gas is held at pressures around a few Torr in an upstream plenum chamber with grounded aluminum walls before passing through the tube. Downstream, a glass expansion tube with 50 mm diameter connects the device to a vacuum chamber fitted with a rotary pump, creating pressures in the vacuum chamber approximately two times lower than in the plenum chamber. The end plate of the device connecting to the glass tube (thick black line at start of expansion tube in Figure 1) is also grounded aluminum, creating a large asymmetry between the powered and grounded electrode areas resulting in a self-bias developing on the alumina (dielectric) tube. The plasma discharge produced has an ionization degree around 0.44% [15] at 1.5 Torr and 10 W, giving peak plasma densities in the center of the tube around 2 × 1012 cm−3 [14].
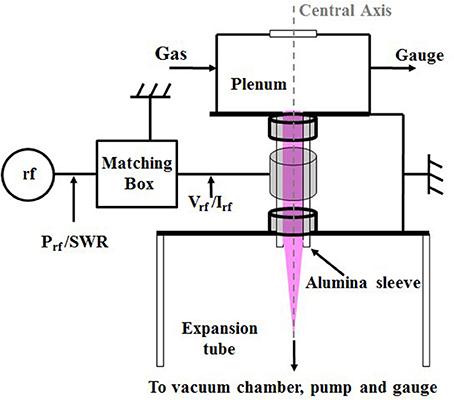
Figure 1. The physical Pocket Rocket device.
Electric probe measurements of plasma parameters in Pocket Rocket are difficult as the diameter of the discharge tube is not much larger than the diameter of the probe tip. Optical measurements are useful as they are non-invasive and measurements of parameters such as radical concentrations [18], electron density profiles [14] and gas temperature [15, 19] can be made. Computer based modeling such as particle-in-cell (PIC) and computational fluid dynamics (CFD) simulations provide alternate methods to experiments for analyzing plasma based discharges. Fully kinetic PIC simulations of rf CCP discharges have previously been performed for one [20–23], two [24, 25] and three [26] spatial dimensions. However, higher dimension PIC simulations become very computationally expensive. Computational fluid dynamics (CFD) simulations provide a fluid model alternative to PIC simulations, where fluid based equations are solved over a gridded geometry using numerical methods. Successful CFD simulations utilizing commercial packages, such as CFD-ACE+ (Computational Fluid Dynamics Advaced Computing Environment), have been performed for weakly ionized and dual frequency CCPs [27–29]. Here the CFD-ACE+ package is used for a 2D fluid based simulation giving the main plasma parameters (electron density and temperature, plasma potential, DC bias, etc.) of the Pocket Rocket device, for comparison with previously obtained experimental results.
2. Simulation Model
The CFD-ACE+ package contains different modules that can be selected to analyze different problem types. This rf CCP simulation utilizes the flow, turbulence, electric, chemistry and plasma modules and the following is a brief description of the main equations and theory used by the CFD-ACE+ program. A transient simulation is used to allow the rf period behavior of the discharge to be analyzed, as well as the steady state (rf phase averaged) solution.
The governing equations for the heavy particle flow parameters are mass conservation and the Navier-Stokes equation, given in Equations 1 and 2 respectively, where ρ is density, is velocity, μ is viscosity (taken as constant 2.09 × 10⁻⁵ kgm−3 for argon) and SMx represents momentum added from any defined source, such as the inlet. The pressure, p, is the sum of the static partial pressures for all heavy species, calculated from the ideal gas law and the electron pressure (pe), calculated as pe = nekTe, where ne is electron density, k is Boltzmann's constant and Te is the electron temperature.
A transport equation of the form shown in Equation 3 is solved for each species including ions, where Yk is the species mass fraction, defined as the mass of the kth species per mixture unit mass, Jk is diffusion flux, Mk is the molecular weight of the species, and ωk is the production rate of the kth species from reactions.
For ions, the effect of ion drift must also be considered, with ion mass flux given by Equation 4.
Here, Di is the diffusion coefficient, is ion drift velocity relative to , and is a correction/source term to account for ion creation and loss and ensure species flux conservation holds. The diffusion coefficient (Di) is taken to be the same as the corresponding neutral particle, with ion mobility (μi) then solved for using Einstein's relation, , where ion temperature (Ti) is approximated as the neutral gas temperature. As the pressures used in Pocket Rocket are around a few Torr, it is assumed the collision frequency of ions is sufficiently high to use the drift diffusion approximation for ion drift velocity (, where qi is the charge of the ion and the electric field), rather than solving directly for ion momentum.
A standard k − ϵ turbulence model is included for all heavy species (refer to Launder and Spaulding [30] for full details of this model), however, the low pressure in the system results in little difference (~2.4%) between fully laminar and turbulent simulations. Heavy particle surface reactions are invoked, such that on collision with a wall an ion or excited neutral will return to the neutral ground state. Four volumetric gas phase reactions are used in the simulation, being elastic collisions between heavy particles and electrons, electron impact ionization, electron impact excitation and stepwise ionization, with rate coefficients and cross sectional data from the JILA database, University of Colorado, as included in the CFD-ACE+ package.
The applied rf field and space charge effects from ions and electrons, are solved using Poisson's equation (Equation 5) for the electrostatic potential (ϕ)
where ϵ is the permittivity of the local medium (taken as 1 for argon and 9.3 for alumina), e is electron charge, qi is the charge on the ith ion and ne and ni are the electron and ion densities, respectively. Particle fluxes are used to calculate space charge (σ) accumulation on the surface of the alumina (dielectric) as shown in Equation 6, where Γi,n is the flux of ions normal to the surface.
Electron flux normal to the wall surface (Γe,n) is given by Equation 7 where is the thermal electron velocity and γ is the secondary electron emission coefficient.
Electron behavior is modeled using the electron drift diffusion approximation (Equation 8) for electron density flux (Γe) and the electron balance equation (Equation 9)
where Se accounts for electrons produced or consumed in chemical reactions and μe is electron mobility. Electron diffusivity (De) is calculated using
where me is the mass of an electron, ke is kinetic energy, νm is electron-ion collision frequency and C is the Maxwellian distribution scaling factor. The electrons are assumed to follow a single temperature Maxwellian distribution due to high collision frequencies within the high pressure discharge, and the electron temperature (Te) is calculated using the electron energy balance equation
where is the coefficient of electron conduction. Energy loss from collisions is equated by the sum term with nr, cr and kr being the density, coefficient of collisional energy loss and kinetic energy of the collisional species, respectively. Power density (P) includes stochastic sheath heating and Joule heating. Joule heating is defined as PJoule = eΓe.(∇ϕ). Stochastic heating is considered only in the sheath region near the powered electrode and is given by Equation 12 [31],
where ω is the angular driving frequency at the rf electrode and V is the potential difference between the rf electrode and current grid point. However, higher operating pressures and self bias that develops on the alumina tube in Pocket Rocket from the large asymmetry of the device means stochastic heating effects are small and the majority of electron heating comes from Joule heating. Heating of the neutrals from ions (through charge exchange or momentum transfer collisions for example) is not included in this simulation, with neutral gas temperature assumed to be a constant 300 K throughout the model.
To ensure both heavy particles and electron kinetics are correctly captured by the simulation, a dual time-step approach was implemented. The heavy particle parameters were solved using a time step of 7.382 μs, longer than the period of one rf cycle (~72 ns), as the larger masses do not move sufficiently within an rf period to affect the results. Electrons, being much lighter, will exhibit sufficient movement within an rf cycle that must be resolved, therefore electron kinetics were solved using a time scale of th of an rf period.
As the Pocket Rocket device is cylindrically symmetric, the CFD model used was the top half of an axial 2D cross section, with an axisymmetry condition applied around the central axis of the discharge tube. The plenum chamber, discharge tube, alumina tube with electrode surfaces and glass expansion tube were included in the simulation. The mesh was refined to be smaller in regions of interest, such as the discharge tube and near any walls expected to produce sheaths, as shown in Figure 2. To ensure the results of the simulations were independant of the grid used, a mesh independance study was undertaken using grids with 2054, 4756, and 11075 total cells, using a simple steady state flow simulation, including turbulence. The change in values for parameters such as velocity and pressure was less that 1% from the 4756 cell and 11075 cell simulations. Therefore, to save on computing time while maintaining a high degree of accuracy, the 4756 cell mesh was used.
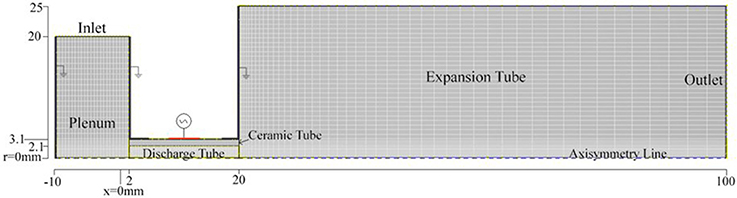
Figure 2. Pocket Rocket model dimensions and mesh distribution used for CFD simulations.
A 13.56 MHz sinusoidal voltage with maximum amplitude Vrf = 240 V was applied to the powered electrode, which corresponds to 10 W power input from previous experiments [14]. The alumina tube was specified as a dielectric with an initial value of 0.1 used for the secondary electron emission coefficient. Pure argon was introduced through an inlet on the top of the plenum chamber to give a gas pressure of 1.5 Torr in the plenum. The base pressure at the outlet of the expansion tube (x = 100 mm, see Figure 2) was set to 0.75 Torr giving a pressure gradient of two between the model inlet and outlet, to match experiments and ensure the downstream component of the simulation (within the expansion tube) remained within the fluid regime.
Before commencing the more complicated 2D Pocket Rocket simulations, a simple 1D parallel plate CCP was modeled using the same parameters as a previous study performed with the benchmarked 1D PHOENIX PIC code from Lafleur et al. [20], to ensure CFD-ACE+ correctly handles the basic CCP features, such as sheaths. An argon CCP discharge at 100 mTorr created by symmetric electodes placed 20 mm apart, one grounded and one carrying an rf (13.56 MHz) voltage with maximum amplitude of 270 V, was modeled using the CFD-ACE+ program. A Maxwellian electron distribution and secondary electron coefficient of 0.1 were used to match the PHOENIX PIC simulation.
While this simulation has a larger physical dimension and lower pressure than Pocket Rocket, applying the scaling law using a factor of 5 gives a 4 mm physical length scale (approximately the same as the Pocket Rocket tube diameter), which when maintaining a constant pD (pressure-distance) value gives a pressure of 0.5 Torr. This is a factor of three higher than the 1.5 Torr pressure stated for Pocket Rocket in the upstream plenum, but as the pressure decreases throughout the Pocket Rocket tube to 0.75 Torr downstream, the pressure at the center of the tube is likely to be around 1–1.2 Torr, closer to the scaled pressure value. Although this does not exactly match the Pocket Rocket parameters, the difference is small enough for the benchmarked PIC simulation to provide a suitable simplified test case for the CFD-ACE+ solution.
The resulting phase resolved rf electrode voltage and plasma potential for the 1D simulation are shown in Figure 3A over two rf periods and time averaged electron and ion densities are shown in Figure 3B. The plasma potential in Figure 3A is taken at the midpoint between the two electrodes (at x = 10 mm) and oscillates between the maximum rf input voltage of 270 V and just above 0 V. The time averaged plasma potential is represented by the straight dotted line and is found to be 100 V, matching the time averaged plasma potential at the midpoint of the PIC simulation [20]. The maximum ion and electron density occurs at the midpoint of the discharge, reaching 9.9 × 10¹⁵ m−3 and tapering off by an order of magnitude at the electrodes, again matching the PIC simulation that gave a density in the order of 6 × 10¹⁵ m−3.
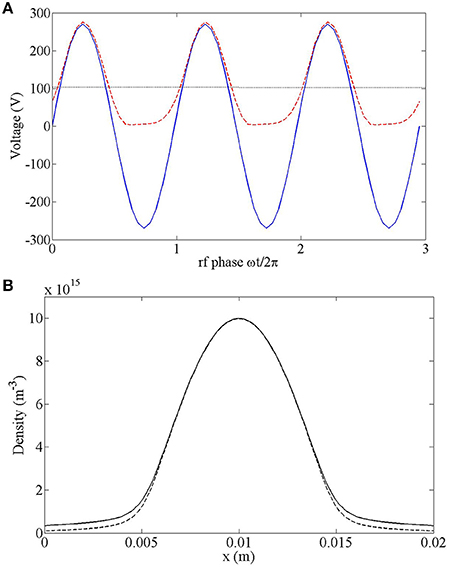
Figure 3. CFD simulation results for a 1D parallel plate CCP over three rf periods showing (A) phase resolved electrode voltage (blue solid line), phase resolved plasma potential at the central point (x = 10 mm) (red dashed line) and phase averaged plasma potential at the central point (x = 10 mm) (black dotted line) and (B) phase averaged ion (solid line) and electron (dashed line) density.
3. Results and Discussion
While the focus of this study is the main plasma parameters such as electron density and temperature, plasma potential and bias voltage, the CFD simulation provided full spatial results for a variety of other parameters as well. Although most are not included here, Figure 4 shows 2D phase averaged plots of the neutral gas density (a) and the plasma density (b) within the discharge tube (the full 2D plot has been cropped to show only the region of interest (discharge tube) for ease of viewing). The low ionization degree in Pocket Rocket (0.44% 15) means the plasma has little affect on the neutral gas density, although direct heating of neutrals from ions is not included here so the effects may be underestimated slightly.
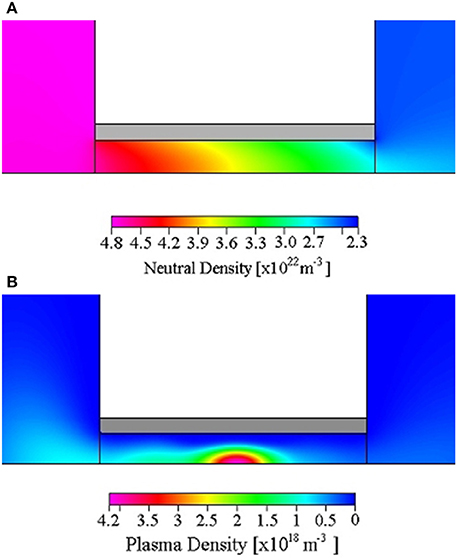
Figure 4. Two dimensional, time averaged CFD simulation results for (A) neutral gas density and (B) plasma density within the discharge tube. The full 2D plot has been cropped to show only the region of interest (discharge tube) for ease of viewing.
Phase averaged results for plasma potential (Vp), electron density (ne) and electron temperature (Te) along the central axis of the thruster are shown in Figure 5. The plasma potential and electron density are both found to peak in the center of the discharge tube, in line with the rf electrode which lies between x = 9.5 mm and 13.5 mm. Peak plasma (electron) density from the simulation measures 4.1 × 10¹⁸m−3, approximately a factor of two higher than previous experimental and global model estimates in the same axial location from Charles et al. [14] of 1.8 × 10¹⁸ m−3 and 2.4 × 10¹⁸ m−3, respectively. The higher density found with the simulation may be caused by the omission of plasma heating effects, giving a lower simulation neutral gas temperature, resulting in higher background neutral densities and hence higher plasma densities. However, the global model also did not account for neutral gas heating, so it is unlikely the heating affects are causing the complete disrepancy between the three results.
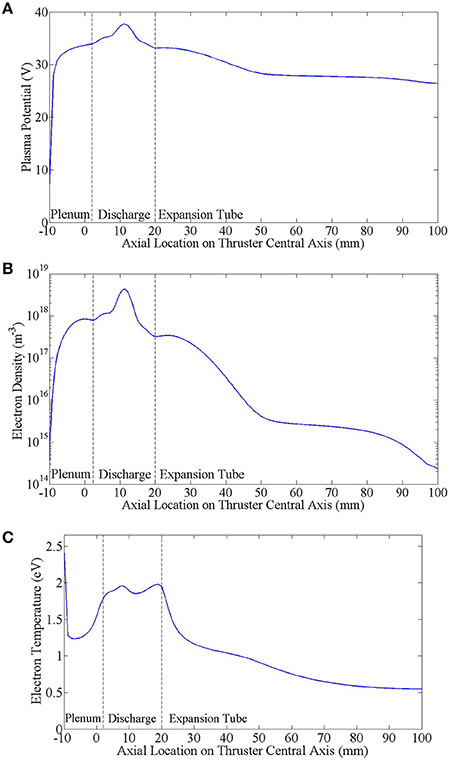
Figure 5. Time averaged CFD simulation results for (A) plasma potential, (B) electron density and (C) electron temperature along the central axis, including the plenum chamber, discharge tube and expansion tube.
The plasma potential decreases to 33 V at the discharge tube exit, matching experiments done by Dixon et al. [32] on a similar experimental setup, showing a plasma potential around 32 V near the tube exit for an approximately 1.5 Torr argon plasma. Electron temperature within the discharge tube lies between 1.85 and 1.95 eV, slightly lower than but in agreement with global model estimates of 2 eV [14]. Upstream (near x = −10 mm), a sheath forms on the grounded plenum chamber walls, creating hot ion-induced secondary electrons, causing the peak in Te of 2.5 eV. Downstream in the expansion tube the electron temperature rapidly decreases to <1 eV as the plasma expands into the larger volume and cools.
In the Pocket Rocket device, there is a large asymmetry between the powered rf electrode area and the grounded area (including the grounded electrodes and plenum walls) and a non-uniform axial density profile [14] resulting in a self bias developing on the alumina tube insert. This is clearly visible in Figure 6, showing phase resolved potentials on the powered electrode and inner alumina tube surface and the plasma potential on the central axis of the tube, all measured at the lengthwise midpoint of the tube (x = 11 mm).
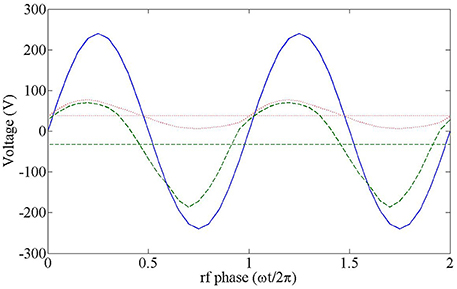
Figure 6. Phase resolved voltage at x = 11 mm on the rf electrode (solid blue line), inner alumina tube surface (dashed green line) and plasma potential on the central axis of the tube (dotted red line) over two rf cycles. Phase averaged plasma potential on the central axis is shown as the straight red dotted line and phase averaged inner alumina tube surface voltage is shown as the straight dashed green line.
The voltage on the inner alumina tube surface oscillates between 70 V and −180 V, with a DC bias of −33 V. Sheath capacitance model calculations previously performed estimate the inner surface of the alumina tube will develop a bias of −36 V [14], very similar to the −33 V produced by the simulation. A slight phase offset between the inner alumina tube surface and the powered electrode voltage is also visible, which is characteristic of the response voltage on the inner surface of a cylindrical dielectric tube with applied rf voltage on the outside [33]. The plasma potential follows the phase of the inner alumina surface voltage and matches the maximum positive voltage as expected for a potential surface in direct contact with a CCP. The time average plasma potential on the central axis is found to be 38 V, somewhat higher than the estimated value of ~22 V from a global plasma model [14], which only considered the discharge volume and neglected the plenum chamber and downstream expansion area.
Figure 7 shows phase resolved results for electron temperature (Te), electron density (ne) and ion density (ni) at a point 0.1 mm from the inner surface of the alumina tube directly in line with the center of the rf electrode (coordinates x = 11 mm, r = 2 mm in Figure 2) over one rf period. During the positive half of the rf period (phase<0.5), the electron temperature sits around 1.4 eV. During the negative half of the period (phase>0.5) the electron temperature increases dramatically up to 33.5 eV. This is due to a large negative sheath potential during the negative half of the rf period from the self bias that develops on the surface of the ceramic tube, acting to accelerate the ion induced secondary electrons through the sheath region and into the plasma bulk.
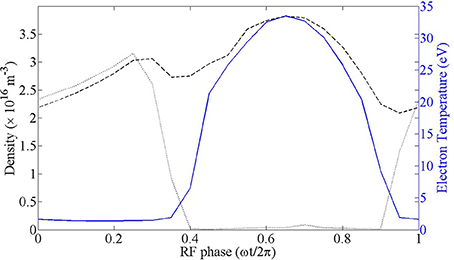
Figure 7. Electron density (black dotted line), ion density (black dashed line) and electron temperature (blue solid line) with rf phase at a point in the discharge in line with the rf electrode (x = 11 mm) and 0.1 mm from the inner surface of the dielectric tube (y = 2 mm).
A corresponding peak in ion density also occurs during the negative half of the period, whereas the electron density becomes two orders of magnitude lower as the electrons are accelerated away from the sheath region. Although the electron density is much lower during the negative half of the rf period, as the electrons reach temperatures of 33.5 eV, a significant number of electrons have energies well above the first ionization potential of argon of 15.76 eV, and the corresponding peak in ion density is to be expected.
The hot ion induced secondary electrons creating a peak in ion density near the alumina tube surface, also results in a peak in ion density in the center of the tube as the ions diffuse into the plasma bulk, previously noted in experiments by Charles et al. [14] as a peak in ion saturation current. Comparison between ion density calculated by the CFD simulation and ion saturation current previously measured by Charles et al. using a Langmuir probe along the central axis of the discharge tube is shown in Figure 8. Although direct quantitative comparison is not possible, ion current is proportional to ion density [34] and a qualitative comparison is made here. Both the experimental ion current and simulated ion density peak at x = 11 mm corresponding to the center of the rf electrode. Downstream of the peak, the experimental ion saturation current values appear to taper off slower than the simulation ion densities due to flow constriction from the Langmuir probe increasing error bars in that region.
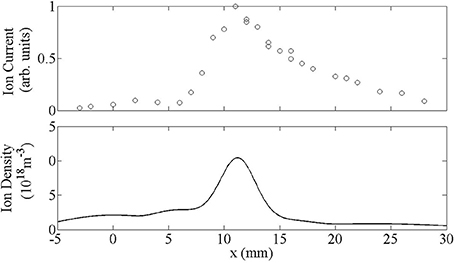
Figure 8. Ion saturation currents along the central axis measured using a Langmuir Probe (top) and simulated ion density along the central axis (bottom).
These results show the main plasma bulk appears to be driven by ion induced secondary electrons accelerated through the sheath region by the large negative potential developed on the alumina tube from the self bias formed by asymmetry of the device. Hence, the secondary electron coefficient input into the simulation is one of the most important unknown values in that it can have a dramatic effect on plasma parameters but is not easily measurable from experiments. A recent 2D PIC simulation of a hollow cathode discharge showed the discharge was driven by secondary electrons or so called ‘Gamma’ electrons and sheath heating was not sufficient to sustain the discharge with secondary electrons turned off [24]. To investigate the role of secondary electrons in the Pocket Rocket device, the above CFD simulation was repeated with secondary electron emission coefficients of 0.001, 0.01, 0.02, 0.05, and 0.2, with the resulting axial ion densities shown in Figure 9, including the original results using a secondary electron emission coefficient of 0.1.
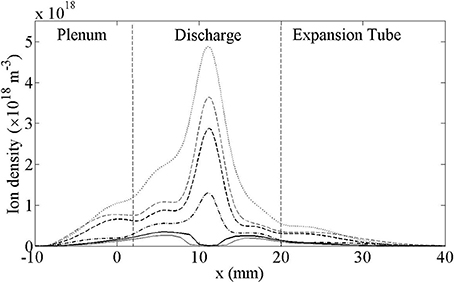
Figure 9. Ion density along the central axis with changing secondary electron coefficient on the alumina tube and grounded metal walls. Coefficients are 0.001 (solid gray line), 0.01 (solid black line), 0.02 (dot dashed black line), 0.05 (dashed black line), 0.1 (dashed gray line) and 0.2 (dotted black line).
For secondary electron emission coefficients of 0.02 or above, the resulting axial ion density is consistent with experimental results in terms of a single peak density located at the midpoint of the discharge tube (x = 11 mm), but the peak density varies from 1.3 × 10¹⁸m−3 to 4.9 × 10¹⁸m−3. It is therefore likely an overestimation of the secondary electron emission coefficient is contributing to the simulation density being higher than the experimental and global model estimates (1.8 × 10¹⁸ m−3 and 2.4 × 10¹⁸ m−3, respectively 14). For secondary electron coefficients of 0.01 or less, the ion density along the central axis develops a two peak distribution, with a drop in density around x = 11 mm, diverging from experimental results. With secondary electrons turned off, the solution converged also with the two peak distribution, but produced unrealistic densities, suggesting the role of secondary electrons is crucial within the Pocket Rocket discharge, similar to the hollow cathode PIC simulations.
It would seem that with no or low secondary electron effects, plasma breakdown still occurs between the rf and grounded electrodes creating low plasma densities in those regions. These ions then bombard the surface of the dielectric, especially in the center where the large self bias develops. However, if the secondary electron coefficient is too low the number of ion induced secondary electrons accelerated by the sheath in the vicinity of the rf electrode to energies above the ionization energy of argon is not sufficient to create the main central plasma peak observed in experiments.
Mean free path for electron-argon collisions within the sheath region, using a neutral density in the central region of the tube of 3.5 × 10²² m−3 (see Figure 4) and cross sectional data from the JILA database, University of Colorado, ranges from 0.57 mm for an electron energy of 2 eV (σ = 3.52 × 10⁻²⁰ m−2), to 85 μm for an electron energy of 14 eV (σmax = 23.8 × 10⁻²⁰ m−2) and around 0.91 mm for energetic tail electrons with an electron energy of 180 eV (σ = 6.42 × 10⁻²⁰ m−2) based on the maximum sheath potential that develops during the rf cycle (see Figure 6). Sheath width is estimated as ~0.5 mm, based on the phase-averaged electron and ion density simulation results across the tube radius at x = 11 mm (in line with the center of the rf electrode), taken as the point where ion and electron density distinctly differ as shown in Figure 10. This value is in good agreement with experimental estimates from digital photography [35] of 0.3 mm to 0.6 mm, but higher than estimates made with the Child sheath law of ~ 0.2 mm [14] and is likely slightly overestimated.
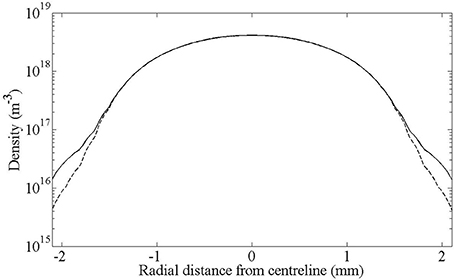
Figure 10. Phase-averaged electron (dashed line) and ion (solid line) density radially across the Pocket Rocket tube, in line with the center of the rf electrode (x = 11 mm).
Based on the above approximations, low energy and energetic tail electrons will not undergo a sufficient number of collisions within the sheath for the fluid approximation to be valid in that region and will instead enter the main plasma bulk as a mono-energetic beam. While the exact effect of this on the simulation results is indeterminate, the good agreement between the simulation and experimental results suggest the effect is small and the simulation results are still reasonable. However, as with all modeling applications, the simulation results are an approximation and should be taken as a guideline only.
4. Conclusion
A computational fluid dynamics simulation of the capacitively coupled plasma micro-thruster Pocket Rocket was performed using CFD-ACE+ for a 10 W, 1.5 Torr argon plasma and has shown good agreement with previous experimental results. Plasma density and plasma potential both reach peak values at the center of the discharge tube, with ion induced secondary electrons emitted from the inner surface of the alumina tube near the rf electrode being accelerated by the sheath to temperatures up to 33.5 eV, driving the main plasma density peak in the center of the tube. The peak plasma density found by the simulation of 4.1 × 10¹⁸m−3 is approximately a factor of two higher than previous experimental and global model estimates in the same axial location (1.8 × 10¹⁸ m−3 and 2.4 × 10¹⁸ m−3, respectively 14), most likely caused by an overestimation of the secondary electron emission coefficient. The secondary electron coeffecient has a dramatic effect on ion density, with both the maximum density value and location changing with secondary electron emission coefficient. In addition, the omission of plasma heating effects in the simulation (and global model) resulting in higher background neutral densities and hence higher plasma densities, may also contribute to the slightly higher simulation peak plasma density when compared to the experimental value.
Conflict of Interest Statement
The authors declare that the research was conducted in the absence of any commercial or financial relationships that could be construed as a potential conflict of interest.
References
1. Goebel DM, and Katz I. Fundamentals of electric propulsion: ion and hall thrusters. In: Yuen JH, editor. John Wiley and Sons (2008) Available onlin at: http://descanso.jpl.nasa.gov/SciTechBook/series1/Goebel_cmprsd_opt.pdf.
2. Charles C. Plasmas for spacecraft propulsion. J Phys D. (2009) 42:163001. doi: 10.1088/0022-3727/42/16/163001
3. Frisbee RH. Advanced space propulsion for the 21st century. J Propul Power (2003) 19:1129–54. doi: 10.2514/2.6948
4. Dunaevsky A, Raites Y, and Fisch N. Plasma acceleration from radio-frequency discharge in dielectric capillary. Appl Phys Lett. (2006) 88:251502. doi: 10.1063/1.2214127
5. Lamprou D, Lappas VJ, Shimizu T, Gibbon D, and Perren M. Hollow cathode thruster design and development for small satellites. In: 32nd International Electric Propulsion Conference. Wiesbaden (2011).
6. Martinez-Sanchez M, and Pollard JE. Spacecraft electric propulsion - an overview. J Propul Power. (1998) 14:688–99. doi: 10.2514/2.5331
7. Blackhall L, and Khachan J. A simple electric thruster based on ion charge exchange. J Phys D. (2007) 40:2491. doi: 10.1088/0022-3727/40/8/011
Pubmed Abstract | Pubmed Full Text | CrossRef Full Text | Google Scholar
8. Fruchtman A. Energizing and depletion of neutrals by a collisional plasma. Plasma Sources Sci Technol. (2008) 17:024016. doi: 10.1088/0963-0252/17/2/024016
9. Fruchtman A. The thrust of a collisional-plasma source. IEEE Trans Plasma Sci. (2011) 39:530–9. doi: 10.1109/TPS.2010.2089067
10. Fruchtman A. Neutral depletion in a collisionless plasma. IEEE Trans Plasma Sci. (2008) 36:403–13. doi: 10.1109/TPS.2008.918777
11. Charles C. A review of recent laboratory double layer experiments. Plasma Sources Sci Technol. (2007) 16:R1. doi: 10.1088/0963-0252/16/4/R01
12. Charles C, and Boswell R. Current-free double-layer formation in a high-density helicon discharge. Appl Phys Lett. (2003) 82:1356–8. doi: 10.1063/1.1557319
13. Boswell R, Charles C, Alexander P, Dedrick J, and Takahashi K. Plasma expansion from a radio frequency microdischarge. Plasma Sci IEEE Trans. (2011) 39:2512–3. doi: 10.1109/TPS.2011.2143434
14. Charles C, and Boswell RW. Measurement and modeling of a radiofrequency micro-thruster. Plasma Sources Sci Technol. (2012) 21:022002. doi: 10.1088/0963-0252/21/2/022002
15. Greig A, Charles C, Hawkins R, and Boswell RW. Direct measurement of neutral gas heating in a radio-frequency electrothermal plasma micro-thruster. Appl Phys Lett. (2013) 103:074101. doi: 10.1063/1.4818657
16. Greig A, Charles C, Paulin N, and Boswell RW. Volume and surface propellant heating in an electrothermal radio-frequency plasma micro-thruster. Appl Phys Lett. (2014) 105:054102. doi: 10.1063/1.4892656
17. Charles C, Boswell RW, and Bish A. Low-weight fixed ceramic capacitor impedance matching system for an electrothermal plasma microthruster. J Propul Power (2014) 30:1117–21. doi: 10.2514/1.B35119
18. Gottscho RA, and Donnelly VM. Optical emission actinometry and spectral line shapes in rf glow discharges. J Appl Phys. (1984) 56:245–50. doi: 10.1063/1.333954
19. Phillips DM. Determination of gas temperature from unresolved bands in the spectrum from a nitrogen discharge. J Phys D. (1976) 9:507. doi: 10.1088/0022-3727/9/3/017
20. Lafleur T, Boswell RW, and Booth JP. Enhanced sheath heating in capacitively coupled discharges due to non-sinusoidal voltage waveforms. Appl Phys Lett. (2012) 100:194101. doi: 10.1063/1.4712128
21. Roberto M, Smith HB, and Verboncoeur JP. Influence of metastable atoms in radio-frequency argon discharges. Plasma Sci IEEE Trans. (2003) 31:1292–8. doi: 10.1109/TPS.2003.820682
22. Vender D, and Boswell RW. Electron–sheath interaction in capacitive radio-frequency plasmas. In: 38th National Symposium of the American Vacuum. Vol. 10. (1992). p. 1331–8. Available from: http://link.aip.org/link/?JVA/10/1331/1.
23. Smith HB. Studies of plasma breakdown and decay in a capacitive radiofrequency argon discharge. Phys Plasmas (1998) 5:3469–76. doi: 10.1063/1.873060
24. Lafleur T, and Boswell RW. Particle-in-cell simulations of hollow cathode enhanced capacitively coupled radio frequency discharges. Phys Plasmas (2012) 19:023508. doi: 10.1063/1.3685709
25. O'Connell D, Zorat R, Ellingboe AR, and Turner MM. Comparison of measurements and particle-in-cell simulations of ion energy distribution functions in a capacitively coupled radio-frequency discharge. Phys Plasmas (2007) 14:103510. doi: 10.1063/1.2795634
26. Matyash K, Schneider R, Taccogna F, Hatayama A, Longo S, Capitelli M, et al. Particle in cell simulation of low temperature laboratory plasmas. Contrib Plasma Phys. (2007) 47:595–634. doi: 10.1002/ctpp.200710073
27. Kolobov VI. Fokker-planck modeling of electron kinetics in plasmas and semiconductors. Comput Mater Sci. (2003) 28:302–20. doi: 10.1016/S0927-0256(03)00115-0
28. Lu Y, Yan D, and Chen Y. 2-D fluid simulation of dual-frequency capacitively coupled plasma. J Hydrodyn Ser B. (2009) 21:814–9. doi: 10.1016/S1001-6058(08)60217-6
29. Rakhimova TV, Braginsky OV, Ivanov VV, Kim TK, Kong JT, Kovalev AS, et al. Experimental and theoretical study of RF plasma at low and high frequency. Plasma Sci IEEE Trans. (2006) 34:867–77. doi: 10.1109/TPS.2006.875849
30. Launder BE, and Spalding DB. The numerical computation of turbulent flows. Comput Methods Appl Mech Eng. (1974) 3:269–89. doi: 10.1016/0045-7825(74)90029-2
31. Lee I, Graves DB, and Lieberman MA. Modeling electromagnetic effects in capacitive discharges. Plasma Sources Sci Technol. (2008) 17:015018. doi: 10.1088/0963-0252/17/1/015018
32. Dixon S, Charles C, and Boswell R. Spatial evolution of EEPFs in a millimetre scale radio frequency argon plume. J Phys D. (2013) 46:365202. doi: 10.1088/0022-3727/46/36/365202
33. Butler HS, and Kino GS. Plasma sheath formation by radio-frequency fields. Phys Fluids (1963) 6:1346–1355. doi: 10.1063/1.1706905
34. Sheridan TE. How big is a small Langmuir probe? Phys Plasmas (2000) 7:3084–8. doi: 10.1063/1.874162
Keywords: plasma thruster, computational fluid dynamics, radiofrequency plasmas, micro-discharge, electric propulsion
Citation: Greig A, Charles C and Boswell RW (2015) Simulation of main plasma parameters of a cylindrical asymmetric capacitively coupled plasma micro-thruster using computational fluid dynamics. Front. Phys. 2:80. doi: 10.3389/fphy.2014.00080
Received: 23 September 2014; Accepted: 05 December 2014;
Published online: 06 January 2015.
Edited by:
Jean-Pierre Boeuf, University of Toulouse CNRS, FranceReviewed by:
Gerjan Hagelaar, University of Toulouse CNRS, FranceEmilie Despiau-Pujo, LTM - University Grenoble Alpes/CNRS/CEA-Leti Minatec, France
Copyright © 2015 Greig, Charles and Boswell. This is an open-access article distributed under the terms of the Creative Commons Attribution License (CC BY). The use, distribution or reproduction in other forums is permitted, provided the original author(s) or licensor are credited and that the original publication in this journal is cited, in accordance with accepted academic practice. No use, distribution or reproduction is permitted which does not comply with these terms.
*Correspondence: Christine Charles, Space Plasma, Power and Propulsion Laboratory, Research School of Physics and Engineering, The Australian National University, Building 60, Mills Road, Canberra, ACT 0200, Australia e-mail: christine.charles@anu.edu.au