An algorithm for finding candidate synaptic sites in computer generated networks of neurons with realistic morphologies
- Computational Neuroscience Group, Department of Integrative Neurophysiology, Center for Neurogenomics and Cognitive Research, Vrije Universiteit Amsterdam, Amsterdam, Netherlands
Neurons make synaptic connections at locations where axons and dendrites are sufficiently close in space. Typically the required proximity is based on the dimensions of dendritic spines and axonal boutons. Based on this principle one can search those locations in networks formed by reconstructed neurons or computer generated neurons. Candidate synapses are then located where axons and dendrites are within a given criterion distance from each other. Both experimentally reconstructed and model generated neurons are usually represented morphologically by piecewise-linear structures (line pieces or cylinders). Proximity tests are then performed on all pairs of line pieces from both axonal and dendritic branches. Applying just a test on the distance between line pieces may result in local clusters of synaptic sites when more than one pair of nearby line pieces from axonal and dendritic branches is sufficient close, and may introduce a dependency on the length scale of the individual line pieces. The present paper describes a new algorithm for defining locations of candidate synapses which is based on the crossing requirement of a line piece pair, while the length of the orthogonal distance between the line pieces is subjected to the distance criterion for testing 3D proximity.
Introduction
Activity dynamics underlying cognition depends crucially on the patterns and strengths of synaptic connections between neurons. During development neurons grow out by elongation and branching of dendritic and axonal arbors. Synaptic connections can form when axonal and dendritic branches of neurons come sufficiently close to each other (Peters, 1979). The geometry of neuronal arborizations is therefore an important determinant of synaptic connectivity. How neuronal morphology shapes neuronal network connectivity is, however, still poorly understood. New developments in experimental and computational approaches make it now possible to shed light on this question. With multi-patch techniques experimentalists are now measuring connectivities between the patched neurons using electrophysiological and anatomical criteria (e.g., Feldmeyer et al., 1999, 2002, 2006; Le Bé et al., 2007; Frick et al., 2008). Computational approaches make it possible to assemble a number of neurons (reconstructed or algorithmically generated) in a 3D geometrical arrangement and to study the emerging synaptic connectivity by searching the sites where potential synapses may occur. For instance, neuroConstruct (Gleeson et al., 2007) is a modeling tool for creating neuronal networks in 3D space using imported neuronal morphologies. The simulator L-Neuron creates virtual neurons using an L-systems approach by iteratively sampling experimental distributions of neuronal shape parameters (Senft and Ascoli, 1999; Ascoli and Krichmar, 2000; Samsonovich and Ascoli, 2007). Similarly, the simulator tool NeuGen (Eberhard et al., 2006) generates neuronal networks in 3D with morphologically realistic neurons by sampling experimental distributions of morphological shape parameters. Recently, Luczak (2006) generates neuronal morphologies using a diffusion limited aggregation (DLA) approach. The simulator CX3D (Zubler and Douglas, 2009) aims at simulating cortical development in 3D space, including the morphology of single neurons. Cuntz et al. (2010) apply a minimal spanning tree principle in generating neuronal morphologies. Costa and Coelho (2005, 2008) generate 2D neuronal morphologies by statistically sampling a probabilistic model of neuronal geometry based on branch probabilities per branch level using a Monte Carlo approach, and form connections when neuronal trees overlap in 2D. The simulator NETMORPH (Koene et al., 2009) is based on biological growth principles of neurons by stochastically modeling the elongation and branching of growth cones in developmental time.
Spatial closeness between axonal and dendritic branches, typically determined by the dimensions of dendritic spines and axonal boutons, is considered as a prerequisite for synapse formation. Hellwig (2000) used reconstructed neurons for estimating connectivity between overlapping dendritic and axonal arborizations. To this end reconstructed neurons were transformed into voxel fields (with voxels of 1 μm side length) followed by counting the number of voxels containing both axonal and dendritic elements and obtaining a number of potential synaptic sites, thus adopting a distance criterion of 1 μm. Kalisman et al. (2003) used sets of 3D reconstructions of biocytin-stained cells to obtain axonal and dendritic statistical representations in order to calculate the probabilities of close appositions. Stepanyants et al. (2002) and Stepanyants and Chklovskii (2005) estimated the number of potential synaptic sites in terms of axonal and dendritic length densities per unit volume, typical dendritic spine length and average angle between axonal and dendritic branches. Amirikian (2005) used the concept of synaptic clouds (density fields) as representation of the complex structure of axonal/dendritic arbors for studying connectivity between different cell classes.
With the recently developed simulator NETMORPH, assemblies of neurons can be generated with realistic 3D morphologies and realistic morphological variability in any arbitrary 3D arrangement (Koene et al., 2009). The emerging connectivity in these networks can be determined by searching the locations where axons and dendrites are sufficient close to each other for synapse formation, thus identifying the sites of candidate synapses. Both in experimentally reconstructed neurons and in algorithmically generated neurons (such as by NETMORPH) axons and dendrites are approximated by piecewise-linear structures, i.e., represented by chains of line pieces or cylinders. Testing the proximity of axonal and dendritic branches then implies the search for pairs of individual dendritic and axonal line pieces that are closer to each other than a given criterion distance. When an axonal and dendritic branch are sufficiently close in space, the application of just a distance criterion, however, may result in several pairs of nearby line pieces obeying the proximity criterion and thus may fall into a cluster of candidate synaptic sites (see Figure 1B). In addition, the number of sufficiently close line piece pairs appears to depend on the typical length scale of the line pieces in the dendritic and axonal representation. As the clustering and the length scale dependency were considered to be artifacts of this approach a method was needed to identify uniquely the location where an axonal and dendritic branch are closest in space. To this end an additional requirement was introduced by searching for that line piece pair from an axonal and dendritic chain of line pieces that cross in space and taking the shortest (orthogonal) distance for that pair as the shortest distance between the axonal and dendritic branch (see Figure 1C). This shortest distance is subsequently subjected to the distance criterion for candidate synapses. Note that in the case of cylinders the distance is taken between their axial center lines.
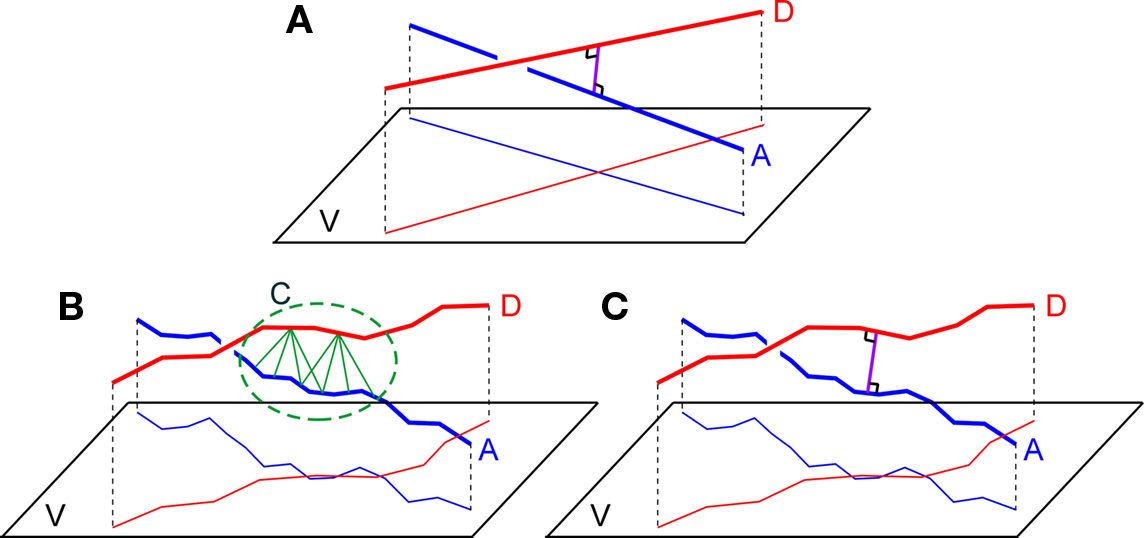
Figure 1. (A) Two straight lines A and B and their projections on a plane V orthogonally connected at their shortest distance at the site of crossing, (B) Two chains of line pieces A and D and their projections on a plane V. Green lines connect those line pieces that are within a given criterion proximity. The picture illustrates the cluster C of candidate synaptic sites as well as the sensitivity to the length scale of the line pieces. (C) Two chains of lines pieces A and B with their shortest distance determined by the orthogonal distance of a single pair of crossing line pieces.
The characterization of network connectivity has also become an important area of research. Graph-theoretical studies of brain connectivity focus amongst others on the presence of hubs and small-world properties (e.g., Watts and Strogatz, 1998; Stepanyants et al., 2002; Hilgetag and Kaiser, 2004; Stepanyants and Chklovskii, 2005). Other studies emphasize the hierarchy in neural network connectivity (e.g., Kaiser et al., 2010) or different spatial scales (e.g., Passingham et al., 2002; Sporns et al., 2005; Stam and Reijneveld, 2007). An interesting aspect during development of network connectivity is the critical phenomenon of percolation when the largest cluster of connected neurons makes an abrupt transition in size toward a giant cluster as studied by Costa and Manoel (2002) and Costa and Coelho (2005, 2008), who also showed the dependence of this phenomenon on the morphology of the developing neurons. Many of these studies rely on methods for estimating synaptic connectivity between axonal and dendritic arborizations, underscoring the need for algorithms that estimate the connectivity as realistic as possible.
The paper describes an algorithm for testing the proximity between chains of line pieces on the basis of crossing properties of line piece pairs. The paper includes a Section “Materials and Methods” with the derivation of geometrical conditions for crossing line pieces using a classical geometry approach (applying a series of 3D transformations). In the Section “Results” the outcomes of the synapse detection model are shown without and with the crossing requirement. A study of the multiplicity of the connections (the number of synapses between two connected neurons) is included. The paper includes an “Rotations in 3D” of Appendix summarizing the 3D rotation matrices, “Relative Position of Point D of the Perpendicular From Point C to Opposite Side AB in a Triangle ABC” of Appendix with some basic triangular geometry, “Expressing the Crossing Conditions in Terms of the Original Coordinates” of Appendix formulating the crossing conditions in the Section “Crossing Line Pieces” in terms of the original coordinates, and “Summary of Calculations and Crossing Conditions” of Appendix summarizing the calculations and the crossing conditions. For reason of completeness, “Analytical Approach” of Appendix includes a different approach using analytical geometry and based on an algorithm taken from literature (Dan Sunday, http://softsurfer.com/Archive/algorithm_0106/algorithm_0106.htm), which also includes the shortest distance between non-crossing line pieces.
Materials and Methods
Proximity-Based Search of Candidate Synaptic Locations
The search in a 3D network of neurons with complex axonal and dendritic arborizations for locations where axonal and dendritic branches are sufficiently close can proceed by searching the shortest distance between any two branches from the axonal and dendritic arborizations. The shortest distance between two straight infinite lines is at the site where they are crossing and determined by the length of the orthogonal connection line (Figure 1A). Axonal and dendritic branches in neuronal reconstructions, however, are not infinite straight lines, but composed of many line pieces in sequence with varying orientations and lengths. Then the distance between any line piece pair from the axonal and dendritic branch must be determined and tested against the criterion value. As illustrated in Figure 1B several pairs of nearby line pieces may meet the distance criterion resulting in a cluster of potential synaptic sites. In addition the number of “nearby” line pieces is dependent on the length scale of the line pieces which may influence the outcome for the number of potential sites (see Figure 1B). This length scale in the piecewise-linear approximation of the neuronal morphological representation relates to morphological reconstruction procedures in experimental approaches, and to the time step parameter in computer simulation approaches.
To avoid clustering of candidate synaptic sites and length scale dependencies, a synapse allocation criterion was needed to identify uniquely locations where axon and dendrite chains of line pieces are closest to each other and where this shortest distance is smaller than the given criterion value. Extending the idea of the unique crossing point of infinite lines, it is proposed to search for the crossing point between an axon and dendrite chain of lines pieces. Such a crossing point can be searched for by testing the crossing condition for any pair of line pieces from the axon and the dendrite chain of line pieces and taking the orthogonal distance for this line piece pair to evaluate the distance condition (Figure 1C).
Crossing Line Pieces
Line pieces do cross when they are in a certain geometrical position to each other, i.e., when the projection of line piece (1) onto the plane through line piece (2) and parallel to (1) intersects line piece (2), as is illustrated in Figure 2B. Only then can an orthogonal connection line be drawn whose length is the shortest distance between both line pieces. Figure 2A illustrates an arrangement of nearby, but non-crossing line pieces.
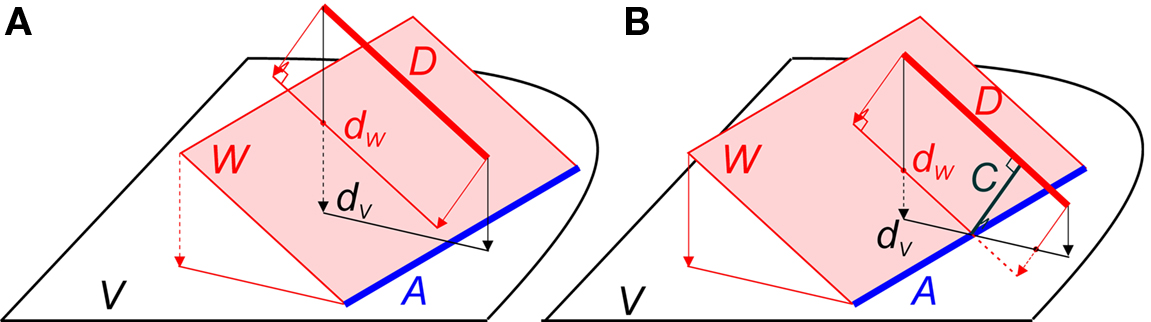
Figure 2. (A) Example of two line pieces A and D that do not cross. Although the projection dV of D onto the plane V intersects with A, the projection dW of D onto the plane W through A and parallel to D does not. (B) Two line pieces A and D that do cross, because the projection dW of line piece D onto the plane W through A and parallel to D intersects line piece A. The distance between A and D is given by the length of the orthogonal connection line C.
In the following an algorithm is introduced for testing whether or not two line pieces do cross. If they do, the algorithm provides the length of the orthogonal connection and the coordinates where this connection line intersects the two line pieces. Applying this algorithm to all pairs of line pieces of an axonal and dendritic branch will test the existence of a crossing pair, and whether the shortest distance in this pair meets the distance criterion.
Algorithm for Determining Whether Two Line Pieces are Crossing
Given are two line pieces PQ and RS and the coordinates of the points P(x, y, z), Q(x, y, z), R(x, y, z) and S(x, y, z). A “classical” geometry approach is used in which a series of 3D transformations is applied on the two line pieces in order to bring them in such a geometric arrangement that the condition for crossing can easily be applied. These transformations include one translation and three rotations around the three axes of the orthogonal coordinate system.
Transformation I – translation of P, Q, R, and S according to P(X, Y, Z) → O(0, 0, 0)
The translations proceed via p = P − P = O, q = Q − P, r = R − P, and s = S − P, see Figure 3, thus with
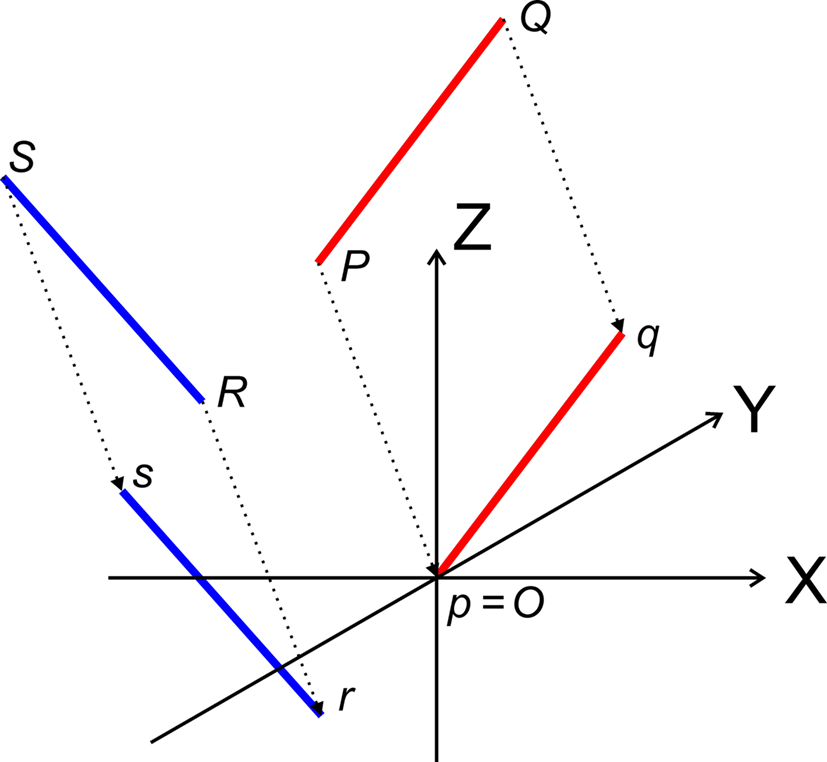
Figure 3. Translation of the line pieces PQ and RS toward line pieces pq and rs, respectively such that point p coincides with the origin O.
Transformation II – first rotation of Q, R, and S around Z-axis toward 1Q, 1R, and 1S, respectively, such that 1Q is in the XZ-plane
The rotation around the Z-axis, see Figure 4, proceeds via 1q = RotZ (γ) • q or
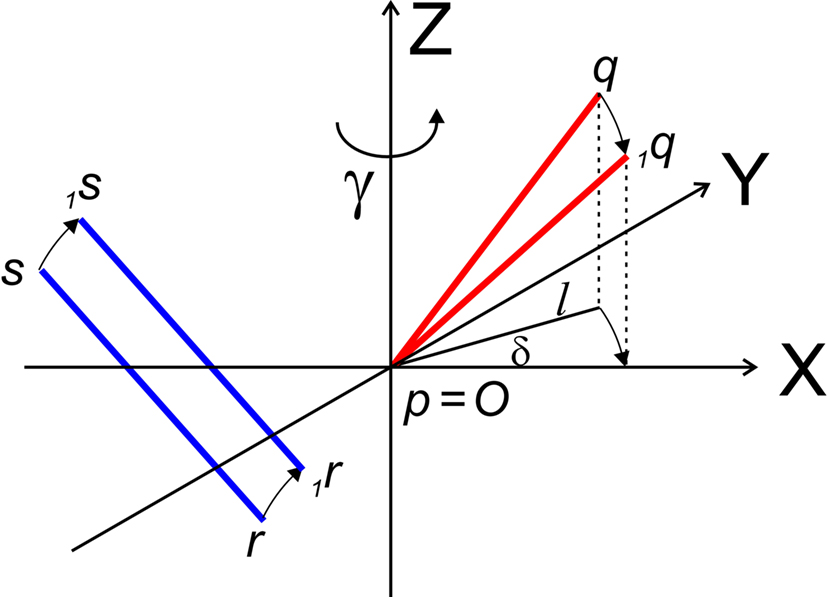
Figure 4. Rotation of line pieces pq and rs around Z-axis into p1q and 1r1s, respectively, and such that 1q rotates into ZX-plane.
If δ equals the angle of the projection of Oq with the x-axis then the rotation angle γ is equal to −δ, thus
Here, l denotes the length of the projection of Oq onto the XY-plane with

with  denoting the length of line piece PQ
For the rotation equations we obtain
By this rotation, point q is rotated into the ZX-plane making its y-coordinate equal to zero, and its x-coordinate equal to the length of the projection of Oq onto the XY-plane. Of course, the lengths of line pieces O1q and Oq are equal to the length of the original line piece PQ (O1q = Oq = PQ). The rotations of r and s toward 1r and 1s proceed via

respectively, and we obtain
and
Transformation III – second rotation of 1Q, 1R, and 1S around Y-axis into 2Q, 2R, and 2S, respectively, such that 2Q is on the X-axis, thus making the line piece O2Q to coincide with the X-axis
The rotation around the Y-axis, see Figure 5, proceeds via 2q = RotY (β). 1q or
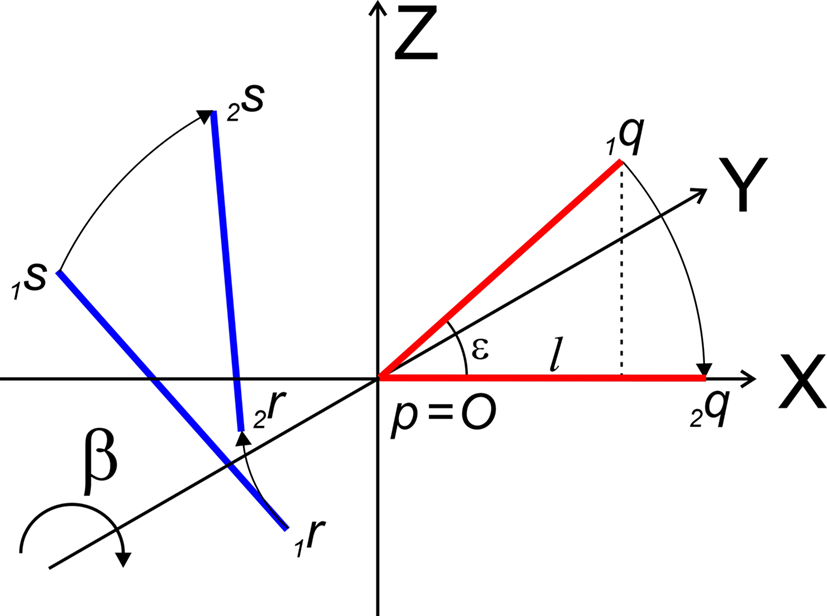
Figure 5. Rotation of line pieces p1q and 1r1s around Y-axis into p2q and 2r2s, respectively, with 2q on the X- axis.
If ε equals the angle of O1q with the x-axis then the rotation angle β is equal to -ε, thus
Thus:
By this rotation, point Q is rotated onto the X-axis, thus giving point 2q zero y- and z-coordinates and making the x-coordinate equal to the length of line piece PQ.
The rotations of 1r and 1s toward 2r and 2s proceed similarly via

respectively, and we obtain
using the expressions for 1rx and 1rz. Because the expression for 2rx will occur frequently in following expressions we will assign it a special symbol CR = 2rx.

using the expressions for 1rx and 1rz, followed by further elaboration. In a similar way we obtain for 2s
Because also the expression for 2sx will occur frequently in following expressions we have assigned it the special symbol CS = 2sx
Transformation IV – third rotation of 2Q, 2R, and 2s around X-axis into 3Q, 3R, and 3S such that the rotated line piece 3R3S runs parallel to the ZX-plane, thus with 3R and 3S having equal Y-coordinates
With the original line piece PQ transformed to coincide with the X-axis, the final rotation will be around the X-axis in order to position the original line piece RS parallel to the ZX-plane (Figure 6).
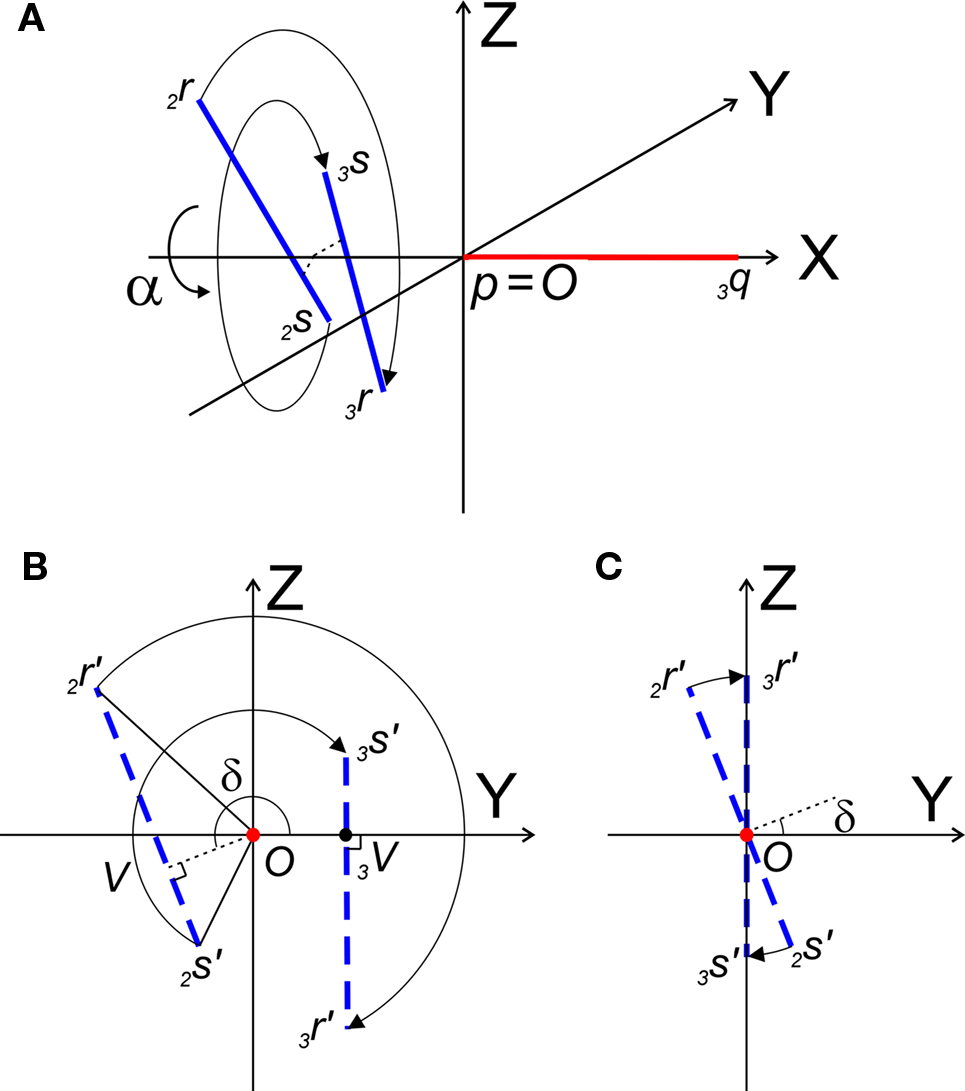
Figure 6. (A) Shows the rotation of line pieces p2q and 2r2s around X-axis into p3q and 3r3s, respectively, such that 3r3s, runs parallel to ZX-plane. (B) Illustrates the rotation of the projections of the line pieces onto the YZ-plane. (C) Illustrates the rotation when both line pieces are in one plane but not parallel. Then line piece 2r2s crosses the X-axis and its projection intersects the origin.
The rotation around the X-axis proceeds via 3r = RotX (α). 2r and 3s = RotX (α). 2s or
Thus:
The rotation angle α can be obtained by the following geometrical considerations. Let 2r′2s′ and 3r′3s′ be the projections of 2rss and 3r3s onto the YZ-plane. Evidently,

 and
and  The condition of equal and positive (as an arbitrary choice) y-coordinates implies a rotation over angle α equal to minus the angle δ of the perpendicular from O onto 2r′2s′. Let this perpendicular end in point V (Figure 6B). The coordinates of point V can be obtained by calculating its relative position on 2r′2s′ (f(V|2r′2s′)) or in short notation (fv). Following elementary geometry (see Relative Position of Point D of the Perpendicular from Point C to Opposite Side AB in a Triangle ABC of Appendix) we obtain
with
the squared length of the projections of the respective line pieces in the YZ-plane. With the fraction fv the y- and z-coordinates of point V can be calculated as
When both line pieces PQ and RS are in one plane and are running parallel, then line piece 2r2s runs parallel to the X-axis, the projection points 2r′ and 2s′ coincide and the length  is zero. Then the coordinates Vy and Vz coincide with those of 2r′ and 2s′

With the length of the line piece  the orientation angle δ of line piece OV is obtained as
Concerning the rotation angle α, vector OV needs to be rotated toward the positive Y-axis implicating a rotation over −δ, thus
The rotations in Eq. 17 3r = RotX (α). 2r and 3s = RotX (α). 2s can now be made explicit as
and similarly
By the rotation the points 3r and 3s have obtained equal y-coordinates.
Line pieces PQ and RS in one plane. When both line pieces PQ and RS are in one plane but not parallel they (or their elongations) have an intersection point, the line piece 2r′2s′ has an orientation through the origin (i.e., the line piece 2r′2s′ or its elongation intersects the X-axis), and the length of line piece OV is equal to zero. Then the projections of both points have equal ratios for their Z- and Y-coordinates

The orientation of the perpendicular to line piece 2r′2s′ is then given by
such that
Thus for non-parallel line pieces in one plane, the rotations in Eq. 17 3r = RotX (α). 2r and 3s = RotX (α). 2s become
and similarly
Applying the conditions for crossing line pieces
After the series of transformations the line pieces O3q and 3r3s are in the geometrical positions of O3q coinciding with the X-axis, and 3r3s running parallel to the ZX-plane (Figure 7).
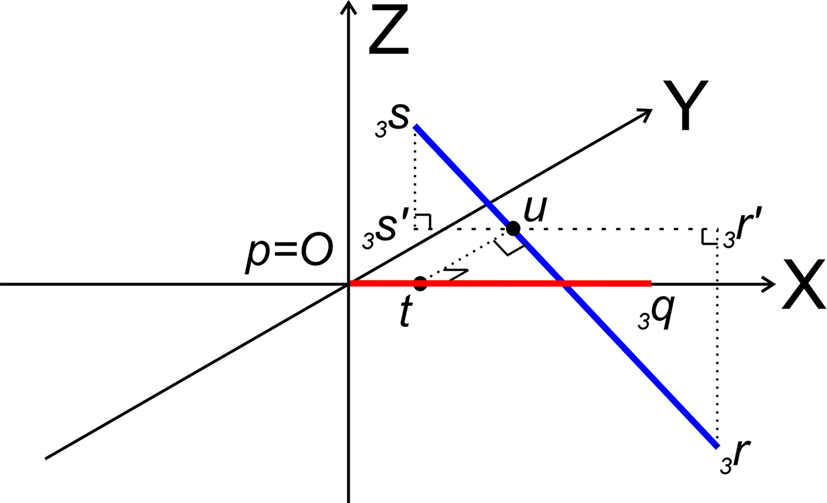
Figure 7. Determination of whether line pieces O3q and 3r3s are crossing. Then, line piece 3r3s (running parallel to ZX-plane) should intersect the XY-plane and the intersection point should have an x-coordinate overlapping line piece O3q.
Now it can easily be determined whether they are crossing. With 3r3s running parallel to the ZX-plane, its projection 3r′3s′ onto the XY-plane runs parallel to the X-axis. If (A) 3r3s intersects the XY-plane, and (B) if this intersection point u of 3r3s with the XY-plane has an x-coordinate within the length of 3p3q (3px ≤ ux ≤ 3qx) then O3q and 3r3s are crossing line pieces and the perpendicular line of u onto X-axis ut is the orthogonal shortest distance between the line pieces.
Condition A: Line piece 3r3s crosses the XY-plane if the product of the z-coordinates of 3r and 3s is negative or if one or both of them equals zero, thus if

If both coordinates are zero, line piece 3r3s runs parallel to O3q and is in the XY-plane. If one of the coordinates is zero, line piece 3r3s has one point in the XY-plane.
Condition B requires first (B1) an overlap of x-coordinates of O3q and 3r3s, thus when
As O3q originates from the transformed line piece PQ its length equals that of PQ, thus 3qx = PQ. Using the symbols CR and CS, Eq. 30 can also be phrased as
If both conditions (A) and (B1) are fulfilled the perpendicular distance from intersection point u of 3r3s with the XY-plane to the point t on the line piece O3q can be determined as

with

If 3r3s runs parallel to O3q in the XY-plane, thus with both 3rz = 0 and 3sz = 0, a choice is made for the position of the orthogonal connection line with
when 3rx > 3sx (CR > CS), or
when 3sx > 3rx (Cs > CR). Evidently tx = ux
The final condition (B2) requires that the intersection point is within the length of O3q, thus

The fractions of the line pieces where the orthogonal connection intersects the line pieces is independent of the transformations applied and therefore we can derive the crossing point T on PQ to be at a fraction

on the line piece PQ and the crossing point U on RS to be at a fraction of

of the line piece RS. The orthogonal distance between two crossing line pieces thus is between the point T(x, y, z) on PQ
and the point U(x, y, z) on RS
and is equal to

In the final step the orthogonal distance TU is tested against a given proximity criterion value.
Alternative Approach for Testing Crossing of Line Pieces
The approach followed in this paper was first to test the crossing property of line pieces, followed by the calculation of the orthogonal distance. An alternative approach was introduced by Dan Sunday in his algorithm on the softsurfer.com website (http://softsurfer.com/Archive/algorithm_0106/algorithm_0106.htm). This algorithm first determines the crossing point of the infinite lines through the line pieces, followed by a test of whether or not the orthogonal connection line intersects the line pieces themselves and if so, followed by the distance calculation. The procedure of Sunday is described in “Analytical Approach” of Appendix and includes an algorithm for calculating the shortest distance between two non-crossing line pieces, i.e., when the line piece extensions appear to cross outside the range of the line pieces.
Results
The “old” synapse formation model based on distance only and the “new” one based on crossing and distance have been applied to a network of 25 Layer 2/3 pyramidal neurons, with their cell bodies generated within a sphere of radius 43 μm with minimum neuron separation of 20 μm. The neurons were generated using the NETMORPH simulator (Koene et al., 2009) based on growth parameter values optimized on a data set of reconstructed rat cerebral cortex L2/3 pyramidal neurons made available by Svoboda through the www.neuromorpho.org website (Ascoli et al., 2007). Examples are illustrated in Figure 8.
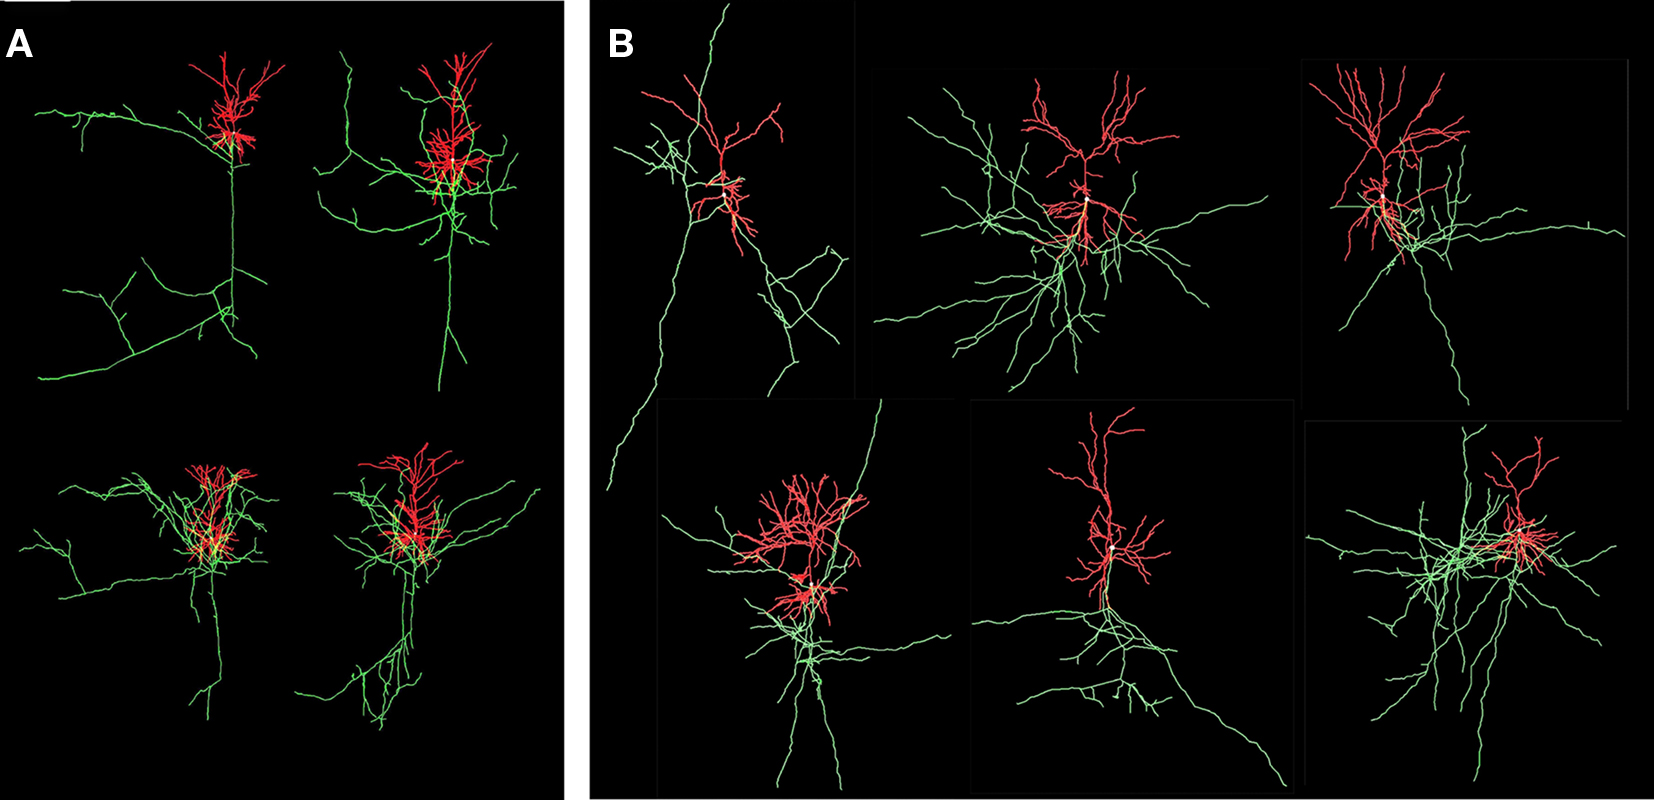
Figure 8. Visualization of experimental reconstructed and computer generated neurons. Axons are in green and dendrites are in red. (A) Four L2/3 rat cortical pyramidal neurons by Svoboda from the www.neuromorpho.org database. (B) Six neurons generated by NETMORPH using growth parameters optimized on the dataset of Svoboda (Koene et al., 2009).
Outcomes of the “old” and “new” synapse formation model are illustrated in Figures 9A–D. The figures show the axons (green), dendrites (red) and the synapse locations (small blue spheres). Figures 9A,B show the locations of candidate synapses when the crossing condition was not applied and only the shortest distance between line pieces was tested, using the algorithm based on Sunday’s approach (Shortest Distance Between Two Non-Crossing Line Pieces). Figures 9C,D show the locations of candidate synapses when the crossing condition was applied and the orthogonal connection was subjected to the distance criterion. In all four panels the distance criterion was 4 μm. The results in Figures 9A,C were obtained with a time step parameter of 20000 s, and those in Figures 9B,D with a time step parameter of 20 s. The number of synapses formed is 32799 in Figure 9A, 111104 in Figure 9B, 1188 in Figure 9C, and 1555 in Figure 9D, respectively. Comparing these numbers as well as the pictures in the top and bottom row makes clear how the distance-based approach (top row) results in a strong clustering of synapses and how this is prevented by applying the crossing condition (bottom row). Comparing the synapse numbers as well as the pictures for “long” (left column) and “short” line pieces (right column) illustrates that the synapse formation model based on distance only is highly sensitive to the length scale (with synapse numbers 32799 versus 111104, respectively) while the synapse formation model based on crossing and distance grossly reduced this dependency (with synapse numbers 1188 versus 1555, respectively).
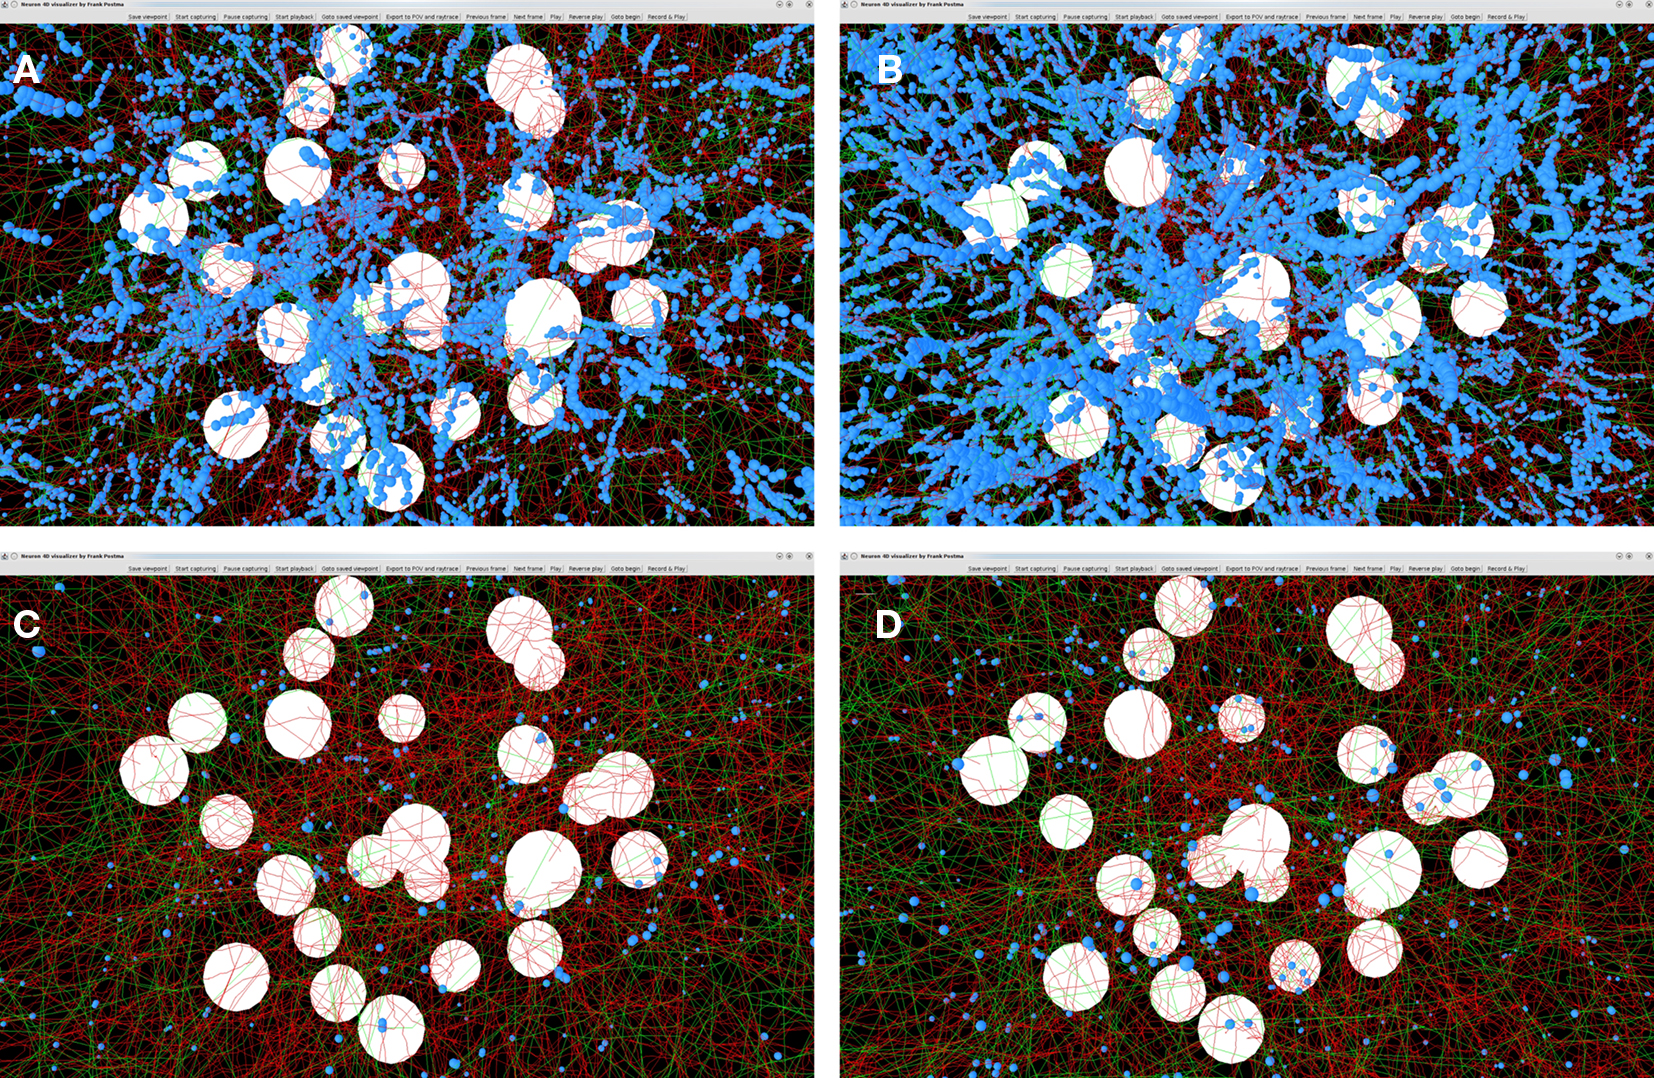
Figure 9. Illustrations of spatial distributions of synaptic contacts in NETMORPH generated networks. The figures show the cell bodies (white spheres), axons (green), dendrites (red), and the synaptic contacts (small blue spheres). A distance criterion of 4 μm was used for finding synaptic contacts. Top row panels (A) and (B) show the result of the synapse formation model based on distance only. The bottom row panels (C) and (D) show the results of the new synapse formation model based on crossing and distance. The left column panels (A) and (C) are obtained with a time step parameter dt = 20000 s. The right column panels (B) and (D) are obtained with a time step parameter dt = 20 s. The number of synapses formed is 32799 in (A), 111104 in (B), 1188 in (C), and 1555 in (D), respectively. The figure illustrates the clustering of synaptic contacts in the distance-based model (top row) and the lack of clustering in the new model by the additional crossing condition (bottom row). The synapse numbers also illustrates the sensitivity of the distance-based model for the length scale of the line pieces and the strongly reduced dependency of the crossing-based model.
With the new synapse formation model, a first series of simulations have been performed on the number of synaptic contacts per connection between neuron pairs. To this end networks were generated with the NETMORPH simulator of 250 layer 2/3 pyramidal neurons arranged in a sphere with a radius of 93 μm with realistic density of 75,000 mm−3 (Hellwig, 2000). The minimum separation between somata was 20 μm. Both the old synapse formation model based on distance only, as well as the new one based on crossing and distance, were used. For the old model a distance criterion of 2 μm was used (i.e., synapses were formed when an axon and a dendrite came within 2 μm of each other, a distance criterion also used by Stepanyants and Chklovskii, 2005). The new synapse formation model has been applied with distance criteria of 2, 4, and 6 μm, respectively. The results of these simulations are shown in Figure 10, summarizing the distributions of the number of synaptic contacts per connection.
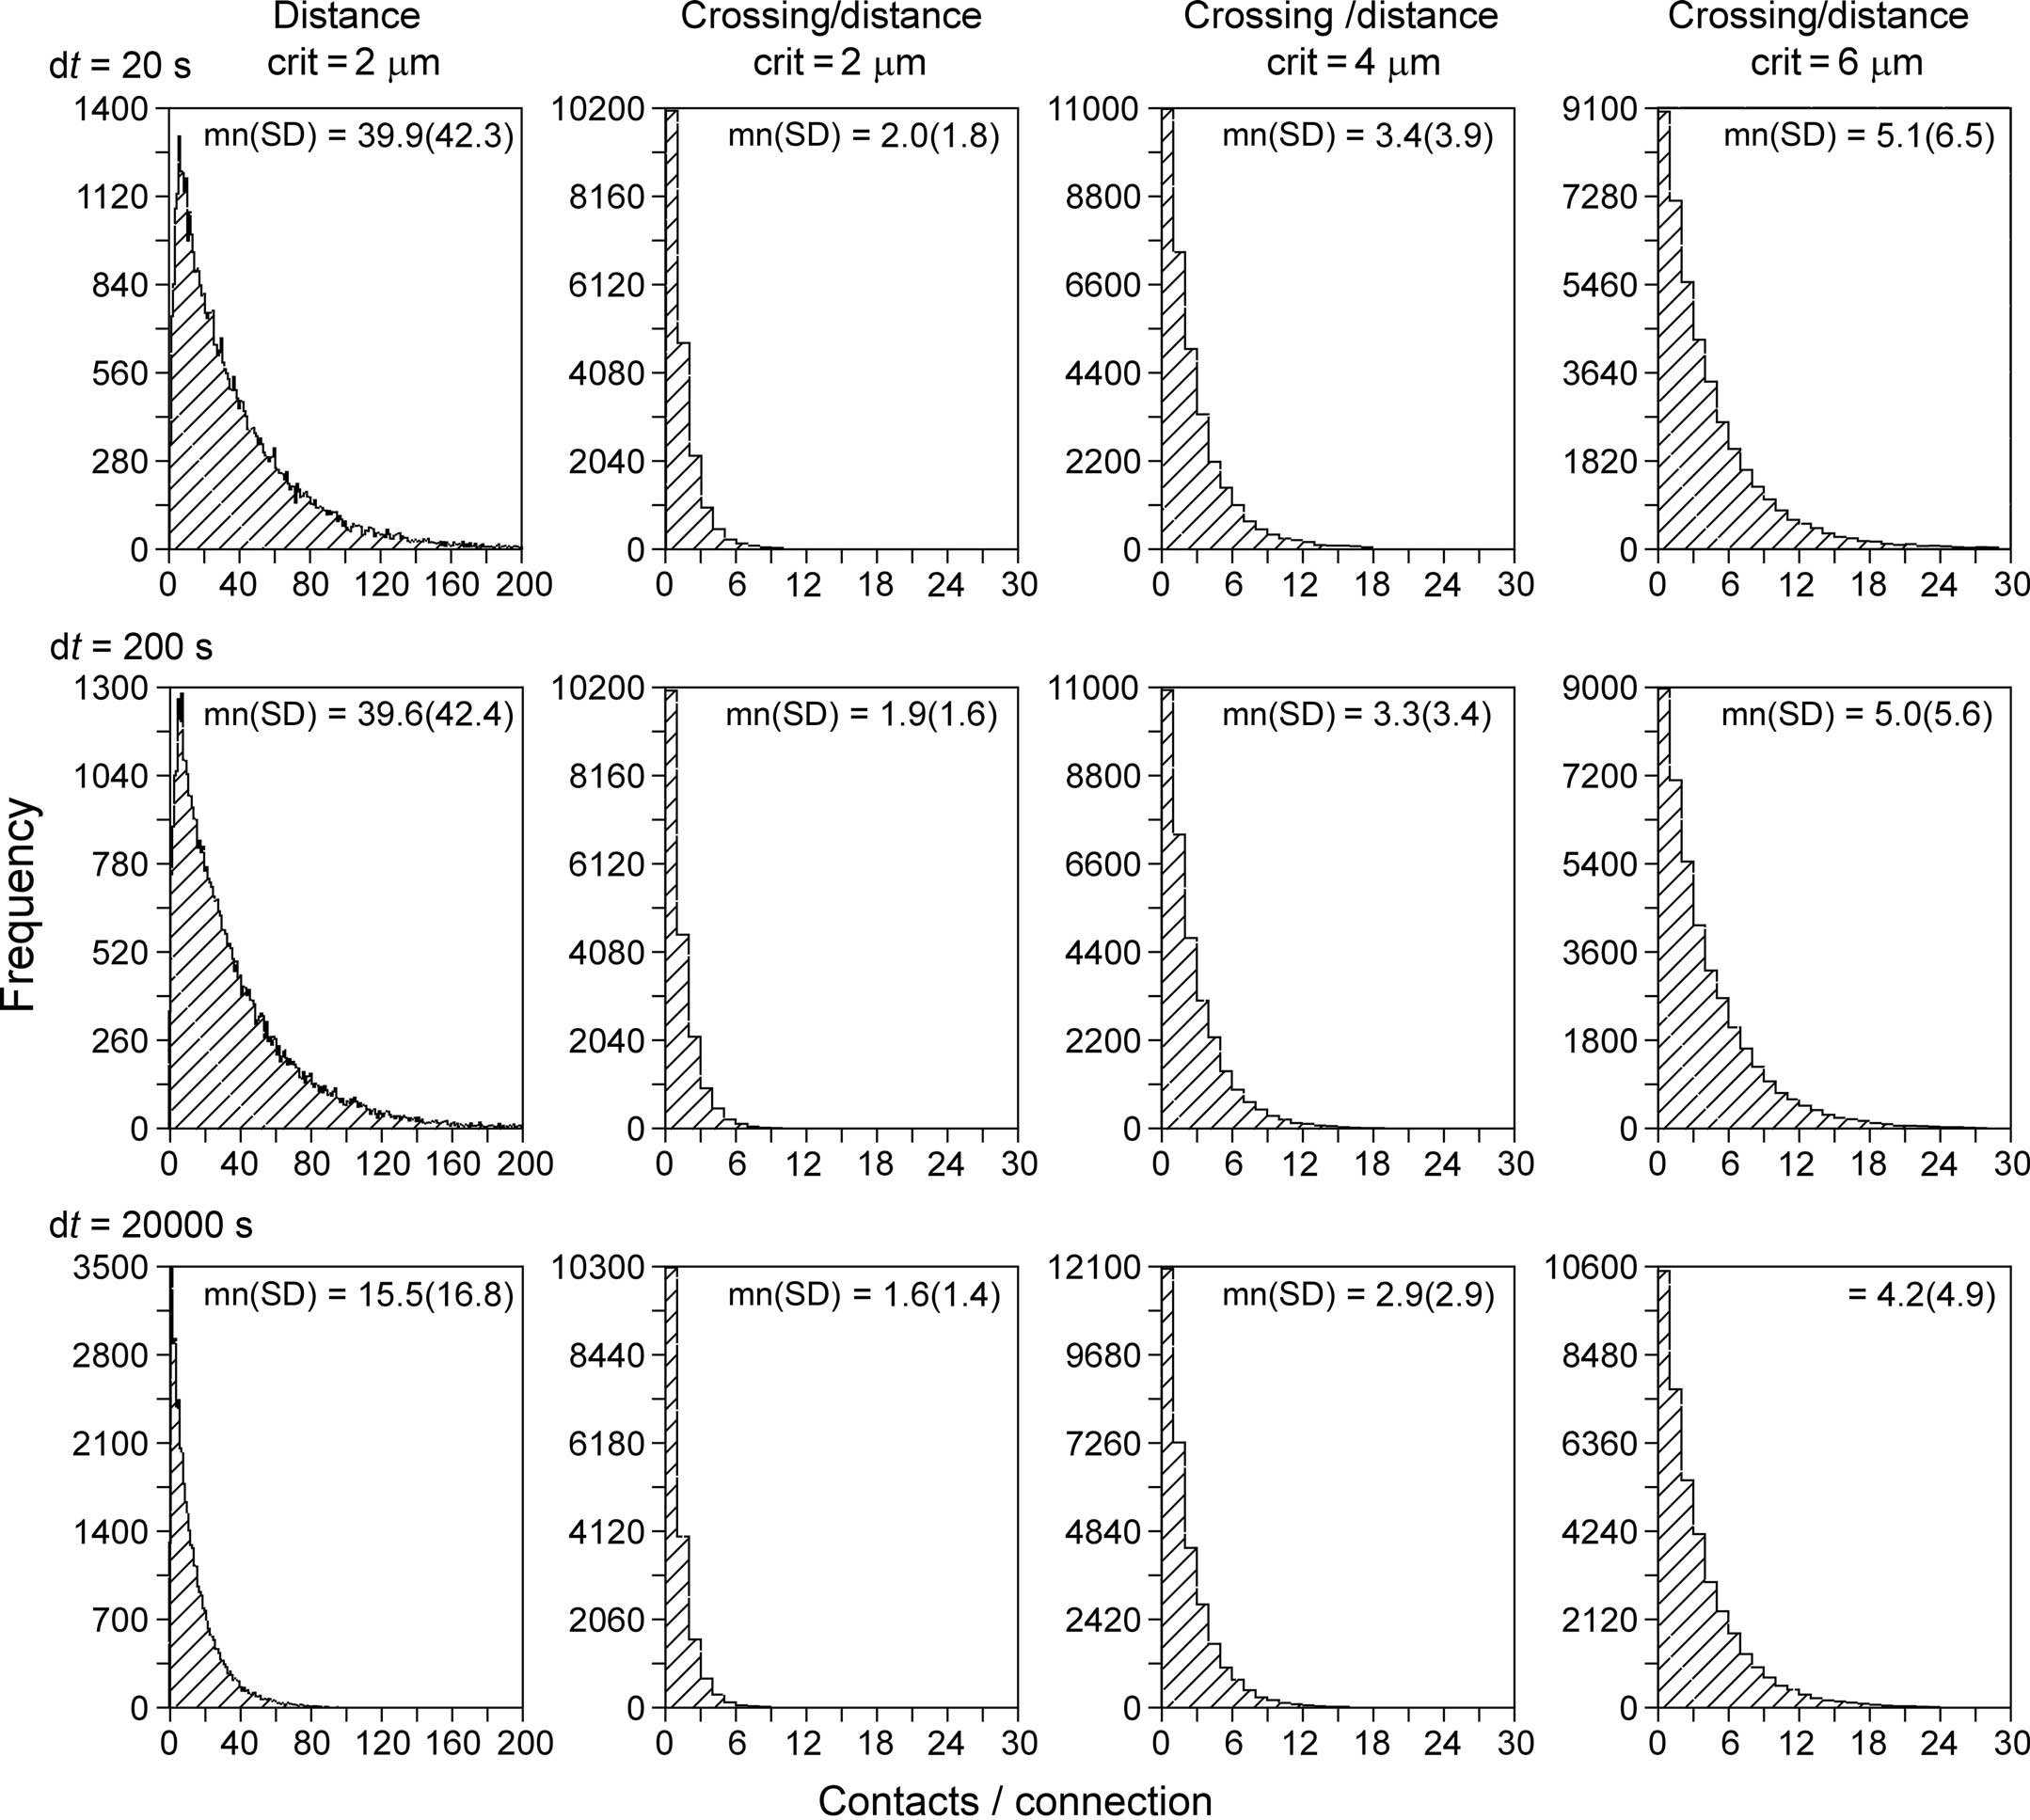
Figure 10. Distributions of the number of contacts per connection. Synaptic connectivity in a simulated NETMORPH network of 250 layer 2/3 pyramidal neurons with their cell bodies arranged in a sphere with realistic density of 75,000 mm−3 (Hellwig, 2000). The radius of the sphere is 93 μm. The minimum separation between somata is 20 μm. Column 1, distributions obtained with a synapse formation model based only on distance (see “Shortest Distance Between Two Non-Crossing Line Pieces”), with a distance criterion of 2 μm. Columns 2–4, distributions obtained with the new synapse formation model based on crossing and distance, with distance criteria of 2 μm (second column), 4 μm (third column) and 6 μm (fourth column). Results are shown for different values of the time step parameter (rows) from dt = 20 s (top row) to dt = 20000 s (bottom row). The time step parameter relates to the length scale of the individual line pieces in the branching structures of axons and dendrites. The distance-based synapse formation model (first column) makes the number of contacts highly sensitive to this length scale. The new synapse formation model (columns 2–4) strongly reduces this dependency.
The left column of Figure 10 shows the distribution of number of contacts/connection versus frequency for a synapse formation model based only on distance (see Shortest Distance Between Two Non-Crossing Line Pieces). The distributions illustrate the large number of contacts per connection as a result of the clustering effect when only a distance criterion is used. The distributions in the second, third, and fourth column are obtained with the new synapse formation model based on distance and crossing. The 2nd column was obtained with the same distance criterion of 2 μm as the 1st column and comparing these columns shows how the additional crossing criterion reduces the number of contacts per connections to realistic values by eliminating the clustering effect. The third and fourth column are obtained for larger values of the distance criterion. As expected the number of contacts per connection increases with this criterion as the likelihood for sufficient proximity also increases, with mn(sd) values of 2.0(1.8), 3.4(3.9), and 5.1(6.5) contacts per connection for distance criteria of 2, 4, and 6 μm, respectively, and for using a time step of dt = 20 s (top row).
Experimental data for the number of synaptic contacts per connection show an average value of mn(sd) 2.8(0.7) (n = 8 pairs) between L2/3 pyramidal neurons in the barrel cortex of juvenile rats (Feldmeyer et al., 2006), an average value of 4.5(0.5) (n = 13 pairs) between juvenile rat barrel cortex L4 spiny neurons and L2/3 pyramidal cells (Feldmeyer et al., 2002), an average of 3.4(1.0) (n = 11 pairs) between spiny rat somatosensory cortex L4 neurons (Feldmeyer et al., 1999), and an average number of 3.5 ± 1.8 putative contacts per connection between juvenile rat somatosensory cortex L5A pyramidal cells (Frick et al., 2008). Hellwig (2000) estimated the number of synapses per connection from the overlap of voxelized images for nearby neurons to be about 2.5 for L2–L2 connections and about 1.2 for L3–L2 connections. The voxel size used of 1 × 1 × 1 μm3, effectively implemented a distance criterion of 1 μm. Although the experimental data originate from a variety of cell types and cortical areas, experimental numbers are in a rather restricted range of 2.5–4.5 contacts per connection. The values obtained with our new synapse formation model are in the range of 2.0–5.1 contacts per connection (for dt = 20 s) when using distance criteria of 2, 4, and 6 μm. It is a remarkable result that the simulation outcomes overlap so nicely the range of experimental data. Stepanyants and Chklovskii (2005) estimated the number of potential synapses from a presynaptic neuron onto a postsynaptic neuron on the basis of reconstructed neurons (lower layer-4 spiny stellate neurons or layer 3 pyramidal neurons from cat visual cortex) as a function of the relative positions of their cell bodies and found numbers in the range of 0–6 potential synapses. Our findings are also in good agreement with these estimated numbers.
An additional outcome of our present simulations is that the frequency distributions are monotone decreasing with the number of contacts per connection, a property that is not yet experimentally observed due to the low numbers in the published distributions. The monotone decreasing distribution may not be surprising as the probability of having two contacts per connection is expected to be the square of the probability of having one contact per neuron pair.
Discussion
Axons and dendrites can make synaptic connections at those locations where they come sufficiently close to each other, typically within a distance determined by the length of dendritic spines and axonal boutons. The present study aimed at defining a procedure for finding such locations in networks of neurons whose 3D geometry is represented by piecewise-linear structures (line pieces or cylinders) as is the case in experimental reconstructions and in computer generated morphologies from neural simulators. Proximity of axonal and dendritic branches is then tested by evaluating proximity of all pairs of line pieces that constitute both neuronal structures. Note that proximity is here taken between the axial center lines and that a criterion of proximity should consider both the branch diameters and the distance between the branch exteriors (such as spine and bouton lengths).
The disadvantage of a straightforward distance criterion is that it may be met by several combinations of nearby line pieces, resulting in clusters of candidate synaptic sites. Additionally, this number appeared to be sensitive to the length scale of the individual line pieces. The procedure introduced in this study aimed at representing the places where axonal and dendritic branches are sufficiently close by a single candidate synaptic site. To this end the line piece crossing criterion was introduced in addition to the distance criterion. This was based on the notion that the shortest distance between two infinite lines in 3D is determined by the length of the orthogonal connection line at the unique site of crossing of the infinite lines. Also two chains of line pieces will generally contain only one unique pair of mutual line pieces that fulfills the geometrical condition of crossing and identifies the unique location of shortest distance between the two chains of line pieces. For this reason, the crossing condition was introduced in addition to the distance criterion to eliminate the clustering artifact and to reduce the length scale dependency.
The paper describes the derivation of the crossing conditions by applying a series of 3D transformations to the line piece pair to bring them in such a 3D position that crossing can easily be determined. The conditions for crossing are finally summarized in a series of tests to be applied to all dendritic and axonal line piece pairs of two neuronal representations. The performance of the “new” synapse detection method has been illustrated visually in tests of the “old” and the “new” method, and quantitatively in terms of distributions of the number of contacts between connected neuron pairs. The obtained mean number of contacts per connection appeared to be in excellent agreement with the available experimental data. The frequency distributions for the number of contacts per connection had a monotone decreasing shape. Because of the small number of observations in experimental data this prediction is still waiting validation. The present outcomes clearly demonstrated that the new synapse detection model based on crossing and distance eliminated the clustering effect of the old model based on distance only, and reduced significantly the dependence on the length scale of the line pieces.
Although two chains of line pieces will generally contain only one unique pair of crossing line pieces, more than one crossing pair may occur under certain geometrical conditions. For instance, when a certain line piece A1 of chain A is orthogonal and intersects the plane formed by two subsequent line pieces B1 and B2 of another chain B, then both B1 and B2 may cross the A1 line piece. If so, and if the orthogonal connection in both pairs is meeting the distance criterion, then they result in two nearby candidate sites. Another case is when two line piece chains are running more or less in parallel. Then, crossing line piece pairs may occur at varying distances along both chains and, when they meet the distance criterion, result in as many candidate synaptic sites.
Axonal and dendritic branches may follow straight courses but may also meander strongly. Deviations from a straight line influence the way axons and dendrites are filling space. The probability of sites of near proximity is therefore expected to depend on the tortuosity of axonal and dendritic branches. It is an interesting question whether in real nervous tissue strongly meandering axons and dendrites make relative more synapses in comparison with straight ones. In our computer generated networks this is certainly expected when the meandering of the branches is approximated by line pieces with varying orientations. In a given area in space one may expect more nearby line piece pairs to cross and meeting the distance criterion at small length scales then at large length scales of the line pieces. It is thus not surprising that a remaining length scale dependency was also found with the new synapse formation model.
The algorithm for testing crossing line pieces derived in this paper differs from the one of Dan Sunday (Analytical Approach) by first testing whether or not two line pieces are crossing, and if so, followed by the distance calculation. The algorithm of Sunday, in contrast, first calculates the site where the infinite lines through the line pieces cross, followed by a test of whether or not this site of crossing coincides with the line pieces and if so, also followed by the distance calculation. This difference makes the present algorithm about 20% faster than Sunday’s algorithm, when implemented in FORTRAN code on a Linux system.
The procedure described in this paper identifies the location where an axonal and a dendritic branch are sufficiently close by a single candidate synaptic site, and is purely based on geometrical considerations. Whether or not in the biological tissue at these sites synapses will actually form and in which number is a question not addressed in this paper. Dendrites may be covered by spines in high density suggesting that a nearby axon may form more than one synapse close in space. Such a clustering of synapses between a single axon and dendrite then has a biological origin and is thus principally different from the artifactual clustering caused by the search procedure that gave rise to this study. Nearby spines may of course also be contacted by axonal branches from different neurons. When they all meet the crossing and distance criteria, a clustering of candidate synaptic locations between a single dendritic branch and these different axons will then still occur.
Conflict of Interest Statement
The authors declare that the research was conducted in the absence of any commercial or financial relationships that could be construed as a potential conflict of interest.
Acknowledgments
This work was supported by EU BIO-ICT Project SECO (216593), and by NWO-CLS Project NETFORM (635.100.017).
References
Amirikian, B. (2005). A phenomenological theory of spatially structured local synaptic connectivity. PLoS Comput. Biol. 1, 74–85. doi: 10.1371/journal.pcbi.0010011.
Ascoli, G. A., Donohue, D. E., and Halavi, M. (2007). NeuroMorpho.Org: a central resource for neuronal morphologies. J. Neurosci. 27(35), 9247–9251.
Ascoli, G., and Krichmar, J. (2000). L-neuron: a modeling tool for the efficient generation and parsimonious description of dendritic morphology. Neurocomputing 32–33, 1003–1011.
Costa, L. F., and Coelho, R. C. (2005). Growth driven percolations: the dynamics of connectivity in neuronal systems. Eur. Phys. J. B 47, 571–581.
Costa, L. F., and Coelho, R. C. (2008). Growth-driven percolations: the dynamics of community formation in neuronal systems. arXiv:q-bio/0411009v1 [q-bio.NC].
Costa, L. F., and Manoel, E. T. (2002). A percolation approach to neural morphometry and connectivity, Neuroinformatics 1, 65–80.
Cuntz, H., Forstner, F., Borst, A., and Häusser, M. (2010). One rule to grow them all: a general theory of neuronal branching and its practical application. PLoS Comput. Biol. 6, e1000877. doi: 10.1371/journal.pcbi.1000877.
Eberhard, J. P., Wanner, A., and Wittum, G. (2006). NeuGen: a tool for the generation of realistic morphology of cortical neurons and neuronal networks in 3D. Neurocomputing 70, 327–342.
Feldmeyer, D., Egger, V., Lübke, J., and Sakmann, B. (1999). Reliable synaptic connections between pairs of excitatory layer 4 neurones within a single “barrel” of developing rat somatosensory cortex. J. Physiol. 521, 169–190.
Feldmeyer, D., Lübke, J., and Sakmann, B. (2006). Efficacy and connectivity of intracolumnar pairs of layer 2/3 pyramidal cells in the barrel cortex of juvenile rats. J. Physiol. 575, 583–602.
Feldmeyer, D., Lübke, J., Silver, R. A., and Sakmann, B. (2002). Synaptic connections between layer 4 spiny neurone- layer 2/3 pyramidal cell pairs in juvenile rat barrel cortex: physiology and anatomy of interlaminar signalling within a cortical column. J. Physiol. 538, 803–822.
Frick, A., Feldmeyer, D., Helmstaedter, M., and Sakmann, B. (2008). Monosynaptic connections between pairs of L5A pyramidal neurons in columns of juvenile rat somatosensory cortex. Cereb. Cortex 18, 397–406.
Gleeson, P., Steuber, V., and Silver, R. (2007). Neuroconstruct: a tool for modeling networks of neurons in 3D space. Neuron 54, 219–235.
Hellwig, B. (2000). A quantitative analysis of the local connectivity between pyramidal neurons in layer 2/3 of the rart visual cortex. Biol. Cybern. 82, 111–121.
Hilgetag, C. C., and Kaiser, M. (2004). Clustered organization of cortical connectivity (review article). Neuroinformatics 2, 353–360.
Kaiser, M., Hilgetag, C. C., and Kötter, R. (2010). Hierarchy and dynamics of neural networks. Front. Neuroinform. 4:112. doi: 10.3389/fninf.2010.00112.
Kalisman, N., Silberberg, G., and Markram, H. (2003). Deriving physical connectivity from neuronal morphology. Biol. Cybern. 88, 210–218.
Koene, R. A., Tijms, B., van Hees, P., Postma, F., de Ridder, A., Ramakers, G., van Pelt, J., and van Ooyen, A. (2009). NETMORPH: a framework for the stochastic generation of large scale neuronal networks with realistic neuron morphologies. Neuroinformatics 7, 195–210.
Le Bé, J. V., Silberberg, G., Wang, Y., and Markram, H. (2007). Morphological, electrophysiological, and synaptic properties of corticocallosal pyramidal cells in the neonatal rat neocortex. Cereb. Cortex 17, 2204–2213.
Luczak, A. (2006). Spatial embedding of neuronal trees modeled by diffusive growth. J. Neurosci. Methods 157, 132–141.
Passingham, R. E., Stephan, K. E., and Kötter, R. (2002). The anatomical basis of functional localization in the cortex. Nat. Rev. Neurosci. 3, 606–616.
Samsonovich, A., and Ascoli, G. (2007). “Computational models of dendritic morphology: from parsimonious description to biological insight,” in Modeling Biology, Structures, Behaviors, Evolution, eds M. Laubichler and G. Müller (Cambridge, Massachusetts: MIT), 91–113.
Senft, S., and Ascoli, G. (1999). Reconstruction of brain networks by algorithmic amplification of morphometry data. Lect. Notes Comput. Sci. 1606, 25–33.
Sporns, O., Tononi, G., and Kötter, R. (2005). The human connectome: a structural description of the human brain. PLoS Comput. Biol. 1, e42. doi: 10.1371/journal.pcbi.0010042.
Stam, C. J., and Reijneveld, J. C. (2007). Graph theoretical analysis of complex networks in the brain. Nonlinear Biomed. Phys. 1, 3.
Stepanyants, A., and Chklovskii, D. B. (2005). Neurogeometry and potential synaptic connectivity. Trends Neurosci. 28, 387–394.
Stepanyants, A., Hof, P. R., and Chklovskii, D. B. (2002). Geometry and structural plasticity of synaptic connectivity. Neuron 34, 275–288.
Watts, D. J., and Strogatz, S. H. (1998). Collective dynamics of “small-world” networks. Nature 393, 440–442.
Keywords: neuronal morphology, synaptic connectivity, line crossing, spatial proximity
Citation: van Pelt J, Carnell A, de Ridder S, Mansvelder HD and van Ooyen A (2010) An algorithm for finding candidate synaptic sites in computer generated networks of neurons with realistic morphologies. Front. Comput. Neurosci. 4:148. doi: 10.3389/fncom.2010.00148
Received: 16 June 2010;
Accepted: 01 November 2010;
Published online: 29 November 2010.
Edited by:
Luciano Da F. Costa, University of Sao Paulo, BrazilReviewed by:
Francisco A. Rodrigues, University of Sao Paulo, BrazilHerbert Jelinek, Charles Sturt University, Australia
Claus Hilgetag, Jacobs University Bremen, Germany
Marconi Soares Barbosa, University of Sao Paulo, Brazil
Copyright: © 2010 van Pelt, Carnell, de Ridder, Mansvelder and van Ooyen. This is an open-access article subject to an exclusive license agreement between the authors and the Frontiers Research Foundation, which permits unrestricted use, distribution, and reproduction in any medium, provided the original authors and source are credited.
*Correspondence: Jaap van Pelt, Computational Neuroscience Group, Department of Integrative Neurophysiology, Center for Neurogenomics and Cognitive Research, Vrije Universiteit Amsterdam, De Boelelaan 1085, 1081 HV Amsterdam, Netherlands. e-mail: jaap.van.pelt@cncr.vu.nl