Improving Between-Group Effect Size for Multi-Site Functional Connectivity Data via Site-Wise De-Meaning
 Alexandra M. Reardon
 Kaiming Li
 Xiaoping P. Hu
- 1Department of Bioengineering, University of California, Riverside, Riverside, CA, United States
- 2Center for Advanced Neuroimaging, University of California, Riverside, Riverside, CA, United States
Background: Multi-site functional MRI (fMRI) databases are becoming increasingly prevalent in the study of neurodevelopmental and psychiatric disorders. However, multi-site databases are known to introduce site effects that may confound neurobiological and measures such as functional connectivity (FC). Although studies have been conducted to mitigate site effects, these methods often result in reduced effect size in FC comparisons between controls and patients.
Methods: We present a site-wise de-meaning (SWD) strategy in multi-site FC analysis and compare its performance with two common site-effect mitigation methods, i.e., generalized linear model (GLM) and Combining Batches (ComBat) Harmonization. For SWD, after FC was calculated and Fisher z-transformed, the site-wise FC mean was removed from each subject before group-level statistical analysis. The above methods were tested on two multi-site psychiatric consortiums [Autism Brain Imaging Data Exchange (ABIDE) and Bipolar and Schizophrenia Network on Intermediate Phenotypes (B-SNIP)]. Preservation of consistent FC alterations in patients were evaluated for each method through the effect sizes (Hedge’s g) of patients vs. controls.
Results: For the B-SNIP dataset, SWD improved the effect size between schizophrenic and control subjects by 4.5–7.9%, while GLM and ComBat decreased the effect size by 22.5–42.6%. For the ABIDE dataset, SWD improved the effect size between autistic and control subjects by 2.9–5.3%, while GLM and ComBat decreased the effect size by up to 11.4%.
Conclusion: Compared to the original data and commonly used methods, the SWD method demonstrated superior performance in preserving the effect size in FC features associated with disorders.
Introduction
Neuroimaging has become a powerful tool in studying psychiatric disorders (Peter et al., 2018). Functional magnetic resonance imaging (fMRI) allows for the study of aberrant functional connectivity (FC), predictions of normal individuals vs. patients, early identification of neurological diseases, neuromarkers, and responses to treatment (Van Horn and Toga, 2009). Many traditional fMRI studies were limited by statistical power, since large-scale data is difficult to obtain at a single imaging site due to limited diseased population in one geographical location, limited time, and limited funds (Van Horn and Toga, 2009). Multi-site neuroimaging consortiums are becoming increasingly common in attempts to capture heterogeneity associated with various disorders, as well as to increase geographic variability, sample size, and statistical power (Van Horn and Toga, 2009).
While there are many benefits to multi-site consortiums, there are significant challenges in combining the data for analysis. FMRI data from different sites may contain scanner and site variability, leading to conflicting results and inferior reliability (Van Horn and Toga, 2009; Newton et al., 2012; Birn et al., 2013; Rane et al., 2014; An et al., 2017; Badhwar et al., 2019). Scanner variability can arise from different scanning vendors, scanner technology, and field inhomogeneities (Van Horn and Toga, 2009). Sites with the same scanner vendors and models have been found to introduce different field inhomogeneities that have affected the way the data was interpreted (Van Horn and Toga, 2009). Additionally, different scanner manufacturers are known to have different levels of test-retest reliability. It has been reported that Siemen’s scanners have better consistency than Philips’s scanners (An et al., 2017; Badhwar et al., 2019). In many multi-site consortiums, individual imaging sites utilized different scanning parameters, including repetition time, echo time, acquisition time, voxel size, flip angle, field of view, and slice thickness, in collecting fMRI data. The use of different scanning parameters has been known to influence resting-state fMRI results (Newton et al., 2012; Birn et al., 2013; Rane et al., 2014). For example, increasing the acquisition time of scans from 5 to 13 min has been proven to improve the reliability and similarity of functional correlations in resting state scans (Birn et al., 2013). Newton et al. (2012) reported that decreasing voxel size dimensions increased FC correlations in resting state scans, while Rane et al. (2014) demonstrated that a short TE (TE = 15 ms) in scans led to results less correlated with group results than scans acquired at a higher TE (TE = 35 ms and TE = 55 ms).
Efforts to reduce site variability have been made through homogenizing scanning protocols and/or through site-to-site quality assurance via standardized brain imaging phantoms (Yu et al., 2018). While these methods mitigate some of the variability associated with site-effects, in existing multi-site consortiums where data were not originally purposed for aggregation, homogenized scanning protocols and imaging phantoms were not available. One study quantified the sampling bias and engineering measurement bias of a traveling subject cohort who received resting-state scans at multiple imaging sites (Yamashita et al., 2019). This method was able to remove only the measurement bias, therefore improving signal-to-noise ratio. However, utilizing a traveling-cohort is costly, time consuming, and may be impractical with many established multi-site consortiums, and therefore a post-acquisition method to mitigate site-effects is desirable.
Attempts to reduce multi-site consortium variability in FC analysis of fMRI data after acquisition include generalized linear model (GLM) and Combining Batches (ComBat) harmonization (Rao and Joao, 2017; Yu et al., 2018; Yamashita et al., 2019). GLM modifies FC values to account for site differences, but important FC features associated with patient groups may be compromised after this method (Rao and Joao, 2017; Yamashita et al., 2019). ComBat utilizes site-specific scaling factors and an empirical Bayesian criterion to shift samples to the grand mean and pooled variance across sites (Yu et al., 2018). It has demonstrated effectiveness in small samples of resting-state fMRI data using homogenized scanning parameters. However, it is unclear if ComBat harmonized fMRI data preserves the functional networks associated with psychiatric disorders or can accurately account for FC effects imposed by heterogeneous scan parameters (Yu et al., 2018). ComBat also centers the FC data of each site to the overall, grand mean of all samples, thus resulting in harmonized FC features that lose their original physical meaning (Da-Ano et al., 2020).
Although some multi-site consortiums may use phantoms or homogenous scanning parameters, there is always the possibility that sites will decide to aggregate FC data after image acquisition. There is a great need for a site-effect mitigation method that can be applied after acquisition, on heterogeneous scanning parameters, and that preserves functional networks associated with psychiatric disorders. Examples of such multi-site database are the Autism Brain Imaging Data Exchange (ABIDE) and the Bipolar and Schizophrenia Network on Intermediate Phenotypes (B-SNIP) (Tamminga et al., 2013; Di Martino et al., 2014). ABIDE is a consortium of neuroimaging data from Autism Spectrum Disorder (ASD) subjects and healthy controls (HC) from 17 international sites, while B-SNIP is a consortium of Schizophrenia (SZ), Schizoaffective disorder (SA), Bipolar disorder subjects and HCs from 5 different imaging sites (Tamminga et al., 2013). Both datasets include sites that utilize different resting-state scanning parameters, protocols, and scanner models.
Here, we describe a site-wise de-meaning (SWD) strategy for multi-site FC analysis of fMRI data and compare its performance with two common site-effect mitigation methods (GLM, and ComBat Harmonization). We (1) establish the consistent FC differences between disease groups and control groups in literature, (2) apply site-effect mitigation methods (GLM, ComBat, SWD) to multi-site FC data, and (3) compare the effect size of established FC findings of the three site-effect mitigation methods.
Materials and Methods
Datasets
Bipolar and Schizophrenia Network on Intermediate Phenotypes
Resting-state fMRI data of 317 subjects from 4 sites in B-SNIP with a Diagnostic and Statistical Manual, 4th Edition (DSM-IV) SZ diagnosis (n = 149) and the corresponding HCs (n = 168) were included in this study (Tamminga et al., 2013). Demographic information including site, sample size, sex, and age is shown in Table 1.
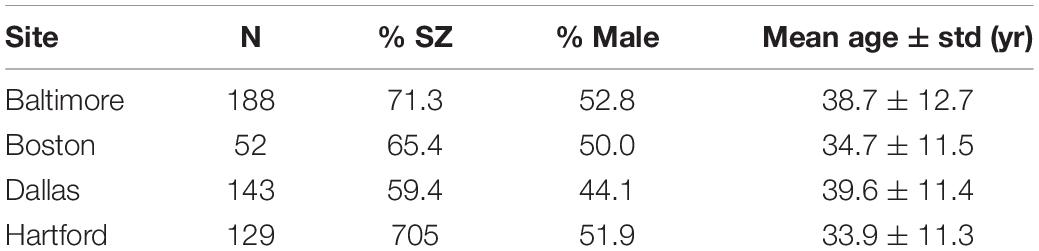
Table 1. Demographic information for the SZ and HC subjects from B-SNIP.
Autism Brain Imaging Data Exchange
Resting-state fMRI data from 850 subjects in ABIDE I with an ASD DSM-IV-TR diagnosis (n = 355) and the corresponding HCs (n = 495) from the same sites were used in this study (First and Gibbon, 2004; Di Martino et al., 2014). Demographic information including site, sample size, sex, age, and mean Full Scale IQ (FIQ) is shown in Table 2.
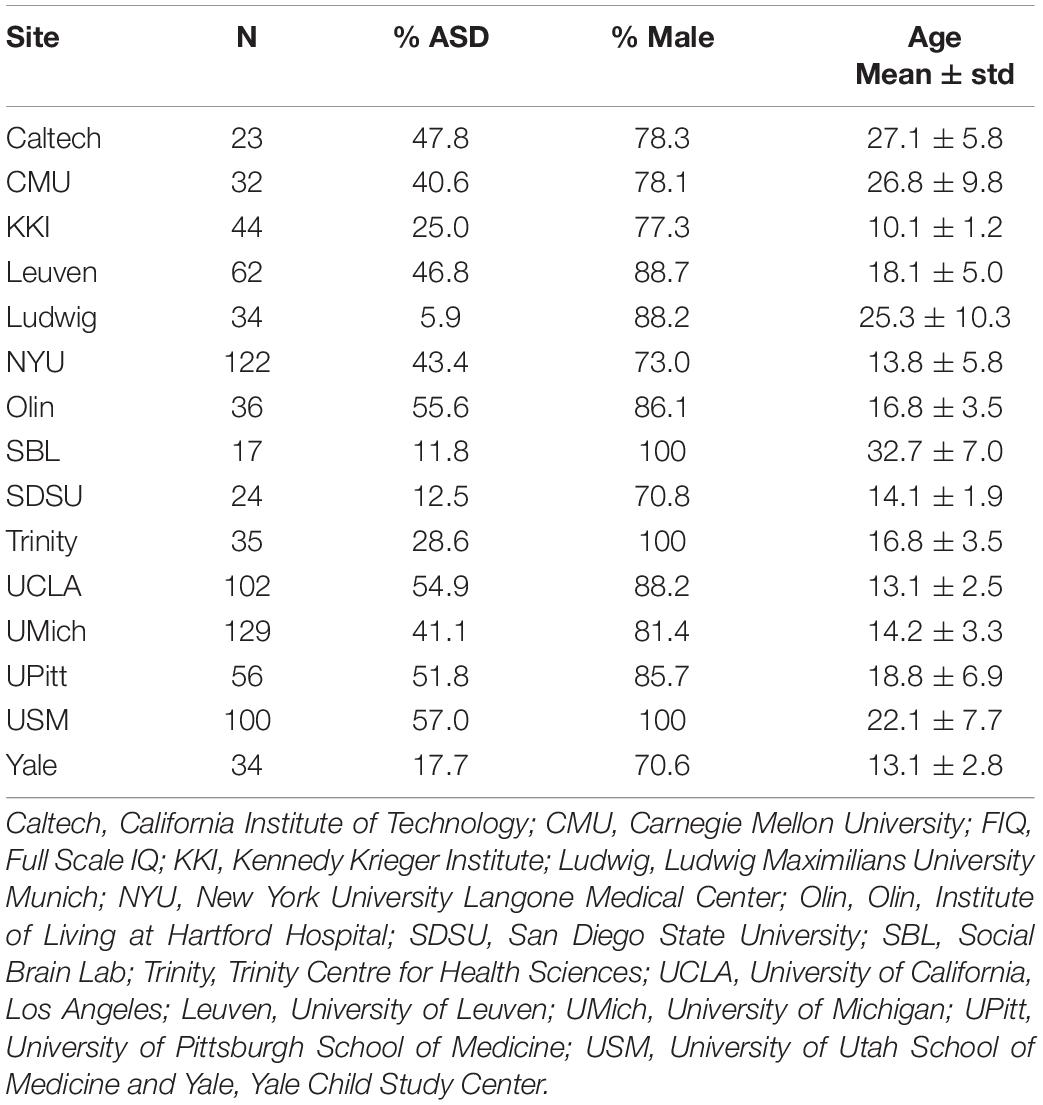
Table 2. Demographic information for the ASD and HC subjects from ABIDE.
Image Acquisition
Imaging data used in this analysis were collected on 3T MRI scanners. Scan parameters for the resting-state fMRI protocols from B-SNIP are summarized in Table 3 and scan parameters from ABIDE are summarized in Table 4. For each subject, a T1-weighted structural image was collected and used for registration to the MNI152 space. Full details for acquisition parameters, informed consent, and site-specific protocols can be found at http://fcon_1000.projects.nitrc.org/indi/abide/abide_I.html for ABIDE and http://b-snip.org/for B-SNIP (Tamminga et al., 2013; Di Martino et al., 2014).
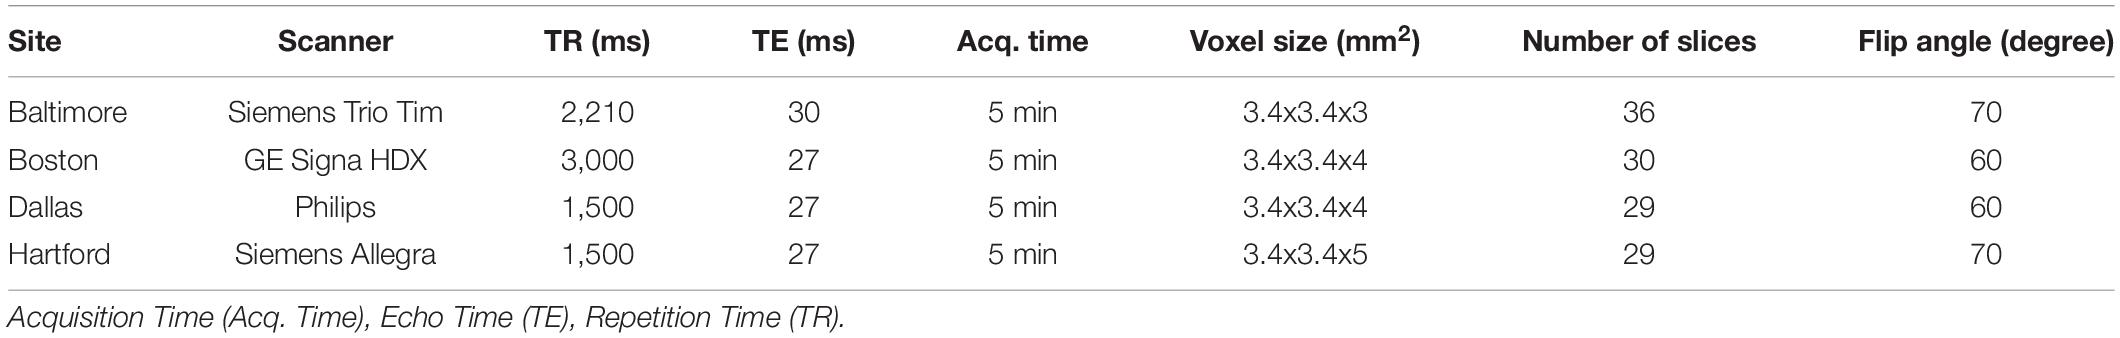
Table 3. Resting-state fMRI scan parameters for subjects in B-SNIP.
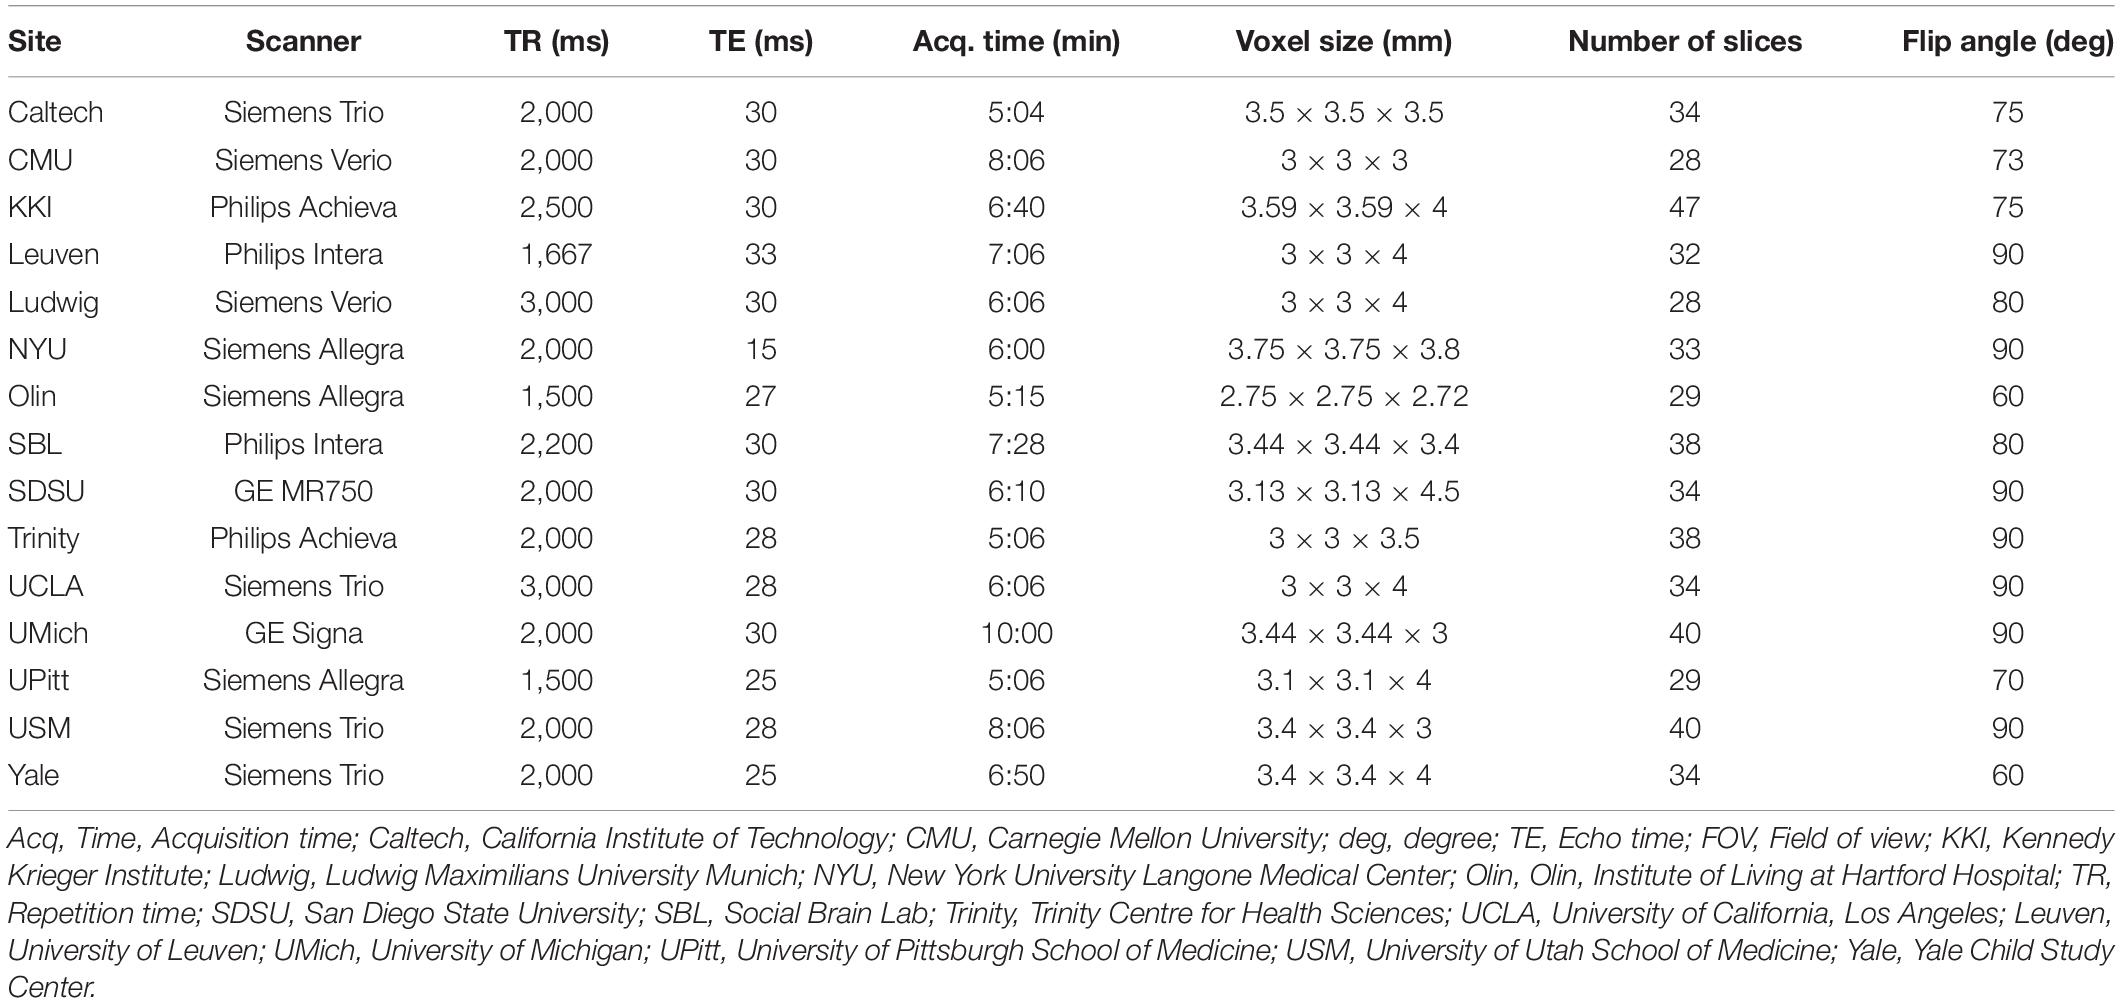
Table 4. Resting-state fMRI scan parameters for subjects in ABIDE.
Preprocessing
The resting-state fMRI data was preprocessed using the Connectome Computation System pipeline (Zuo et al., 2013). Steps included slice time correction, motion correction, skull stripping, global mean intensity normalization, nuisance signal regression, band pass filtering (0.01–0.1 Hz), and registration of the resting-state fMRI image to the T1-weighted image, followed by a transformation to standard space (Zuo et al., 2013). The resting state fMRI data was then parcellated into 200 regions of interest (ROIs) using a spatially constrained spectral clustering algorithm based on functional parcellations by Cameron Craddock (Craddock et al., 2012).
Functional Connectivity Matrices and Parcellation
Pearson’s correlation coefficient was used to ascertain the FC of each region of interest (ROI) pair, resulting in a 200 × 200 FC matrix for each subject. Each correlation coefficient was Fisher z-transformed, then linear regression was used to regress out age and sex covariates to ensure that these confounding variables did not affect results.
Established Functional Connectivity Differences in Diagnostic Groups
The most common resting-state FC findings between disease and control groups was determined by performing a literature review in PubMed to identify relevant studies published within the last 15 years for FC differences between SZ and HC (keywords: SZ, FC, resting-state, functional MRI) and for FC differences between ASD and HC (keywords: ASD, FC, resting-state, functional MRI).
Comparison of Methods
We compared the effect size of FC differences between patients and controls for the following methods: (1) GLM, (2) ComBat (Johnson et al., 2007), and (3) SWD.
(1) GLM
After Fisher z-transforming the FC data, multiple linear regression with terms for age, sex, and site was performed in MATLAB. The regression model can be written as:
Where yijv represents the connectivity at every site (i), subject (j), and for every ROI pair (v), αv is the average connectivity value for a particular connectivity value (v), is the design matrix for the covariates (age, sex, site) for every site (i), and subject (j), and βv is the vector of regression coefficients corresponding to . The removal of site-effects is done by subtracting the estimated site-effects:
(2) ComBat
FC values were Fisher z-transformed and a multivariate linear mixed effects regression with terms for biological variables and scanner were used to model FC (Yu et al., 2018). The ComBat harmonization model can be written as:
Where yijv represents the connectivity at every site (i), subject (j), and for every ROI pair (v), αv is the average connectivity value for a particular connectivity value (v), XTij is a design matrix for the covariates of interest (age, sex, and diagnostic group) for every subject (j), βv is a vector of regression coefficients corresponding to XTij, γiv and δiv are the additive (or location parameter) and multiplicative (or scale parameter), respectively, of site-effects of site i for connectivity value v (Yu et al., 2018). ComBat was performed in MATLAB and the adjusted FC values are given by:
where and are the empirical Bayes estimate of the additive (or location parameter) and multiplicative (or scale parameter), respectively, of site-effects of site i for connectivity value v (Yu et al., 2018). Age and sex effects were then regressed out of the ComBat harmonized FC data.
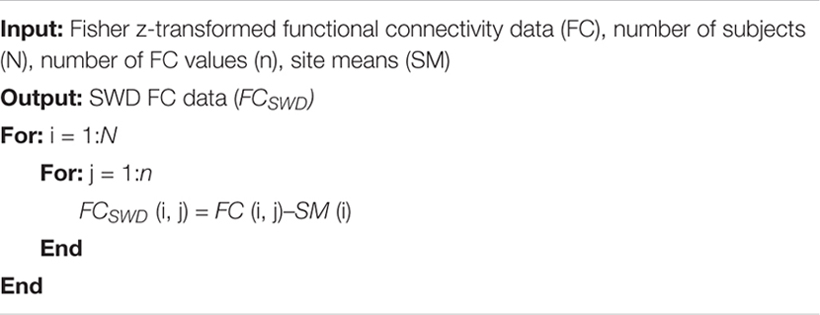
(3) SWD
The Fisher z-transformed data with age and sex regressed out is referred to in Algorithm as FC. A single overall mean value for each site was determined by averaging all FC values for every subject in each site. The mean value was then subtracted from each FC feature for every subject.
Algorithm Site-wise de-meaning (SWD).
Effect Size
To evaluate how each method affects the underlying neurobiological measures, Hedge’s g was used to calculate the effect size of consistent FC alterations in group analysis (ASD vs. HC and SZ vs. HC) for (1) original data with sex and age regressed out, (2) GLM, (3) ComBat harmonized data, and (4) SWD. It is suggested that 0.2 is considered to be a small effect size, 0.5 represents a medium effect size and 0.8 represents a large effect size (Hedges and Olkin, 1985). The following equation was used to calculate Hedge’s g:
where MHC is the mean connectivity of HCs for a particular connectivity value, MASD is the mean connectivity of ASDs for a particular connectivity value, and SD∗pooled is the weighted and pooled standard deviation.
Ethics
Ethical guidelines used in this manuscript are available at http://fcon_1000.projects.nitrc.org/indi/abide/abide_I.html for ABIDE and http://b-snip.org/for B-SNIP (Tamminga et al., 2013; Di Martino et al., 2014).
Results
Consistent Functional Connectivity Alterations
Healthy Controls vs. Schizophrenia Literature Review Findings
Hypoconnectivity, specifically in the medial prefrontal cortex (MPFC), as well as between the MPFC and the anterior cingulate cortex (ACC) (Figure 1), was the most common resting state finding in SZ. Further information regarding the literature findings on hypoconnectivity within MPFC and between MPFC and ACC can be found in Tables 5, 6, respectively.
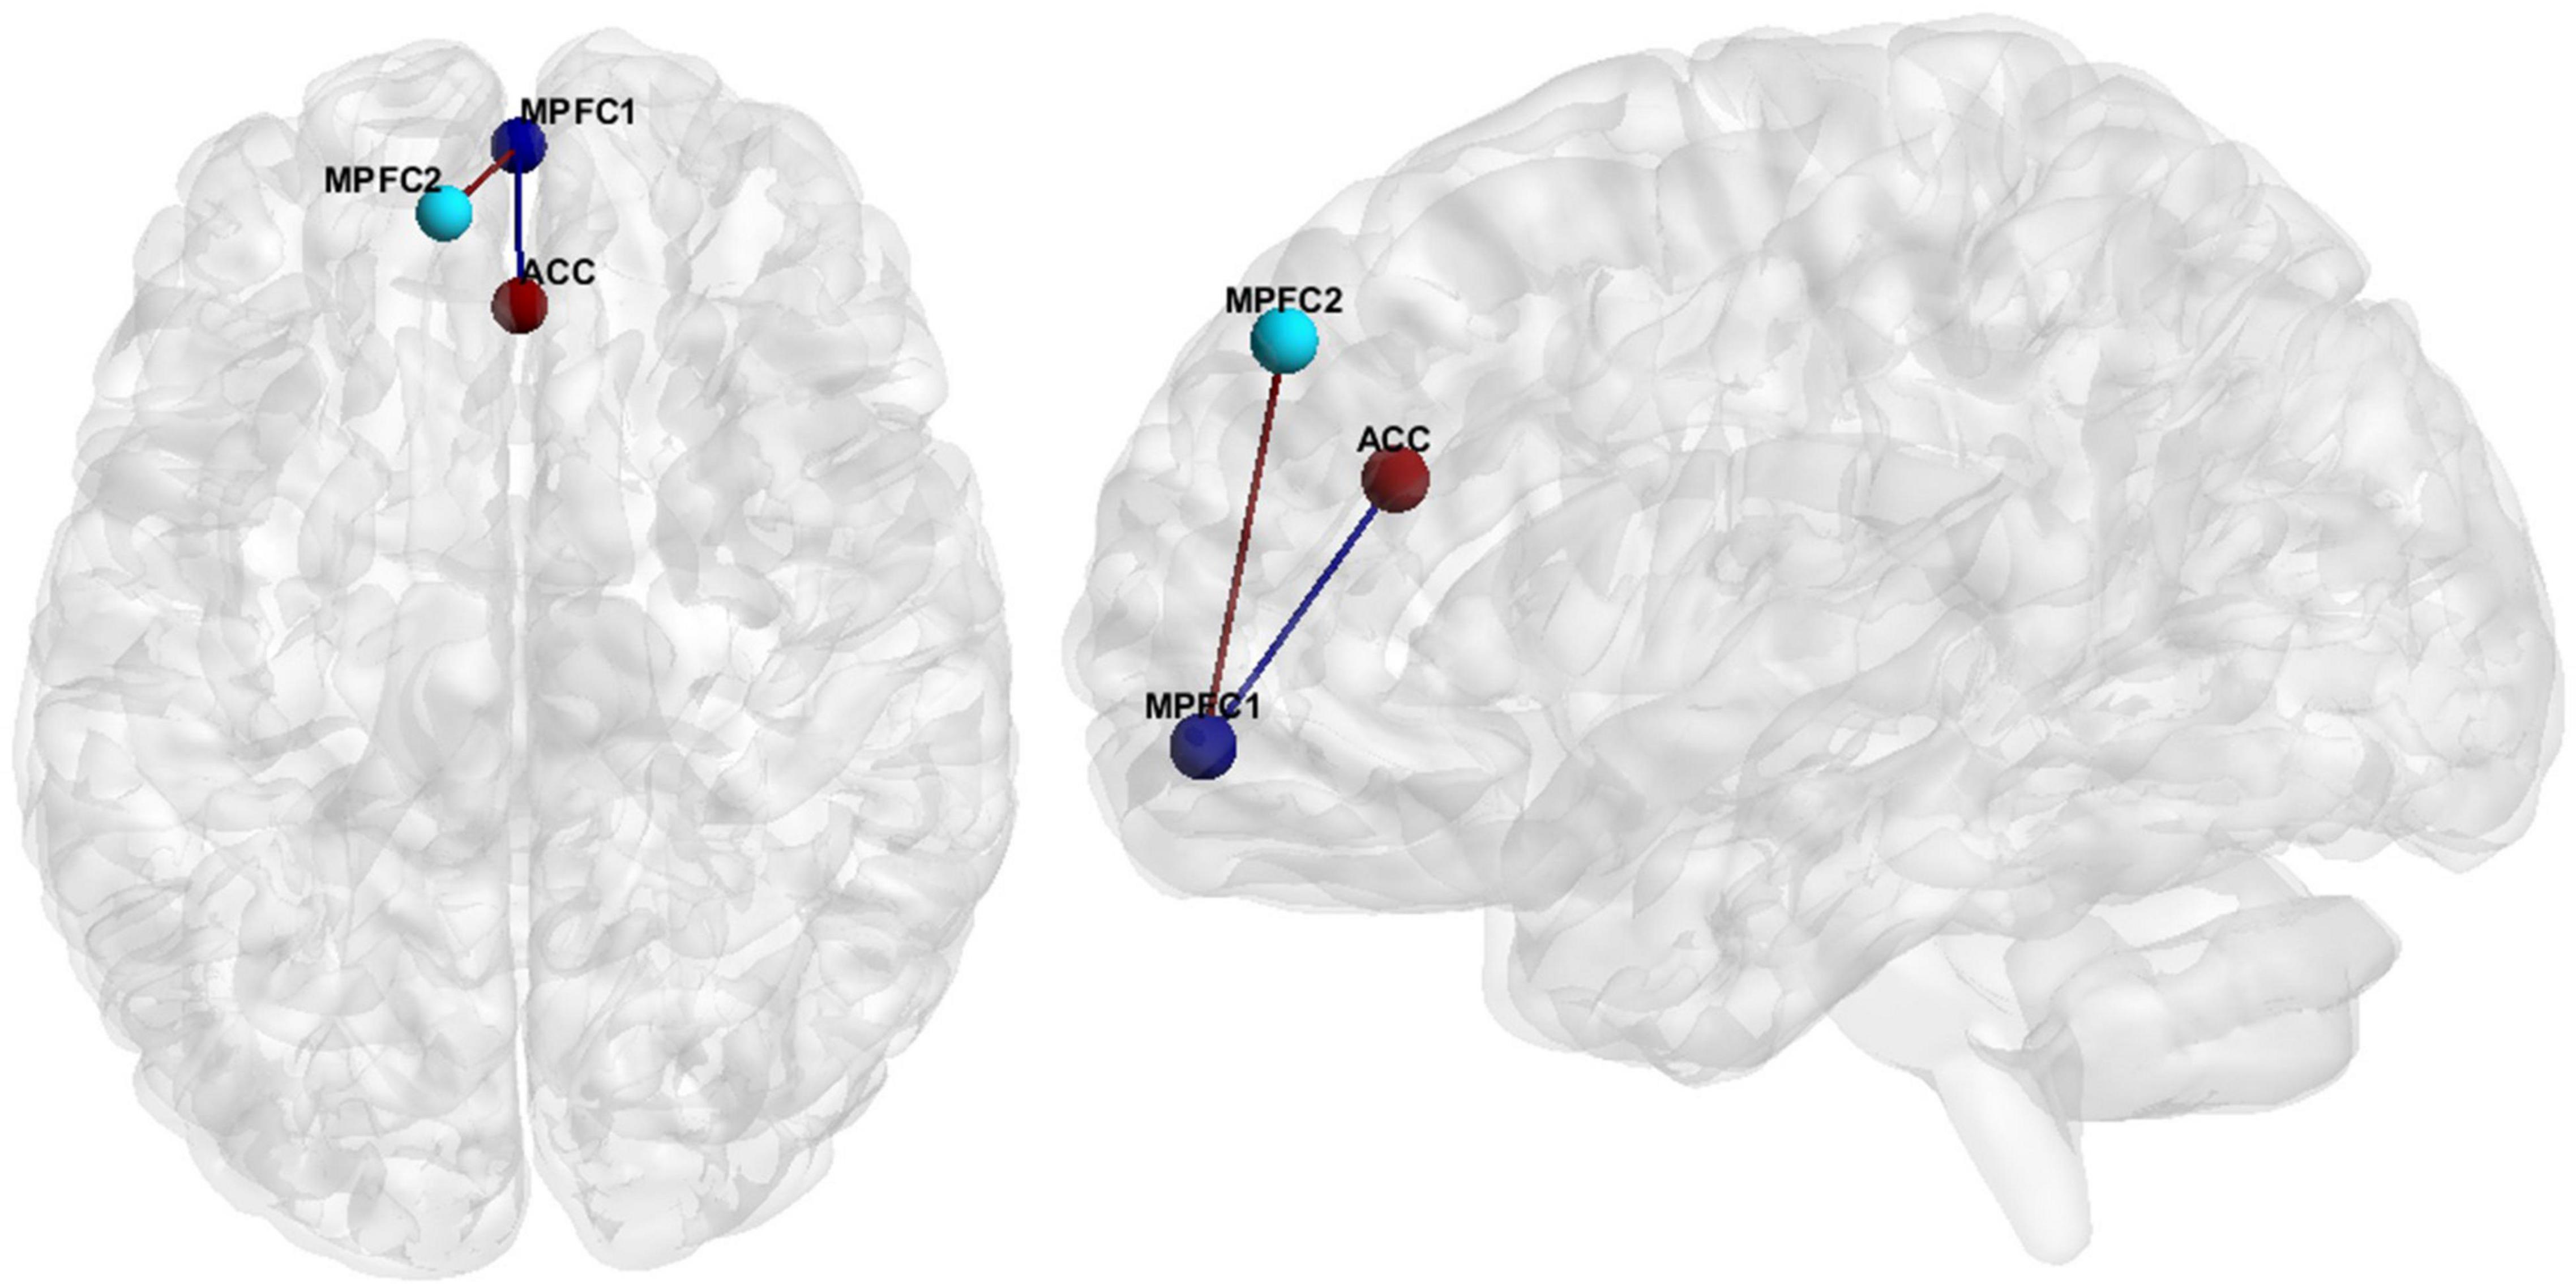
Figure 1. FC features associated with SZ. Medial Prefrontal Cortex (MPFC), Anterior Cingulate Cortex (ACC).
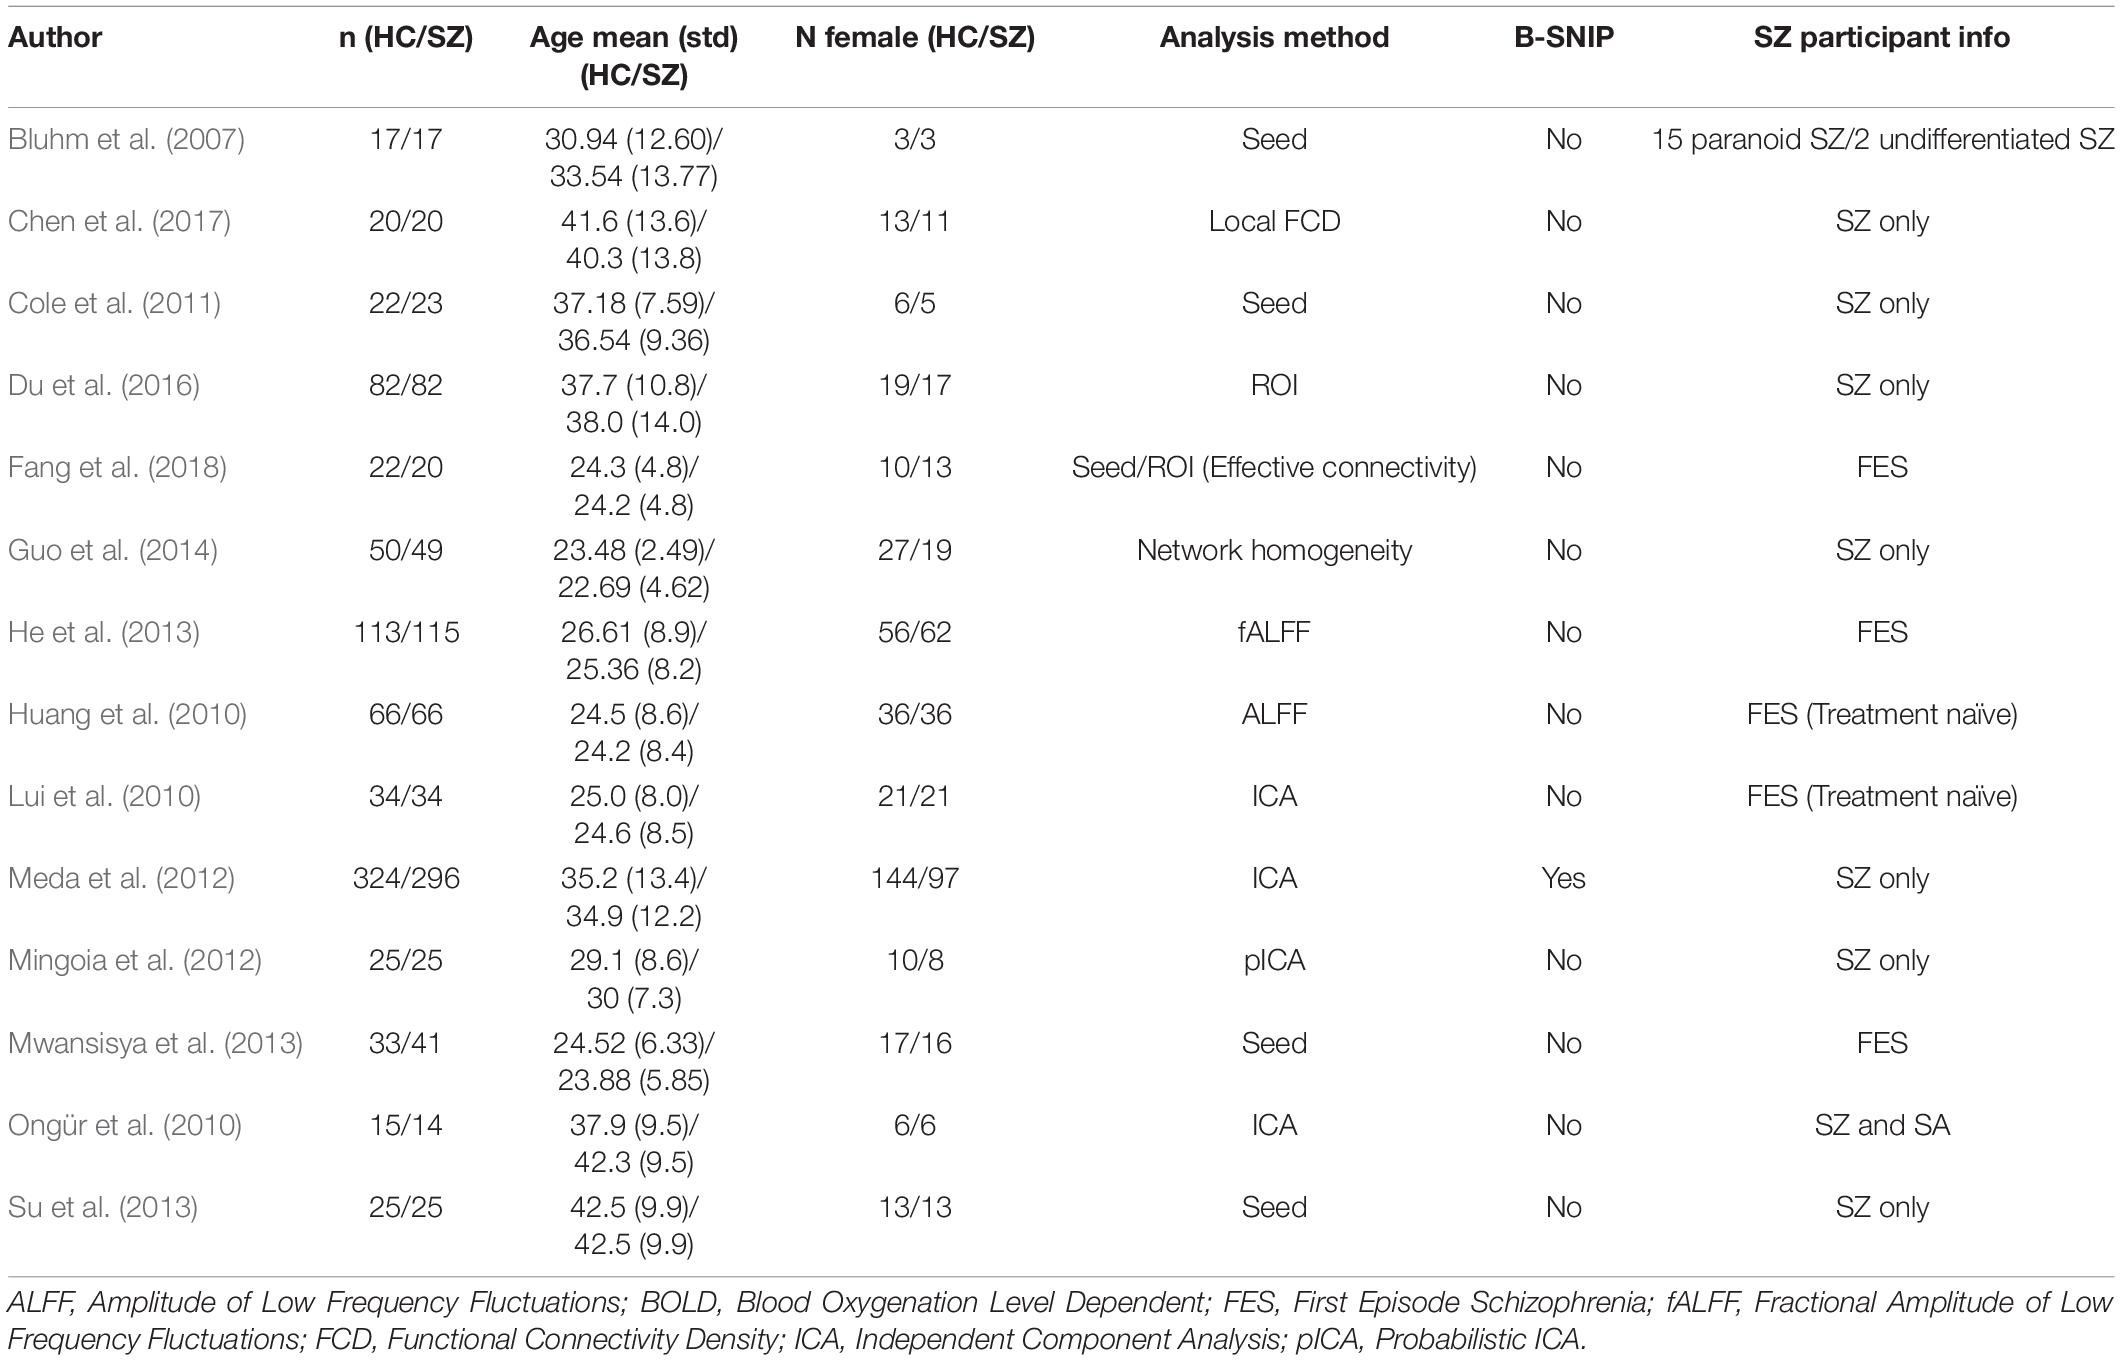
Table 5. Resting state fMRI studies finding within MPFC hypoconnectivity in SZ participants.
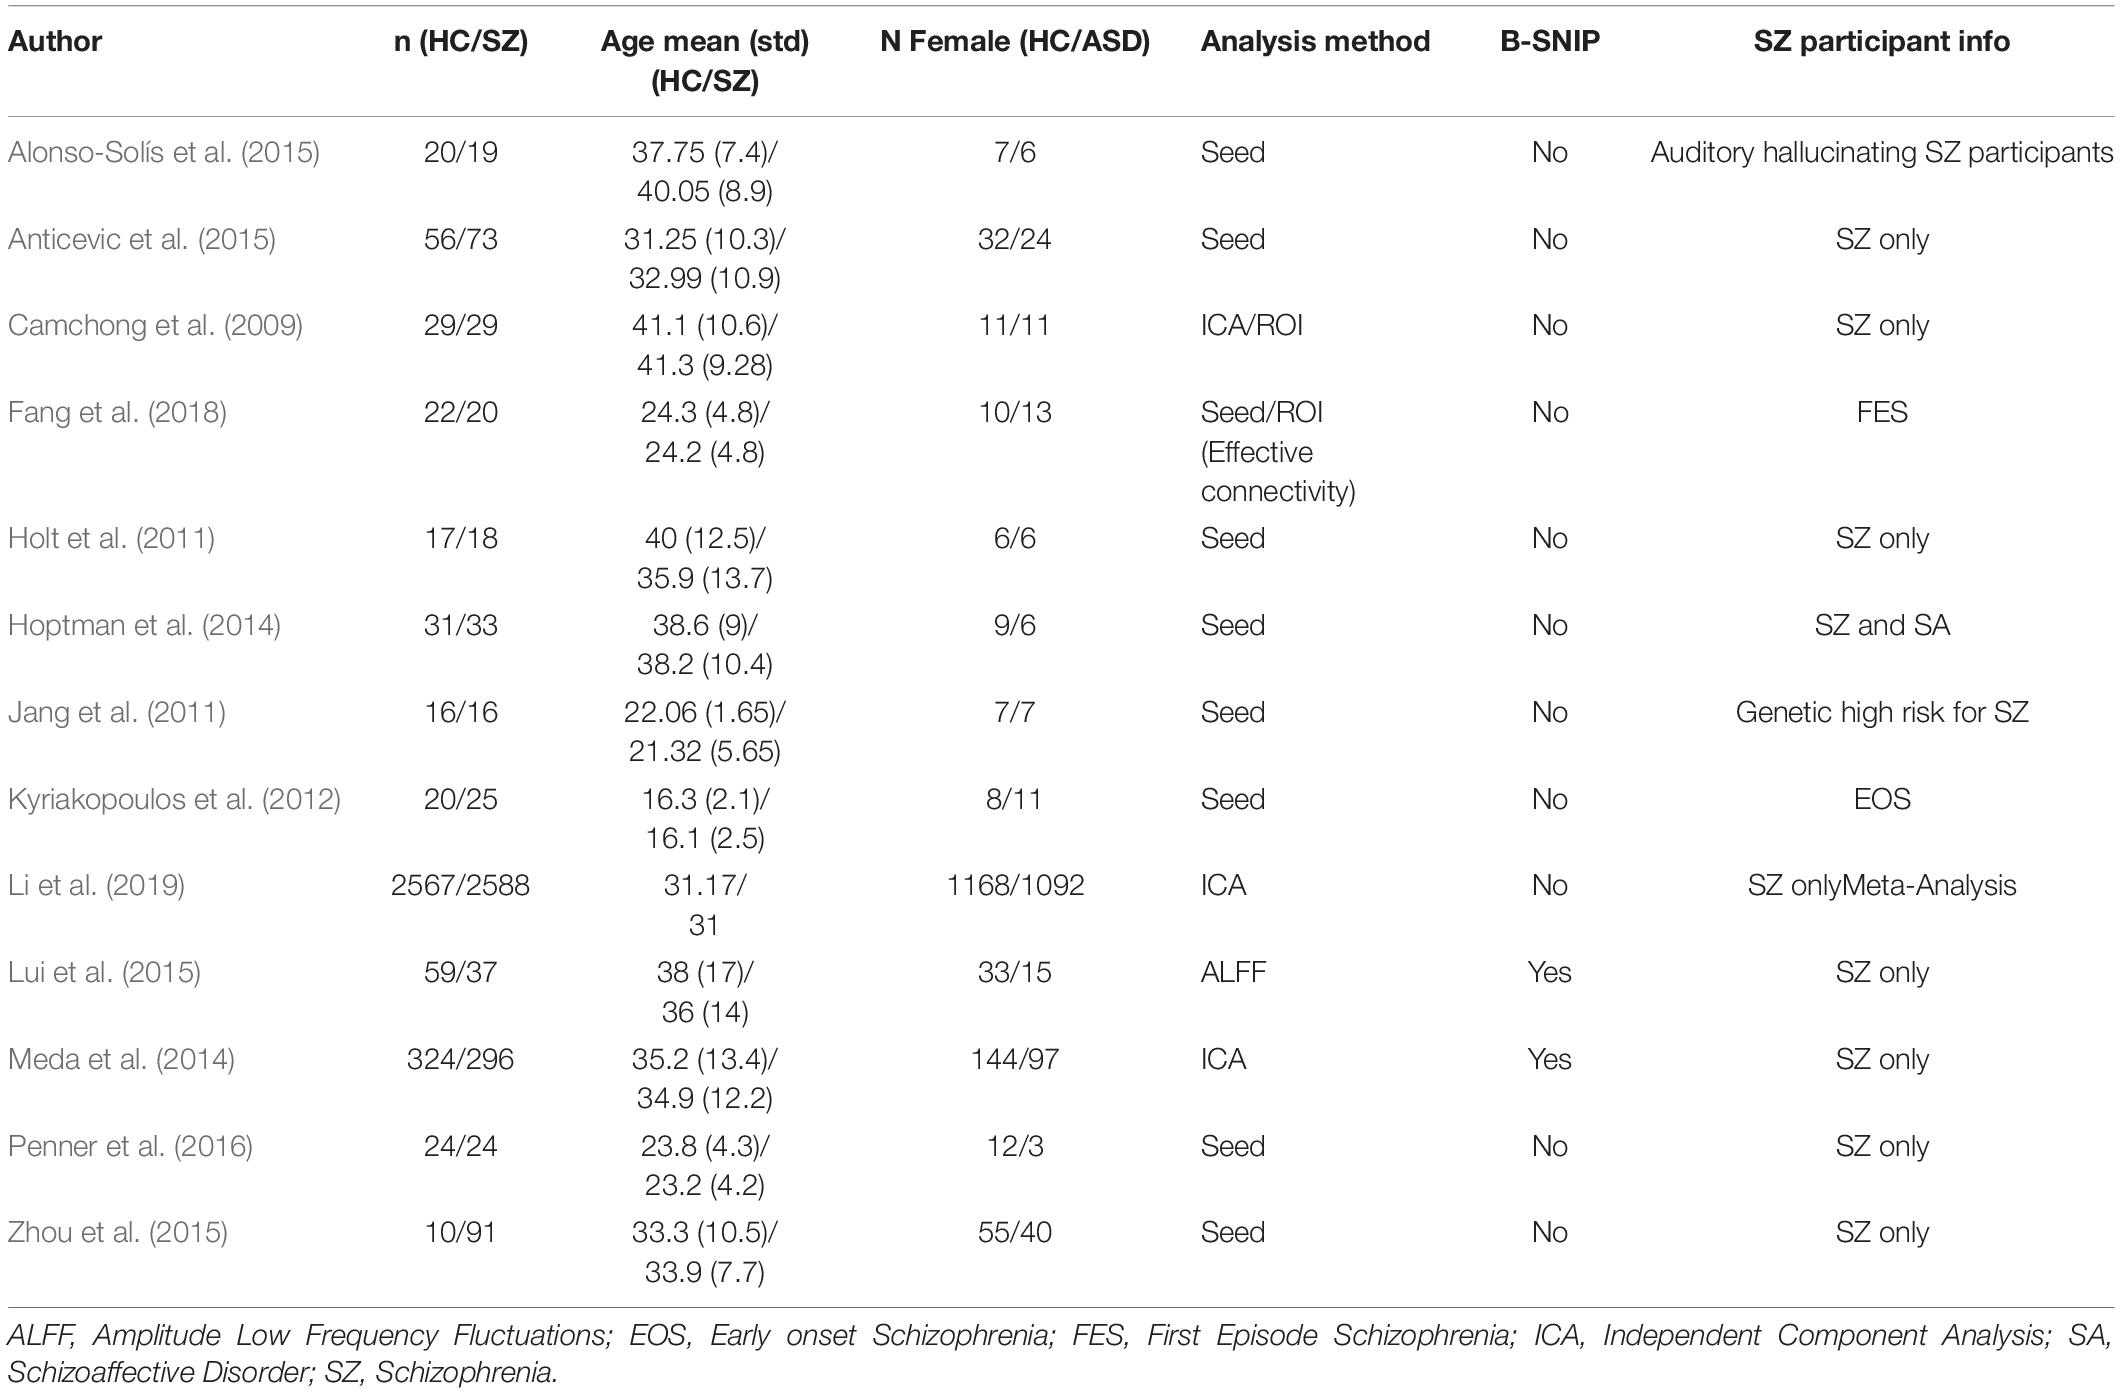
Table 6. Resting state fMRI studies finding MPFC to ACC hypoconnectivity in SZ participants.
Autism Spectrum Disorder Findings
The hypoconnectivity hypothesis of ASD posits that behavioral features of ASD arise from reduced neural connections in the brain (Just et al., 2012). The most common resting state fMRI finding regarding ASD FC was anterior-posterior DMN hypoconnectivity (see Hull et al., 2016). More specifically, our literature review resulted in eighteen studies reporting hypoconnectivity between the posterior cingulate cortex (PCC)/precuneus and the MPFC (Figure 2 and Table 7). Hypoconnectivity between the MPFC in the frontal lobe and MTG of the temporal lobe was the second most common finding in the ASD literature (Figure 2 and Table 8).
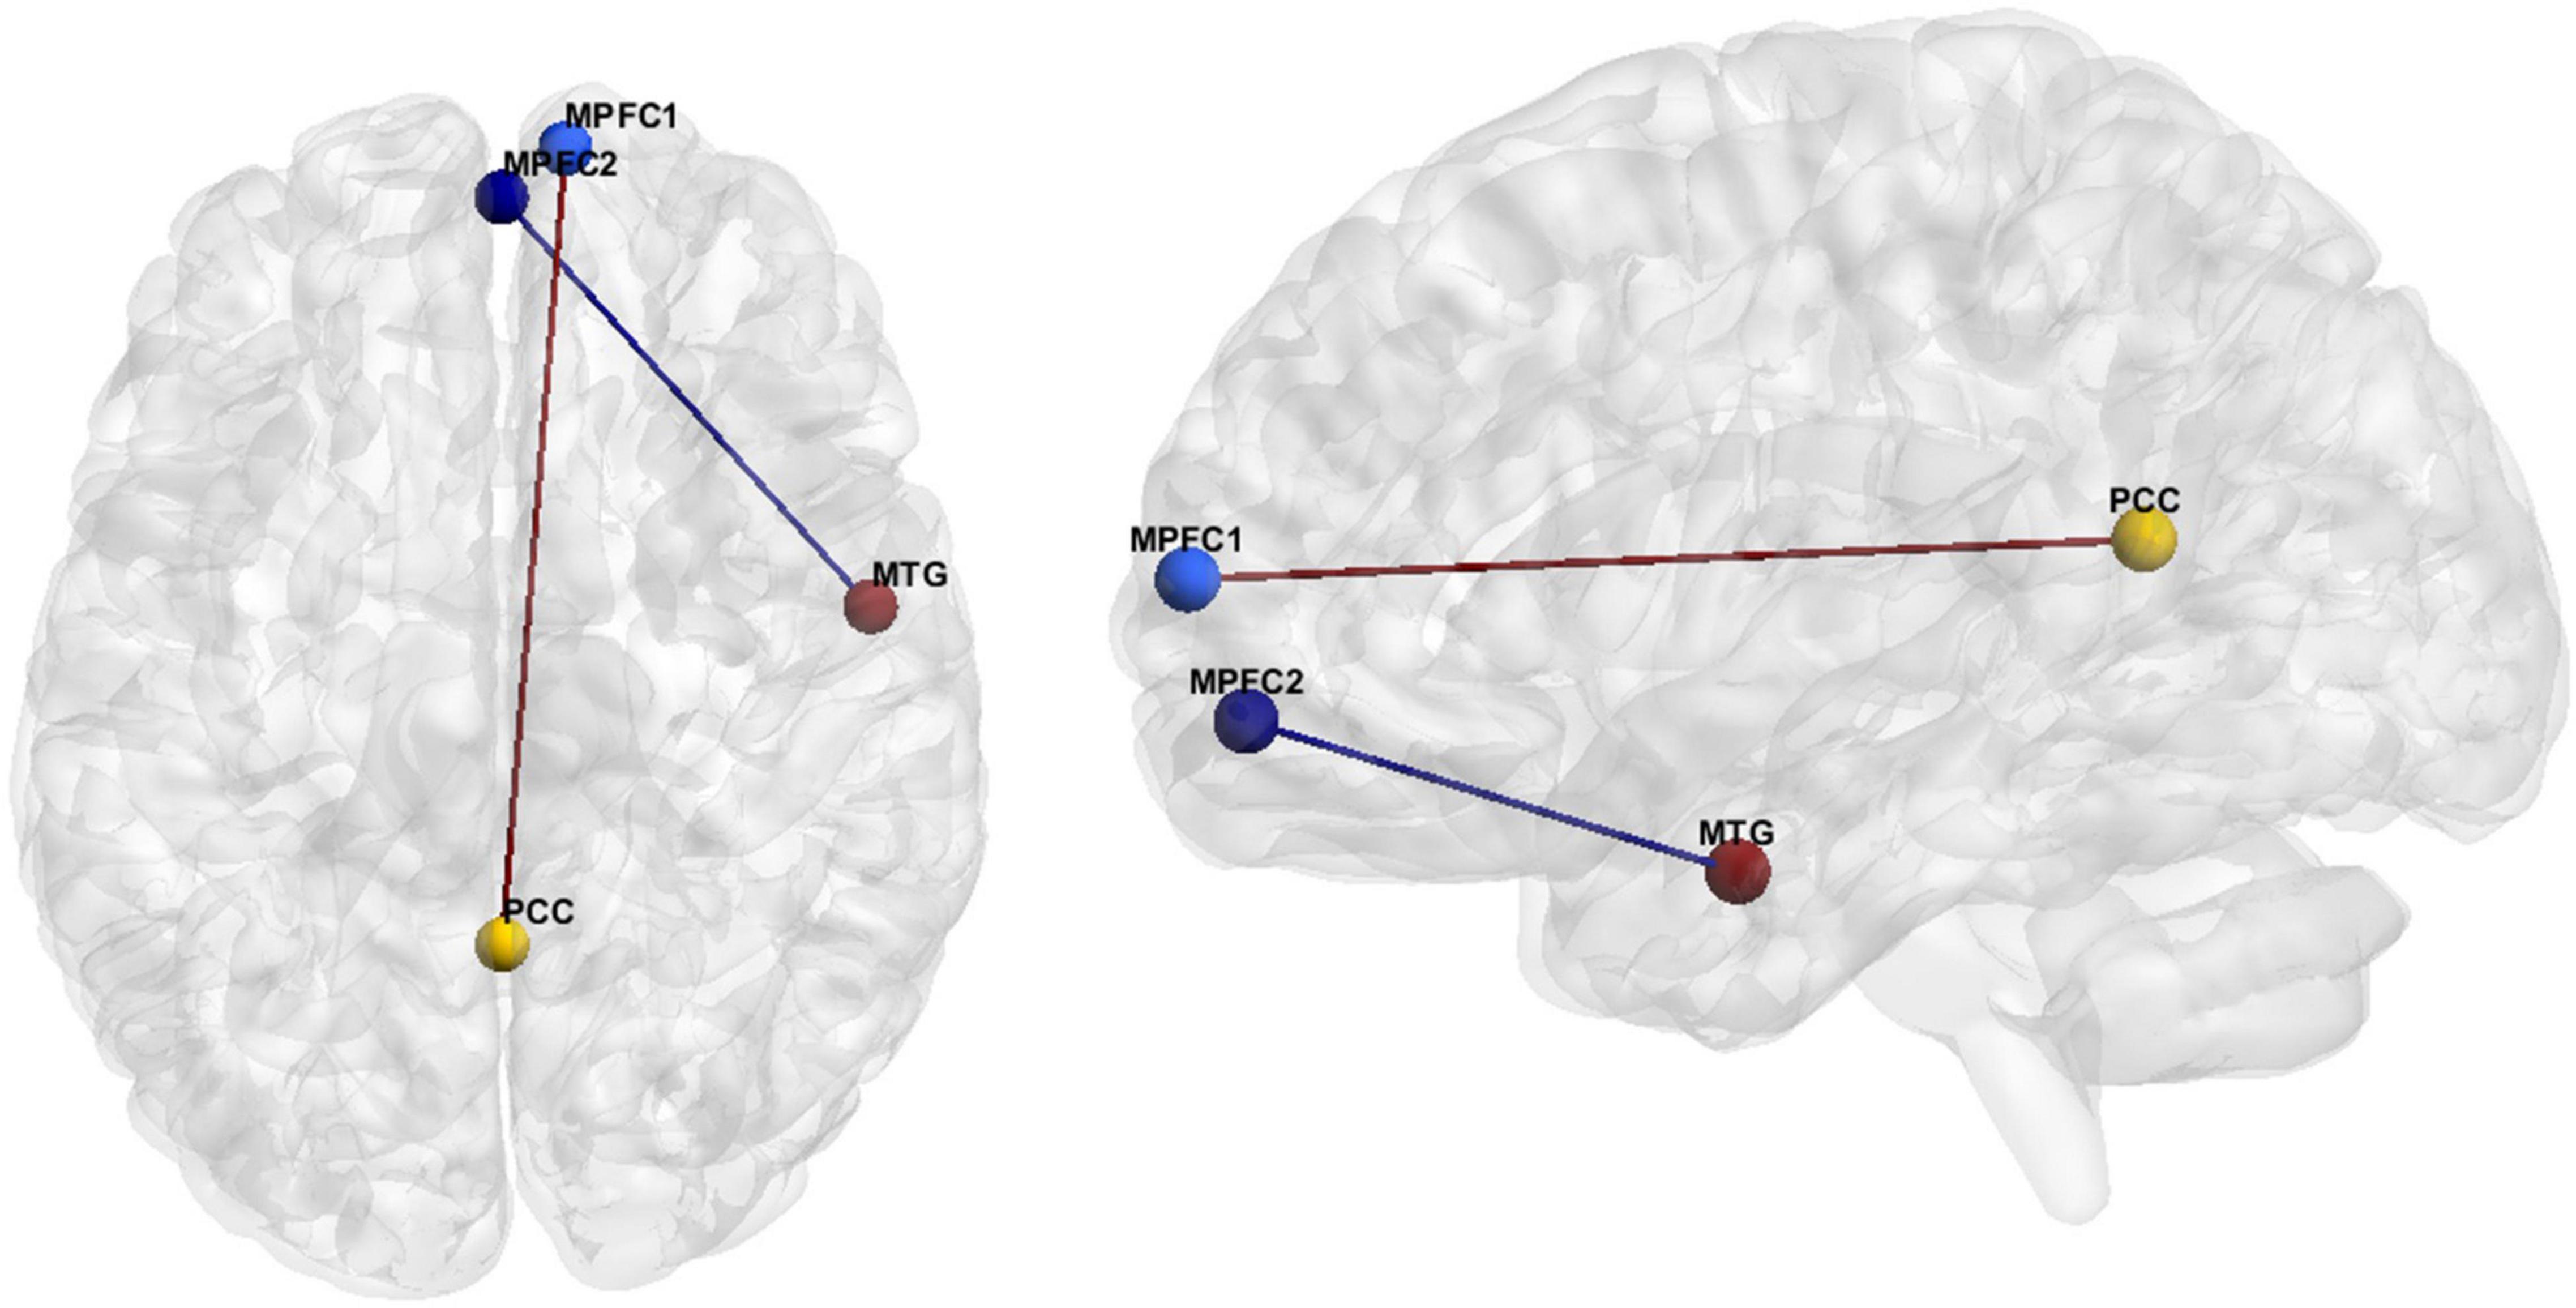
Figure 2. FC features associated with ASD. Medial prefrontal cortex (MPFC), Posterior Cingulate Cortex (PCC), Medial Temporal Gyrus (MTG).
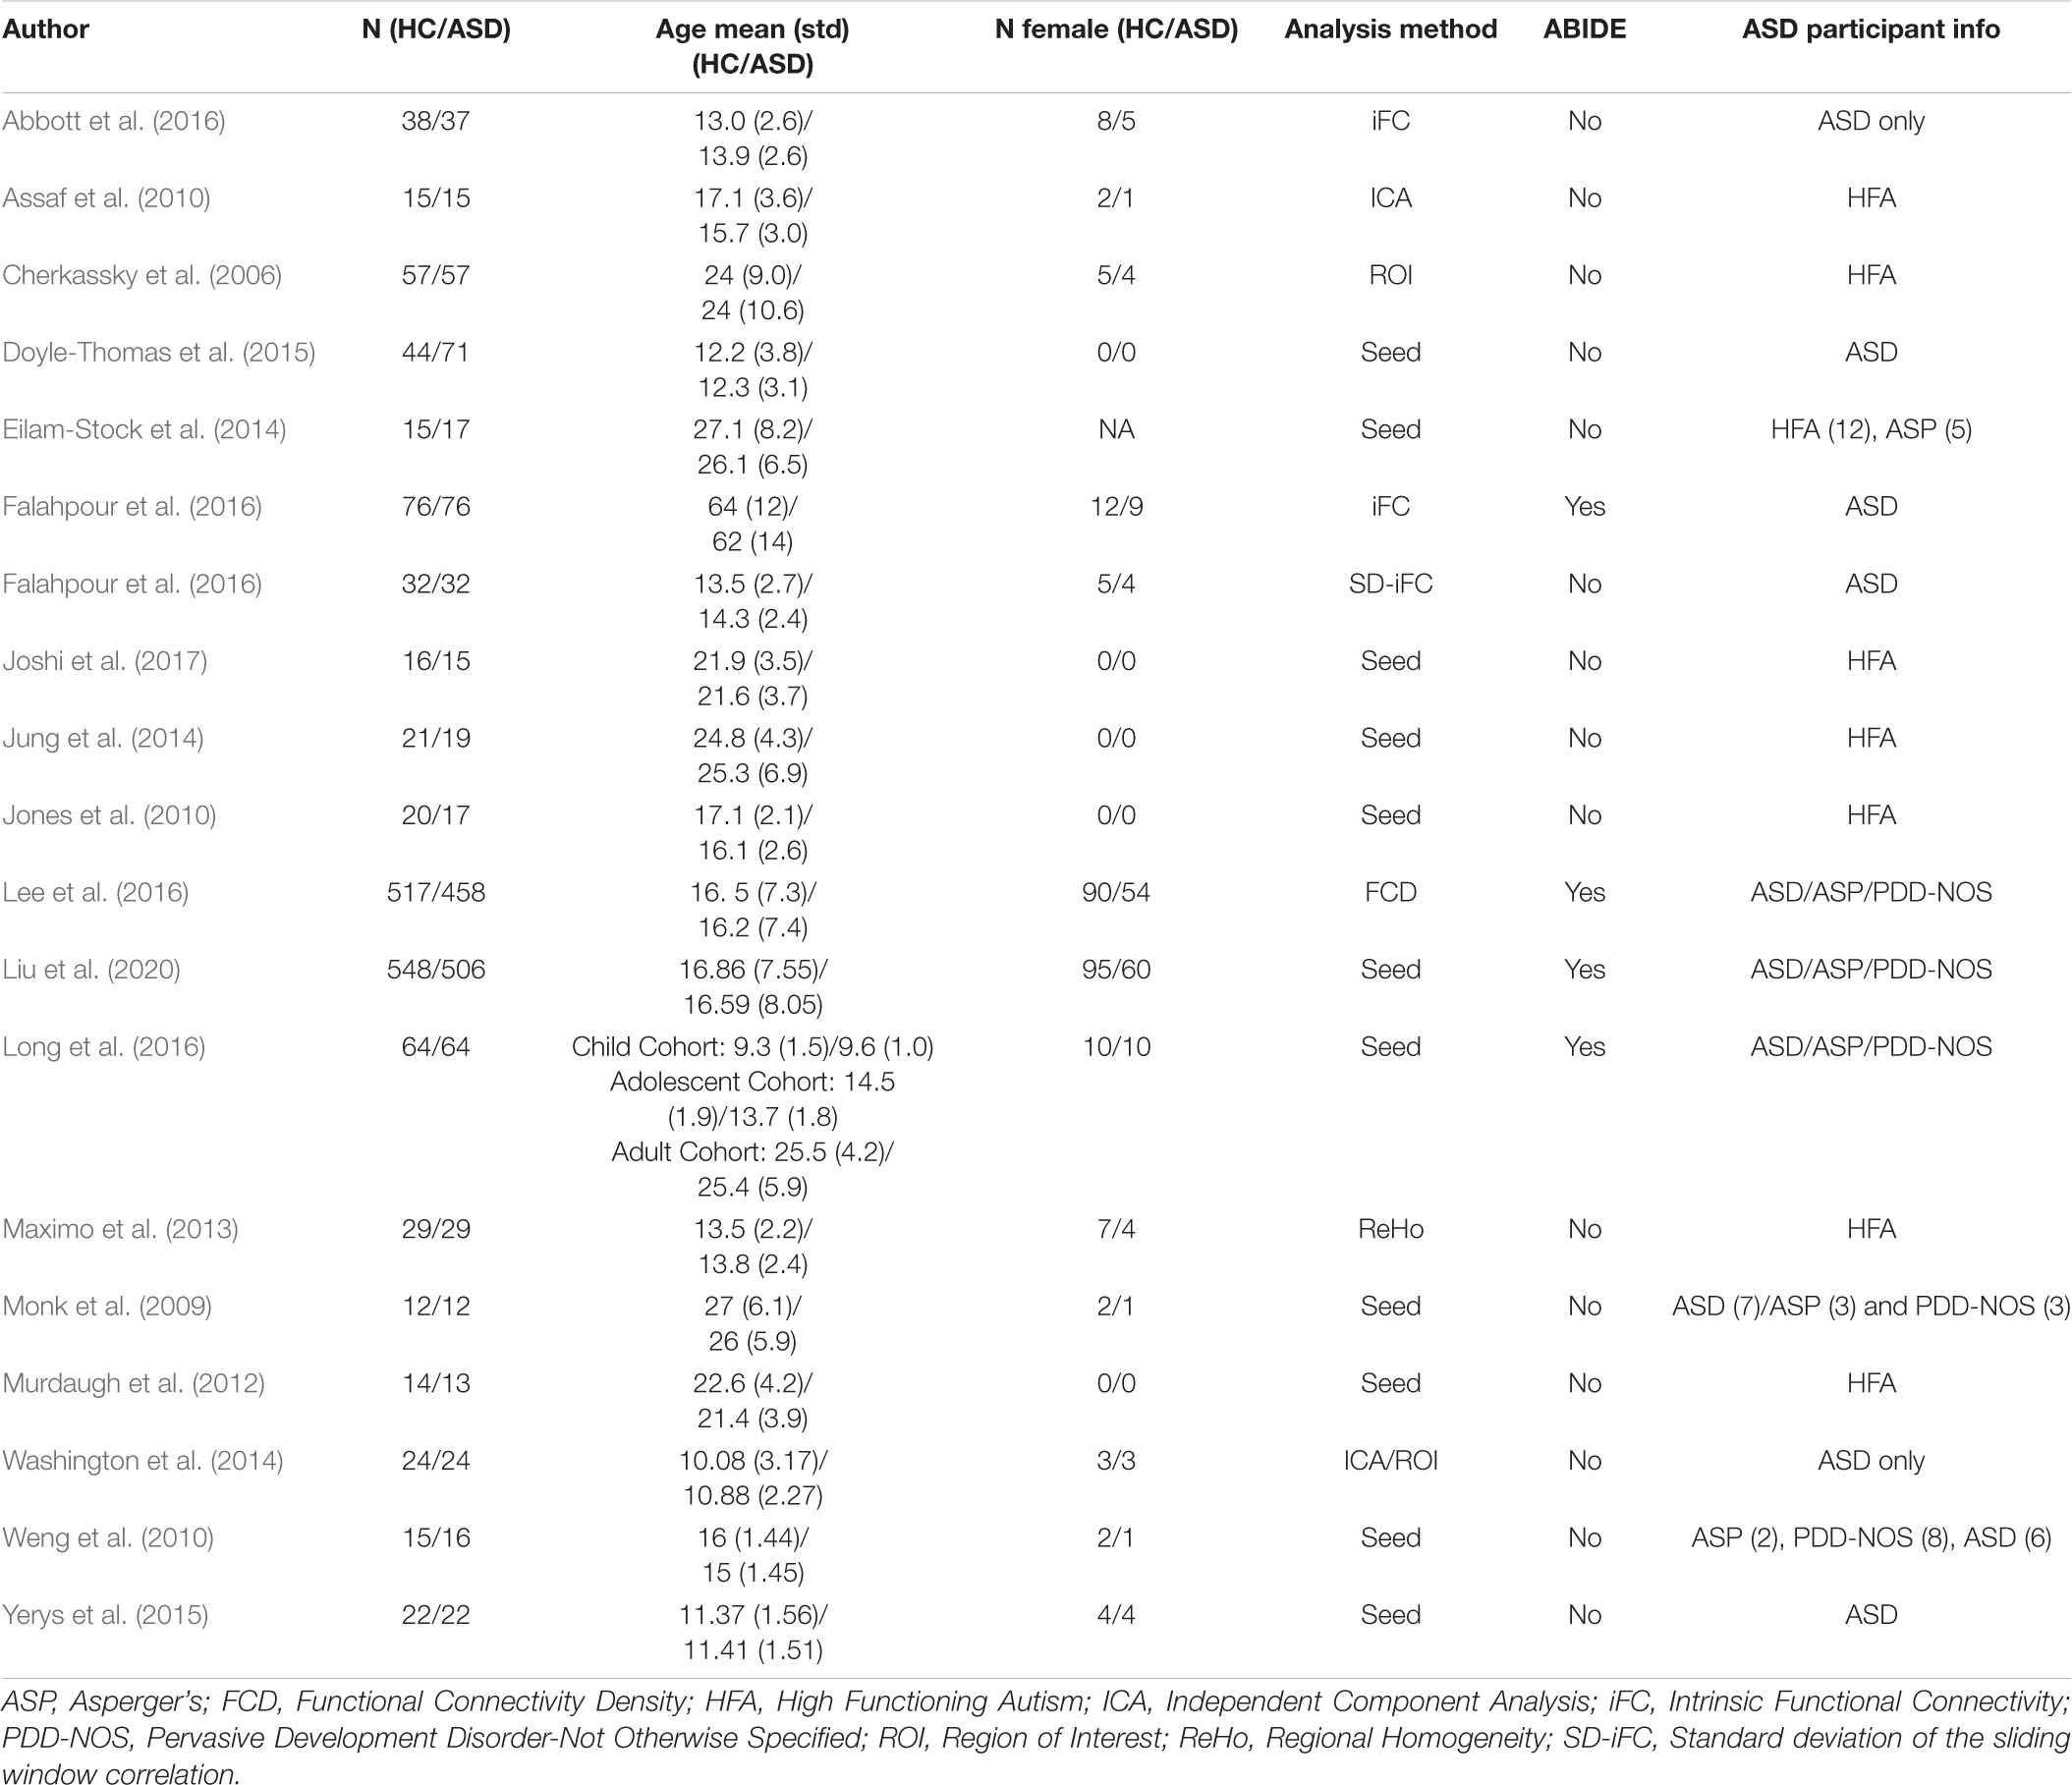
Table 7. Resting state fMRI studies of the primary FC feature of ASD finding MPFC to PCC hypoconnectivity compared to HCs.
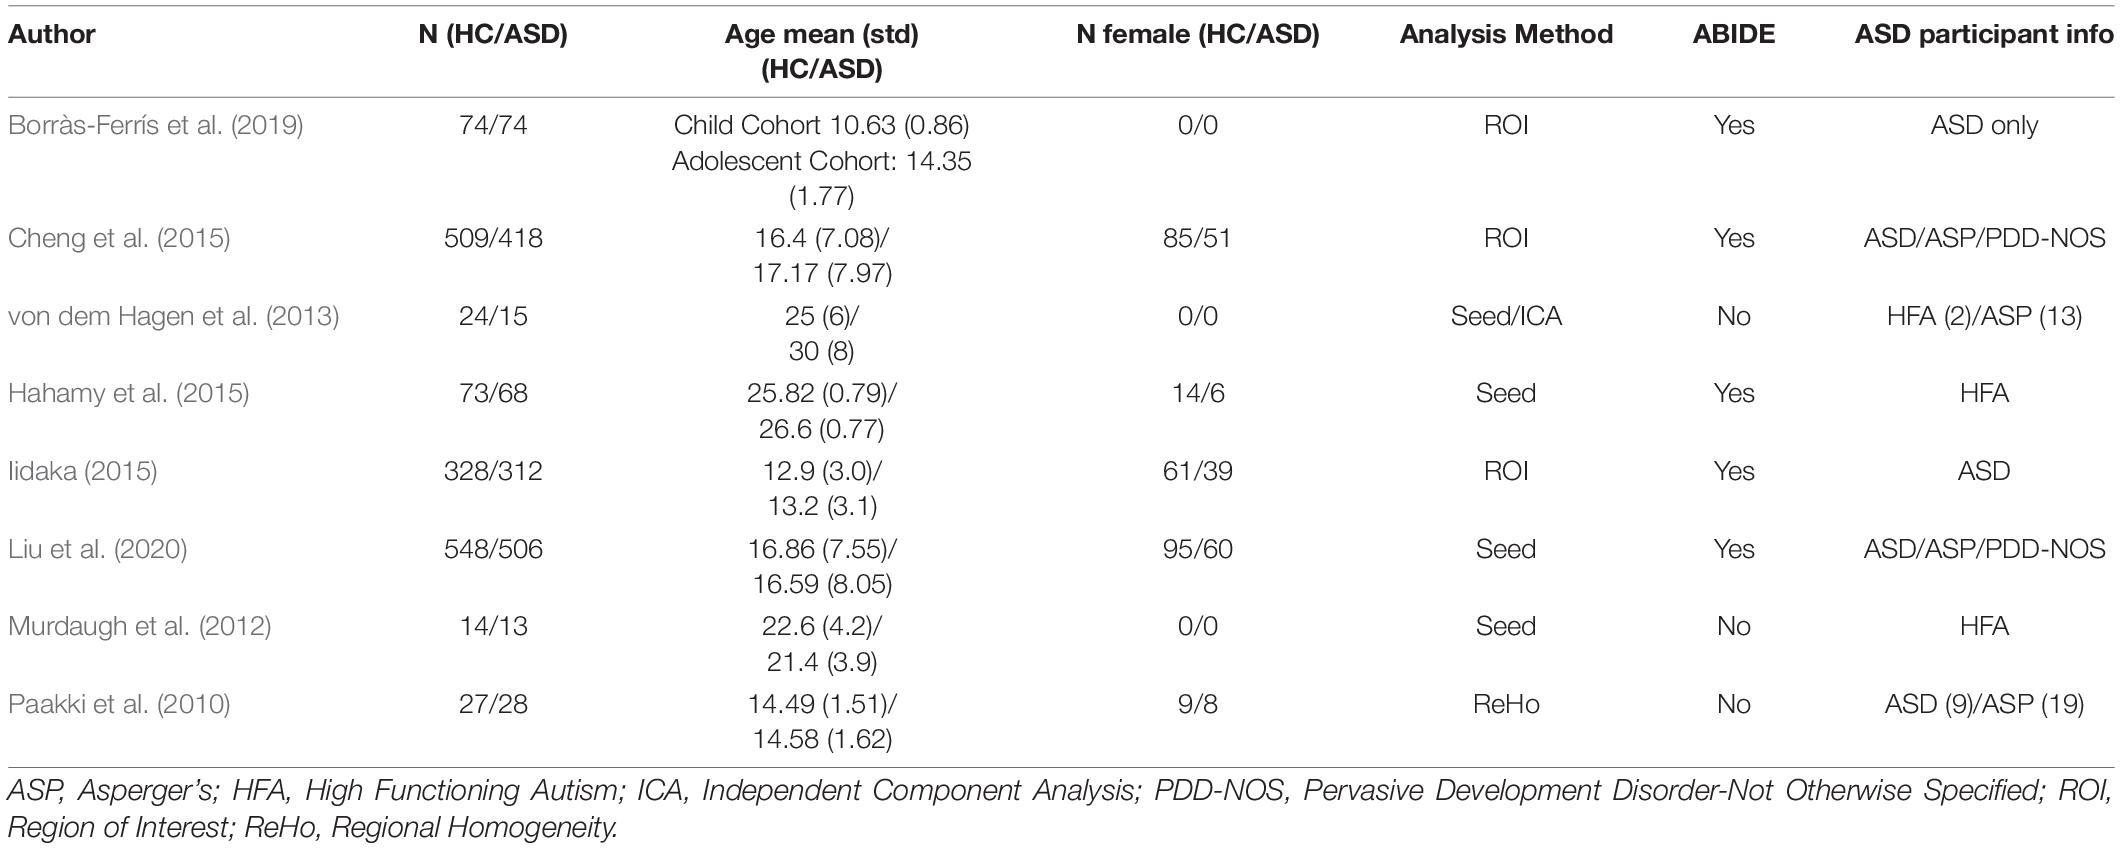
Table 8. Resting state fMRI studies for the secondary FC feature of ASD finding MPFC—MTG hypoconnectivity for ASD participants.
Effect Size
Schizophrenia
Hedge’s g was used to calculate the effect size of SZ vs. HCs for the primary and secondary FCs depicted in Figure 1 for (1) the original data, (2) GLM, (3) ComBat, and (4) SWD. For the primary FC feature, an ROI corresponding to the MPFC (center of mass MNI coordinates 1.4, 55.9, −7.2; volumes: 193), and ACC (center of mass MNI coordinates 1.6, 33.3, 24.3; volumes: 297) were used for the effect size calculation (Figure 1). For the secondary FC feature (within MPFC FC), two ROIs in the prefrontal cortex were used, MPFC (center of mass MNI coordinates 1.4, 55.9, −7.2; volumes: 193) and MPFC (center of mass MNI coordinates −9.1, 46.4, 40.6; volumes: 206) to calculate the effect size (Figure 1). For the primary FC feature, the effect size decreased compared to the original data for GLM (42.6% decrease), and ComBat (22.5% decrease), and increased for SWD (4.5% increase) (Table 9). For the secondary FC feature (within MPFC FC), the effect size decreased compared to the original data for GLM (40% decrease) and ComBat (23.9% decrease) and increased for SWD (7.9% increase) (Table 9).

Table 9. Effect size (Hedge’s g) comparison between SZ and HC for the primary FC feature (within MPFC), and for the secondary FC feature (MPFC and ACC) for the original FC data, GLM, ComBat, and SWD.
Autism Spectrum Disorder
Hedge’s g was used to calculate the effect size of ASD vs. HC for the primary and secondary FC features depicted in Figure 2 for (1) the original data, (2) GLM, (3) ComBat, and (4) SWD. For the primary FC feature, a seed region for the MPFC (center of mass MNI coordinates 10.7, 63.0, 10.0; volumes: 202) and PCC/precuneus (center of mass MNI coordinates: 1.5, −52.8, 14.8; volumes: 231) was used for effect size calculation (Figure 2). The effect size decreased compared to the original data for GLM (7.5% decrease) and increased for ComBat (5.1% decrease) and SWD (5.3% increase) for the primary FC feature (Table 10). For the secondary FC feature (frontal pole to temporal lobe FC), a seed region in the frontal pole (center of mass MNI coordinates 1.4, 55.9, −7.2; volumes: 193) and temporal lobe (center of mass MNI coordinates 55.1, −3.6, −25.4; volumes: 201) were used to calculate the effect size (Figure 2). The effect size decreased compared to the original data for GLM (11.4% decrease) and ComBat (1.3% decrease), and increased for SWD (2.9% increase) for the secondary FC feature (Table 10).

Table 10. Effect size (Hedge’s g) comparison between ASD and HCs for the primary FC feature (MPFC and PCC/precuneus), and for the secondary FC feature (MPFC and MTG) for the original FC data, GLM, ComBat, and the SWD method.
Discussion
Previously introduced methods to reduce fMRI site-effects associated with multi-site disorders result in the loss of effect size associated with psychiatric or neurodevelopmental disorders. The SWD method reduced site-effects in large sample sizes in multi-site databases with heterogeneous scan parameters, while improving the effect size of FC features associated with ASD and SZ compared to previous site-effect mitigation methods. This simple method is computationally inexpensive, is applicable to multi-site consortiums post-acquisition, and can be applied to other multi-site fMRI databases.
Preservation of Functional Networks Associated With Autism Spectrum Disorder and Schizophrenia
ComBat has been proposed to mitigate site-effects in small sizes, when using homogeneous scanning parameters, however it is unknown if it can accurately account for site-effects imposed by heterogeneous scan parameters and whether it can preserve the functional networks associated with psychiatric disorders (Yu et al., 2018). ComBat also centers the FC data of each site to an overall grand mean, thus resulting in harmonized FC features that lose their meaning (Yu et al., 2018; Da-Ano et al., 2020). In addition, GLM may diminish the measurable disease effects when applied to FC data (Yamashita et al., 2019). Therefore, a method is needed to reduce site-effects while maintaining the FC effects present in psychiatric and neurodevelopmental disorders.
Hypoconnectivity in SZ has been widely reported and is associated with symptoms of SZ (Cole et al., 2011; Mwansisya et al., 2013; Du et al., 2016; Fang et al., 2018), while DMN anterior-posterior connectivity in ASD has also been widely reported and has been found to be predictive of clinical symptoms of ASD (Assaf et al., 2010; Weng et al., 2010; Yerys et al., 2015). GLM resulted in a reduction of the effect size of these features by up to 42.6% and ComBat resulted in a reduction of the effect size of these features up to 23.9% in patients vs. control subjects. By de-meaning multi-site FC data, we removed site-effects and improved the effect size by 2.9–7.9% for patients vs. control subjects in the established FC features in both disorders compared to the original data.
The superior performance of SWD compared to GLM may be due to better generalizability and removal of overall site-effects in site de-meaning. In sites with unequal cohort sizes, GLM may introduce a diagnostic group bias. In addition, while diagnostic group is a covariate used in ComBat, the FC values are shifted to an overall mean, which can result in the loss of important diagnostic group information.
Limitations and Future Work
While there are advantages with SWD, there are several limitations as well. First, while there are many reports of hypoconnectivity in SZ and ASD, there is no conclusive ground truth fMRI neuromarker for either disorder. In addition, while we postulate that this method could be utilized on multiple multi-site databases with various other disorders, this has only been tested on two multi-site consortiums with two different disorders. Therefore, more extensive testing is needed.
Conclusion
We introduce a site-size demeaning method for reducing site effects in multi-site studies and compared it with two existing methods. The SWD method improved the effect size across these features in two multi-site disorder databases as compared to the original data and previously used harmonization methods (ComBat and GLM).
Data Availability Statement
Publicly available datasets were analyzed in this study. This data can be found here: Autism data is publicly available from ABIDE (http://fcon_1000.projects.nitrc.org/indi/abide/) and Schizophrenia fMRI data is publicly available from B-SNIP (https://nda.nih.gov/edit_collection.html?id=2274).
Ethics Statement
This study analyzed two public datasets whose participants were recruited under the ethical guidelines described in the original studies (Tamminga et al., 2013; Di Martino et al., 2014).
Author Contributions
AR: conceptualization, methodology, software, formal analysis, investigation, visualization, and writing—original draft. KL: methodology, conceptualization, supervision, and writing—review and editing. XH: conceptualization, supervision, and writing—review and editing. All authors contributed to the article and approved the submitted version.
Conflict of Interest
The authors declare that the research was conducted in the absence of any commercial or financial relationships that could be construed as a potential conflict of interest.
Publisher’s Note
All claims expressed in this article are solely those of the authors and do not necessarily represent those of their affiliated organizations, or those of the publisher, the editors and the reviewers. Any product that may be evaluated in this article, or claim that may be made by its manufacturer, is not guaranteed or endorsed by the publisher.
Acknowledgments
We thank the contributors to the Autism Brain Imaging Data Exchange, Preprocessed Connectomes Project, and Bipolar and Schizophrenia Network for Intermediate Phenotypes for access to subject data.
References
Abbott, A. E., Nair, A., Keown, C. L., Datko, M., Jahedi, A., Fishman, I., et al. (2016). Patterns of atypical functional connectivity and behavioral links in autism differ between default, salience, and executive networks. Cereb. Cortex 26, 4034–4045. doi: 10.1093/cercor/bhv191
Alonso-Solís, A., Vives-Gilabert, Y., Grasa, E., Portella, M. J., Rabella, M., Sauras, R. B., et al. (2015). Resting-state functional connectivity alterations in the default network of schizophrenia patients with persistent auditory verbal hallucinations. Schizophr. Res. 161, 261–268. doi: 10.1016/j.schres.2014.10.047
An, H. S., Moon, W.-J., Ryu, J.-K., Park, J. Y., Yun, W. S., Choi, J. W., et al. (2017). Inter-vender and test-retest reliabilities of resting-state functional magnetic resonance imaging: implications for multi-center imaging studies. Magn. Reson. Imaging 44, 125–130. doi: 10.1016/j.mri.2017.09.001
Anticevic, A., Savic, A., Repovs, G., Yang, G., McKay, D. R., Sprooten, E., et al. (2015). Ventral anterior cingulate connectivity distinguished nonpsychotic bipolar illness from psychotic bipolar disorder and schizophrenia. Schizophr. Bull. 41, 133–143. doi: 10.1093/schbul/sbu051
Assaf, M., Jagannathan, K., Calhoun, V. D., Miller, L., Stevens, M. C., Sahl, R., et al. (2010). Abnormal functional connectivity of default mode sub-networks in autism spectrum disorder patients. Neuroimage 53, 247–256. doi: 10.1016/j.neuroimage.2010.05.067
Badhwar, A., Collin-Verreault, Y., Orban, P., Urchs, S., Chouinard, I., Vogel, J., et al. (2019). Multivariate consistency of resting-state fMRI connectivity maps acquired on a single individual over 2.5 years, 13 sites and 3 vendors. bioRxiv [preprint]. doi: 10.1101/497743
Birn, R. M., Molloy, E. K., Patriat, R., Parker, T., Meier, T. B., Kirk, G. R., et al. (2013). The effect of scan length on the reliability of resting-state fMRI connectivity estimates. Neuroimage 83, 550–558. doi: 10.1016/j.neuroimage.2013.05.099
Bluhm, R. L., Miller, J., Lanius, R. A., Osuch, E. A., Boksman, K., Neufeld, R. W. J., et al. (2007). Spontaneous low-frequency fluctuations in the BOLD signal in schizophrenic patients: anomalies in the default network. Schizophr. Bull. 33, 1004–1012. doi: 10.1093/schbul/sbm052
Borràs-Ferrís, L., and Pérez-Ramírez, Ú, and Moratal, D. (2019). Link-level functional connectivity neuroalterations in autism spectrum disorder: a developmental resting-state FMRI study. Diagnostics (Basel) 9:32. doi: 10.3390/diagnostics9010032
Camchong, J., MacDonald, A. W. III, Bell, C., Mueller, B. A., and Lim, K. O. (2009). Altered functional and anatomical connectivity in schizophrenia. Schizophr. Bull. 37, 640–650.
Chen, X., Liu, C., He, H., Chang, X., Jiang, Y., Li, Y., et al. (2017). Transdiagnostic differences in the resting-state functional connectivity of the prefrontal cortex in depression and schizophrenia. J. Affect. Disord. 217, 118–124. doi: 10.1016/j.jad.2017.04.001
Cheng, W., Rolls, E. T., Gu, H., Zhang, J., and Feng, J. (2015). Autism: reduced connectivity between cortical areas involved in face expression, theory of mind, and the sense of self. Brain 138(Pt. 5), 1382–1393. doi: 10.1093/brain/awv051
Cherkassky, V. L., Kana, R. K., Keller, T. A., and Just, M. A. (2006). Functional connectivity in a baseline resting-state network in autism. Neuroreport 17, 1687–1690. doi: 10.1097/01.wnr.0000239956.45448.4c
Cole, M. W., Anticevic, A., Repovs, G., and Barch, D. (2011). Variable global dysconnectivity and individual differences in schizophrenia. Biol. Psychiatry 70, 43–50. doi: 10.1016/j.biopsych.2011.02.010
Craddock, R. C., James, G. A., Holtzheimer, P. E. III, Hu, X. P., and Mayberg, H. S. (2012). A whole brain fMRI atlas generated via spatially constrained spectral clustering. Hum. Brain Mapp. 33, 1914–1928. doi: 10.1002/hbm.21333
Da-Ano, R., Masson, I., Lucia, F., Doré, M., Robin, P., Alfieri, J., et al. (2020). Performance comparison of modified com bat for harmonization of radiomic features for multicenter studies. Sci. Rep. 10:10248. doi: 10.1038/s41598-020-66110-w
Di Martino, A., Yan, C. G., Li, Q., Denio, E., Castellanos, F. X., Alaerts, K., et al. (2014). The autism brain imaging data exchange: towards a large-scale evaluation of the intrinsic brain architecture in autism. Mol. Psychiatry 19, 659–667. doi: 10.1038/mp.2013.78
Doyle-Thomas, K. A. R., Lee, W., Foster, N. E. V., Tryfon, A., Ouimet, T., Hyde, K. L., et al. (2015). Atypical functional brain connectivity during rest in autism spectrum disorders. Ann. Neurol. 77, 866–876. doi: 10.1002/ana.24391
Du, Y., Pearlson, G. D., Yu, Q., He, H., Lin, D., Sui, J., et al. (2016). Interaction among subsystems within default mode network diminished in schizophrenia patients: a dynamic connectivity approach. Schizophr. Res. 170, 55–65. doi: 10.1016/j.schres.2015.11.021
Eilam-Stock, T., Xu, P., Cao, M., Gu, X., Van Dam, N. T., Anagnostou, E., et al. (2014). Abnormal autonomic and associated brain activities during rest in autism spectrum disorder. Brain 137(Pt. 1), 153–171. doi: 10.1093/brain/awt294
Falahpour, M., Thompson, W. K., Abbott, A. E., Jahedi, A., Mulvey, M. E., Datko, M., et al. (2016). Underconnected, but not broken? Dynamic functional connectivity mri shows underconnectivity in autism is linked to increased intra-individual variability across time. Brain Connect. 6, 403–414. doi: 10.1089/brain.2015.0389
Fang, X., Wang, Y., Cheng, L., Zhang, Y., Zhou, Y., Wu, S., et al. (2018). Prefrontal dysconnectivity links to working memory deficit in first-episode schizophrenia. Brain Imaging Behav. 12, 335–344. doi: 10.1007/s11682-017-9692-0
First, M. B., and Gibbon, M. (2004). “The structured clinical interview for DSM-IV axis I disorders (SCID-I) and the structured clinical interview for DSM-IV axis II disorders (SCID-II),” in Comprehensive Handbook of Psychological Assessment, Vol. 2, ed. M. J. Hilsenroth (Hoboken, NJ: John Wiley & Sons Inc.), 134–143.
Guo, W., Yao, D., Jiang, J., Su, Q., Zhang, Z., Zhang, J., et al. (2014). Abnormal default-mode network homogeneity in first-episode, drug-naive schizophrenia at rest. Prog. Neuropsychopharmacol. Biol. Psychiatry 49, 16–20. doi: 10.1016/j.pnpbp.2013.10.021
Hahamy, A., Behrmann, M., and Malach, R. (2015). The idiosyncratic brain: distortion of spontaneous connectivity patterns in autism spectrum disorder. Nat. Neurosci. 18, 302–309. doi: 10.1038/nn.3919
He, Z., Deng, W., Li, M., Chen, Z., Jiang, L., Wang, Q., et al. (2013). Aberrant intrinsic brain activity and cognitive deficit in first-episode treatment-naive patients with schizophrenia. Psychol. Med. 43, 769–780. doi: 10.1017/S0033291712001638
Hedges, L. V., and Olkin, I. (1985). Statistical Methods for Meta-Analysis. San Diego, CA: Academic.
Holt, D. J., Cassidy, B. S., Andrews-Hanna, J. R., Lee, S. M., Coombs, G., Goff, D. C., et al. (2011). An anterior-to-posterior shift in midline cortical activity in schizophrenia during self-reflection. Biol. Psychiatry 69, 415–423. doi: 10.1016/j.biopsych.2010.10.003
Hoptman, M. J., Antonius, D., Mauro, C. J., Parker, E. M., and Javitt, D. C. (2014). Cortical thinning, functional connectivity, and mood-related impulsivity in schizophrenia: relationship to aggressive attitudes and behavior. Am. J. Psychiatry 171, 939–948. doi: 10.1176/appi.ajp.2014.13111553
Huang, X.-Q., Lui, S., Deng, W., Chan, R. C. K., Wu, Q.-Z., Jiang, L.-J., et al. (2010). Localization of cerebral functional deficits in treatment-naive, first-episode schizophrenia using resting-state fMRI. Neuroimage 49, 2901–2906. doi: 10.1016/j.neuroimage.2009.11.072
Hull, J. V., Dokovna, L. B., Jacokes, Z. J., Torgerson, C. M., Irimia, A., and Van Horn, J. D. (2016). Resting-state functional connectivity in autism spectrum disorders: a review. Front. Psychiatry 7:205. doi: 10.3389/fpsyt.2016.00205
Iidaka, T. (2015). Resting state functional magnetic resonance imaging and neural network classified autism and control. Cortex 63, 55–67. doi: 10.1016/j.cortex.2014.08.011
Jang, J. H., Jung, W. H., Choi, J.-S., Choi, C.-H., Kang, D.-H., Shin, N. Y., et al. (2011). Reduced prefrontal functional connectivity in the default mode network is related to greater psychopathology in subjects with high genetic loading for schizophrenia. Schizophr. Res. 127, 58–65. doi: 10.1016/j.schres.2010.12.022
Johnson, W. E., Li, C., and Rabinovic, A. (2007). Adjusting batch effects in microarray expression data using empirical bayes methods. Biostatistics 8, 118–127. doi: 10.1093/biostatistics/kxj037
Jones, T. B., Bandettini, P. A., Kenworthy, L., Case, L. K., Milleville, S. C., Martin, A., et al. (2010). Sources of group differences in functional connectivity: an investigation applied to autism spectrum disorder. Neuroimage 49, 401–414. doi: 10.1016/j.neuroimage.2009.07.051
Joshi, G., Arnold Anteraper, S., Patil, K. R., Semwal, M., Goldin, R. L., Furtak, S. L., et al. (2017). Integration and segregation of default mode network resting-state functional connectivity in transition-age males with high-functioning autism spectrum disorder: a proof-of-concept study. Brain Connect. 7, 558–573. doi: 10.1089/brain.2016.0483
Jung, M., Kosaka, H., Saito, D. N., Ishitobi, M., Morita, T., Inohara, K., et al. (2014). Default mode network in young male adults with autism spectrum disorder: relationship with autism spectrum traits. Mol. Autism 5:35. doi: 10.1186/2040-2392-5-35
Just, M. A., Keller, T. A., Malave, V. L., Kana, R. K., and Varma, S. (2012). Autism as a neural systems disorder: a theory of frontal-posterior underconnectivity. Neurosci. Biobehav. Rev. 36, 1292–1313. doi: 10.1016/j.neubiorev.2012.02.007
Kyriakopoulos, M., Dima, D., Roiser, J. P., Corrigall, R., Barker, G. J., and Frangou, S. (2012). Abnormal functional activation and connectivity in the working memory network in early-onset schizophrenia. J. Am. Acad. Child Adolesc. Psychiatry 51, 911–920.e912. doi: 10.1016/j.jaac.2012.06.020
Lee, J. M., Kyeong, S., Kim, E., and Cheon, K.-A. (2016). Abnormalities of inter- and intra-hemispheric functional connectivity in autism spectrum disorders: a study using the autism brain imaging data exchange database. Front. Neurosci. 10:191. doi: 10.3389/fnins.2016.00191
Li, S., Hu, N., Zhang, W., Tao, B., Dai, J., Gong, Y., et al. (2019). Dysconnectivity of multiple brain networks in schizophrenia: a meta-analysis of resting-state functional connectivity. Front. Psychiatry 10:482. doi: 10.3389/fpsyt.2019.00482
Liu, Y., Xu, L., Li, J., Yu, J., and Yu, X. (2020). Attentional connectivity-based prediction of autism using heterogeneous rs-fMRI data from CC200 atlas. Exp. Neurobiol. 29, 27–37. doi: 10.5607/en.2020.29.1.27
Long, Z., Duan, X., Mantini, D., and Chen, H. (2016). Alteration of functional connectivity in autism spectrum disorder: effect of age and anatomical distance. Sci. Rep. 6:26527. doi: 10.1038/srep26527
Lui, S., Li, T., Deng, W., Jiang, L., Wu, Q., Tang, H., et al. (2010). Short-term effects of antipsychotic treatment on cerebral function in drug-naive first-episode schizophrenia revealed by “resting state” functional magnetic resonance imaging. Arch. Gen. Psychiatry 67, 783–792. doi: 10.1001/archgenpsychiatry.2010.84
Lui, S., Yao, L., Xiao, Y., Keedy, S. K., Reilly, J. L., Keefe, R. S., et al. (2015). Resting-state brain function in schizophrenia and psychotic bipolar probands and their first-degree relatives. Psychol. Med. 45, 97–108. doi: 10.1017/S003329171400110X
Maximo, J. O., Keown, C. L., Nair, A., and Müller, R.-A. (2013). Approaches to local connectivity in autism using resting state functional connectivity MRI. Front. Hum. Neurosci. 7:605. doi: 10.3389/fnhum.2013.00605
Meda, S. A., Gill, A., Stevens, M. C., Lorenzoni, R. P., Glahn, D. C., Calhoun, V. D., et al. (2012). Differences in resting-state functional magnetic resonance imaging functional network connectivity between schizophrenia and psychotic bipolar probands and their unaffected first-degree relatives. Biol. Psychiatry 71, 881–889. doi: 10.1016/j.biopsych.2012.01.025
Meda, S. A., Ruaño, G., Windemuth, A., O’Neil, K., Berwise, C., Dunn, S. M., et al. (2014). Multivariate analysis reveals genetic associations of the resting default mode network in psychotic bipolar disorder and schizophrenia. Proc. Natl. Acad. Sci. U.S.A. 111, E2066–E2075. doi: 10.1073/pnas.1313093111
Mingoia, G., Wagner, G., Langbein, K., Maitra, R., Smesny, S., Dietzek, M., et al. (2012). Default mode network activity in schizophrenia studied at resting state using probabilistic ICA. Schizophr. Res. 138, 143–149. doi: 10.1016/j.schres.2012.01.036
Monk, C. S., Peltier, S. J., Wiggins, J. L., Weng, S.-J., Carrasco, M., Risi, S., et al. (2009). Abnormalities of intrinsic functional connectivity in autism spectrum disorders. Neuroimage 47, 764–772. doi: 10.1016/j.neuroimage.2009.04.069
Murdaugh, D. L., Shinkareva, S. V., Deshpande, H. R., Wang, J., Pennick, M. R., and Kana, R. K. (2012). Differential deactivation during mentalizing and classification of autism based on default mode network connectivity. PLoS One 7:e50064. doi: 10.1371/journal.pone.0050064
Mwansisya, T. E., Wang, Z., Tao, H., Zhang, H., Hu, A., Guo, S., et al. (2013). The diminished interhemispheric connectivity correlates with negative symptoms and cognitive impairment in first-episode schizophrenia. Schizophr. Res. 150, 144–150. doi: 10.1016/j.schres.2013.07.018
Newton, A. T., Rogers, B. P., Gore, J. C., and Morgan, V. L. (2012). Improving measurement of functional connectivity through decreasing partial volume effects at 7 T. Neuroimage 59, 2511–2517. doi: 10.1016/j.neuroimage.2011.08.096
Ongür, D., Lundy, M., Greenhouse, I., Shinn, A. K., Menon, V., Cohen, B. M., et al. (2010). Default mode network abnormalities in bipolar disorder and schizophrenia. Psychiatry Res. 183, 59–68. doi: 10.1016/j.pscychresns.2010.04.008
Paakki, J.-J., Rahko, J., Long, X., Moilanen, I., Tervonen, O., Nikkinen, J., et al. (2010). Alterations in regional homogeneity of resting-state brain activity in autism spectrum disorders. Brain Res. 1321, 169–179. doi: 10.1016/j.brainres.2009.12.081
Penner, J., Ford, K. A., Taylor, R., Schaefer, B., Théberge, J., Neufeld, R. W. J., et al. (2016). Medial prefrontal and anterior insular connectivity in early schizophrenia and major depressive disorder: a resting functional MRI evaluation of large-scale brain network models. Front. Hum. Neurosci. 10:132. doi: 10.3389/fnhum.2016.00132
Peter, F., Andrea, S., and Nancy, A. (2018). Forty years of structural brain imaging in mental disorders: is it clinically useful or not? Dialogues Clin. Neurosci. 20, 179–186.
Rane, S., Mason, E., Hussey, E., Gore, J., Ally, B. A., and Donahue, M. J. (2014). The effect of echo time and post-processing procedure on blood oxygenation level-dependent (BOLD) functional connectivity analysis. Neuroimage 95, 39–47. doi: 10.1016/j.neuroimage.2014.03.055
Rao, A., and Joao, M. (2017). Predictive modelling using neuroimaging data in the presence of confounds. Neuroimage 150, 23–49.
Su, T.-W., Lan, T.-H., Hsu, T.-W., Biswal, B. B., Tsai, P.-J., Lin, W.-C., et al. (2013). Reduced neuro-integration from the dorsolateral prefrontal cortex to the whole brain and executive dysfunction in schizophrenia patients and their relatives. Schizophr. Res. 148, 50–58. doi: 10.1016/j.schres.2013.05.005
Tamminga, C. A., Ivleva, E. I., Keshavan, M. S., Pearlson, G. D., Clementz, B. A., Witte, B., et al. (2013). Clinical phenotypes of psychosis in the bipolar-schizophrenia network on intermediate phenotypes (B-SNIP). Am. J. Psychiatry 170, 1263–1274. doi: 10.1176/appi.ajp.2013.12101339
Van Horn, J. D., and Toga, A. W. (2009). Multisite neuroimaging trials. Curr. Opin. Neurol. 22, 370–378. doi: 10.1097/WCO.0b013e32832d92de
von dem Hagen, E. A. H., Stoyanova, R. S., Baron-Cohen, S., and Calder, A. J. (2013). Reduced functional connectivity within and between ‘social’ resting state networks in autism spectrum conditions. Soc. Cogn. Affect. Neurosci. 8, 694–701. doi: 10.1093/scan/nss053
Washington, S. D., Gordon, E. M., Brar, J., Warburton, S., Sawyer, A. T., Wolfe, A., et al. (2014). Dysmaturation of the default mode network in autism. Hum. Brain Mapp. 35, 1284–1296. doi: 10.1002/hbm.22252
Weng, S.-J., Wiggins, J. L., Peltier, S. J., Carrasco, M., Risi, S., Lord, C., et al. (2010). Alterations of resting state functional connectivity in the default network in adolescents with autism spectrum disorders. Brain Res. 1313, 202–214. doi: 10.1016/j.brainres.2009.11.057
Yamashita, A., Yahata, N., Itahashi, T., Lisi, G., Yamada, T., Ichikawa, N., et al. (2019). Harmonization of resting-state functional MRI data across multiple imaging sites via the separation of site differences into sampling bias and measurement bias. PLoS Biol. 17:e3000042. doi: 10.1371/journal.pbio.3000042
Yerys, B. E., Gordon, E. M., Abrams, D. N., Satterthwaite, T. D., Weinblatt, R., Jankowski, K. F., et al. (2015). Default mode network segregation and social deficits in autism spectrum disorder: evidence from non-medicated children. NeuroImage Clin. 9, 223–232. doi: 10.1016/j.nicl.2015.07.018
Yu, M., Linn, K. A., Cook, P. A., Phillips, M. L., McInnis, M., Fava, M., et al. (2018). Statistical harmonization corrects site effects in functional connectivity measurements from multi-site fMRI data. Hum. Brain Mapp. 39, 4213–4227. doi: 10.1002/hbm.24241
Zhou, Y., Ma, X., Wang, D., Qin, W., Zhu, J., Zhuo, C., et al. (2015). The selective impairment of resting-state functional connectivity of the lateral subregion of the frontal pole in schizophrenia. PLoS One 10:e0119176. doi: 10.1371/journal.pone.0119176
Keywords: autism spectrum disorder, effect size, functional connectivity, multi-site, resting-state functional MRI, Schizophrenia
Citation: Reardon AM, Li K and Hu XP (2021) Improving Between-Group Effect Size for Multi-Site Functional Connectivity Data via Site-Wise De-Meaning. Front. Comput. Neurosci. 15:762781. doi: 10.3389/fncom.2021.762781
Received: 22 August 2021; Accepted: 04 November 2021;
Published: 02 December 2021.
Edited by:
Arpan Banerjee, National Brain Research Centre (NBRC), IndiaReviewed by:
Yudan Ren, Northwest University, ChinaXiang Li, Massachusetts General Hospital and Harvard Medical School, United States
Copyright © 2021 Reardon, Li and Hu. This is an open-access article distributed under the terms of the Creative Commons Attribution License (CC BY). The use, distribution or reproduction in other forums is permitted, provided the original author(s) and the copyright owner(s) are credited and that the original publication in this journal is cited, in accordance with accepted academic practice. No use, distribution or reproduction is permitted which does not comply with these terms.
*Correspondence: Kaiming Li, kaimli@ucr.edu; Xiaoping P. Hu, xhu@engr.ucr.edu