Simulation of cholinergic and noradrenergic modulation of behavior in uncertain environments
- 1Department of Cognitive Sciences, University of California, Irvine, CA, USA
- 2Department of Cognitive Sciences, University of California, San Diego, CA, USA
- 3Department of Computer Sciences, University of California, Irvine, CA, USA
Attention is a complex neurobiological process that involves rapidly and flexibly balancing sensory input and goal-directed predictions in response to environmental changes. The cholinergic and noradrenergic systems, which have been proposed to respond to expected and unexpected environmental uncertainty, respectively, play an important role in attention by differentially modulating activity in a multitude of cortical targets. Here we develop a model of an attention task that involves expected and unexpected uncertainty. The cholinergic and noradrenergic systems track this uncertainty and, in turn, influence cortical processing in five different, experimentally verified ways: (1) nicotinic enhancement of thalamocortical input, (2) muscarinic regulation of corticocortical feedback, (3) noradrenergic mediation of a network reset, (4) locus coeruleus (LC) activation of the basal forebrain (BF), and (5) cholinergic and noradrenergic balance between sensory input and frontal cortex predictions. Our results shed light on how the noradrenergic and cholinergic systems interact with each other and a distributed set of neural areas, and how this could lead to behavioral adaptation in the face of uncertainty.
Introduction
Biological organisms rapidly assess threats, are highly attentive to unusual events in the environment, and are masterful at tracking rewards. Because this adaptation of attentional resources is so critical for survival, all vertebrates have sub-cortical structures, which comprise the neuromodulatory systems, to regulate fundamental behavior, and to influence decision-making in response to most impending environmental events (Krichmar, 2008). Two of these neuromodulatory systems, the cholinergic and noradrenergic, are thought to play important and distinct roles in attention (Yu and Dayan, 2005). Expected uncertainty, the known degree of unreliability of predictive relationships in the environment, is proposed to drive activity within the cholinergic system. Cholinergic neurons that lie within the basal forebrain (BF) project to numerous regions including the cortex, amygdala, and hippocampus. Cholinergic neurons appear to modulate attention and optimize information processing (Baxter and Chiba, 1999). Accordingly, removal of cholinergic projections to the parietal and frontal cortex impairs the ability to increase attentional effort (Bucci et al., 1998). Unexpected uncertainty, large changes in the environment that violate prior expectations, is proposed to drive activity within the noradrenergic system. Noradrenergic neurons that reside in the locus coeruleus (LC) project to the entire cortical mantle and many of the primary subcortical brain regions (including the BF) with the exception of the basal ganglia (Berridge and Waterhouse, 2003). LC neurons are sensitive to novel and salient objects in the environment (Vankov et al., 1995) and task relevant stimuli that cannot be fully predicted, such as recognizing an unreliable conditioned or oddball stimulus (Aston-Jones et al., 1994). These systems modulate activity in brain areas to properly allocate attention to stimuli in the environment necessary for adequate learning to occur and fluid behavior to be maintained.
Recent studies have suggested that the BF and acetylcholine play an important attentional role in modulating bottom-up (sensory) and top-down (knowledge-driven) processes (Sarter et al., 2001, 2005). Specifically, the cholinergic system has been shown to enhance information processing in primary visual cortex (VC) by driving thalamocortical input (Disney et al., 2007) and modulating local recurrent cortical activity (Zinke et al., 2006; Herrero et al., 2008; Goard and Dan, 2009). Acetylcholine levels in the prefrontal cortex (PFC) also show task-related increases when attentional effort needs to be maintained (Dalley et al., 2001). Specifically, studies have shown that cholinergic inputs to PFC are important for cue detection and attention (Parikh and Sarter, 2008; Howe et al., 2010). In turn, PFC regulates cholinergic release in the posterior parietal cortex (PPC), which has recently been shown to be important for cue detection (Broussard et al., 2009), resulting in PFC control of attention (Nelson et al., 2005). Taken together, the BF may be balancing the impact of stimulus expectations (via projections from the PFC to the PPC) on sensory input to the VC according to the ongoing uncertainty and statistics of the environment.
The LC, on the other hand, may carry a signal to reset prior expectations, such that a new model of environmental context can be constructed. Phasic noradrenergic signals have a cognitive function for increasing signal detection and assisting in the decision-making processes (Aston-Jones and Cohen, 2005). Moreover, the noradrenergic signal is prevalent in cortical regions when there are contextual changes that require a shift in attention (Dalley et al., 2001). It has been proposed that the LC functions as a “network reset,” which could drive network reorganization and adaptation to environmental change (Bouret and Sara, 2005; Sara, 2009). This “reset” signal may be a means to discard prior expectations when these expectations are violated.
We present an attention model in which a simulated agent must cope with the expected and unexpected uncertainties of stimulus distributions. The agent must learn the variability of an underlying stimulus distribution, and must respond appropriately when the distribution changes. Specifically, the agent is placed in an environment, where it must orient itself based on prior expectations, to detect briefly flashed stimuli. By varying the mean and standard deviation of stimuli locations, the agent is subjected to changes in expected and unexpected uncertainty, respectively. The model includes a BF, LC, VC, PFC, and PPC. The cholinergic and noradrenergic systems influence their cortical targets in five different, experimentally verified ways, including: (1) nicotinic enhancement of thalamocortical input (Disney et al., 2007), (2) muscarinic suppression of intracortical activity (Hasselmo and McGaughy, 2004), (3) facilitation of network reset by the noradrenergic system (Bouret and Sara, 2005), (4) LC activation of the BF (Sarter et al., 2001), and (5) the dynamic regulation of visual and PFC information into parietal cortex by the cholinergic and noradrenergic systems (Sarter et al., 2005; Yu and Dayan, 2005). In accordance with Yu and Dayan (2005), our model introduces a biologically plausible mechanistic explanation of how the BF and LC track these two different types of uncertainty.
Methods
We investigated the roles of the BF and LC in allocating attention using the neural simulation described below. The simulation guided the behavior of an artificial agent during an attention task that was originally developed for rodents to dissociate expected uncertainty from unexpected uncertainty during attention (Nitz et al., 2011). The simulation was developed using MATLAB and run on a Linux workstation.
As suggested by Yu and Dayan (2005), the cholinergic system in our model responds to the amount of expected uncertainty in the environment. Expected uncertainty is defined as the known unreliability of a predictive cue. In the simulations described below, the variability of cue locations within a stimulus distribution corresponds to the expected uncertainty. The noradrenergic system, on the other hand, responds to unexpected uncertainty in the environment. Unexpected uncertainty may be thought of as a “surprise” or large change occurring in your environment. In the simulations described below, a new stimulus distribution, which occurs due to changing the mean or a large change in the standard deviation, corresponds to unexpected uncertainty.
Experiment Design
The simulated experiment was derived from a behavioral task currently being used in rat behavioral experiments, which generalizes probabilistic cueing and attention shifting tasks in order to incorporate both expected and unexpected uncertainty (Nitz et al., 2011). A trial began by placing a subject in the center of a ring of 36 lights (see Figure 1). While the subject was in the center of the ring, a light was briefly flashed. If the subject detected the light, it went to the location on the wall where it thought the light flashed, performed a nose poke and returned to the center of the ring. If the subject poked its nose in the hole where the light was flashed it received a reward when it returned to the center, otherwise no reward was received.
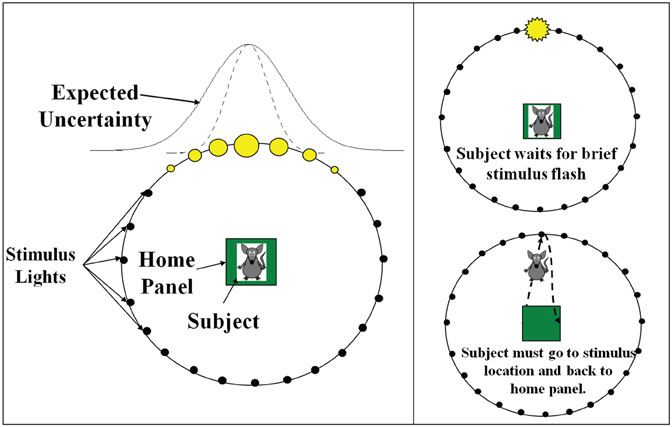
Figure 1. Experimental set-up of the behavioral task. The experiment is modeled after a rodent attention task that dissociates expected uncertainty from unexpected uncertainty. A trial begins by placing a subject in the center of a ring of 36 lights. While the subject is in the center of the ring, a light is briefly flashed. If the subject detects the light, it goes to the location where it thought the light flashed, performs a nose poke, and returns to the center of the ring. If the subject poked its nose in the hole where the light was flashed it receives a reward when it returns to the center, otherwise it does not. The flashed light positions follow a Gaussian distribution whose standard deviation signifies the expected uncertainty. This is indicated in the figure by the filled in yellow circles, which signify the probability of a light flashing in a particular location (a larger circle indicates a higher probability of flashing). After a set number of trials a new Gaussian distribution of lights is presented and this shift of the mean and standard deviation signifies the unexpected uncertainty.
The flashed light positions followed a Gaussian distribution whose mean and standard deviation were set and manipulated by the experimenter. Expected and unexpected uncertainties in the environment resulted from manipulating the standard deviation and mean of these distributions, respectively. Specifically, given a mean light location and standard deviation, the subject had to adjust its expectations of where the light was going to be flashed. This was equivalent to adapting to the expected uncertainty in the environment and was based on the variation (i.e., standard deviation) of light positions. After a set number of trials, the mean light location was changed, introducing unexpected uncertainty or novelty into the environment and forcing an attentional shift. The subject had to readjust its expectations accordingly.
Figure 1 shows the setup for the simulated behavioral task. Like the behavioral experiment described above, each trial started off with a light location drawn from a Gaussian distribution of a given mean light location (μ) and standard deviation (σ), given in degrees. Every 10 seconds a random new light location was drawn from the Gaussian distribution defined by μ and σ. The standard deviation in the light location accounts for the expected uncertainty in the environment and the change in the mean light location (every 1800 seconds) accounted for the unexpected uncertainty. For the first 1800 seconds, the Gaussian distribution from which each light position was drawn had μ = 30 and σ = 1 degree (low expected uncertainty). From 1800 to 3600 seconds, a new distribution with μ = 15 and σ = 40 degrees (high expected uncertainty) was chosen, introducing unexpected uncertainty (novelty) into the environment. At 3600 seconds, we set μ = 5 and σ = 10 degrees (medium expected uncertainty). At 5400 seconds, we set μ = 20 and σ = 1 degree (low expected uncertainty). Note that the units for standard deviation are in degrees. Thus, a standard deviation of 40 would mean the Gaussian distribution spans approximately four lights to the left and four lights to the right of the mean.
Neural Architecture
The architecture of the simulation, which was modeled after a sustained attention network suggested by (Sarter et al., 2001), consisted of six different neural areas (Figure 2) including: visual input, VC, PFC, PPC, BF, and LC. The simulated visual input, VC, PFC, PPC, and BF areas all contained 36 neurons (each representing a light position), except for LC which had two neurons. The number of neurons in each group is not meant to be proportional to the actual size of these areas. The number of neurons in the VC, PFC, and PPC were chosen to match the experimental setup, which contained 36 lights. The LC and BF were chosen to have two and 36 neurons, respectively, because the LC is a small nucleus in the brainstem and the BF has been shown to have topographic connections with the PFC (Zaborszky, 2002).
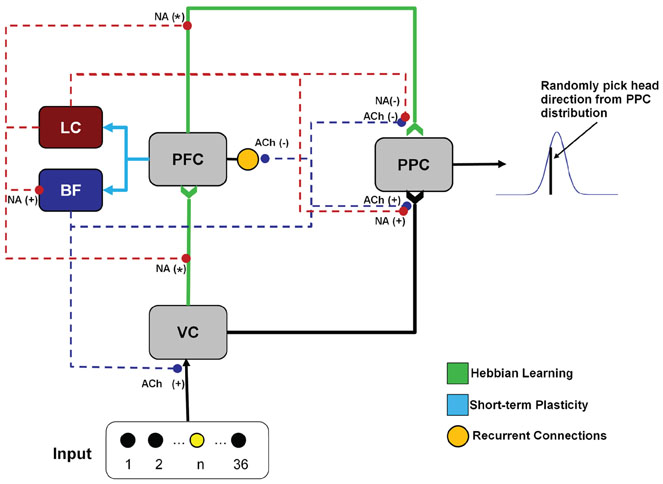
Figure 2. Neural architecture. The neural network contains a total of six groups (two neuromodulatory, three cortical, one input). The visual input group drives activity in the VC (visual cortex). VC and PFC (prefrontal cortex) provides input to the PPC. The noradrenergic system, originating in the LC (locus coeruleus), enhances the decay of the synaptic connections (“forgetting”) between VC and PFC, and PFC and PPC (posterior parietal cortex), as indicated by NA(*) in the figure. The noradrenergic system also enhances the gain in the BF (basal forebrain) and the input to the PPC from VC [indicated by the NA(+)] and suppresses input to the PPC from the PFC [indicated by the NA(−)]. The cholinergic system, originating in the BF, enhances input to VC and PPC [indicated by the ACh(+)] and suppresses recurrent activity in the PFC and input to the PPC from the PFC [indicated by the ACh(−)].
Neuronal Dynamics
The neuronal dynamics of this model were governed by standard equations used in mean firing rate models and were modified to account for neuromodulation. The simulation time step, given by t in the equations below, represented 100 milliseconds.
The neurons in this simulation were modeled using mean firing rate equations given by:
where Ii(t) is the synaptic input to neuron i at time t (in 100 milliseconds steps), and gi is the neuronal gain. gi = {12.0, 9.0, 12.0, 20.0, 30.0} for the LC, BF, PPC, PFC, VC, respectively. In this simulation, nmlc corresponds to the concentration level of noradrenaline and is only applied to neurons in the BF (see Neuromodulation section below). This was included because it has been shown that there are strong projections from LC to BF (Zaborszky and Duque, 2003), implying LC may be driving activity in the BF under situations of high uncertainty.
Visual input neurons, unlike the rest of the neurons in the system, were not governed by the mean firing rate equations above. Instead, their activity was described by Equation 2.
where i was the index of the visual input neuron and τ is the time constant, which was set to 0.6 seconds, and nmbf corresponds to the concentration level of acetylcholine.
All input neurons were initially set to 0. When a light was “flashed” the neuron coding for that light location was set to 1, and then decayed to 0 exponentially. The response of the input neuron could be enhanced by the cholinergic system as shown in Equation 2. Thus, when acetylcholine levels are low (close to 0) the input activity will maximally decay at a rate governed by τ. As acetylcholine levels increase, the rate of decay decreases proportionally, so that when acetylcholine levels are high (close to 1), activity in the input layer will not decay and the activity in VC, PFC, and PPC will be amplified. This was implemented to simulate the cholinergic enhancement of thalamocortical inputs to VC and PFC. Experimental data indicates this enhancement results in an increase of presynaptic neurotransmitter release from either the binding of acetylcholine to presynaptic nicotinic acetylcholine receptors on thalamocortical efferents (Disney et al., 2007) or the disinhibition of thalamic relay circuits by the BF (Goard and Dan, 2009).
Neuromodulation
The neuromodulator concentration levels, [ACh] and [NA], were functions of the BF and LC activity, respectively. The more active these neural areas, the higher the modeled concentration of the respective neuromodulatory, and the more it would influence the network. The equation governing the change in neuromodulator level was given by:
where I = {BF, LC}. ωi(t) was a step function that is increased by 0.1 and 1.0 for population spikes of activity in the BF and LC, respectively. Otherwise, nm decays exponentially with time constants of τ = 1.25 seconds for the BF and τ = 10 seconds for the LC. Concentrations for both [ACh] and [NA] were initially set to 0.0, and could range from 0 to 1. ACh and NA concentrations can vary widely in awake, behaving rodents and the range of values given by Equation 3 model this variation.
Synaptic Input and Plasticity
For VC, LC, and BF neurons, the synaptic input was a function of the presynaptic neural activity and the weight of the synapse connecting pre and postsynaptic neuron. The equation for synaptic input in these neural areas was given as:
where wij was the weight from neuron j to neuron i, and sj was the firing rate of the presynaptic neuron, j.
For PPC, the neuromodulatory concentration level of acetylcholine and noradrenaline gated synaptic input into PPC neurons. The equation for synaptic input into the PPC was given as:
nmbf+lc = [ACh] + [NA] when sj was a VC neuron and nmbf+lc = 1 − ([ACh] + [NA]) when sj was a PFC neuron. This implied that when [ACh] and [NA] were low, input from the PFC was gated into the PPC, whereas when [ACh] and [NA] were high, input from VC was gated into the PPC. This was implemented because it has been suggested (Sarter et al., 2001; Yu and Dayan, 2005) that the ACh and NA system may be involved in balancing the extent by which goal-based information from PFC and sensory input from VC effect behavior and cognition. Specifically, when the BF and LC are very active ([ACh], [NA] are high), organisms tend to rely on sensory input, whereas when the BF and LC are less active ([ACh], [NA] are low), organisms tend to rely on expectations from higher-order cognitive areas such as the PFC.
The synaptic input into the PFC, which had excitatory-excitatory and inhibitory-excitatory recurrent connections, was given by the following equation:
where nmbf was related to the simulated neuromodulatory level of acetylcholine, Weeik was the weight of the excitatory-excitatory connection from neuron k in the PFC to neuron i in the PFC, and Wieik was the weight of the inhibitory-excitatory connection from neuron k to neuron i in the PFC. The neuromodulatory term, nmbf, was set equal to 1–[ACh]. In this case, the amount of inhibition was inversely related to the level of ACh, increasing the recurrent activity in the PFC under conditions when cholinergic levels were low (i.e., low uncertainty) and decreasing recurrent activity when cholinergic levels were high (high uncertainty). Experimental evidence suggests that acetylcholine activation of muscarinic acetylcholine receptors could influence recurrent cortical feedback and information processing (Hasselmo and McGaughy, 2004; Thiele, 2009). It has also been suggested that the cholinergic system may be important for controlling the balance between excitation and inhibition in local cortical circuits (Vogels and Abbott, 2009).
As explained below, our model incorporates Hebbian and short-term depressive learning mechanisms. We chose the depressive learning mechanism because it resulted in attenuation of the response of postsynaptic layer over time as a result of repeated activation of the same presynaptic neurons. Hebbian learning was used so that the standard deviation of light distributions may be learned. For our model, these mechanisms seemed most appropriate. However, other types of plasticity could produce similar results.
Connections from VC to PFC and PFC to PPC were subject to synaptic plasticity in the form of Hebbian learning. The weights between these areas were updated as a function of the pre and postsynaptic activity and the level of NA. The weight update rule is given as:
where ε is the rate at which the weights decay back to their original value [i.e., wij(0)], nmlc(t − 1) is the concentration of noradrenaline, α is the learning rate, si(t − 1) is the postsynaptic activity, and sj(t − 1) is the presynaptic activity. For the connections from VC to PFC, α = 0.1 and ε = 0.005. For the connections from PFC to PPC, α = 0.01 and ε = 0.0005. Competitive learning between these synaptic connections occurred via weight normalization. Higher concentrations of noradrenaline cause weights to decay back to their original values faster. This was implemented to account for experimental findings that the noradrenergic system is important for adapting to novelty in the environment and may cause a neuronal network to reset its weights (Bouret and Sara, 2005).
We made the assumption that the mechanism for shaping BF responses to expected uncertainty and LC responses to unexpected uncertainty were governed by plastic connections between the PFC and BF, and the PFC and LC. Specifically, connections from PFC to BF and PFC to LC were subject to fast and slow presynaptic depression, respectively (Markram and Tsodyks, 1996). This was implemented in the model through the following weight update rule:

where ε was the decay rate, dj is the depression rate and sj(t − 1) was the firing rate of the presynaptic neuron j. The connections from PFC to LC had a decay rate and depression rate of ε = 0.001 and dj = 0.01, respectively. The connections from PFC to BF had a decay rate and depression rate of ε = 0.02 and dj = 0.2, respectively. The slower rate of depression in the PFC to LC connections caused LC neurons to respond to coarse changes in presynaptic activity, which corresponded to novelty (unexpected uncertainty) in the environment. On the other hand, the increased rate of depression in the PFC to BF connections caused the BF firing rate to respond quickly to subtle changes in the environment (expected uncertainty). Competitive learning between these synaptic connections also occurred via weight normalization.
Connections from the visual input to VC, VC to PPC, VC to PFC, and PFC to PPC were normalized Gaussian distributions with a standard deviation of 1 neuron resulting in an initial weight range from 0.0 to 0.4. The connections from PFC to BF and PFC to LC were connected all-to-all with initial weights set equal to 0.03. Recurrent local excitatory-excitatory and long-range inhibitory-excitatory connections were present in the PFC. The recurrent excitatory-excitatory weights were equal to 0.3 and connections existed between the neuron itself and its two nearest neighbors. Long-range inhibitory-excitatory connections existed from a center neuron to all neurons outside a radius of two neurons in the PFC and the weights were set equal to –0.03.
Behavior
The simulated agent modified its head direction based on the activity of its PPC. Activity in the PPC was treated as a probability distribution of possible future head directions, where each PPC neuron had a preferred head direction. To obtain a head direction, the activity of the PPC neurons was normalized, and then a head direction was randomly drawn from this distribution.
Once a head direction was chosen, behavior was modeled by comparing the head direction and the next light location. Recall that in the experiment a light is flashed and the subject must perform a nose poke in the location where the light was just flashed to receive a reward. If the light flashed directly in front of the subject, so that its expectation of light location and the actual light location were in line, the subject would have a higher likelihood of performing a correct action (nose poke in the correct location). On the other hand, if the subject's expectation of the light location was far off from where the light flashed it would be less likely to perform the correct action. Similar to this, the ability of the model to correctly detect a light depended on how close its head pointed to the light location. The likelihood of performing a correct action is Gaussian distributed with a standard deviation of three lights. If the head direction and the actual light location coincided (peak of the Gaussian), there was a 90% chance that the model performed a “correct” behavior. In each trial, there was also 10% chance that the model would perform a “No Go” response, which accounted for the experimentally observed behavior of rats occasionally not performing any action despite a light being flashed (Nitz et al., 2011 and unpublished results).
Illustration of ACh and NA Effects on Simulated Cortical Areas
Figure 3 shows how cholinergic and noradrenergic neuromodulation can affect different cortical regions in the model. The “low” and “high” values in the figure refer qualitatively to the concentration of ACh or NA. The specific values of neuromodulatory concentrations range from 0 to 1 and are given in Equation 3. When ACh levels were low (Figure 3A) recurrent connections within PFC were strengthened, inputs from the PFC were gated into the PPC, and VC input to the PPC was suppressed. In contrast, when ACh levels were high (Figure 3B) recurrent connections within PFC and inputs from the PFC to the PPC were suppressed, and VC inputs were gated in to the PPC. When NA levels were low (Figure 3C), PFC inputs were gated into the PPC, the gain in the BF was reduced, and the forgetting factor in synapses from V1 to PFC and PFC to PPC was small. When NA levels were high (Figure 3D), PFC inputs to the PPC were suppressed, the gain in the BF was increased, and the forgetting factor in synapses from V1 to PFC and PFC to PPC was large.
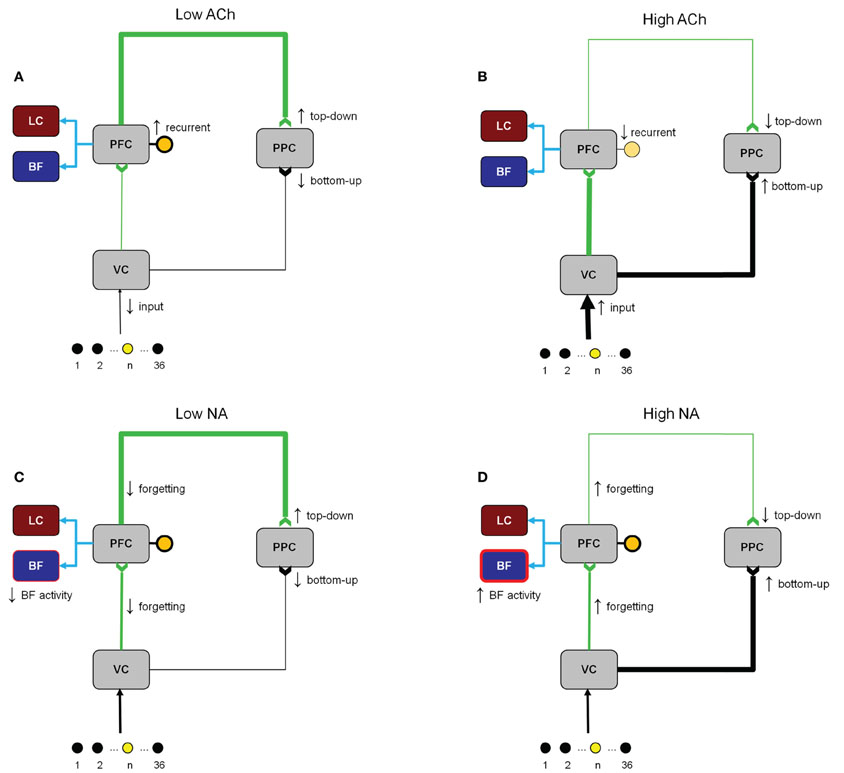
Figure 3. Illustration of the changes in network activity due to different levels of ACh and NA. (A) ACh is low (low expected uncertainty). Recurrent connections within the PFC and inputs from the PFC to the PPC are enhanced. Visual inputs to the VC and from the VC to the PFC are suppressed. (B) ACh is high (high expected uncertainty). Recurrent connections within the PFC and inputs from the PFC to the PPC are suppressed. Visual inputs into the VC and from the VC to the PFC are enhanced. (C) NA is low (low unexpected uncertainty). Gain in the BF and the forgetting factor in the connections from VC to PFC and PFC to PPC are decreased. Sensory inputs to the PPC from VC are suppressed and predictive signals from the PFC to PPC are enhanced. (D) NA is high (high unexpected uncertainty). Gain in the BF and the forgetting factor in the connections from VC to PFC and PFC to PPC are increased. Sensory input to the PPC from VC are enhanced and predictive signals from the PFC to PPC are suppressed.
Results
Simulating the Behavioral Task
The simulated agent performed well in tracking the light location and adapting to novelty in the environment. When the mean light location changed (at 1800, 3600, and 5400 seconds) and novelty was introduced into the environment, the NA system responded with a phasic population burst followed by a slow decay back to baseline (see Figure 4). This phasic response to novelty was a characteristic feature of the NA system and was driven in our network by short-term plastic connections from PFC to LC that was both slow and depressive. This response to novelty can also be seen in Figure 5, where we change the mean light location every 1800 seconds and keep the standard deviation constant at 15 degrees.
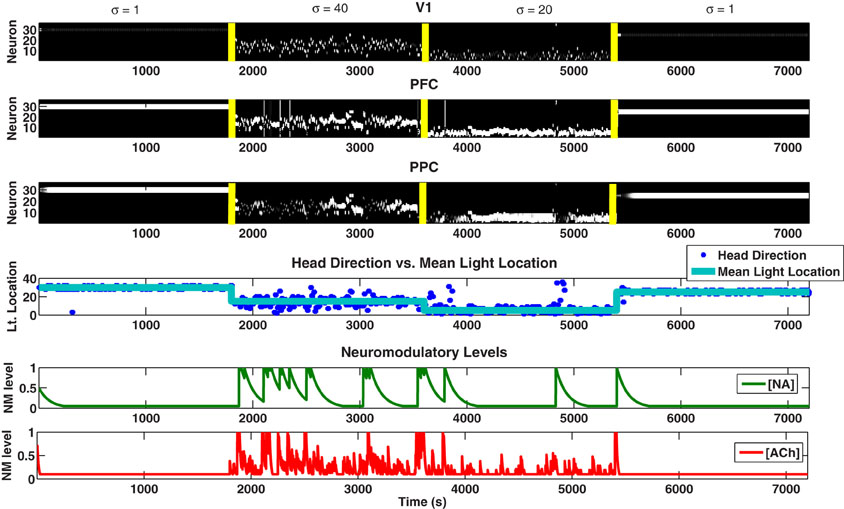
Figure 4. Simulated behavioral task. Plots showing the neural activity (VC, PFC, PPC), behavior (Head Direction), and neuromodulatory levels ([NA], [ACh]). [NA] and [ACh] track unexpected and expected uncertainty, respectively. For the first 1800 seconds, the Gaussian distribution from which each light position was drawn had μ = 30 and σ = 1 degree (low expected uncertainty). From 1800 to 3600 seconds, a new distribution with μ = 15 and σ = 40 degrees (high expected uncertainty) was chosen, introducing unexpected uncertainty (novelty) into the environment. At 3600 seconds, we set μ = 5 and σ = 10 degrees (medium expected uncertainty). At 5400 seconds, we set μ = 20 and σ = 1 degree (low expected uncertainty). The color map for the first three plots (VC, PFC, PPC) is in gray scale, thus, neurons that are highly active are white, neurons that are inactive are black, and neurons that are in between are gray.
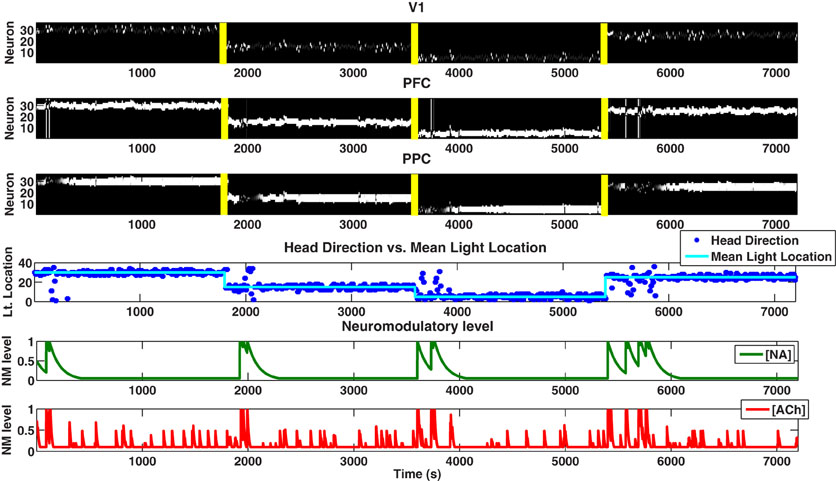
Figure 5. Behavioral task in which the standard deviation is held constant and the mean is changed. In order to see clearer the response of the noradrenergic system to large changes in the environment, we hold the expected standard deviation constant at 10 degrees and change the mean of the distribution. The NA system responds to the changes in unexpected uncertainty with a phasic spike at approximately 1800, 3600, and 5400 seconds.
The NA system in turn acted on several areas of the network. First, it caused synapses from VC to PFC and PFC to PPC to decay back to their original value (Equation 6), forcing the synapses to unlearn previous expectations about the mean light location. This decaying of the synapses to their original value was based on the network reset theory of LC activity (Bouret and Sara, 2005). The NA system also increased the neuronal gain in the BF (Equation 1), which can be seen in Figure 4 as a spike in [ACh] when [NA] spikes. Finally, as will be explained below, the NA system helped to balance the sensory inputs from VC with the predictive inputs from PFC into the PPC.
In contrast to NA, the ACh system in our model was responsive to the amount of known uncertainty in the environment. For example, in Figure 4, compare the ACh level during low expected uncertainty (1–1800 seconds) with high expected uncertainty (1801–3600 seconds). This responsiveness to expected uncertainty can also be seen in Figure 6, where we begin the simulation with a standard deviation of 10 degrees and increase it by 10 degrees every 1800 seconds while holding the mean light location constant.
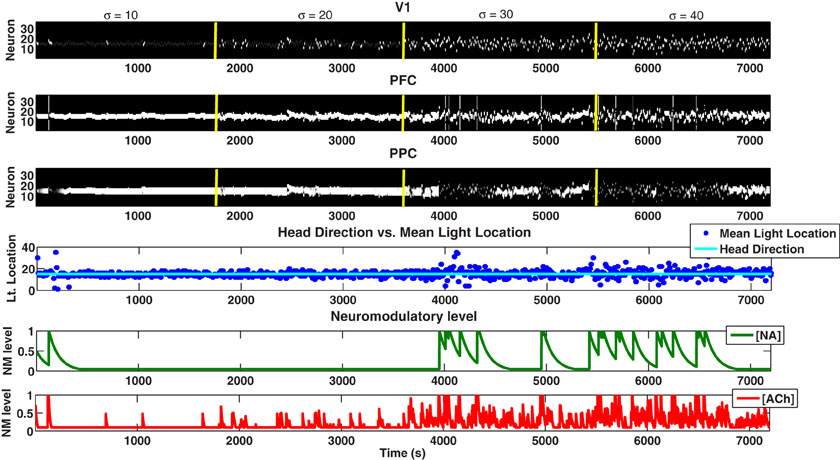
Figure 6. Behavioral task in which the mean light location is held constant and the standard deviation is increased. In order to see clearer the response of the cholinergic system to expected uncertainty in the environment, we hold the mean of the distribution constant and increase the standard deviation by 10 degrees every 1800 seconds. The ACh system has an increasingly elevated response as the expected uncertainty increases over time.
The response of the ACh system to uncertainty in the environment in turn acted on the input to VC and PPC as well as the recurrent connections within the PFC. When expected uncertainty is low (Figure 4, 1–1800 seconds), low ACh levels strengthened PFC's influence on the PPC and increased the strength of recurrent connections within PFC (see Figure 3 and Equations 4, 5). When expected uncertainty was high (Figure 4, 1801–3600 seconds), the level of ACh was high. High ACh enhanced inputs to VC, which enhanced PFC and PPC inputs, gated visual sensory information into the PPC, and reduced the strength of recurrent connections within the PFC. The input enhancement can be seen in Figure 4 just after the first contextual change (1800 seconds) where the [ACh] levels are elevated. At this point, the VC neuronal activity was enhanced and VC drove activity in the PPC more than PFC.
The behavioral performance of the model depended on the amount of uncertainty in the environment. Figures 7A and 7B show how well the simulated agent did in the experiment in terms of the number of correct, incorrect, and No Go responses in situations of low and high uncertainty, respectively. When expected uncertainty was low (1–1800 seconds), the model performed well in the task, getting approximately 80% of its responses correct (Figure 7A). When expected uncertainty was high (1801–3600 seconds), as expected, the model performed worse than in the low uncertainty case and only got about 40% of its responses correct (Figure 7B).
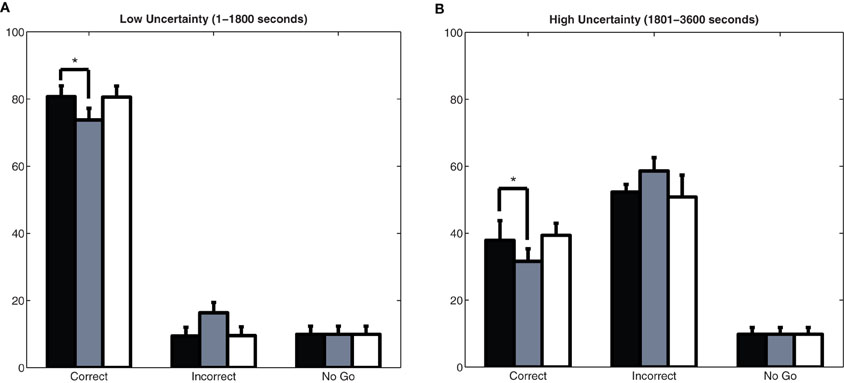
Figure 7. Behavioral performance in the model. Plots show the mean and standard deviation of correct responses, incorrect responses, and responses where the agent did not make a choice (No Go) over 50 experiments with an intact or simulated lesion to the cholinergic or noradrenergic systems. Asterisks (*) indicate a statistically significant difference with p-value less than 0.017 (with Bonferroni correction). (A) Low uncertainty. A lesion of BF resulted in significantly less correct responses (p < 1 × 10⁻¹⁶; t-test) and significantly more incorrect responses (p < 1 × 10⁻²⁰; t-test) than the non-lesioned model. (B) High uncertainty. A lesion of BF resulted in significantly less correct responses (p < 1 × 10⁻¹⁴; t-test) and significantly more incorrect responses (p < 1 × 10⁻¹⁵; t-test) than the non-lesioned model. Lesioning the LC, however, lead to a marginally significant decrease in the number of correct responses in the high uncertainty case (p < 0.05) when compared to the non-lesioned model.
Both the NA and ACh system helped to balance the sensory (VC) and predictive (PFC) inputs seen by the PPC (Equation 4). To demonstrate how VC and the PFC differentially drove the PPC, we calculated the pair-wise distance between the activity in the VC and PPC and PFC and PPC (Figure 8) When uncertainty was low (1–1800 seconds) and, thus, ACh and NA levels were low, PFC input was gated into the PPC and VC input was blocked. In this case, the pair-wise distance between PFC and PPC was close to 0. When uncertainty was high (1801–3600 seconds) and ACh and NA levels were elevated, the pair-wise distance between PFC and PPC increased, and the pair-wise distance between VC and PPC decreased, reflecting that the PPC was driven by VC sensory input.
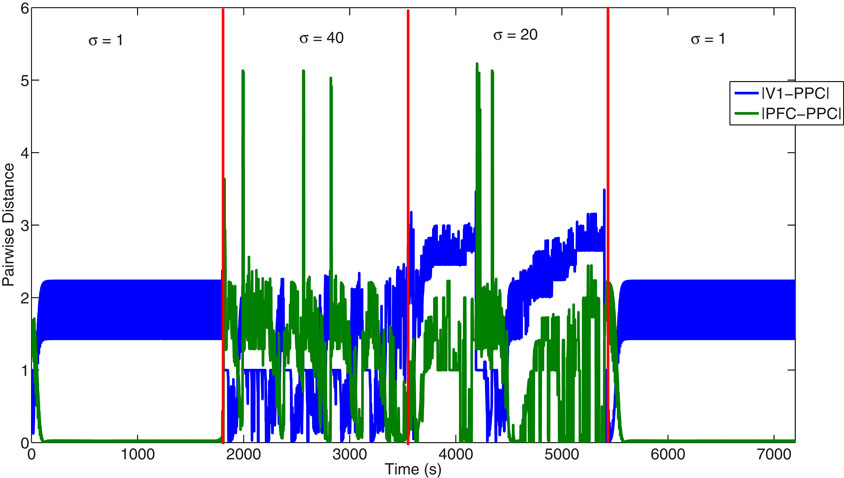
Figure 8. Plot showing the pair-wise distance between the VC and PPC and PFC and PPC. Plot shows the pair-wise distance between the activity in VC and in PPC (blue), and between the activity in PFC and in PPC (green). Under conditions of low uncertainty (1–1800 and 5400–7200 seconds), the PPC is driven more by inputs from the PFC rather than VC. In contrast, under conditions of high uncertainty (1801–3600 seconds), the PPC is driven more by inputs from the VC than from the PFC.
Simulated Lesion Studies
We performed simulated lesions of the cholinergic neurons in the BF and noradrenergic neurons in the LC by removing their projections to cortical targets. When either the BF or LC was lesioned, abnormalities in network activity occurred, which ultimately led to behavioral deficits. A simulated lesion of the BF resulted in a significant drop in correct responses and increase in incorrect responses (p ≪ 0.00001; t-test). In situations of low uncertainty (Figure 7A), the BF lesioned model had 6–7% less correct responses than the non-lesioned model, whereas, in situations of high uncertainty (Figure 7B), the BF lesioned model had 10% less correct responses than the non-lesioned model. This demonstrated that the BF is especially important for guiding behavior in situations of high uncertainty. Interestingly, simulated lesions of the LC did not result in significant performance deficits, as measured by correct and incorrect responses in Figure 7, but did result in behavioral deficits (i.e., perseverative behavior).
Lesioning the BF caused several deficits in the network primarily in situations of high expected uncertainty (see Figure 9). First, when the BF was lesioned, sensory information was not enhanced (see Equation 2). This caused VC (and, thus, PFC and PPC) to be only weakly driven by sensory input throughout the experiment as can be seen in Figure 9. The inactivation of the BF also caused the LC to become more active in conditions of high uncertainty (compare [NA] in Figures 4 and 9), which led to the gating in of VC input to the PPC. The combination of the lack of enhancement of the visual input by the BF, but the gating in of VC input to the PPC by the over-active LC in situations of high uncertainty, ultimately led to a weak VC signal being fed into the PPC (Figure 9, 1801–3600 seconds). Notice in Figure 9 from 1801 to 3600 seconds that when the LC was highly active, there were gaps in activity in the PPC as a result of the unreliable VC signal being gated in. The lack of a strong signal into the PPC led to random behavior by the model in cases of high uncertainty as can be seen in the head direction plot of Figure 9.
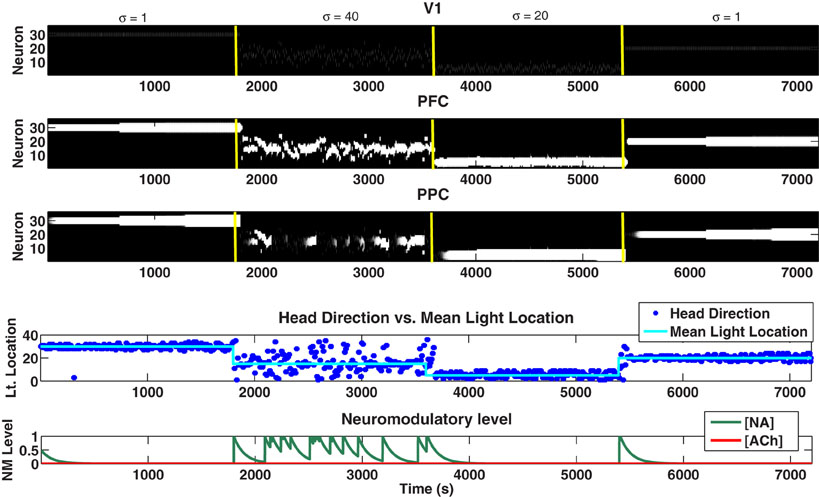
Figure 9. Plots showing the neural activity (VC, PFC, PPC), behavior (Head Direction), and neuromodulatory levels ([NA], [ACh]) when the BF has been lesioned. When the BF is lesioned, input to the VC is no longer enhanced in situations of high uncertainty as can be seen by comparing VC activity from 1801 to 3600 seconds in this Figure and in Figure 4. In addition to the weakened input, the overactive LC causes VC information to be gated into the PPC. The combined lack of enhancement of input and activated LC results in an unreliable sensory signal being gated into the PPC in situations of high uncertainty (seen as gaps in activity in the PPC from 1801 to 3600 seconds). This ultimately causes behavioral response (Head Direction) to appear random from 1801 to 3600 seconds.
The LC system responded to unexpected changes in the environment and, in turn, acted on the network by enhancing the forgetting of information, increasing the gain in the BF, and balancing the sensory and predictive inputs to PPC. Lesioning the LC affected the network in a few different ways. First, when comparing the behavioral results in Figures 7A,B, the model appears to be performing worse when uncertainty was high. When uncertainty was low (Figure 7A), the LC lesioned model performed just as well as the non-lesioned model (same percentage of correct responses). However, when uncertainty was high (Figure 7B), the LC lesioned model had a marginally significant effect (p < 0.05; t-test with alpha = 0.017, Bonferroni corrected).
The performance of the model decreased as time progresses as a result of the model not being able to forget prior expectations (held in PFC) and continuing to go back to these in future trials (i.e., perseveration). This behavior could be readily observed in Figure 10 from 5401 to 7200 seconds as PPC neurons associated with previous Gaussian means (<5400 seconds) remain active and the behavior of the model (i.e., head direction) continues to go back to these previous distributions. This behavior was a result the LC's inability to increase the forgetting factor in the connections from V1 to PFC and PFC to PPC, which led to the existence of a larger set of active neurons in the PFC and PPC remaining from previous distributions despite contextual changes (i.e., changes in the Gaussian mean). Having more active neurons in the PFC and PPC meant that previously learned light locations were not forgotten, causing the simulated agent to keep returning to old locations despite the current environmental cues.
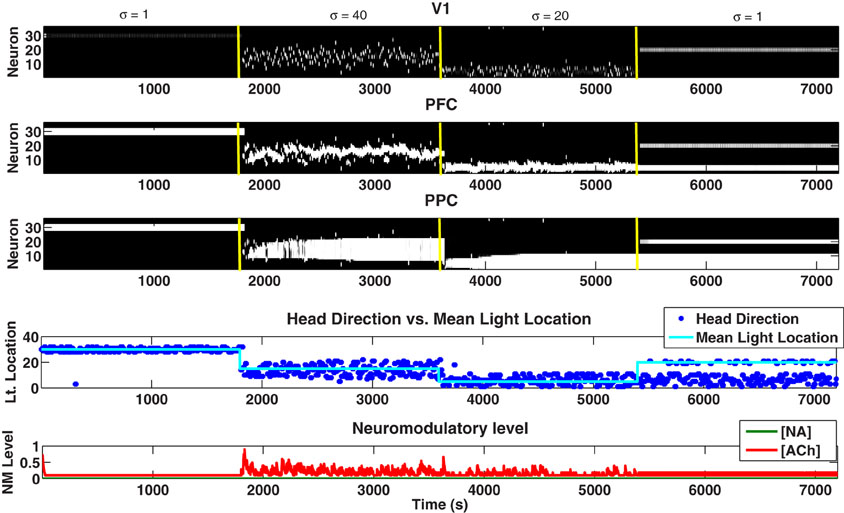
Figure 10. Plots showing the neural activity (VC, PFC, PPC), behavior (Head Direction), and neuromodulatory levels ([NA], [ACh]) when the LC has been lesioned. Notice that after 5400 seconds the behavioral response (Head Direction) continually moves to previous light position locations. This results from neurons from previous trials persisting in the PFC and PPC, leading to the observed perseverative behavior.
The LC can have a strong influence on BF activity. Lesioning the simulated LC caused the BF to incorrectly track expected uncertainty in the environment (Figure 11). Specifically, when expected uncertainty was high (1801–3600 seconds), the ACh levels were much lower than in the non-lesioned case. Also, when expected uncertainty was low (5401–7200 seconds), the ACh levels remained much higher than in the non-lesioned case. Because the ACh levels remained high in the LC lesion case, the mean activity in VC was overly enhanced in situations of low uncertainty.
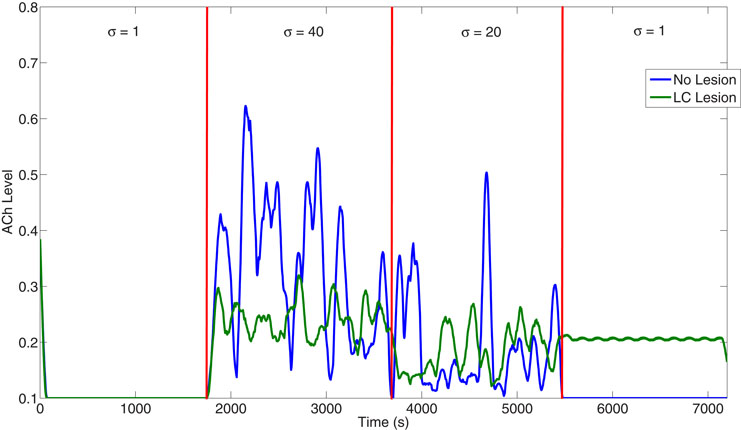
Figure 11. Influence of LC on the ACh level. When the LC is lesioned, the BF no longer correctly tracks expected uncertainty as can be seen in its diminished activity at high when expected uncertainty is high from 1800 to 3600 seconds. Also, after 5400 seconds, the ACh level remains tonically activated, despite the change to low uncertainty. This is due to the over-activation of the prefrontal cortex (see Figure 5) caused by LC's inability to clear previous expectations.
Discussion
The cholinergic and noradrenergic systems, which originate in the BF and LC, respectively, have been shown to have a pervasive influence on cortical activity and in turn influence many cognitive functions, including learning, memory, and attention (Sara, 2009; Hasselmo and Sarter, 2011). It has been suggested that the cholinergic and noradrenergic systems respond to expected and unexpected uncertainty in the environment, respectively (Yu and Dayan, 2005). We constructed a neural model of these neuromodulatory systems and their cortical targets to better understand how they influence allocation of attentional resources in situations of uncertainty and how this may lead to changes in cortical activity and behavior. The present model gives theoretical insight into how neuromodulatory systems shape behavior in the face of uncertainty and how an attentional circuit, based on neuroanatomical and neurophysiological details, can cope with both expected and unexpected environmental uncertainty.
In our model, we demonstrated that, through biologically plausible synaptic learning rules, the BF and LC responded to expected and unexpected uncertainty in the environment. Specifically, the simulated LC, which has broad connections (Aston-Jones and Cohen, 2005) and relatively slow learning, responded phasically to large changes in stimulus locations (unexpected uncertainty). The LC, in turn, acted on the network by forcing synapses to decay toward their original values, enhancing activity in the BF, and balancing sensory information and predictive signals by gating input activity into the PPC. In addition, we showed that activity in the simulated BF, which has relatively fast learning, responded to the variability in stimulus locations (expected uncertainty). The BF acted on the network by amplifying the sensory input, which indirectly increases learning in the connections from VC to PFC and PFC to PPC, and decreasing the recurrent activity in the PFC. In this way, the BF balanced VC sensory and PFC predictive input to the PPC. These changes in cortical targets simulated five different, experimentally verified neuromodulatory modes of action, including: (1) nicotinic enhancement of thalamocortical input (Disney et al., 2007), (2) muscarinic suppression of intracortical activity (Hasselmo and McGaughy, 2004), (3) facilitation of network reset by the noradrenergic system (Bouret and Sara, 2005), (4) LC activation of the BF (Sarter et al., 2001), and (5) the dynamic regulation of frontal cortex and VC information by the cholinergic and noradrenergic systems (Sarter et al., 2005; Yu and Dayan, 2005).
The behavior of the artificial agent, which was guided by the model of the suggested attentional network, was sensitive to environmental change, as realized by changes in stimulus uncertainty. The simulated performance results given in Figure 7 are in agreement with the performance of rodent experiments in a similar task (Nitz et al., 2011). Figures 4 through 6 show how the BF and LC accurately track the uncertainties in the underlying stimulus distributions, and how BF and LC can shape cortical responses. Simulated lesions of these neuromodulatory systems further show the importance of these neuromodulatory systems in attentional tasks. Lesions of the BF resulted in a drop in behavioral performance, due to an inability to gate in sensory input, especially during conditions of high uncertainty (see Figures 7 and 9). Lesions of the LC resulted in perseverative behavior because the system could not unlearn prior stimulus distributions (see Figures 7 and 10).
Comparison with Bayesian Model
Yu and Dayan (2005) developed a model within a Bayesian statistical framework that had similarities with the behavioral task we modeled in this paper. The task they modeled was an extended Posner task that incorporated both expected and unexpected uncertainty and had simulated ACh and NA levels track these statistics, respectively. Specifically, in each trial of their task they presented five different colored cue stimuli pointing left or right. Afterwards, a target was shown on the left or right (Yu and Dayan, Figure 1). One of these cues was predictive of the target location with a certain probability (cue validity). The invalidity of this predictive cue (1-cue validity) was the expected uncertainty in this task. Thus, ACh in this experiment tracked the uncertainty about the cue validity. Analogously, in our task expected uncertainty was a function of the standard deviation of the light position. ACh, in this case, tracks the uncertainty about the cue location. Unexpected uncertainty was incorporated into the Yu and Dayan task by changing the identity of the predictive cue sometime in the experiment. For example, if blue was predictive of the target location with a probability of 85% (expected uncertainty), unexpected uncertainty would be incorporated into the experiment by changing the predictive cue to be red. NA in their model tracks the uncertainty about the cue identity, and thus would become elevated when the predictive cue changed. Just as in the Yu and Dayan task where the expectation of the cue identity is built up and then changed to introduce unexpected uncertainty, our task built an expectation of where the mean light location was and then periodically changed it to introduce unexpected uncertainty.
The results of our model were quite similar to Yu and Dayan's simulations compare (Figure 4 with Yu and Dayan's, Figure 3). In Yu and Dayan's simulated task, there were 600 trials, broken down into 3,200 trial blocks. The first, second, and third blocks had low, high, and medium amounts of expected uncertainty, respectively. ACh was able to track this uncertainty. Unexpected uncertainty, which NA tracked, was introduced into the simulation by changing the cue identity at trial 200 and 400. The first 5400 seconds of our simulation are comparable to their 600 trials in that we simulated low, high, and medium levels of uncertainty at 0–1800, 1801–3600, and 3601–5400 seconds, respectively. Unexpected uncertainty was also introduced at 1801 and 3601 seconds by changing the mean light location. In the non-lesioned task (Figure 4), low (0–1800 seconds), high (1801–3600 seconds), and medium (3601–5400 seconds), uncertainty had correspondingly similar levels of [ACh]. The [NA] also matched results seen by Yu and Dayan, with phasic responses seen at 1800, 3600, and 5400 seconds where the mean light location was changed (unexpected uncertainty). A series of phasic bursts in [NA] when switching from low to high uncertainty at 3600 seconds also matches results from Yu and Dayan. One discrepancy, however, is that these bursts of [NA] continue under high uncertainty in our model, whereas they appear to fall back to baseline after a certain amount of time in Yu and Dayan's model.
Similarities were also seen in comparing our lesioned models with their pharmacological depletion simulations (compare Figures 9 and 10 with Yu and Dayan, Figure 6). As in Yu and Dayan's depletion simulations, when LC was lesioned (Figure 10), the model began showing perseverative errors at around 5400 seconds, indicating an inability to switch from one hypothesis to the next. Another similarity between both models is that when NA was depleted (i.e., LC is lesioned), ACh no longer correctly tracked expected uncertainty and eventually remained persistently high despite a switch to a series of trials with low uncertainty. Figures 10 and 11 show that when the LC is lesioned, the ACh no longer correctly tracks uncertainty, and after 5400 seconds the [ACh] levels do not return to baseline as they would in the non-lesioned case. Our model also predicts that when the BF is completely lesioned (Figure 9), the LC will become more active as Yu and Dayan have observed (Yu and Dayan, 2005).
Because the present model is neurally based, we were able to account for some of the underlying neural mechanisms that led to these abnormalities. First, the perseverative errors that occur during [NA] depletion result from the PFC holding previous expectations in memory, incorrectly driving activity in the PPC. Also, elevated [ACh] levels during [NA] depletion occur as a result of the PFC holding multiple hypotheses in memory due to the LC's inability to clear these hypotheses. As a result, more neurons in the PFC are active, which drives activity in the BF, leading to higher firing rates and, thus, higher [ACh] levels. Finally, the incorrect tracking of uncertainty by the cholinergic system when the LC is lesioned is likely due to the combined effect of the LC no longer driving activity in the BF and the PFC no longer retaining the appropriate hypotheses.
Probability Matching
Humans use various strategies when making decisions in order to maximize the number of correct predictions. One decision strategy humans have been shown to use is called probability matching (Wozny et al., 2010). Probability matching involves making predictions based on what we think the probability of an outcome will be. For example, if we think that the probability of outcome A is 90% and outcome B is 10%, we will pick outcome A 90% of the time and outcome B 10%. An optimal algorithm would learn the probability structure and choose the most probable outcome 100% of the time in order to maximize the number of correct predictions. Yu and Dayan's Bayesian model utilizes this optimal decision strategy in choosing the identity of the predictive cue. Probability matching, on the other hand, is a suboptimal strategy. Unlike the Yu and Dayan model, our model utilizes probability matching in choosing head directions rather than the optimal strategy. Connections from the PFC to the BF match the underlying probability distribution of the lights (see Figure 12) and the simulated agent's head direction also matches this distribution (see Figures 4–6). When the Gaussian distribution from which the light positions were drawn has a small standard deviation (low expected uncertainty, 1–1800 seconds), only a small set of the synaptic weights from the PFC to the BF were strongly depressed and the model learned to expect the light in that location. For example, the blue line in Figure 12 shows the synaptic weights after the presentation of lights with a mean location of 30 and a standard deviation of 10 degrees. When the Gaussian distribution had a large standard deviation, a larger set of synaptic weights became partially to fully depressed. For example, the red line in Figure 12 shows the synaptic weights after the presentation of lights with a mean location of 15 and a standard deviation of 40 degrees. In this way, the distribution of weights in the connections from the PFC to the BF matched the standard deviation of the Gaussian distribution, resulting in probability matching of the stimulus distribution by the behaving agent. This allows the agent to respond fluidly and quickly to environmental uncertainty and to appropriately drive decision-making.
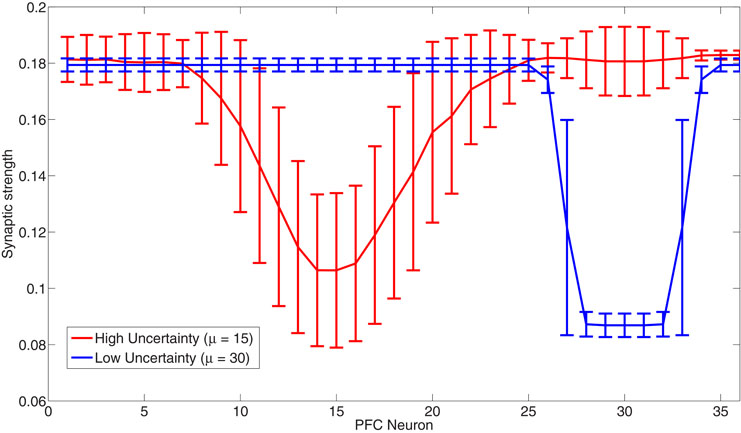
Figure 12. Probability matching via synaptic connections from the PFC to the BF. The figure shows the strength of the synapse from PFC neurons to a BF neuron in high (red) and low (blue) uncertainty environments. When expected uncertainty is low (Gaussian with standard deviation of 1 degree), a small subset of weights from the PFC to the BF become fully depressed (blue line). When expected uncertainty is high (Gaussian with a large standard deviation of 40 degrees), a larger subset of weights from the PFC to the BF become partially to fully depressed (red line).
Predictions
From our neural model, we are able to make several experimentally verifiable predictions of how the cholinergic and noradrenergic systems influence an animal's neural activity and behavior. First, our model suggests that phasic bursts in the LC will lead to bursts in the BF. Likewise, lesioning the LC will lead to changes in the activation of the BF, which may affect the animal's ability to adaptively respond to expected uncertainty in the environment. This can be verified in electrophysiological experiments by simultaneously recording from the BF and LC while varying the degree of uncertainty in the environment. Our model also suggests that lesioning the LC should lead to increases in activity in the PFC and PPC, which ultimately would lead to behavioral deficits, such as perseverative errors. These changes may be best measured by BOLD responses in fMRI experiments or changes in the local field potential. Changes in the BF response when the LC is lesioned may also indirectly result from PFC deficits and may be verified by recording from the PFC and BF simultaneously. Finally, we suggest that poor performance when BF is lesioned, or more specifically, the cholinergic neurons in the BF are lesioned, occurs during situations of high expected uncertainty as a result of weak, unreliable sensory input being gated into PPC. This can be verified in electrophysiological studies as a decrease in firing rate or as a decrease in BOLD signal response in fMRI experiments in parietal cortex when the BF is lesioned and expected uncertainty is high.
Summary
What we attend to depends upon the amount of uncertainty in the environment and involves many neural areas working in coordination in order to balance sensory (bottom-up) and internally generated (top-down) information. The cholinergic and noradrenergic systems have been shown to be important in orchestrating activity within and between these neural areas in order to optimize attentional processing in the face of uncertainty. We have developed a neural model in which the cholinergic and noradrenergic systems respond appropriately to uncertainty in the environment and influence their targets in experimentally verified ways. This research showed how the BF and LC can influence each other and their cortical targets and how this ultimately leads to changes in behavior. In addition, our model allowed us to make predictions regarding neural responses that may be tested in electrophysiological, behavioral, and imaging studies. In order to develop a mechanistic understanding of the neural basis of attention and the role that uncertainty and neuromodulation play in it, it will be important in the future to develop large-scale, neurobiologically realistic models that may be tested against experimental results.
Conflict of Interest Statement
The authors declare that the research was conducted in the absence of any commercial or financial relationships that could be construed as a potential conflict of interest.
Acknowledgments
Supported by the Defense Advanced Research Projects Agency (DARPA) subcontract 801888-BS, Intelligence Advanced Research Projects Activity (IARPA) via Department of the Interior (DOI) contract number D10PC20021, and NSF award number IIS-0910710. The US Government is authorized to reproduce and distribute reprints for Governmental purposes notwithstanding any copyright annotation thereon. The views and conclusions contained hereon are those of the authors and should not be interpreted as necessarily representing the official policies or endorsements, either expressed or implied, of IARPA, DOI, or the US Government.
References
Aston-Jones, G., and Cohen, J. D. (2005). Adaptive gain and the role of the locus coeruleus-norepinephrine system in optimal performance. J. Comp. Neurol. 493, 99–110.
Aston-Jones, G., Rajkowski, J., Kubiak, P., and Alexinsky, T. (1994). Locus coeruleus neurons in monkey are selectively activated by attended cues in a vigilance task. J. Neurosci. 14, 4467–4480.
Baxter, M. G., and Chiba, A. A. (1999). Cognitive functions of the basal forebrain. Curr. Opin. Neurobiol. 9, 178–183.
Berridge, C. W., and Waterhouse, B. D. (2003). The locus coeruleus-noradrenergic system: modulation of behavioral state and state-dependent cognitive processes. Brain Res. Brain Res. Rev. 42, 33–84.
Bouret, S., and Sara, S. J. (2005). Network reset: a simplified overarching theory of locus coeruleus noradrenaline function. Trends Neurosci. 28, 574–582.
Broussard, J. I., Karelina, K., Sarter, M., and Givens, B. (2009). Cholinergic optimization of cue-evoked parietal activity during challenged attentional performance. Eur. J. Neurosci. 29, 1711–1722.
Bucci, D. J., Holland, P. C., and Gallagher, M. (1998). Removal of cholinergic input to rat posterior parietal cortex disrupts incremental processing of conditioned stimuli. J. Neurosci. 18, 8038–8046.
Dalley, J. W., McGaughy, J., O'Connell, M. T., Cardinal, R. N., Levita, L., and Robbins, T. W. (2001). Distinct changes in cortical acetylcholine and noradrenaline efflux during contingent and noncontingent performance of a visual attentional task. J. Neurosci. 21, 4908–4914.
Disney, A. A., Aoki, C., and Hawken, M. J. (2007). Gain modulation by nicotine in macaque v1. Neuron 56, 701–713.
Goard, M., and Dan, Y. (2009). Basal forebrain activation enhances cortical coding of natural scenes. Nat. Neurosci. 12, 1444–1449.
Hasselmo, M. E., and McGaughy, J. (2004). High acetylcholine levels set circuit dynamics for attention and encoding and low acetylcholine levels set dynamics for consolidation. Prog. Brain Res. 145, 207–231.
Hasselmo, M. E., and Sarter, M. (2011). Modes and models of forebrain cholinergic neuromodulation of cognition. Neuropsychopharmacology 36, 52–73.
Herrero, J. L., Roberts, M. J., Delicato, L. S., Gieselmann, M. A., Dayan, P., and Thiele, A. (2008). Acetylcholine contributes through muscarinic receptors to attentional modulation in V1. Nature 454, 1110–1114.
Howe, W. M., Ji, J., Parikh, V., Williams, S., Mocaer, E., Trocme-Thibierge, C., and Sarter, M. (2010). Enhancement of attentional performance by selective stimulation of alpha4beta2(*) nAChRs: underlying cholinergic mechanisms. Neuropsychopharmacology 35, 1391–1401.
Krichmar, J. (2008). The neuromodulatory system: a framework for survival and adaptive behavior in a challenging world. Adapt. Behav. 16, 385–399.
Markram, H., and Tsodyks, M. (1996). Redistribution of synaptic efficacy between neocortical pyramidal neurons. Nature 382, 807–810.
Nelson, C. L., Sarter, M., and Bruno, J. P. (2005). Prefrontal cortical modulation of acetylcholine release in posterior parietal cortex. Neuroscience 132, 347–359.
Nitz, D. A., Alexander, A., Wirkus, J., Chan, T., Tingley, D., and Chiba, A. A. (2011). “Basal forebrain neuronal activity predicts trial outcome subsequent to cue detection in a selective attention task,” Program No. 197.17. 2011 Neuroscience Meeting Planner. Washington, DC: Society for Neuroscience, 2011. Online.
Parikh, V., and Sarter, M. (2008). Cholinergic mediation of attention: contributions of phasic and tonic increases in prefrontal cholinergic activity. Ann. N.Y. Acad. Sci. 1129, 225–235.
Sara, S. J. (2009). The locus coeruleus and noradrenergic modulation of cognition. Nat. Rev. Neurosci. 10, 211–223.
Sarter, M., Givens, B., and Bruno, J. P. (2001). The cognitive neuroscience of sustained attention: where top-down meets bottom-up. Brain Res. Brain Res. Rev. 35, 146–160.
Sarter, M., Hasselmo, M. E., Bruno, J. P., and Givens, B. (2005). Unraveling the attentional functions of cortical cholinergic inputs: interactions between signal-driven and cognitive modulation of signal detection. Brain Res. Brain Res. Rev. 48, 98–111.
Vankov, A., Hervé-Minvielle, A., and Sara, S. J. (1995). Response to novelty and its rapid habituation in locus coeruleus neurons of the freely exploring rat. Eur. J. Neurosci. 7, 1180–1187.
Vogels, T. P., and Abbott, L. F. (2009). Gating multiple signals through detailed balance of excitation and inhibition in spiking networks. Nat. Neurosci. 12, 483–491.
Wozny, D. R., Beierholm, U. R., and Shams, L. (2010). Probability matching as a computational strategy used in perception. PLoS Comput. Biol. 6. doi: 10.1371/journal.pcbi.1000871
Zaborszky, L. (2002). The modular organization of brain systems. Basal forebrain: the last frontier. Prog. Brain Res. 136, 359–372.
Zaborszky, L., and Duque, A. (2003). Sleep-wake mechanisms and basal forebrain circuitry. Front. Biosci. 8, d1146–d1169.
Keywords: neuromodulation, cholinergic, noradrenergic, uncertainty, simulation
Citation: Avery MC, Nitz DA, Chiba AA and Krichmar JL (2012) Simulation of cholinergic and noradrenergic modulation of behavior in uncertain environments. Front. Comput. Neurosci. 6:5. doi: 10.3389/fncom.2012.00005
Received: 20 October 2011; Accepted: 17 January 2012;
Published online: 31 January 2012.
Edited by:
Hava T. Siegelmann, Rutgers University, USAReviewed by:
Hava T. Siegelmann, Rutgers University, USAFrederick C. Harris, University of Nevada, Reno, USA
Copyright: © 2012 Avery, Nitz, Chiba and Krichmar. This is an open-access article distributed under the terms of the Creative Commons Attribution Non Commercial License, which permits non-commercial use, distribution, and reproduction in other forums, provided the original authors and source are credited.
*Correspondence: Michael C. Avery, Department of Cognitive Sciences, University of California, 2224 Social and Behavioral Sciences Gateway, Irvine, CA 92697-5100, USA. e-mail: averym@uci.edu