Functional brain network characterization and adaptivity during task practice in healthy volunteers and people with schizophrenia1
- 1 Department of Neurology, Columbia University, New York, NY, USA
- 2 Department of Physics, University of California at Santa Barbara, Santa Barbara, CA, USA
- 3 MEG Core Facility, National Institute of Mental Health, Bethesda, MD, USA
- 4 Clinical Brain Disorder Branch, National Institute of Mental Health, Bethesda, MD, USA
Cognitive remediation involves task practice and may improve deficits in people suffering from schizophrenia, but little is known about underlying neurophysiological mechanisms. In people with schizophrenia and controls, we used magnetoencephalography (MEG) to examine accuracy and practice-related changes in parameters indexing neural network structure and activity, to determine whether these might be useful assays of the efficacy of cognitive remediation. Two MEG recordings were acquired during performance of a tone discrimination task used to improve the acuity of auditory processing, before and after ∼2.5 h of task practice. Accuracy before practice was negatively correlated with beta-band cost efficiency, a graph theoretical measure of network organization. Synthetic aperture magnetometry was used to localize brain oscillations with high spatial accuracy; results demonstrated sound and sensorimotor modulations of the beta band in temporo-parietal regions and the sensorimotor cortex respectively. High-gamma activity also correlated with sensorimotor processing during the task, with activation of auditory regions following sound stimulation, and activation of the left sensorimotor cortex preceding the button press. High-gamma power in the left frontal cortex was also found to correlate with accuracy. Following practice, sound-induced broad-band power in the left angular gyri increased. Accuracy improved and was found to correlate with increased mutual information (MI) between sensors in temporal–parietal regions in the beta band but not global cost efficiency. Based on these results, we conclude that hours of task practice can induce meso-scale changes such as increased power in relevant brain regions as well as changes in MI that correlate with improved accuracy.
Introduction
Cognitive impairment is increasingly recognized as a critical component in schizophrenia and therefore an important treatment target (Huffaker et al., 2009; Dickinson et al., 2010a; Wykes, 2010). While a variety of cognitive remediation strategies have been developed, it is unclear which, if any, is effective (McGurk et al., 2009; Dickinson et al., 2010b; Keefe et al., 2010). One particularly promising strategy in the context of schizophrenia begins with training on simple auditory discrimination tasks and builds from this training to improve higher order verbal skills (Adcock et al., 2009; Fisher et al., 2009). A rationale for this approach is that patients with schizophrenia exhibit deficits in early stages of auditory processing that weaken the foundation for more complex cognitive processing (Javitt, 2009). However, these deficits may be ameliorated by practice (Fisher et al., 2009).
How practice influences brain function is as yet unclear. In healthy subjects, practice and improved performance on an auditory discrimination task correlate with an increase in the amplitude of auditory evoked responses (van Wassenhove and Nagarajan, 2007; Tong et al., 2009) likely due to synaptic plasticity (Buonomano and Merzenich, 1998; Tallal, 2004). However, the specific functional brain networks involved in auditory learning have yet to be fully elucidated and it is unclear how they are modified by practice. Current evidence from PET (Zatorre et al., 1994), fMRI (Ohnishi et al., 2001; Gaab et al., 2003, 2006; Temple et al., 2003; Warren and Griffiths, 2003; Rinne et al., 2009; Schulze et al., 2009), and magnetoencephalography (MEG) studies (van Wassenhove and Nagarajan, 2007) suggest that diverse temporo-parietal regions, as well as the left inferior frontal gyrus, and dorsal–lateral prefrontal cortex (DLPFC) contribute to auditory discrimination and working memory.
To characterize the functional brain networks involved in performance and practice of an auditory cognitive remediation task, we used MEG and measured mutual information (MI), a non-linear measure of coherence (David et al., 2004), between signals in the delta through high-gamma frequency bands between synthetic planar sensors. Coherence in fields recorded either intra- or extra-cranially is thought to be important for communication between brain areas (Bullock et al., 1995) and for cognitive performance (Bressler et al., 1993; Varela et al., 2001; Buschman and Miller, 2007; Cavanagh et al., 2009). Furthermore, coherence measurements provide information about the structure and plasticity of brain networks (Wang et al., 2010), that can be described by graph theoretical measures (Bullmore and Sporns, 2009). One such measure – cost efficiency, which quantifies the balance between network efficiency and the number of edges utilized in a graph (Figure 1) – is unique in that it reaches a maximum at a particular cost, thereby providing a non-arbitrary threshold for constructing unweighted graphs (Achard and Bullmore, 2007). This measure is particularly appropriate in our study because previous work has indicated that cost efficiency is positively correlated with performance in the visual N-back task in both controls and people with schizophrenia (Bassett et al., 2009).
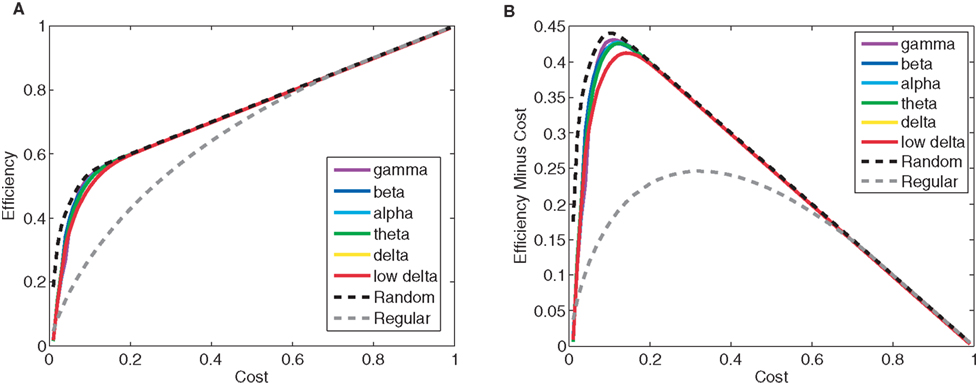
Figure 1. Calculating network cost efficiency during performance of the tone discrimination task. (A) Efficiency as a function of cost for model random and regular networks, and the networks derived from the mutual information adjacency matrix computed for the beta band during the pitch discrimination task. Global efficiency is a measurement inversely proportional to the mean path length of the network. Cost is proportional to the number of edges in the network. (B) Efficiency minus cost, as a function of cost. Cost efficiency is equal to the maximum value of efficiency minus cost curve, and can be used to construct an unweighted graph from the mutual information adjacency matrix without the use of an arbitrary threshold.
In this work, we sought to identify the temporal and spatial characteristics of networks involved in the performance and practice of an auditory pitch discrimination task (Figure 2A) in samples of healthy individuals and patients with schizophrenia. Specifically, we tested whether accuracy in the task at baseline, after practice, and the difference (Δ) between the two, correlated with changes in univariate (signal power), bivariate (MI), and multivariate (cost efficiency) measurements of brain activity in delta through high-gamma bands estimated from MEG data acquired both before and after task practice. Signal power was measured in both sensor space and source space using sliding window synthetic aperture magnetometry (SAM; see Materials and Methods). Comparisons between the two recording sessions were used to determine practice-related changes in functional brain network organization.
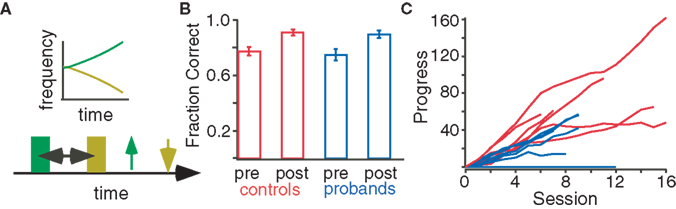
Figure 2. Practice improves performance in the two-tone discrimination task. (A) In the task, two frequency modulated tones (green and yellow) are presented after a variable inter-stimulus interval. The subject makes two selections (up and down arrows) depending on the perceived direction of pitch modulation. (B) Progress in “high or low” pitch discrimination task during practice sessions. For both control (red) and proband (blue) subjects, task difficulty during each 15 min session was adaptively adjusted to match skill level. Progress bars are proportional to the number of correct responses during the session and inversely proportional to the number of incorrect responses. (C) Task accuracy in controls (red) and probands (blue) before and after practice.
Results
Task Performance and Practice
Task accuracy before practice did not differ between probands (n = 7) and controls (n = 10; Figure 2B, two tailed t-test, p = 0.639). Controls and probands completed an average of 2.96 ± 0.31 and 2.25 ± 0.12 h (mean ± SEM) of practice respectively, and all but one proband exhibited improved tone discrimination performance during practice (Figure 2C). One proband could not complete the practice due to medical illness and three of the control subjects dropped out of the study. Following practice, accuracy significantly increased 10.58 ± 0.3% among controls (n = 7, p < 0.01) and 11.52 ± 0.4% among probands (n = 6, p < 0.01); see Figure 2B.
Sensor Space Analysis: Parameter Associations with Task Accuracy
The first component of our analysis was in sensor space after the data was denoised using signal space separation. We treated the 273 MEG sensors as nodes of a graph, we calculated multivariate (cost efficiency, characteristic clustering coefficient, mean path length, small worldness), bivariate (MI), and univariate (power) measures. All measures were calculated across a range of frequency bands and correlations with task performance were determined before (Table 1) and after (Table 2) task practice.
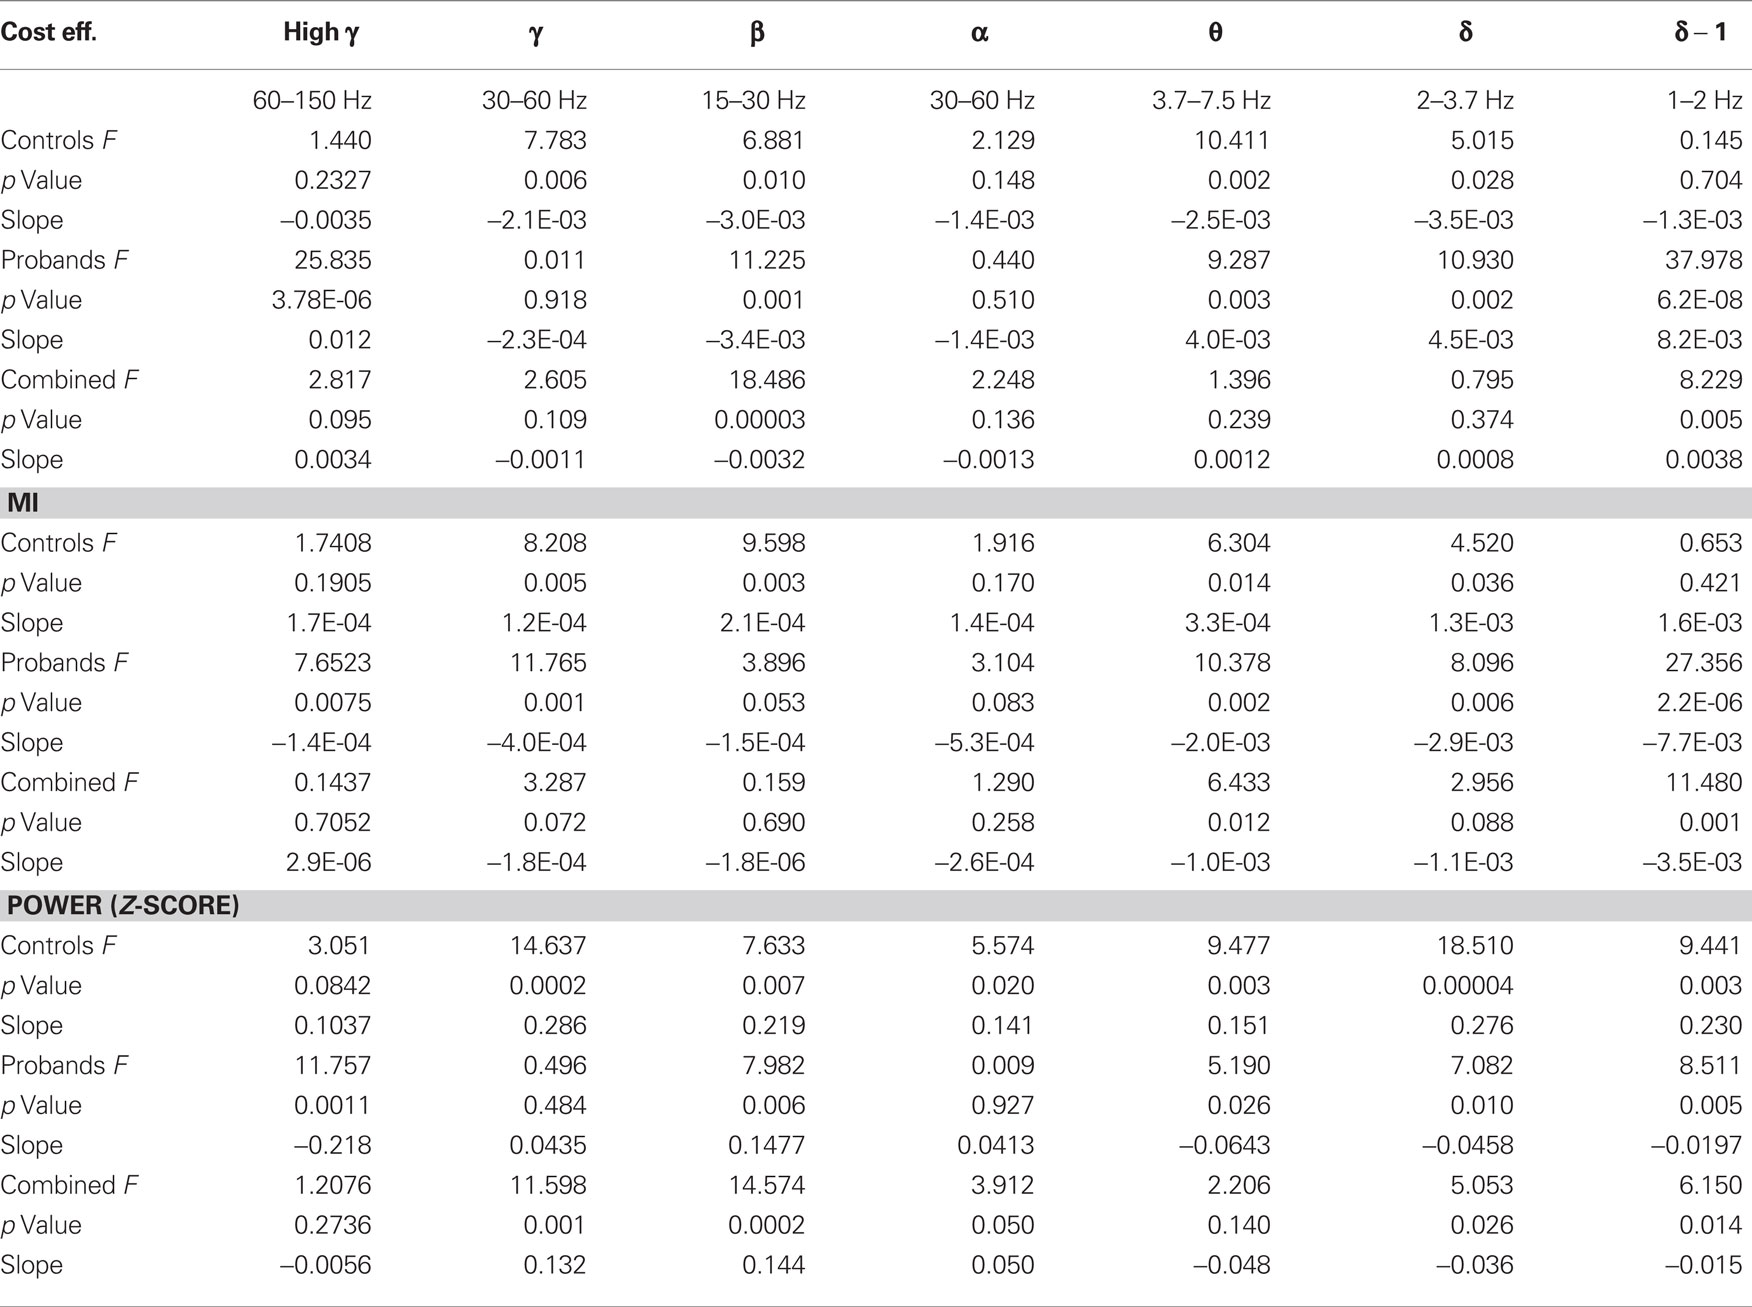
Table 1. General linear model of global metrics and performance in the six frequency bands for controls (n = 10) and patients with schizophrenia (n = 7) before practice.
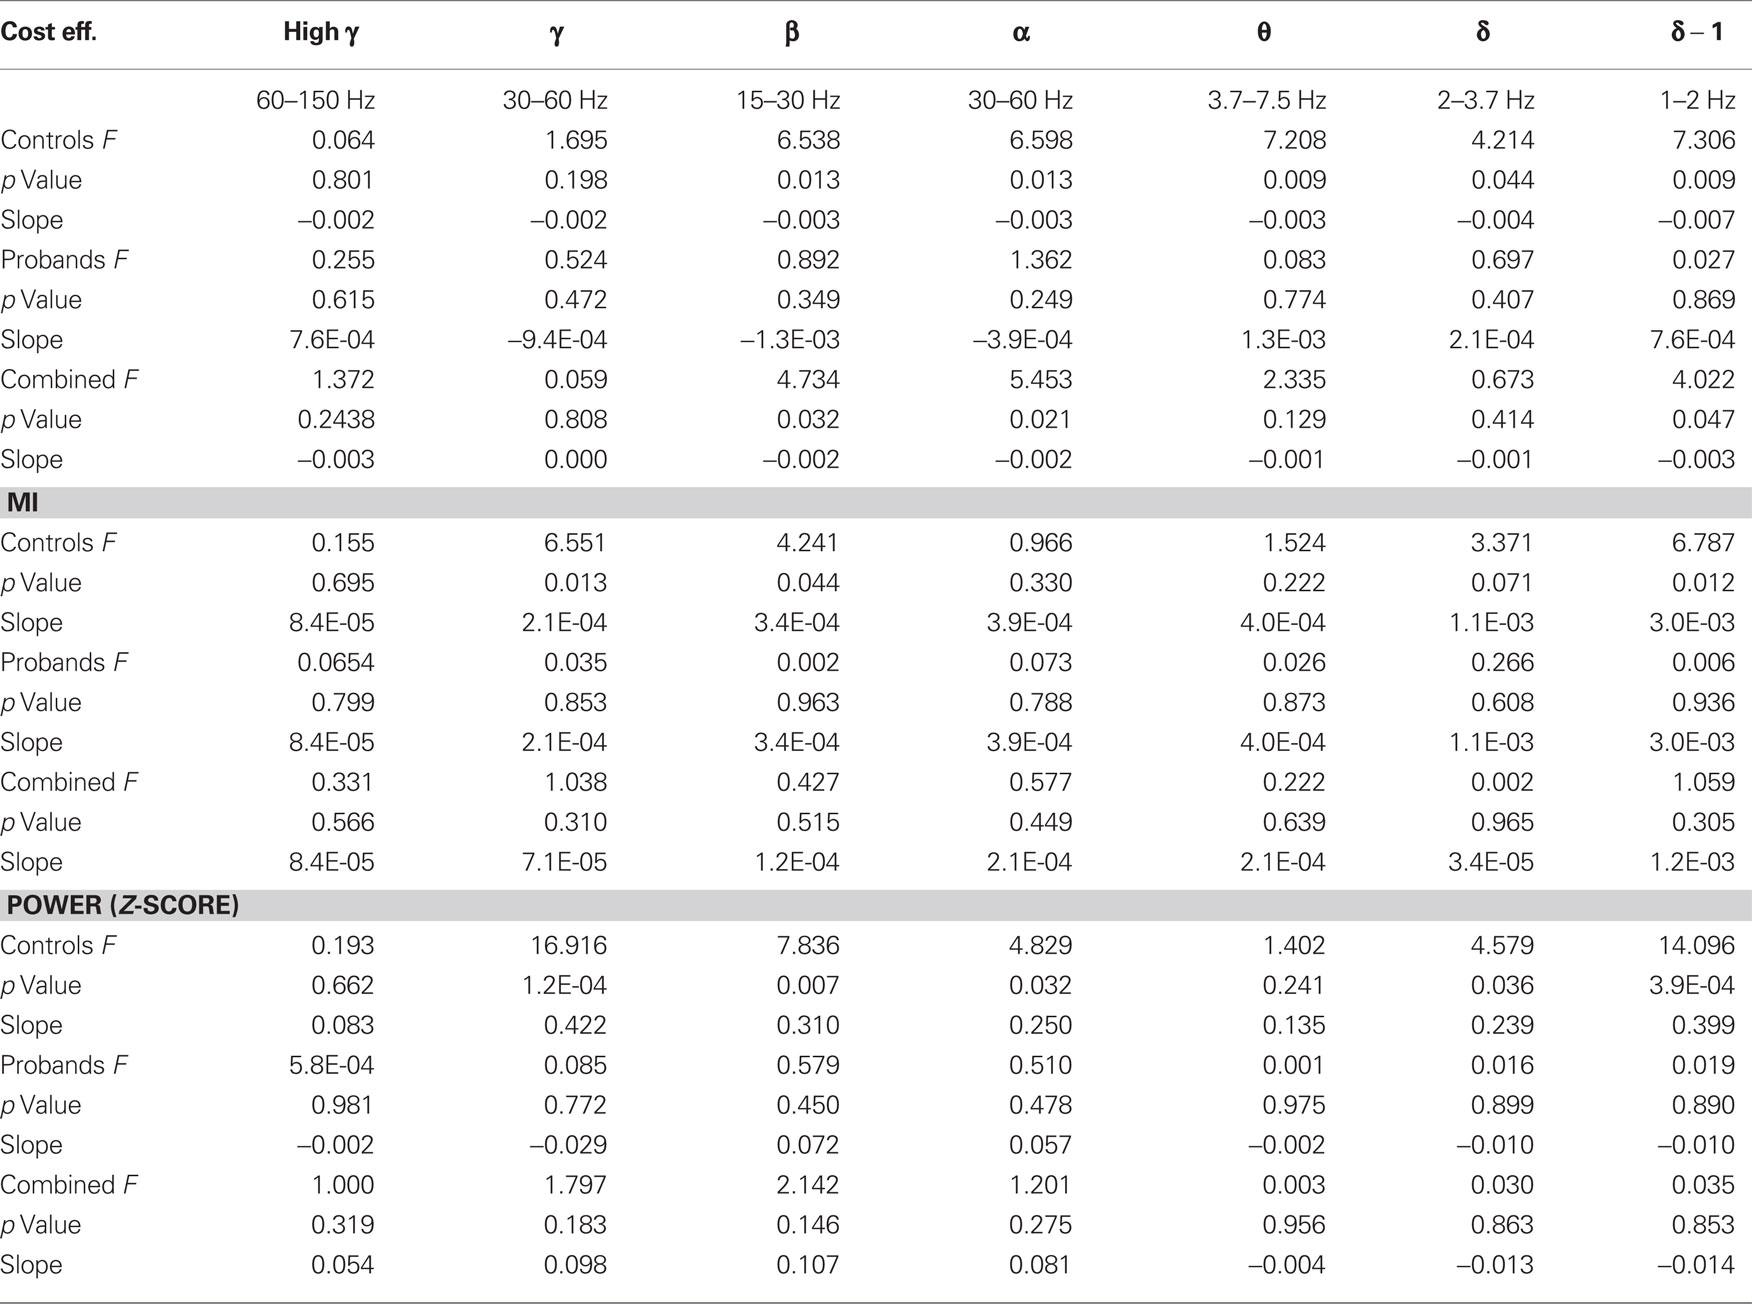
Table 2. General linear model of global metrics and performance in the six frequency bands for controls (n = 7) and patients with schizophrenia (n = 6) after practice.
Correlations with Pre-Practice Accuracy
Cost efficiency
Previous results in working memory performance have indicated that beta-band cost efficiency can be related to task accuracy (Bassett et al., 2009). We therefore began by determining whether cost-efficiency across the six frequency bands was correlated with task accuracy. In the present study, we indeed found that accuracy before practice was correlated negatively with global cost efficiency in the beta band for the combined subjects (p = 3.0E-5, Bonferroni corrected; Figure 3A; Table 1), indicating that subjects with less cost efficient network organization performed better on this auditory processing task. Cost efficiency was also positively correlated with accuracy for the combined subjects in the low delta band (p = 0.005).
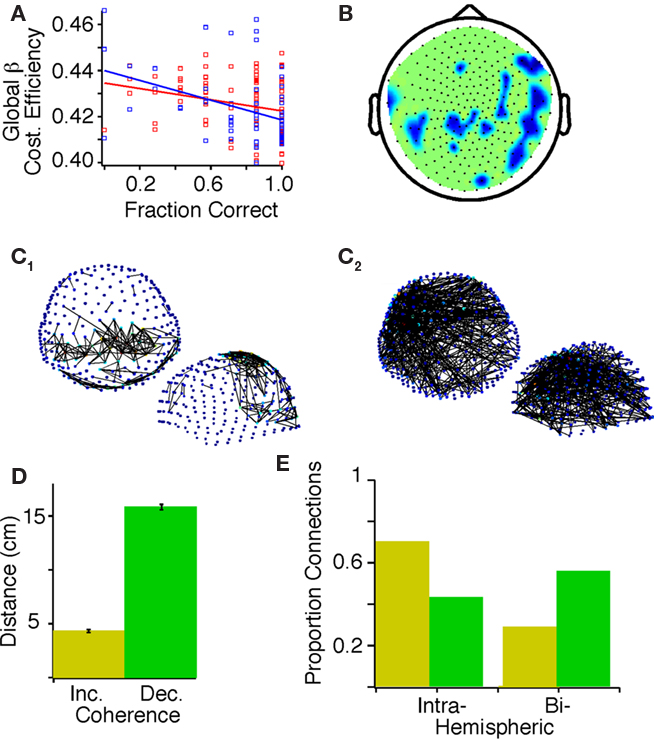
Figure 3. Correlations between task accuracy and graph theoretical measures of activity in the beta band before practice in probands and control subjects. (A) Task accuracy within a block of seven trials negatively correlated with global beta cost efficiency in controls (red, F = 6.87, p = 0.01) and probands (blue, F = 11.22, p = 0.0014). (B) Topology plot showing regions where accuracy correlated negatively with local beta cost efficiency (Holms–Bonferroni p < 1.8E-4), darker colors indicate a steeper slope of the general linear model. (C) Positive (C1) and negative (C2) correlations of accuracy before practice in probands and controls with mutual information between sensors (top view above, side view below, false discovery rate (FDR), p < 7.895E-4). Color of the node indicate indicates the number of connections on a gradient from dark blue to light red. (D) The mean and SD of the physical distance between sensor pairs showing statistically significant positive (yellow) and negative (green) correlations between MI and accuracy. (E) The proportion of sensor pairs that are intra- and bi-hemispheric exhibiting positive (yellow) and negative (green) correlations between MI and accuracy.
Cost efficiency is a relatively new graph measure, and we therefore asked whether the relationship with accuracy extended to other more classical measures of network organization including the characteristic clustering coefficient (γ, a measure of local connectivity), path length (λ, a measure of global integration), and small worldness (σ, a combined measure of segregation and integration). We did not observe a correlation between accuracy and σ (p = 0.88), γ (p = 0.95), or λ (p = 0.76) in the beta band for the combined subjects (Latora and Marchiori, 2001; Watts and Strogatz, 1998), suggesting that cost-efficiency measures an independent property of brain function.
After confirming global relationships between cost efficiency and accuracy, we sought to characterize the regional specificity of these results. We focused on the beta band since global beta-band cost efficiency was highly negatively correlated with performance in the combined subjects. A negative correlation between accuracy and local beta-band cost efficiency was identified for a contiguous region of right temporo-parietal sensors, and a similar but less contiguous region of left temporo-parietal sensors (Figure 3B).
Mutual information
While graph theoretical measures provide insight into the broad patterns of connectivity, simpler measurements can be made of the strength of connectivity by examining the bivariate pairwise MI at the sensor level. In the beta band, improved accuracy with practice correlated with increased MI between sensors primarily in temporo-parietal areas (Figure 3C1). We also observed negative correlations between accuracy and MI between sensors distributed across the scalp, with network hubs evident in the left inferior frontal region (Figure 3C2). Sensor pairs that exhibited a negative correlation between MI and accuracy were separated by a mean distance of 15.832 ± 0.25 cm, whereas sensor pairs that exhibited a positive correlation between MI and accuracy were separated by a mean distance of 4.321 ± 0.15 cm (p < 0.001; Figure 3D) and less were inter-hemispheric (Figure 3E).
Power
While graph theoretical diagnostics and MI measure characteristics of connectivity, the univariate power provides insight into the strength of the activity itself. We therefore extended our examination to the univariate level where we asked whether power in sensor and source space was correlated with task performance and accuracy in the pre-practice dataset.
Focusing first on the beta band, in sensor space we observed a positive correlation between task accuracy and global beta-band power in the combined subjects (p = 2.0 10−4). The sensors involved were likely close to left sensorimotor cortex (Figure 4A). A positive correlation between gamma power and accuracy was also evident (p = 0.001), and the sensors involved were in the temporo-parietal region bilaterally (Figure 4B).
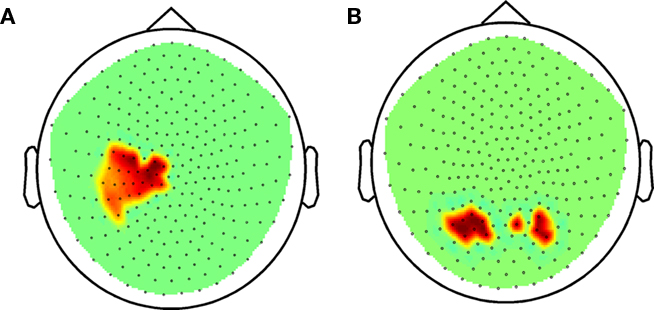
Figure 4. Beta-band power during task performance before practice in probands and control subjects combined. (A) Correlation between accuracy and beta power in sensor space (Holms–Bonferroni p < 1.8E-4). (B) Correlation between accuracy and gamma power in sensor space (FDR p < 0.00366).
Correlations with Post-Practice Accuracy
Following practice, accuracy no longer correlated with global cost efficiency, MI, or power across any bands (Table 2).
Correlations with Practice-Related Change in Accuracy
Our primary findings were derived by directly comparing the pre- and post-training datasets to identify changes associated with practice. A correlation between Δaccuracy and Δglobal cost efficiency was not evident (Table 3). However, Δaccuracy positively correlated with beta-band ΔMI (Figure 5A1) between sensors located primarily in temporo-parietal regions (Figure 5A2). Also, Δaccuracy positively correlated with Δglobal power in the low delta band (p = 0.008). In the beta and gamma bands of interest there was a positive correlation between Δaccuracy and Δlocal power at left temporo-parietal sensors (Figure 5B).
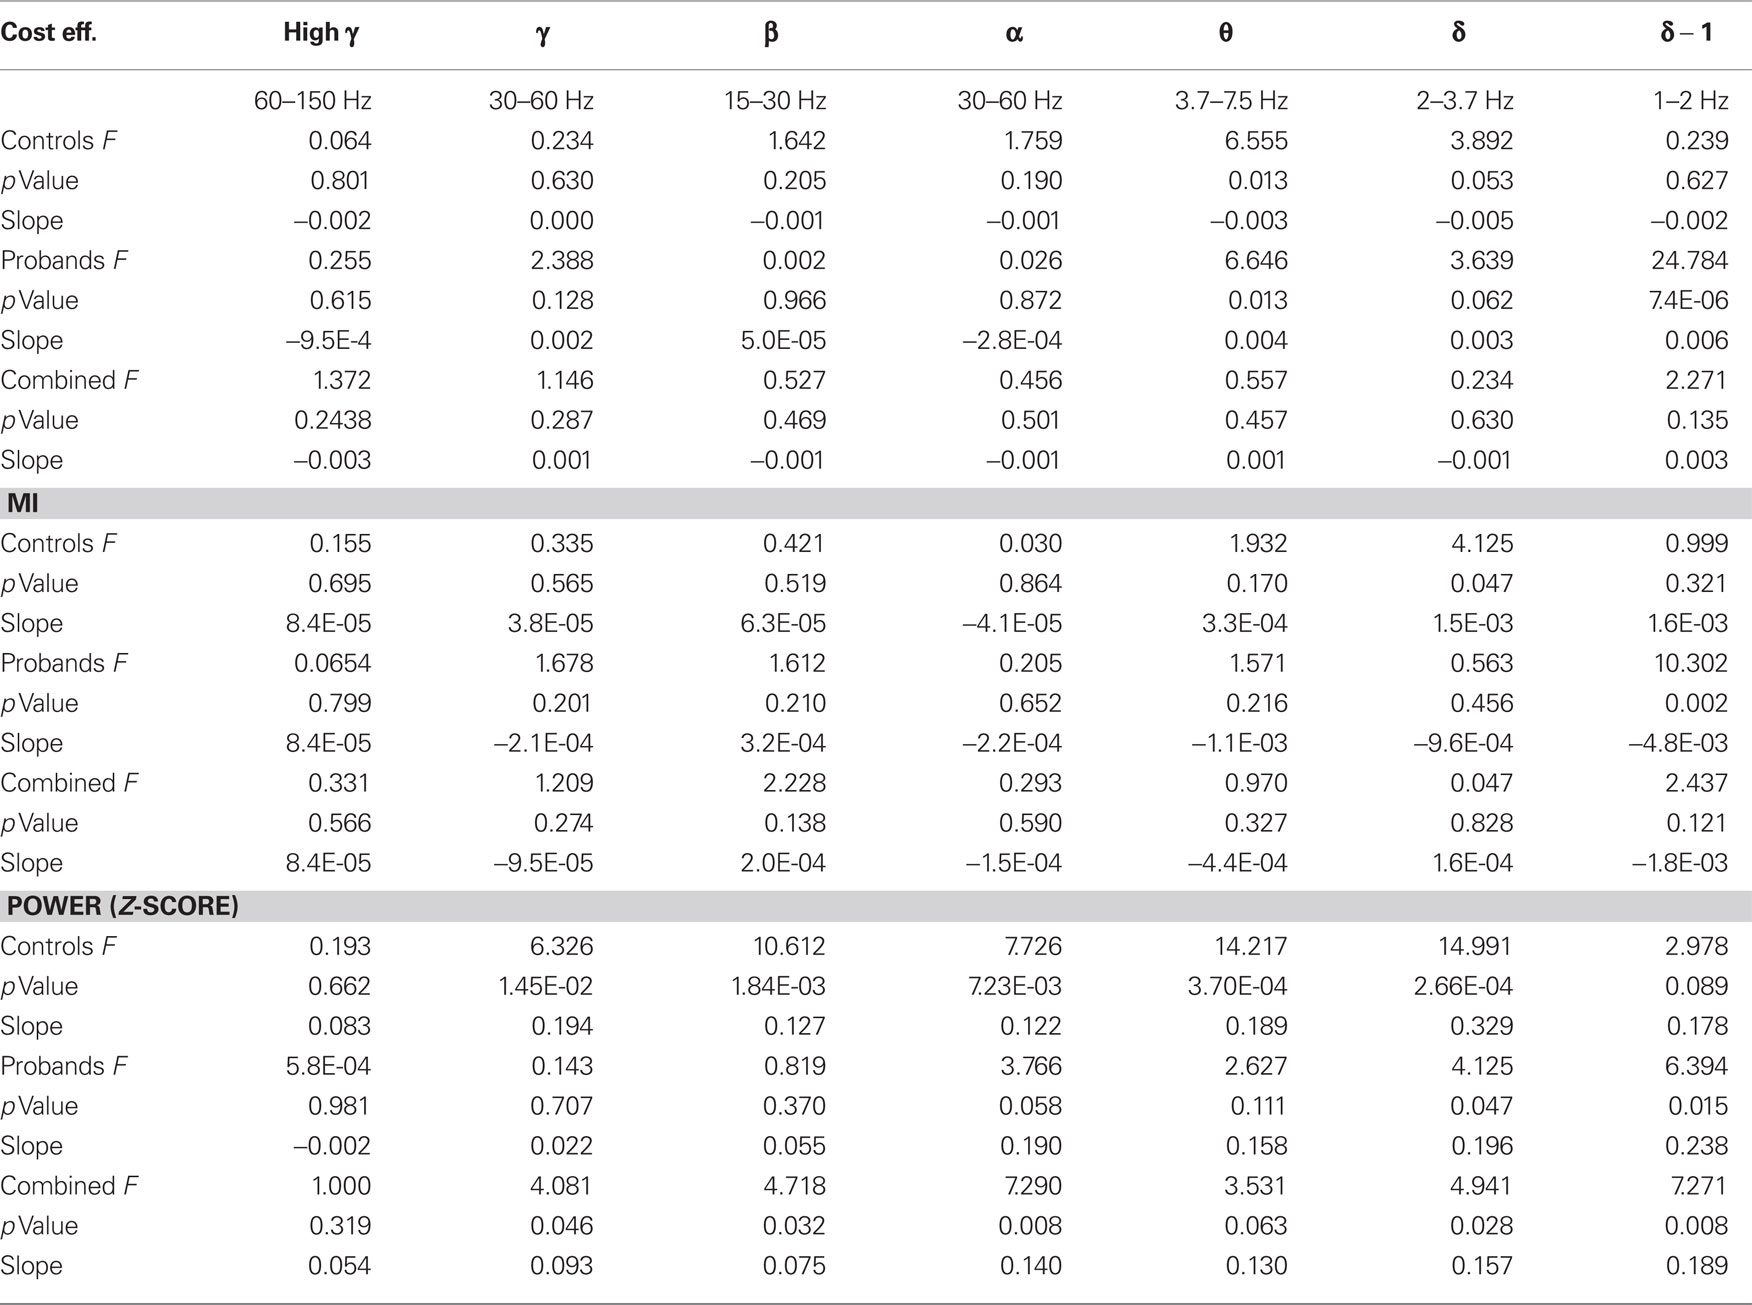
Table 3. General linear model of Δglobal metrics and Δperformance with practice in the six frequency bands for controls (n = 7) and patients with schizophrenia (n = 6).
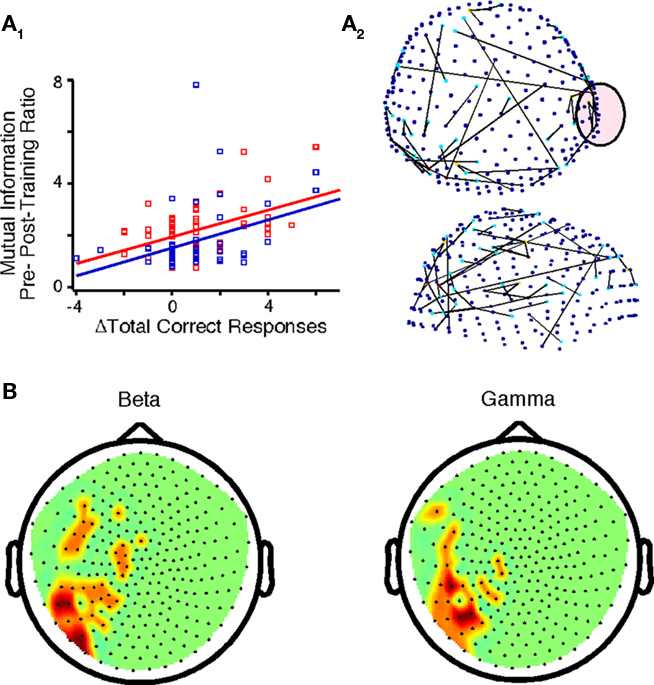
Figure 5. Changes in functional brain networks after practice for controls and probands. (A1) Correlations between Δaccuracy and ΔMI for controls (F = 17.34, p < 1.0E-4) and probands (F = 21.15, p < 2.75E-5) in the encircled sensor in (A2). (A2) Top and side view of sensors that exhibited the above correlation for all subjects in the beta band (FDR p < 7.0E-5). (B) Nodes in which Δaccuracy correlated positively with Δpower for all subjects in the beta and gamma frequency bands (p < 0.0037).
Differences between Probands and Controls in Parameter Associations with Task Accuracy
Despite the small size of our patient and control cohorts, we also examined the differences between the two groups with respect to parameter associations with task accuracy before and after practice. These are preliminary results and should be interpreted as exploratory. Before practice, in the control subjects the correlation between accuracy and beta-band cost efficiency was not significant after correction for multiple comparisons (p = 0.01), but the correlation was significant in the probands alone (p = 0.001). Only controls exhibited a negative correlation between accuracy and gamma (p = 0.006), as well as theta (p = 0.002), band cost efficiency. In contrast, in probands we observed a positive correlation between accuracy and cost efficiency in the high-gamma- (p = 3.76E-6), theta- (p = 0.003), high delta- (p = 0.002), and low delta- (p = 6.2E-8), bands (Table 1).
In the pre-practice recordings, accuracy correlated with global beta-band power in both controls (p = 0.007) and probands (p = 0.006). In the gamma band we observed a strong correlation between accuracy and global power in controls (p = 2 10−4), but not in probands (p = 0.48; Table 1). We also observed significant correlations between delta band power and accuracy, but in opposing directions in controls and probands (Table 1).
In the post-practice recordings, a negative trend between accuracy and global beta-band cost efficiency was evident in the control subjects but did not reach significance with Bonferroni correction (p = 0.013). Among the control subjects, local cost efficiency in the beta-band correlated with performance in several contiguous nodes, which also correlated with accuracy before practice (Figure 6A). After practice, MI was positively correlated with accuracy between sensors primarily in temporo-parietal regions (Figure 6B). The density of connections was markedly decreased compared with the network derived from the pre-practice dataset. No correlations between accuracy and beta-band cost efficiency or MI were evident in the probands post-practice dataset.
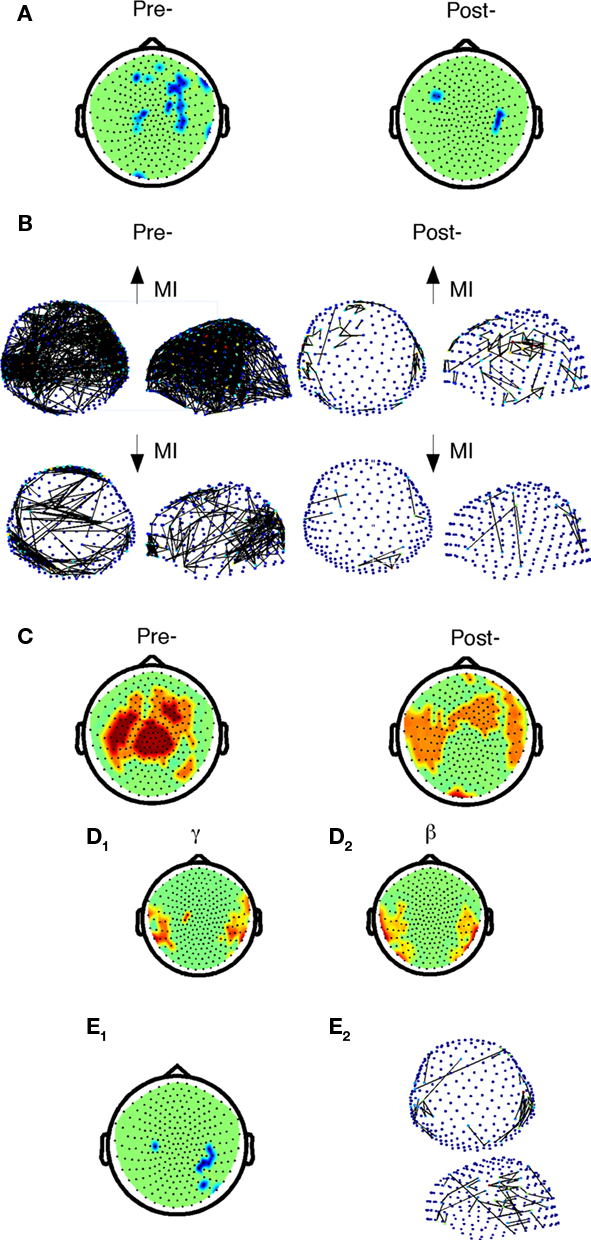
Figure 6. Comparison of beta-band cost efficiency and power correlations with accuracy before and after practice in control subjects. (A) Negative correlations of accuracy with beta-band local cost efficiency (Holms–Bonferroni p < 1.8E-4) before and after practice. (B) Positive (top) and negative (below) correlations of accuracy and mutual information between sensors before (FDR p < 0.0017) and after practice (FDR p < 1.5E-4) in controls only. (C) Positive correlations of accuracy with beta-band power (dark red, Holms–Bonferroni p < 1.8E-4, light red, FDR p < 0.0036). (D) Nodes in which Δaccuracy correlated positively with Δpower among control subjects after practice in the gamma (D1), and beta (D2) frequency bands. (E1) Nodes in which Δaccuracy negatively correlated with Δlocal cost efficiency in control subjects (FDR, p < 0.0037). (E2) Top and side view of sensors that exhibited a positive correlation between Δaccuracy and ΔMI for controls in the beta band (FDR p < 5.9E-5).
With regards to power, in the control subjects after practice, global power was also found to correlate positively with performance in the gamma (p = 1.2 10−4), beta (p = 0.007), and low delta bands (p = 2 10−4). The local distribution of sensors exhibiting this correlation in the beta-band partially overlapped before and after practice, but after practice involved more temporal sensors (Figure 6C). In the probands, no correlations between accuracy and power were evident in the post-practice dataset.
Control subjects also exhibited different correlations with practice-related changes in accuracy then the probands. In control subjects, we identified a positive correlation between Δaccuracy and Δglobal power in beta (p = 0.0018), alpha (p = 0.0072), theta (p = 0.0004), and high delta (p = 0.0003) bands. In the beta and gamma bands, Δaccuracy correlated with Δlocal power in the beta and gamma bands at temporo-parietal nodes bilaterally (Figure 6D). In the control subjects, there was a negative correlation between Δaccuracy and Δlocal-cost efficiency in the beta band for several contiguous temporal–parietal nodes (Figure 6E1). In addition, Δaccuracy correlated with beta-band ΔMI (Figure 6E2) in control subjects between bilateral sensors located primarily in temporo-parietal regions. Probands exhibited a positive correlation between Δaccuracy and Δglobal cost efficiency in the low delta band, but did not exhibit correlations between Δaccuracy and local cost efficiency or power in the beta, or gamma bands.
Source Space Analysis: Improved Localization in Bands of Interest
For the second component of our analysis, we analyzed the raw data using sliding window SAM to reconstruct the sources of power for the bands of interest (beta and gamma) in space and time during task execution.
Pre-Practice source space analysis
We found that during the first stimulus presentation, the most significant beta-band power increases occurred in the anterior cingulate cortex, the left middle temporal lobe, and the left angular gyrus (Figure 7A). Approximately 300 ms following the first stimulus presentation, there was a decrease in stimulus beta-band power in left sensorimotor cortex that persisted even after the button press at 1895 ± 372 ms (Figure 7B; Movies S1 and S2 in Supplementary Material) for the 800 inter-stimulus-interval (ISI) trials. Also, around the time of the button press, increased beta-band power was evident in the occipital and rostroventral prefrontal regions.
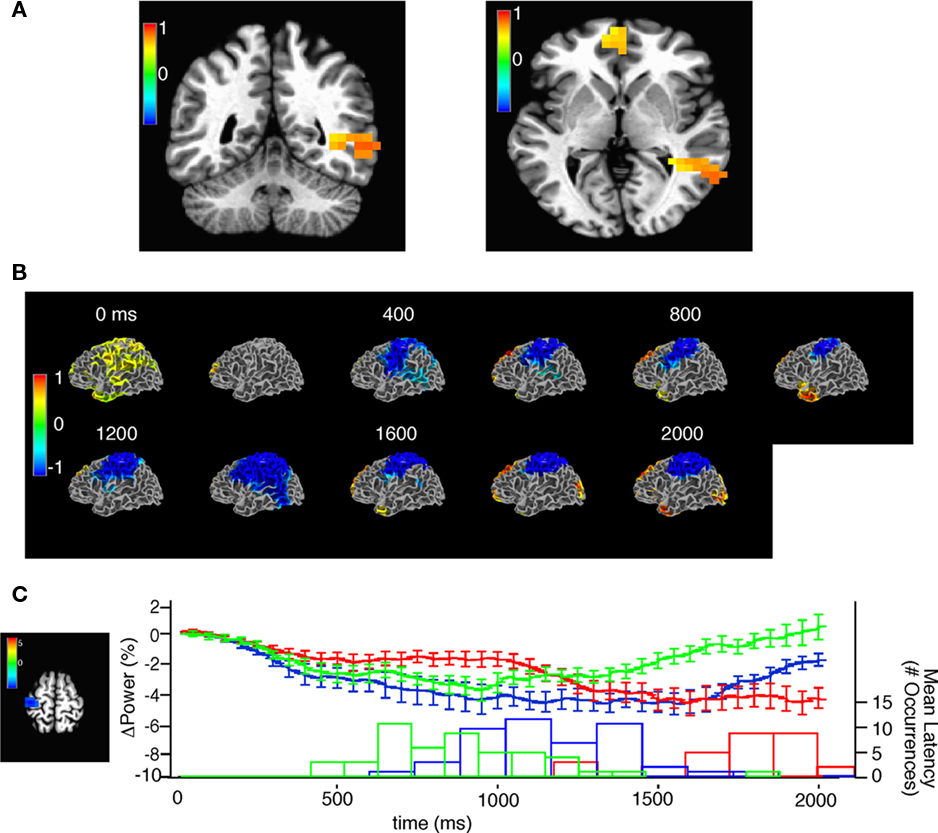
Figure 7. Source space analysis of beta power during task performance. (A) Two views of single window SAM showing beta-band power increases from −110 to 290 ms after the onset of the first stimulus, note that the stimulus is 130 ms in duration. Color bar indicates pseudo F-statistic, images thresholded at q (false discovery rate) < 0.05. (B) Sliding window SAM showing beta-band activity during task performance. In combined subjects. Note that the first, and second stimuli occur at 0 and 930 ms respectively and the average response time was at 1895 ms. Color bar indicates normalized power ratio (p < 0.01). (C) Beta-band desynchronization in motor cortex is related to response latency. (Left) voxels chosen for analysis of beta-band desynchronization with a p < 0.001, color bar indicates pseudo-F ratio. (Top) mean ± SEM beta-band power in the region of interest for trials with an 800 (red), 400 (blue), and 200 (green) ms inter-stimulus interval. (Bottom) histogram of the mean response latency for the corresponding trials.
We next examined whether response latency influenced the timing of the beta-band decrease seen during task performance. Recordings from trials using an 800, 400, and 200 ms ISI were separated and we calculated the time course and magnitude of the beta band in the left motor cortex. We choose the left motor cortex in part because around the mean response time decreases in beta were most significant in this region (Figure 7C). In trials with an ISI of 200 ms, response latency was reduced relative to the trials with an ISI of 800 ms. Consequently the beta decrease recovered faster in the 200-ms ISI trials relative to the 400 ms (p = 0.0076), and 800 ms ISI trials (p = 0.0029) at the end of the first 2 s of the trial (Figure 7C) indicating that response latency is correlated with the decrease in beta power in the motor cortex.
Sliding window SAM analysis in the combined subjects also showed diffuse gamma activation after the first stimulus, followed by a decrease in activity in the left sensorimotor region that persisted until the button press (Movies S3 and S4 in Supplementary Material).
In the high-gamma band, SAM demonstrated sequential activation of different brain areas appropriate to task performance (Figure 8A; Movies S5 and S6 in Supplementary Material). Approximately 100 ms after the onset of the first sound stimulus, we observed increased high-gamma power diffusely in the right and left superior temporal gyrus and sulcus (Figure 8B), and in the right precuneus, left motor, middle, and inferior frontal gyri (Figure 8C). Approximately 275 ms after stimulus termination we observed a return back to prestimulus levels (Figures 8A,B). Before the second stimulus and approximately 500 ms after the first stimulus there was a decrease in high-gamma power in the left DLPFC and temporal pole that persisted throughout the trial (Figure 8A). Next, 80 ms after the second sound stimulus, we observed increased high-gamma power in the right superior temporal gyrus and sulcus lasting 250 ms after stimulus termination (Figure 8B). Finally, 575 ms after the onset of the second sound we observed an increase in high-gamma power in the left sensorimotor cortex presumably in the representation of the right hand; the button press occurred an average of 390 ms later (Figure 8A). Accuracy positively correlated with mean high-gamma power in a cluster encompassing portions of the motor cortex and the middle and inferior frontal gyri (R = 0.85, F = 56.97, p = 1.95E-05; Figure 8C).
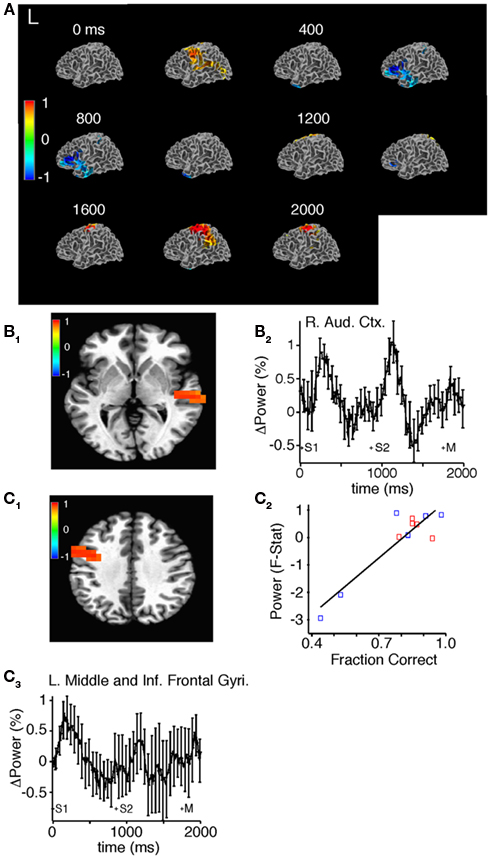
Figure 8. Source space analysis of high-gamma power during task performance before practice in all subjects. (A) Sliding window SAM of high-gamma band during task performance. Color bar indicates normalized power ratio (p < 0.01). (B) Normalized power ratio vs. time in the right auditory cortex in all subjects. S1, S2, and M, refer to the first, and second sound stimulus, and the button press, respectively. (C1,C2) Linear regression of mean power (pseudo F-statistic) and accuracy for all subjects in a region encompassing the left motor cortex, and the middle and inferior frontal gyri (R = 0.85, F = 56.97, p = 1.95E-05). (C3) Normalized power ratio in this region across time for all subjects combined.
In addition to single band power we performed sliding window SAM analysis of broad-band power during task performance. Broadband power demonstrated diffuse increases in temporo-parietal regions during the first stimulus, followed by a decrease in activity in parietal regions and an increase in activity in frontal regions that persisted until the button press (Movies S7 and S8 in Supplementary Material).
Source space comparisons between pre- and post-practice
Using a SAM analysis, we identified a significant increase in broad-band power following practice in the left angular gyrus (Figure 9A1) during and after presentation of the second stimulus (Figure 9A2; p = 2.92E-5, at 1.53 s after onset of the first sound). However, we did not observe statistically significant changes in any sub-bands. To determine if the increase in broadband power after practice was due to an increase in stimulus evoked power alone we used event-related SAM (erSAM). erSAM detected power increases around the first (0–400) and second (800–1200) sound in the right auditory cortex (Figure 9B1). When we compared power in the right auditory cortex before and after training, we found no change for the 0–400 ms (p = 0.45) and 800–1200 ms intervals (p = 0.30); see Figure 9B2.
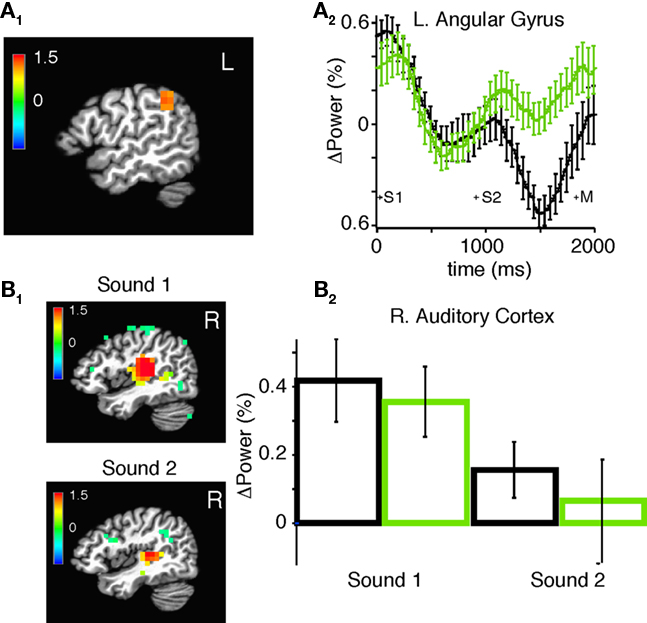
Figure 9. Changes in broadband power in source space after practice. (A1) SAM showing regions of practice-induced increases in total power in all frequency bands at 950–1350 ms after the onset of the second stimulus for all subjects combined. Color bar indicates pseudo F-statistic, image thresholded at p < 0.001. (A2) Mean normalized power in the left angular gyrus before (black) and after (green) practice among all subjects. (B1) Event-related SAM showing regions of statistically significant power change during and after the first (0–400 ms) and second stimulus (800–1200). Color bar indicates pseudo F-statistic, image thresholded at p < 0.05. (B2) Mean and SEM of normalized power in the right auditory cortex before (black) and (after) practice during and after the first and second stimulus.
Discussion
We used MEG to investigate whether practicing a computer-based auditory cognitive remediation task would influence functional brain networks operating in the low delta through high-gamma frequency bands in healthy volunteers and patients with schizophrenia. We hypothesized that cost efficiency, a graph theoretical measure based on MI between MEG sensors, would correlate with task accuracy and thereby characterize the functional network involved in pitch discrimination before and after practice. Indeed, cost efficiency of the beta-band network was negatively correlated with task accuracy for probands and controls before practice, and a similar trend was also found among control subjects when the experiment was repeated following practice. Since our sample size was small and we did not observe task performance differences between probands and controls, we did not focus our analysis on characterizing differences between groups. When we compared the before and after practice data sets for all subjects, we found that improved accuracy after practice correlated with increased MI in the beta-band between sensors in temporo-parietal regions. Also, among control subjects improved accuracy correlated with decreased local cost efficiency in the beta band. Therefore, our results support the notion that practice-induced improvements in accuracy in pitch discrimination correlate with changes in the MI between brain signals recorded by temporal–parietal sensors in the beta band, but not changes in global network structure.
To further understand the significance of functional brain network structure, we supplemented our MI-based analysis with SAM analysis, which provides greater spatial accuracy. SAM analysis of beta power showed increases in brain regions important in auditory processing (Haenschel et al., 2000), and decreases in region important for sensorimotor integration (Engel and Fries, 2010). One possible interpretation of these findings is that network structure, which correlates with accuracy, regulates the integration of segregated beta-band mediated processes in different brain areas (Bassett et al., 2009). It is important to be aware in utilizing this methodological analysis, that a field produced by a single source spreads to multiple sensors, and therefore it is possible for coherence (i.e., MI data) to be contaminated by artifact. Yet, artifact is unlikely to completely explain the reported changes in connectivity that correlate with accuracy because sources associated with field spread may be constant across variations in accuracy (Schoffelen and Gross, 2009).
A role for the beta band in a pitch discrimination task is not surprising in light of the diverse functional roles of the beta band, including maintaining the status quo for sensorimotor integration (Engel and Fries, 2010), top-down attentional processing (Buschman and Miller, 2007), and working memory processing (Bassett et al., 2009; Palva et al., 2010). Increased working memory load has been shown to increase clustering of functional networks in the beta band (Palva et al., 2010), and performance on the visual N-back task was shown to correlate with increased global cost efficiency (Bassett et al., 2009), potentially due to the global network maintaining a more metabolically efficient state. We found that pitch discrimination task accuracy negatively correlated with beta-band cost efficiency for the combined subjects before practice. The direction of this relationship is in contrast to Bassett et al. (2009), who reported that increased cost efficiency correlated with optimal performance on the N-back task. However, task demands in the two studies differed dramatically. First, N-back engages visuo-spatial working memory systems while the auditory discrimination task engages the phonological system (Baddeley, 2003). Second, the N-back paradigm requires maintenance of information and resistance to distraction across items, while each auditory discrimination task item is discrete.
Our results suggest that prior to practice, pitch discrimination accuracy is optimized with dense short-range connections within bilateral temporo-parietal regions associated with auditory processing, but not between discrete components of the complete network. These short-range connections may be based on neuronal synchrony originating in local cytoarchitecture and monosynaptic circuits (Varela et al., 2001). Such circuits may be at least in part localized to the planum temporale and execute computations critical to pitch discrimination and memory (Griffiths and Warren, 2002). Also, complementary long-range connections between the left frontal gyrus and frontal–temporal regions correlated negatively with performance in the beta band. Importantly, such long-range connections likely rely on cortico–cortico and cortico-thalamic polysynaptic pathways, which may become less active when phonological rehearsal (Baddeley, 2003; Schulze et al., 2009) becomes less essential for task performance.
While our MI-based analysis of pitch discrimination is unique, SAM may prove advantageous in future studies as its spatial accuracy approaches that of fMRI (Rinne et al., 2009), yet its temporal resolution is much greater. Furthermore by combining sensor-space-based correlations between power and task accuracy with SAM analysis we can speculate that before practice there is a positive correlation between accuracy and beta-band power in sensors closest to the left sensorimotor cortex. One possible explanation for this correlation is that accuracy is related to response uncertainty, which in a prior study that utilized a visually cued reaching task was found to correlate with the magnitude of beta-band desynchronization (Tzagarakis et al., 2010).
Also, in the high-gamma band we found that power changes closely correlated with the informational demands of the task (Jerbi et al., 2009; Hinkley et al., 2010a; Uhlhaas et al., 2010), for example the power increased in auditory regions following each stimulus (Edwards et al., 2005; Steinschneider et al., 2008; Griffiths et al., 2010), and in the left motor cortex during the button press (Crone et al., 1998). However, in the case of the power increase in the auditory cortex, it is unclear if it is exclusively event related. Furthermore, the high correlation between pre-practice task performance and high-gamma activity in a region encompassing the right motor cortex, as well as the middle, and the inferior frontal gyri suggests that these regions may play an integrative role in pitch processing.
After practice we observed a scarcity of correlations between accuracy and parameters. We did not identify a correlation between accuracy and cost efficiency across any bands. One possible reason for the marked difference with respect to the pre-practice dataset may be that a majority of the practice-related reconfigurations of the functional brain networks were independent of task performance. Our methodology was not able to directly detect such reconfigurations. Another potential reason for a loss of correlations may be that a number of subjects had near-perfect performance across all blocks of trials after practice. However, in control subjects, we did still observe a trend between accuracy and beta-band cost efficiency. In addition, the MI network structure that was correlated with post-practice accuracy in control subjects exhibited hubs in temporo-parietal regions similar to the pre-practice dataset.
With regards to changes in correlations between accuracy and power after practice among control subjects, correlations with beta occurred in a similar spatial distribution in sensor space as in the pre-practice dataset. However correlations in sensors overlying temporal regions were increasingly evident after practice.
In comparing the post- and pre-practice data sets, broadband power was increased in the left angular gyri. This region has been previously implicated in auditory memory in pitch processing (Rinne et al., 2009; Schulze et al., 2009). It has been previously reported that the auditory evoked potential magnitude increases following hours of practice (van Wassenhove and Nagarajan, 2007; Tong et al., 2009). However, our erSAM analysis indicates that in our experiment, the auditory evoked potential did not involve the angular gyrus and did not change following practice. One possible reason we did not observe an increase in the evoked potential in our study is that the delay between practice and testing was variable and in some cases substantial. In sensor space we found that increased power in gamma- and beta-bands in left temporo-parietal sensors correlated with improved performance suggesting that increased power in the angular gyrus may be behaviorally relevant to practice and improvement.
Improved performance after practice correlated with increased connectivity in the beta-band between sensors primarily in temporo-parietal regions. We did not observe a correlation between improved performance and decreased global beta-band cost efficiency. Perhaps more extensive practice would have extended functional reconfigurations beyond the local networks, to the global network architecture.
In prior studies, auditory (Penolazzi et al., 2010) and somatosensory (Liu and Ioannides, 2004) practice have been previously shown to produce changes in power in the beta and gamma band. Also, increased beta coherence was found to be associated with cognitive recovery in acquired brain injury (Castellanos et al., 2010). It is reasonable to hypothesize that practice-induced synaptic plasticity underlies these meso-scale changes. Further work will seek additional evidence that changes in power and coherence in the beta and gamma band are associated with improved performance after practice and could provide a foundation for the development of cognitive remediation strategies that specifically target and counteract defined behavioral and neurophysiological deficits (Edwards et al., 2010; Hinkley et al., 2010b). However, in the present work, we did not identify behavioral deficits in our probands.
Analyzing MEG data across dimensions by examining power in sensor, and source space, as well as MI between sensors, and graph metrics effectively demonstrated how global and local networks contribute to accurate auditory discrimination. With the use of SAM, we were able to obtain an improved spatial and temporal understanding of this network. A possible future application of our integrative approach is identifying differences in functional brain networks during auditory task performance among large samples of healthy volunteers and patients with schizophrenia. With regards to this study, our data lends additional evidence to the notion that coherence-based graph metrics such as cost efficiency are relevant to behavior (Bassett et al., 2009), and that local functional brain networks based on MI between brain regions might adapt with practice.
Materials and Methods
Ten healthy volunteers and seven people with schizophrenia (diagnosed according to the Diagnostic and Statistical Manual of Mental Disorders IV criteria) were recruited as part of the Clinical Brain Disorders Branch/National Institute of Mental Health Genetic Study of Schizophrenia. Healthy volunteers had no structural MRI abnormalities or history of psychiatric illness, depression, or loss of consciousness. All patients were receiving antipsychotic drugs and other medication at the time of the study; none of the healthy volunteers were taking psychoactive medication. Three patients had changes in medication during the study. One patient was prescribed lithium, another patient was prescribed a reduced clozapine dose, and the third patient was prescribed a reduced venlafaxine dose. The mean WAIS estimated Full Scale IQ was 81.4 ± 3.82 for the probands (n = 5), and 108.43 ± 2.89 for the control subjects (n = 7).
The participants gave informed consent in writing, pursuant to protocols approved by the National Institute of Mental Health Institutional Review Board. We included patients specifically because we hoped to investigate cognitive remediation in this target population. MEG data were acquired at the National Institute of Mental Health using a 275-channel CTF MEG system (VSM MedTech) with a sampling rate of 600 Hz and third order gradient active noise cancelation.
The experimental paradigm was derived from the “High or Low” task, a component of the Brain Fitness Program (Posit Science, San Francisco, CA, USA), consisting of two 125 ms frequency modulated tones with a base frequency of approximately 500, 1000, or 2000 Hz, with a peak intensity of 87–93 dB that either increased or decreased in frequency (Fisher et al., 2009). The ISI between the stimuli was varied by experimental block. Following stimulus presentation the subject had 4 s to make two selections using a hand held controller with two buttons corresponding to increasing and decreasing frequency, respectively. A response was only considered correct if the subject classified both stimuli. Nine blocks of trials were performed for each subject. Each block consisted of stimuli with a consistent base frequency. For example, blocks 1–3 consisted of stimuli with base frequencies of 500, 1000, and 2000 Hz, respectively, and this was also the case for blocks 4–6, and 7–9. Furthermore, blocks 1–3, 4–6, and 7–9 had ISIs of 800, 400, and 200 ms, respectively. The purpose of altering the stimuli and ISIs by block was to match the stimulus set each subject would encounter during practice. Each block consisted of nine trials. Across the nine blocks, which varied with respect to the ISI and the frequency of the stimuli, we found no differences in accuracy (1D ANOVA, F = 0.280, p = 0.972, df = 8). Measurements were therefore pooled across blocks for subsequent analysis.
Following the first MEG recording, patients and controls were instructed on how to practice the “High or Low” task using the Brain Fitness Program. The sounds in the program were identical in frequency to those used during the MEG recording but in some cases differed in duration. The “High or Low” task uses an algorithm in which task difficulty is adaptively modulated following an initial diagnostic session and then on the basis of the subject’s performance. The program provides arbitrary progress bars to indicate improvements through practice: more progress bars indicated a shorter duration of both the stimuli and the ISIs. Inpatients were supervised and monitored during practice sessions lasting for 30 min to 1-h. In contrast, volunteers practiced the task unsupervised and self-reported both practice time and progress. All subjects were asked to train for four to six consecutive days between MEG recording sessions. Six of the 7 patients completed practice, whereas only 7 out of 10 control subjects completed practice.
For coherence and graph theoretical analysis, eye blinks were removed from the raw data recorded by an automated process involving demarcation using a threshold detection function, followed by a principal components analysis based signal space separation. The data was then filtered to attenuate background low-frequency artifact and line noise at 60 Hz by using a 0.3-Hz-width filter, a low-pass filter with a cutoff of 150 Hz, and a high pass filter with a cutoff of 0.15 Hz. The MEG data preprocessing was performed using CTF (VSM MedTech) and FieldTrip software (F. C. Donders Centre for Cognitive Neuroimaging, Nijmegen, The Netherlands). To improve localization specificity, data was transformed into planar space by using FieldTrip software. The time series were then resampled to 120 Hz, and truncated to 34.133 s to constrain the frequency bands of the wavelet transform to conform to the classical EEG frequency bands of interest. A discrete wavelet transform using the Daubechies (4) wavelet was applied to each time series, with further analysis being performed only on wavelet coefficients at levels 1–6, corresponding approximately to classical EEG frequency bands from gamma to low delta (see Table S1 in Supplementary Material). For the high-gamma band, the raw time series was passed through a low-pass filter with a cutoff of 150 Hz before applying the planar transform and was not filtered further. Next, we estimated the MI of the wavelet coefficients of each pair of sensors at each frequency interval in each of the nine blocks of trials and normalized the pairwise MI according to Strehl and Joydeep, 2002. This resulted in a set of normalized MI (association) matrices representing the frequency-band specific functional connectivities between all pairs of sensors for each subject and recording block. The average MI of a network was defined as the average MI over all possible pairs of sensors, N. By applying a range of binary thresholds, each MI association matrix was then converted to a series of adjacency matrices, or graphs, G, with variable connection density or cost, C, (Bassett et al., 2006, 2009; Deuker et al., 2009) where:

and N is the number of nodes. For each cost interval of size 0.01 in the range 0.01 < C < 1.0, the regional efficiency E(i) was computed for each node in the graph.

where N indicates the index region, j ≠ i denotes a node connected to i, and Li,j is the minimum path length between nodes i and j. In other words, regional efficiency is inversely related to minimum path length: a region with high efficiency will have short minimum path length to all other nodes in the graph. The regional cost efficiency was calculated as the maximum of the function [E(i) − k], where k is the degree or number of edges connecting the ith region to the rest of the network (Latora and Marchiori, 2001; Achard and Bullmore, 2007). The global cost efficiency was calculated as the mean regional cost efficiency across all nodes.
Small worldness σ was calculated as (σ = γ/λ) where γ = E(i)/E(i)_random and λ = E(G)/E(G)_random, where the global efficiency E(G) (Latora and Marchiori, 2001) was computed for each graph as:

For the computation of E(i)_random and E(G)_random, we calculated 100 random networks with the same degree distribution as the real cortical networks using the Brain Connectivity Toolbox (Rubinov and Sporns, 2010).
All statistical comparisons and computations were performed in Matlab (MathWorks Inc., www.mathworks.com/). Statistical tests performed on all sensors and on the MI association matrix (Hemmelmann et al., 2005) were reported for three levels of stringency: FDR as defined by Benjamini and Hochberg (1995), a more stringent false positive correction p < 1/N, and the Holm–Bonferroni correction.
SAM Analysis
In order to estimate task-related source activity we used a SAM beamforming technique (Vrba and Robinson, 2001). More specifically, we used a sliding window dual-state SAM analysis in different frequency ranges (Cornwell et al., 2008). One proband could not be used for SAM analysis because of technical problems with the head tracking coils. The frequency ranges of interest were beta (15–30 Hz), gamma (30–60 Hz), high gamma (60–150 Hz), and broadband (0.9–150 Hz). In single window SAM, a pseudo-F ratio is calculated to estimate the source strength in the active window compared to the control window. This calculation is performed for each of the 5.0-mm voxels in each participant’s brain. For the sliding SAM analysis used here, a small active window of some size was shifted by a fixed time (10 ms) over the whole duration of the time window of interest (2 s following the first tone), and the SAM analysis was performed repeatedly for each active window. The control window was fixed to the same-sized time segment immediately preceding the first active window. The resulting SAM images were then concatenated to produce a time series.
More specifically, for the high-gamma band for example, the control window was from −0.225 to −0.075 s relative to the stimulus onset. The first active window was from −0.075 to 0.075 s, and the last active window was from 1.925 to 2.075 s relative to the stimulus onset. The window sizes were adjusted to 200, 300, and 400 ms, for the gamma, beta, and broadband frequency ranges, respectively. Unless otherwise noted, the first block – with an ISI of 800 ms – was used for this sliding SAM analysis, as these trials were the longest in duration, and thus offered the cleanest separation of brain activations.
In order to examine the source of evoked fields, erSAM was used, in which each subject’s trials are averaged before the pseudo-F ratio is calculated.
For all group analyses, the activation images were normalized to produce a z-score. AFNI (Cox, 1996) was used to view the images, perform group analyses, and construct the ROIs used to extract the time series.
Conflict of Interest Statement
The authors declare that the research was conducted in the absence of any commercial or financial relationships that could be construed as a potential conflict of interest.
Supplementary Material
The Movies 1–8 for this article can be found online at http://www.frontiersin.org/human_neuroscience/10.3389/fnhum.2011.00081/abstract/
Movie S1. Left sided beta-band power during task performance computed with sliding window synthetic aperture magnetometry (p < 0. 01).
Movie S2. Right sided beta-band power during task performance computed with sliding window synthetic aperture magnetometry (p < 0. 01).
Movie S3. Left sided gamma-band power during task performance computed with sliding window synthetic aperture magnetometry (p < 0. 01).
Movie S4. Right sided gamma-band power during task performance computed with sliding window synthetic aperture magnetometry (p < 0. 01).
Movie S5. Left sided high-gamma band power during task performance computed with sliding window synthetic aperture magnetometry (p < 0. 01).
Movie S6. Right sided high-gamma band power during task performance computed with sliding window synthetic aperture magnetometry (p < 0. 01).
Movie S7. Left sided broad-band power during task performance computed with sliding window synthetic aperture magnetometry (p < 0. 01).
Movie S8. Right sided broad-band power during task performance computed with sliding window synthetic aperture magnetometry (p < 0. 01).
Footnote
- ^This research was supported by the Intramural Research Program of the NIMH.
References
Achard, S., and Bullmore, E. (2007). Efficiency and cost of economical brain functional networks. PLoS Comput. Biol. 3, e17. doi: 10.1371/journal.pcbi.0030017
Adcock, R. A., Dale, C., Fisher, M., Aldebot, S., Genevsky, A., Simpson, G. V., Nagarajan, S., and Vinogradov, S. (2009). When top-down meets bottom-up: auditory training enhances verbal memory in schizophrenia. Schizophr. Bull. 35, 1132–1141.
Baddeley, A. (2003). Working memory: looking back and looking forward. Nat. Rev. Neurosci. 4, 829–839.
Bassett, D. S., Bullmore, E. T., Meyer-Lindenberg, A., Apud, J. A., Weinberger, D. R., and Coppola, R. (2009). Cognitive fitness of cost-efficient brain functional networks. Proc. Natl. Acad. Sci. U.S.A. 106, 11747–11752.
Bassett, D. S., Meyer-Lindenberg, A., Achard, S., Duke, T., and Bullmore, E. (2006). Adaptive reconfiguration of fractal small-world human brain functional networks. Proc. Natl. Acad. Sci. USA 103,19518–19523.
Benjamini, Y., and Hochberg, Y. (1995). Controlling the false discovery rate: a practical and powerful approach to multiple testing. J. R. Stat. Soc. Series B Stat. Methodol. 57, 289–300.
Bressler, S. L., Coppola, R., and Nakamura, R. (1993). Episodic multiregional cortical coherence at multiple frequencies during visual task performance. Nature 366, 153–156.
Bullmore, E., and Sporns, O. (2009). Complex brain networks: graph theoretical analysis of structural and functional systems. Nat. Rev. Neurosci. 10, 186–198.
Bullock, T. H., McClune, M. C., Achimowicz, J. Z., Iragui-Madoz, V. J., Duckrow, R. B., and Spencer, S. S. (1995). Temporal fluctuations in coherence of brain waves. Proc. Natl. Acad. Sci. U.S.A. 92, 11568–11572.
Buonomano, D. V., and Merzenich, M. M. (1998). Cortical plasticity: from synapses to maps. Annu. Rev. Neurosci. 21, 149–186.
Buschman, T. J., and Miller, E. K. (2007). Top-down versus bottom-up control of attention in the prefrontal and posterior parietal cortices. Science 315, 1860–1862.
Castellanos, N. P., Paúl, N., Ordóñez, V. E., Demuynck, O., Bajo, R., Campo, P., Bilbao, A., Ortiz, T., del-Pozo, F., and Maestú, F. (2010). Reorganization of functional connectivity as a correlate of cognitive recovery in acquired brain injury. Brain 133(Pt 8), 2365–2381.
Cavanagh, J. F., Cohen, M. X., and Allen, J. J. (2009). Prelude to and resolution of an error: EEG phase synchrony reveals cognitive control dynamics during action monitoring. J. Neurosci. 29, 98–105.
Cornwell, B. R., Johnson, L. L., Holroyd, T., Carver, F. W., and Grillon, C. (2008). Human hippocampal and parahippocampal theta during goal-directed spatial navigation predicts performance on a virtual Morris water maze. J. Neurosci. 28, 5983–5990.
Cox, R. W. (1996). AFNI: software for analysis and visualization of functional magnetic resonance neuroimages. Comput. Biomed. Res. 29, 162–173.
Crone, N. E., Miglioretti, D. L., Gordon, B., and Lesser, R. P. (1998). Functional mapping of human sensorimotor cortex with electrocorticographic spectral analysis. II. Event-related synchronization in the gamma band. Brain 121(Pt 12), 2301–2315.
David, O., Cosmelli, D., and Friston, K. J. (2004). Evaluation of different measures of functional connectivity using a neural mass model. Neuroimage 21, 659–673.
Deuker, L., Bullmore, E. T., Smith, M., Christensen, S., Nathan, P. J., Rockstroh, B., and Bassett, D. S. (2009). Reproducibility of graph metrics of human brain functional networks. Neuroimage 47, 1460–1468.
Dickinson, D., Goldberg, T. E., Gold, J. M., Elvevåg, B., and Weinberger, D. R. (2010a). Cognitive factor structure and invariance in people with schizophrenia, their unaffected siblings, and controls. Schizophr. Bull.. doi: 10.1093/ schbul/sbq018. [Epub ahead of print].
Dickinson, D., Tenhula, W., Morris, S., Brown, C., Peer, J., Spencer, K., Li, L., Gold, J. M., and Bellack, A. S. (2010b). A randomized, controlled trial of computer-assisted cognitive remediation for schizophrenia. Am. J. Psychiatry 167, 170–180.
Edwards, B. G., Barch, D. M., and Braver, T. S. (2010). Improving prefrontal cortex function in schizophrenia through focused training of cognitive control. Front. Hum. Neurosci. 4:32. doi: 10.3389/fnhum.2010.00032
Edwards, E., Soltani, M., Deouell, L. Y., Berger, M. S., and Knight, R. T. (2005). High gamma activity in response to deviant auditory stimuli recorded directly from human cortex. J. Neurophysiol. 94, 4269–4280.
Engel, A. K., and Fries, P. (2010). Beta-band oscillations – signalling the status quo? Curr. Opin. Neurobiol. 20, 156–165.
Fisher, M., Holland, C., Merzenich, M. M., and Vinogradov, S. (2009). Using neuroplasticity-based auditory training to improve verbal memory in schizophrenia. Am. J. Psychiatry 166, 805–811.
Gaab, N., Gaser, C., and Schlaug, G. (2006). Improvement-related functional plasticity following pitch memory training. Neuroimage 31, 255–263.
Gaab, N., Gaser, C., Zaehle, T., Jancke, L., and Schlaug, G. (2003). Functional anatomy of pitch memory – an fMRI study with sparse temporal sampling. Neuroimage 19, 1417–1426.
Griffiths, T. D., Kumar, S., Sedley, W., Nourski, K. V., Kawasaki, H., Oya, H., Patterson, R. D., Brugge, J. F., and Howard, M. A. (2010). Direct recordings of pitch responses from human auditory cortex. Curr. Biol. 20, 1128–1132.
Griffiths, T. D., and Warren, J. D. (2002). The planum temporale as a computational hub. Trends Neurosci. 25, 348–353.
Haenschel, C., Baldeweg, T., Croft, R. J., Whittington, M., and Gruzelier, J. (2000). Gamma and beta frequency oscillations in response to novel auditory stimuli: a comparison of human electroencephalogram (EEG) data with in vitro models. Proc. Natl. Acad. Sci. U.S.A. 97, 7645–7650.
Hemmelmann, C., Horn, M., Susse, T., Vollandt, R., and Weiss, S. (2005). Concepts of multiple tests and their use for evaluating high-dimensional EEG data. J. Neurosci. Methods 142 209–217.
Hinkley, L. B., Nagarajan, S. S., Dalal, S. S., Guggisberg, A. G., and Disbrow, E. A. (2010a). Cortical temporal dynamics of visually guided behavior. Cereb. Cortex 21, 519–529.
Hinkley, L. B., Owen, J. P., Fisher, M., Findlay, A. M., Vinogradov, S., and Nagarajan, S. S. (2010b). Cognitive impairments in schizophrenia as assessed through activation and connectivity measures of magnetoencephalography (MEG) data. Front. Hum. Neurosci. 3:73. doi: 10.3389/neuro.09.073.2009
Huffaker, S. J., Chen, J., Nicodemus, K. K., Sambataro, F., Yang, F., Mattay, V., Lipska, B. K., Hyde, T. M., Song, J., Rujescu, D., Giegling, I., Mayilyan, K., Proust, M. J., Soghoyan, A., Caforio, G., Callicott, J. H., Bertolino, A., Meyer-Lindenberg, A., Chang, J., Ji, Y., Egan, M. F., Goldberg, T. E., Kleinman, J. E., Lu, B., and Weinberger, D. R. (2009). A primate-specific, brain isoform of KCNH2 affects cortical physiology, cognition, neuronal repolarization and risk of schizophrenia. Nat. Med. 15, 509–518.
Javitt, D. C. (2009). Sensory processing in schizophrenia: neither simple nor intact. Schizophr. Bull. 35, 1059–1064.
Jerbi, K., Ossandón, T., Hamamé, C. M., Senova, S., Dalal, S. S., Jung, J., Minotti, L., Bertrand, O., Berthoz, A., Kahane, P., and Lachaux, J. P. (2009). Task-related gamma-band dynamics from an intracerebral perspective: review and implications for surface EEG and MEG. Hum. Brain Mapp. 30, 1758–1771.
Keefe, R. S., Vinogradov, S., Medalia, A., Silverstein, S. M., Bell, M. D., Dickinson, D., Ventura, J., Marder, S. R., and Stroup, T. S. (2010). Report from the working group conference on multisite trial design for cognitive remediation in schizophrenia. Schizophr. Bull. doi: 10.1093/schbul/sbq010. [Epub ahead of print].
Latora, V., and Marchiori, M. (2001). Efficient behavior of small-world networks. Phys. Rev. Lett. 87, 198701.
Liu, L., and Ioannides, A. A. (2004). MEG study of short-term plasticity following multiple digit frequency discrimination training in humans. Brain Topogr. 16, 239–243.
McGurk, S. R., Mueser, K. T., DeRosa, T. J., and Wolfe, R. (2009). Work, recovery, and comorbidity in schizophrenia: a randomized controlled trial of cognitive remediation. Schizophr. Bull. 35, 319–335.
Ohnishi, T., Matsuda, H., Asada, T., Aruga, M., Hirakata, M., Nishikawa, M., Katoh, A., and Imabayashi, E. (2001). Functional anatomy of musical perception in musicians. Cereb. Cortex 11, 754–760.
Palva, S., Monto, S., and Palva, J. M. (2010). Graph properties of synchronized cortical networks during visual working memory maintenance. Neuroimage 49, 3257–3268.
Penolazzi, B., Spironelli, C., Vio, C., and Angrilli, A. (2010). Brain plasticity in developmental dyslexia after phonological treatment: a beta EEG band study. Behav. Brain Res. 209, 179–182.
Rinne, T., Koistinen, S., Salonen, O., and Alho, K. (2009). Task-dependent activations of human auditory cortex during pitch discrimination and pitch memory tasks. J. Neurosci. 29, 13338–13343.
Rubinov, M., and Sporns, O. (2010). Complex network measures of brain connectivity: uses and interpretations. Neuroimage 52, 1059–1069.
Schoffelen, J. M., and Gross, J. (2009). Source connectivity analysis with MEG and EEG. Hum. Brain Mapp. 30, 1857–1865.
Schulze, K., Gaab, N., and Schlaug, G. (2009). Perceiving pitch absolutely: comparing absolute and relative pitch possessors in a pitch memory task. BMC Neurosci. 10, 106. doi: 10.1186/1471-2202-10-106
Steinschneider, M., Fishman, Y. I., and Arezzo, J. C. (2008). Spectrotemporal analysis of evoked and induced electroencephalographic responses in primary auditory cortex (A1) of the awake monkey. Cereb. Cortex 18, 610–625.
Strehl, A., and Joydeep, G. (2002). Cluster ensembles – a knowledge reuse framework for combining multiple partitions. J. Mach. Learn Res. 3, 583–617.
Tallal, P. (2004). Improving language and literacy is a matter of time. Nat. Rev. Neurosci. 5, 721–728.
Temple, E., Deutsch, G. K., Poldrack, R. A., Miller, S. L., Tallal, P., Merzenich, M. M., and Gabrieli, J. D. (2003). Neural deficits in children with dyslexia ameliorated by behavioral remediation: evidence from functional MRI. Proc. Natl. Acad. Sci. U.S.A. 100, 2860–2865.
Tong, Y., Melara, R. D., and Rao, A. (2009). P2 enhancement from auditory discrimination training is associated with improved reaction times. Brain Res. 1297, 80–88.
Tzagarakis, C., Ince, N. F., Leuthold, A. C., and Pellizzer, G. (2010). Beta-band activity during motor planning reflects response uncertainty. J. Neurosci. 30, 11270–11277.
Uhlhaas, P. J., Pipa, G., Neuenschwander, S., Wibral, M., and Singer, W. (2010). A new look at gamma? High- (>60 Hz) γ-band activity in cortical networks: function, mechanisms and impairment. Prog. Biophys. Mol. Biol. 105, 14–28.
van Wassenhove, V., and Nagarajan, S. S. (2007). Auditory cortical plasticity in learning to discriminate modulation rate. J. Neurosci. 27, 2663–2672.
Varela, F., Lachaux, J. P., Rodriguez, E., and Martinerie, J. (2001). The brainweb: phase synchronization and large-scale integration. Nat. Rev. Neurosci. 2, 229–239.
Vrba, J., and Robinson, S. E. (2001). Signal processing in magnetoencephalography. Methods 25, 249–271.
Wang, L., Yu, C., Chen, H., Qin, W., He, Y., Fan, F., Zhang, Y., Wang, M., Li, K., Zang, Y., Woodward, T. S., and Zhu, C. (2010). Dynamic functional reorganization of the motor execution network after stroke. Brain 133(Pt 4), 1224–1238.
Warren, J. D., and Griffiths, T. D. (2003). Distinct mechanisms for processing spatial sequences and pitch sequences in the human auditory brain. J. Neurosci. 23, 5799–5804.
Watts, D. J., and Strogatz, S. H. (1998). Collective dynamics of ‘small-world’ networks. Nature 393, 440–442.
Keywords: cognitive remediation, schizophrenia, magnetoencephalography, graph theory, synthetic aperture magnetometry, practice, beta band, high gamma
Citation: Weiss SA, Bassett DS, Rubinstein D, Holroyd T, Apud J, Dickinson D and Coppola R (2011) Functional brain network characterization and adaptivity during task practice in healthy volunteers and people with schizophrenia. Front. Hum. Neurosci. 5:81. doi: 10.3389/fnhum.2011.00081
Received: 13 January 2011;
Accepted: 26 July 2011;
Published online: 17 August 2011.
Edited by:
Neal J. Cohen, University of Illinois, USAReviewed by:
Bradford C. Dickerson, Harvard Medical School, USADouglas O. Cheyne, Hospital for Sick Children, Canada
Copyright: © 2011 Weiss, Bassett, Rubinstein, Holroyd, Apud, Dickinson and Coppola. This is an open-access article subject to a non-exclusive license between the authors and Frontiers Media SA, which permits use, distribution and reproduction in other forums, provided the original authors and source are credited and other Frontiers conditions are complied with.
*Correspondence: Shennan Aibel Weiss, Department of Neurology, Columbia University, New York, NY, USA. e-mail: saw2164@columbia.edu