A stereological study of synapse number in the epileptic human hippocampus
- 1Department of Functional and Systems Neurobiology, Instituto Cajal (Consejo Superior de Investigaciones Cientificas), Madrid, Spain
- 2Laboratorio Cajal de Circuitos Corticales (Centro de Tecnología Biomédica), Universidad Politécnica de Madrid, Madrid, Spain
- 3Centro de Investigación Biomédica en Red sobre Enfermedades Neurodegenerativas, Madrid, Spain
- 4Veterinary Faculty, Department of Anatomy and Compared A. P., Universidad Complutense de Madrid, Madrid, Spain
Hippocampal sclerosis is the most frequent pathology encountered in resected mesial temporal structures from patients with intractable temporal lobe epilepsy (TLE). Here, we have used stereological methods to compare the overall density of synapses and neurons between non-sclerotic and sclerotic hippocampal tissue obtained by surgical resection from patients with TLE. Specifically, we examined the possible changes in the subiculum and CA1, regions that seem to be critical for the development and/or maintenance of seizures in these patients. We found a remarkable decrease in synaptic and neuronal density in the sclerotic CA1, and while the subiculum from the sclerotic hippocampus did not display changes in synaptic density, the neuronal density was higher. Since the subiculum from the sclerotic hippocampus displays a significant increase in neuronal density, as well as a various other neurochemical changes, we propose that the apparently normal subiculum from the sclerotic hippocampus suffers profound alterations in neuronal circuits at both the molecular and synaptic level that are likely to be critical for the development or maintenance of seizure activity.
Introduction
Temporal lobe epilepsy (TLE) is a common form of intractable epilepsy in which the most frequent pathology encountered in resected mesial temporal tissue is hippocampal sclerosis (Honavar et al., 1997). Surgical resection of the hippocampus in epileptic patients with hippocampal sclerosis is effective in reducing both the number and frequency of seizures. Therefore, it seems likely that the resected tissue contains the epileptogenic region (Falconer, 1974; Wieser et al., 1993, 2003; York et al., 2003). Accordingly, we would expect this resected tissue to contain changes in the synaptic circuits that contribute to epileptogenicity.
In general, hippocampal sclerosis is characterized by gliosis and neuronal loss, most prominently in the CA1 field, followed by the CA3 and CA2 fields, and the dentate gyrus (Houser, 1992; Honavar et al., 1997). Moreover, this neuronal loss and gliosis is accompanied by changes in the expression of a variety of molecules in the surviving cells, as well as by axonal reorganization involving both excitatory and inhibitory circuits (e.g., de Lanerolle et al., 1989; Sutula et al., 1989; Babb et al., 1991, 2000; Sloviter, 1991; Muñoz et al., 2002, 2007; Wittner et al., 2002; Arellano et al., 2004). Indeed, alterations to both the glutamatergic and GABAergic systems have been proposed to play a crucial role in the origin of epileptiform activity in TLE secondary to hippocampal sclerosis (Avoli, 1983).
In the sclerotic human hippocampus there is a general decrease in immunostaining for the vesicular glutamate transporter 1 (VGLUT1) in all the CA fields that experience severe neuronal loss (van der Hel et al., 2009). By contrast, VGLUT1 expression is strongly up-regulated in the dentate gyrus, which suggests that the alterations to the glutamatergic system are selective (van der Hel et al., 2009).
Alterations to the GABAergic system have often been described in the sclerotic CA1 field and in the adjacent subiculum, as suggested by the changes in the expression of the calcium binding protein parvalbumin (PV; Arellano et al., 2004; van Vliet et al., 2004; Wittner et al., 2005; Andrioli et al., 2007), of GABA receptors (Fritschy et al., 1999; Avoli et al., 2002; Muñoz et al., 2002), and of the Na+–K+–2Cl− co-transporter (NKCC) and K+–2Cl− co-transporter (KCC; Kang et al., 2002; Palma et al., 2006; Muñoz et al., 2007). However, the basic mechanisms underlying seizure activity in the TLE secondary to hippocampal sclerosis remains unclear, since some changes may be related to plastic compensatory mechanisms whereas others are due to the induction, maintenance and/or propagation of seizures. Moreover, it is hard to understand how the sclerotic hippocampus can be epileptogenic as there is a severe loss of CA1 pyramidal cells that predominantly project to the subiculum, the main output of the hippocampus. Thus, it has been proposed that the subiculum could be a hyperexcitable area that would amplify the few excitatory outputs from Ammon’s horn (Babb and Brown, 1986; Siegel et al., 1990; Wieser et al., 1993).
A general reduction in synaptic density in the human sclerotic hippocampus has been proposed based on the decrease of immunostained puncta for the synaptic protein synaptophysin (Proper et al., 2000). However, it is important to note that analyzing possible alterations in synaptic density based only on the changes in the number of immunostained axon terminals at the light microscopic level might merely reflect changes in the expression of the proteins studied. Although these immunocytochemical changes may be functionally relevant, they do not necessarily imply a loss of synapses. For this reason, how changes in the density of excitatory and inhibitory synapses may contribute to the epileptiform activity has not yet been fully addressed. Therefore, it is important to quantitatively analyze the number of excitatory and inhibitory synapses at the electron microscope level to study possible alterations in the balance between excitatory and inhibitory synapses. In general, asymmetric and symmetric synapses in the hippocampus are presumably excitatory (mostly glutamatergic) and inhibitory (mostly GABAergic), respectively. In addition, other neurotransmitters or modulatory compounds are present but they are by far very few compare to glutamatergic and GABAergic terminals (e.g., Kullman, 2007).
Hence, although it is relatively straightforward to perform stereological counts of excitatory (asymmetric) and inhibitory (symmetric) synapses, it is somehow surprising that the changes in density of these types of synapses have still not been assessed. Therefore, we have compared the overall density of excitatory and inhibitory synapses in non-sclerotic and sclerotic hippocampal tissue obtained by surgical resection to treat TLE. For this purpose, we have used correlative light and electron microscopy coupled with stereological techniques to accurately assess the possible changes in synaptic density in particular regions of the subiculum and CA1 that seem to be important in the development and/or maintenance of seizures in these patients.
Materials and Methods
Human postoperative brain tissue was obtained from seven patients (four men and three women) suffering intractable TLE. In all cases, the patient’s consent was obtained, in accordance with the Helsinki Declaration (WMA, 2008) and all protocols were approved by the ethical committee at the Hospital de la Princesa (Madrid, Spain).
These patients were suffering from partial complex and secondarily generalized seizures (age range: 20–45 years, average: 32, age of onset range: 0.7–20 years, average: 12, duration range: 7–28, average: 20; Table 1).
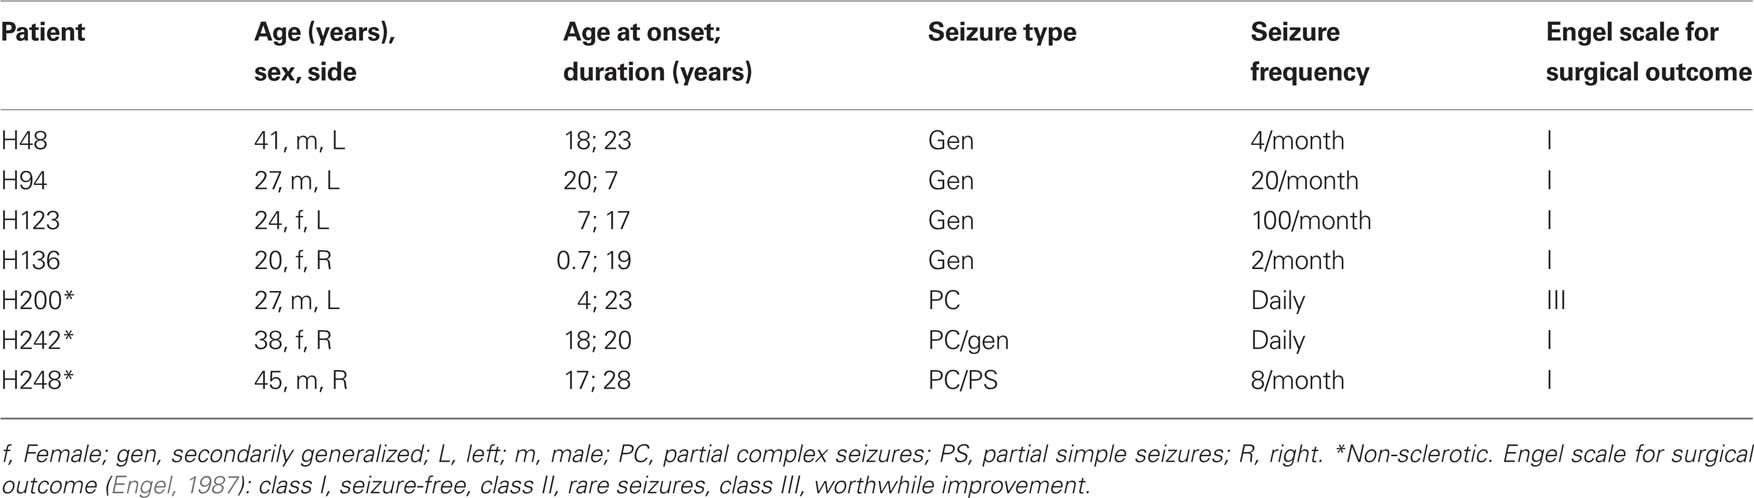
Table 1. Summary of the clinical data from the epileptic patients and the outcome of surgery.
The patients were evaluated prior to surgery according to Hospital de la Princesa’s protocol, as published elsewhere (Sola et al., 2005; Pastor et al., 2008). In all cases, tailored resection of the neocortex and the amygdalo-hippocampal area was carried out according to the electrocorticogram findings, and following the surgical technique described previously (Spencer and Engel, 1993). Immediately after removal, biopsy samples were fixed in cold 4% paraformaldehyde. Small blocks (∼15 mm × 10 mm × 10 mm) were obtained across the rostrocaudal extent of the hippocampal formation and they were immersed for 24–36 h at 4°C in a solution of 4% paraformaldehyde in 0.1 M phosphate buffer (pH 7.4, PB). Serial coronal vibratome sections (50 μm) were subsequently obtained from the blocks. The hippocampal tissue from these patients has also been used in previous studies (Arellano et al., 2004; Andrioli et al., 2007; Kastanauskaite et al., 2009). The surgical outcome of epileptic patients was evaluated, and all the patients were classified as grade I in the Engel scale (Engel, 1987) except one patient considered as grade III (Table 1).
Immunohistochemistry
Free-floating sections were initially treated for 30 min with 1% H202 to deplete the endogenous peroxidase activity, and then non-specific binding was blocked for 1 h in PB with 0.25% Triton-X and 3% horse serum (Vector Laboratories Inc., Burlingame, CA, USA). The sections were incubated overnight at 4°C with a mouse anti-neuron specific nuclear protein (NeuN, 1:2000; Chemicon, Temecula, CA, USA; Unal-Cevik et al., 2004) or a mouse antibody anti-PV (1:4000; Swant, Bellinzona, Switzerland; Celio, 1986), and they were then processed by the avidin–biotin method, using a biotinylated secondary antibody (1:200, Vector Laboratories, Burlingame, CA, USA) and the Vectastain ABC immunoperoxidase kit with 3,3′-diaminobenzidine tetrahydrochloride (DAB, Sigma-Aldrich, St Louis, MO, USA) as the chromogen. After staining, the sections were dehydrated, cleared with xylene and cover-slipped.
The specificity of the staining was controlled by processing selected sections after either replacing the primary antibody with preimmune horse serum, after omission of the secondary antibody, or after replacement of the secondary antibody with an inappropriate secondary antibody. No significant staining was detected under these control conditions.
To generate the figures, images were captured with a digital camera (Olympus DP70) attached to an Olympus light microscope (Olympus, Ballerup, Denmark), and Adobe Photoshop CS4 Extended 11.0.2 software (Adobe Systems, San Jose, CA, USA) was used to produce the figure plates.
Estimation of Neuronal Density
Neuronal density was estimated using a stereological method (optical dissectors; West and Gundersen, 1990) and with the aid of the Stereo Investigator software (StereoInvestigator 8.0, MicroBrightField Inc., Williston, VT, USA). Optical dissectors were applied to the Nissl-stained sections (50 μm thick) adjacent to those used to count the synapses. Since most neurons are located in the pyramidal cell layer, neuronal density was estimated in the entire pyramidal cell layer, both in the CA1 and subiculum. After randomly selecting a starting point, five sections were selected at equally spaced intervals. Optical dissectors were made with an oil immersion ×100 objective on a surface of 3600 μm2 and with a depth of 10 μm, rendering a study volume of 36,000 μm3 per optical dissector. A neuron was only counted if the nucleolus was clearly identified in the height of the optical plane along the z-axis.
Estimation of the Volume Fraction (Vv) of the Neuropil
Semithin sections (2 μm) stained with toluidine blue were used to estimate the volume fraction (Vv) occupied by the neuropil, which excluded blood vessels and cell bodies (including those from neurons and glia). For this purpose, 50-μm-thick sections adjacent to those used for histopathological assessment were embedded in araldite to obtain 2-μm-thick semithin sections. After randomly selecting a starting point, 6–10 sections were selected at equally spaced intervals. Estimates were performed in the entire pyramidal cell layer in the subiculum from sclerotic and non-sclerotic hippocampus. This was accomplished by point counting and by applying the Cavalieri principle (Gundersen et al., 1988) using the integrated Stereo Investigator stereological package (Version 8.0, MicroBrightField Inc., VT, USA) attached to an Olympus BX51 light microscope at 40× magnification.
Electron Microscopy
Sections for electron microscopy were post-fixed for 1 h in 2% glutaraldehyde in PB, treated in 1% osmium tetroxide, dehydrated and flat-embedded in Araldite resin.
Plastic-embedded sections were studied by correlative light and electron microscopy as described in detail elsewhere (DeFelipe and Fairen, 1982, 1993). Briefly, sections were photographed under the light microscope and then serially cut into semithin (2-μm-thick) sections with a Reichert ultramicrotome. The semithin sections were stained with 1% toluidine blue in 1% borax, examined under the light microscope, and photographed to locate the area of interest. Selected semithin sections were resectioned into serial ultrathin sections with a silver-gray interference color, corresponding to a thickness of approximately 60–70 nm (Peachey, 1958). The ultrathin sections were collected on formvar-coated, single-slot grids, stained with uranyl acetate and lead citrate, and examined using a JEOL 1200-EX electron microscope (JEOL Ltd., Tokyo, Japan). Using this correlative light and electron microscopy method it was possible to determine the exact region of the neuropil that was analyzed by electron microscopy and therefore, we could accurately identify the region analyzed.
Estimation of Synaptic Density
To estimate the synaptic density, photographs were taken randomly at ×30,000 with a digitalizing image system (MegaView III Side-Mounted TEM Camera, Soft Imaging System GmbH, Germany) using imaging acquisition software (analiSIS® 3.2, Soft Imaging System GmbH, Germany). At least 30 micrographs were obtained per region and case (see Alonso-Nanclares et al., 2008).The two major morphological types of cortical synapses were clearly identified in the cortical tissue analyzed, these being Gray’s type I and type II synapses (Gray, 1959), or those denominated asymmetric and symmetric by Colonnier (1968; for review see Peters et al., 1991; Peters and Palay, 1996). Asymmetric synapses had a prominent postsynaptic density while symmetric synapses had a thin postsynaptic density. The synapses where the synaptic cleft and associated membrane densities could not be clearly visualized (due to the oblique plane of section) were considered as uncharacterized synapses. Synapses were quantified in the thin neuropil (i.e., avoiding the neuronal and glial somata, blood vessels, large dendrites, and myelinated axons; DeFelipe et al., 1999).
The synaptic density per unit volume (NV) of the neuropil was calculated using the size–frequency method, which applies the formula: NV = NA/d, where NA is the number of synaptic profiles per unit area, and d the average cross-sectional length of synaptic junctions (DeFelipe et al., 1999; see also Merchan-Perez et al., 2009). The cross-sectional length of synaptic junctions was measured using the Image J analysis program (Scion Corporation, Frederick, MD, USA).
Statistical Analyses
Data analysis and statistical comparisons between the groups were performed using the unpaired Student’s t-test or U-Mann–Whitney non-parametric test, depending on whether the data sets fitted a normal distribution and passed the test for homogeneity of variances (Motulsky, 1995). Statistical comparisons between regions within a group were performed using the ANOVA or Kruskal–Wallis non-parametric test, depending on the data sets (Motulsky, 1995). All statistical studies were performed with the aid of the Graph Pad Prism statistical package (GraphPad Prism 5.0, Graph Pad Software, Inc., San Diego CA, USA).
Results
Light Microscopy
In this study, we established the cytoarchitectonic division of the hippocampal fields on the basis of previous descriptions (Amaral et al., 1990). The distinction between CA1 and subiculum was established by the clusters of modified pyramidal cells in the superficial aspect of the subiculum (the nomenclature used for each region examined is shown in Figure 1; according to Muñoz et al., 2007). Both in the non-sclerotic and sclerotic hippocampus, the area of the subiculum displayed an apparent normal aspect and is referred to as subiculum from non-sclerotic and from sclerotic hippocampi respectively, while the areas of the CA1 showing clear neuronal loss and gliosis will be referred to as the sclerotic CA1. Since the transition between the subiculum and CA1 is gradual and diffuse, this region is referred to as the transitional subiculum/CA1, and it was only contemplated for analysis in the sclerotic hippocampus (Figures 1 and 2).
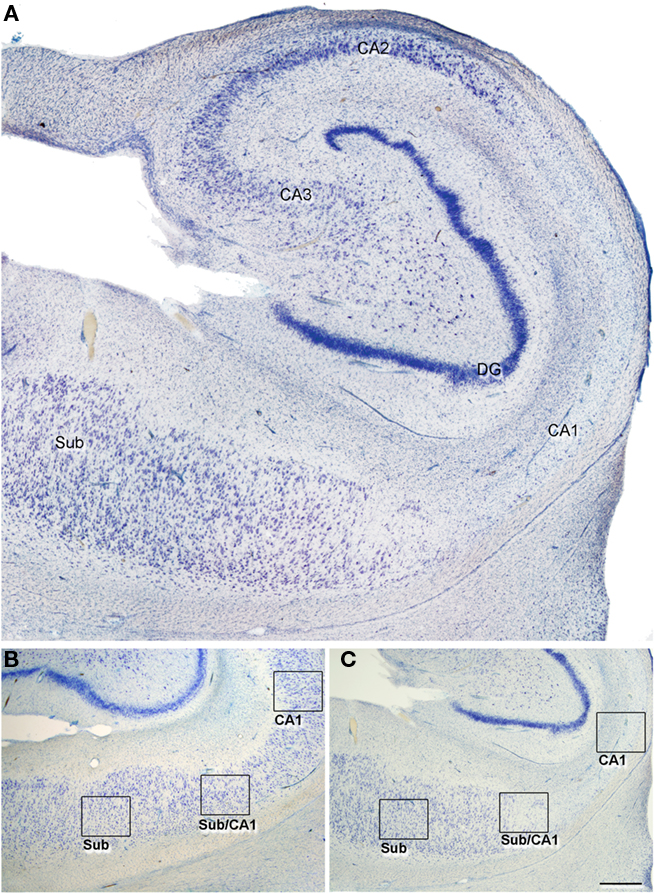
Figure 1. (A) Low-power photomicrograph of a Nissl-stained section to illustrate an sclerotic hippocampus at the level of the medial hippocampal formation. In all cases, the tissue used corresponded to a similar level. (B,C) Photomicrographs of Nissl-stained sections of a non-sclerotic (B) and a sclerotic hippocampal formation (C) illustrating the regions examined in the present study (indicated by boxes). CA1–3: cornu ammonis fields; DG, dentate gyrus; Sub, subiculum, Sub/CA1: transitional subiculum/CA1 region. Scale bar [in (B)]: 500 μm in (A), 1000 μm in (B,C).
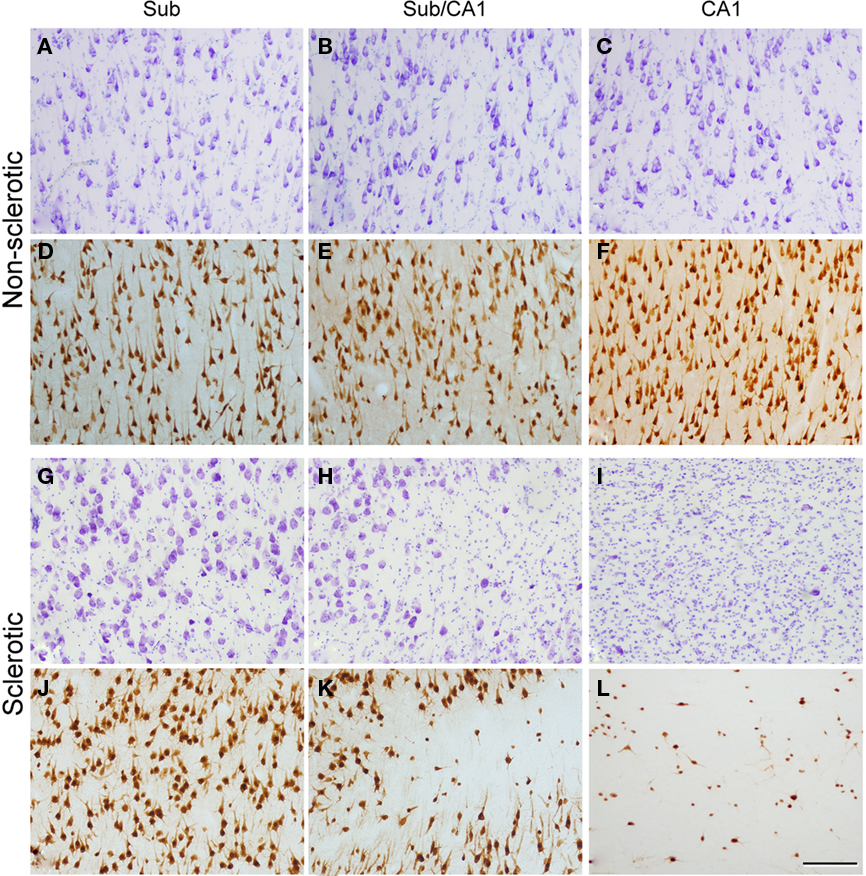
Figure 2. Higher magnification of the regions indicated in Figure 1 and from an adjacent NeuN-immunostained section of the same regions from the non-sclerotic (A–F) and sclerotic (G–L) hippocampal formation. The non-sclerotic regions have a typical neuronal distribution, and the sclerotic subiculum (G,J) shows no apparent alterations. By contrast, the transitional subiculum/CA1 region (H,K) displays moderate neuronal loss and gliosis, and the sclerotic CA1 (I,L) exhibits severe neuronal loss and gliosis. Sub: subiculum, Sub/CA1: transitional subiculum/CA1 region. Scale bar [in (L)]: 180 μm.
A standard histopathological assessment of all cases was performed on the Nissl-stained and NeuN-immunostained sections from the hippocampal formation (Figures 1 and 2). Four of the epileptic patients exhibited hippocampal sclerosis (Houser, 1992; Honavar et al., 1997), whereas in the remaining three patients the cytoarchitecture of the hippocampal formation was apparently normal.
To evaluate the degree of neuronal loss in the hippocampus, Nissl-stained sections were used to estimate neuronal density in the CA1 and subiculum of the hippocampal formation, as described previously (Arellano et al., 2004; Andrioli et al., 2007). In addition, granular cell dispersion and the proliferation of mossy fibers was also estimated (Arellano et al., 2004). The sclerotic hippocampal tissue consistently displayed neuronal loss and gliosis, as revealed by Nissl staining and NeuN-immunoreactive (Ir) (Figures 1 and 2) and hence, we classified the epileptic hippocampi as sclerotic (n = 4) and non-sclerotic (n = 3).
There was a significant decrease (53%, P < 0.01) in the number of neurons per volume in the CA1, between the sclerotic (5227 ± 289 neurons/mm3; mean ± SEM) and non-sclerotic (11,150 ± 374) hippocampus. In the subiculum of the sclerotic hippocampus, the neuronal density was 48% higher (P < 0.05; 17,110 ± 849) than in the non-sclerotic tissue (11,550 ± 988), in accordance with our previous studies on this type of tissue (Andrioli et al., 2007).
The estimation of the Vv occupied by the neuropil in the subiculum from sclerotic hippocampus (75%) was lower than in the subiculum from non-sclerotic hippocampus (81%; P < 0.01, Figure 3). In addition, the Vv occupied by cell bodies in the subiculum from the sclerotic hippocampus (21%) was higher than in the non-sclerotic hippocampus (17%; P < 0.01, Figure 3). Thus, the higher neuronal density in the subiculum from the sclerotic hippocampus was consistent with the finding that the Vv occupied by cell bodies in this region was also larger.
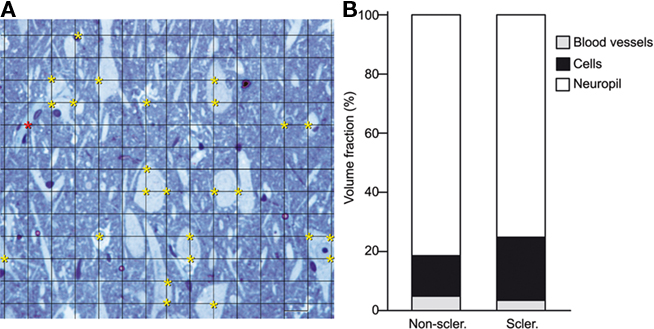
Figure 3. (A) Photomicrograph of a semithin section (2 μm) stained with 1% toluidine blue, showing the pyramidal cell layer of the subiculum from a non-sclerotic hippocampus to illustrate the Cavalieri method used to estimate the Vv. A grid of small intersections overlying the tissue is displayed. Each grid point has an associated area of 20 × 20 = 400 μm2. In this example, the total area of the image is 78,000 μm2. Yellow asterisks indicate the intersections in the grid that lies within cell bodies (n = 25, 25 × 400 = 10,000 μm2). Red asterisks indicate the intersections in the grid that lies within blood vessels (n = 1, 1 × 400 = 400 μm2). The Vv of cells, blood vessels, and neuropil was estimated with the following formulae: Vv cells = 12.8%, Vv blood vessels = 0.51%, Vv neuropil = 100 − (12.8 + 0.51) = 86.7%. (B) Graph of the volume fraction occupied by neuropil, cells bodies, and blood vessels in the pyramidal cell layer of the subiculum from non-sclerotic and sclerotic hippocampus (see text for details).
Electron Microscopy
The ultrastructure of the neuropil was examined in the hippocampal regions described above. In the subiculum of both the sclerotic and non-sclerotic hippocampus, numerous apparently normal-looking neurons were observed, as well as numerous synapses in the neuropil. These synapses also had a normal appearance (Figure 4), with the typical fine structure of the normal cerebral cortex described previously (Peters et al., 1991).
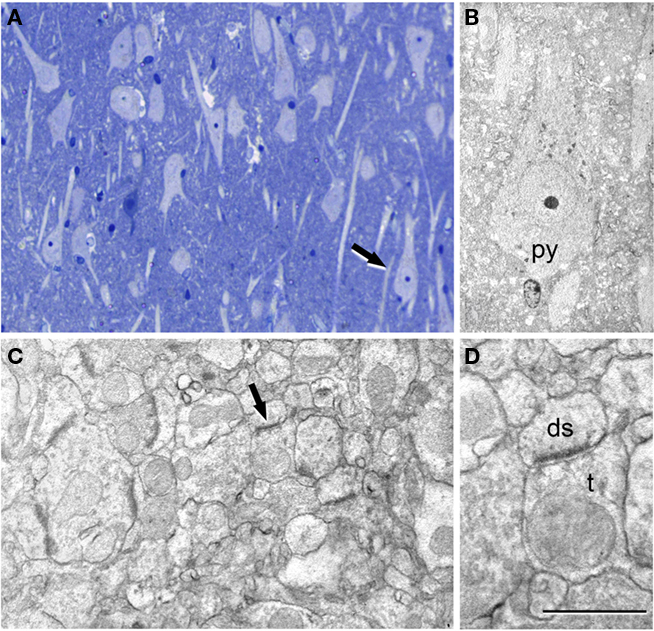
Figure 4. Correlative light and electron microscopy of the subiculum region from a sclerotic hippocampus. (A) Photomicrograph of a 2-μm-thick semithin plastic section stained with 1% toluidine blue to show the numerous pyramidal cells. (B) Low-power electron micrograph taken after sectioning the semithin section shown in A, and illustrating the same pyramidal neuron (py) indicated with an arrow in (A). (C) Higher magnification of the adjacent neuropil shown in (B) to illustrate the numerous synapses. (D) Higher magnification of the asymmetric synapse (indicated with an arrow in C); ds, dendritic spine; t, axon terminal. Scale bar [in (D)]: 120 μm in (A), 58 μm in (B), 1 μm in (C), and 0.5 μm in (D).
In the transitional subiculum/CA1, the non-sclerotic hippocampus was indistinguishable from the subiculum as both the neurons and neuropil appeared normal and there was no evidence of alterations. However, in the sclerotic hippocampus this transitional subiculum/CA1 region showed a moderate number of reactive glial processes that were most abundant closer to CA1 (Figure 5). The scattered pyramidal neurons present in this region were apparently normal, although some of them were surrounded by glial processes (Figure 5).
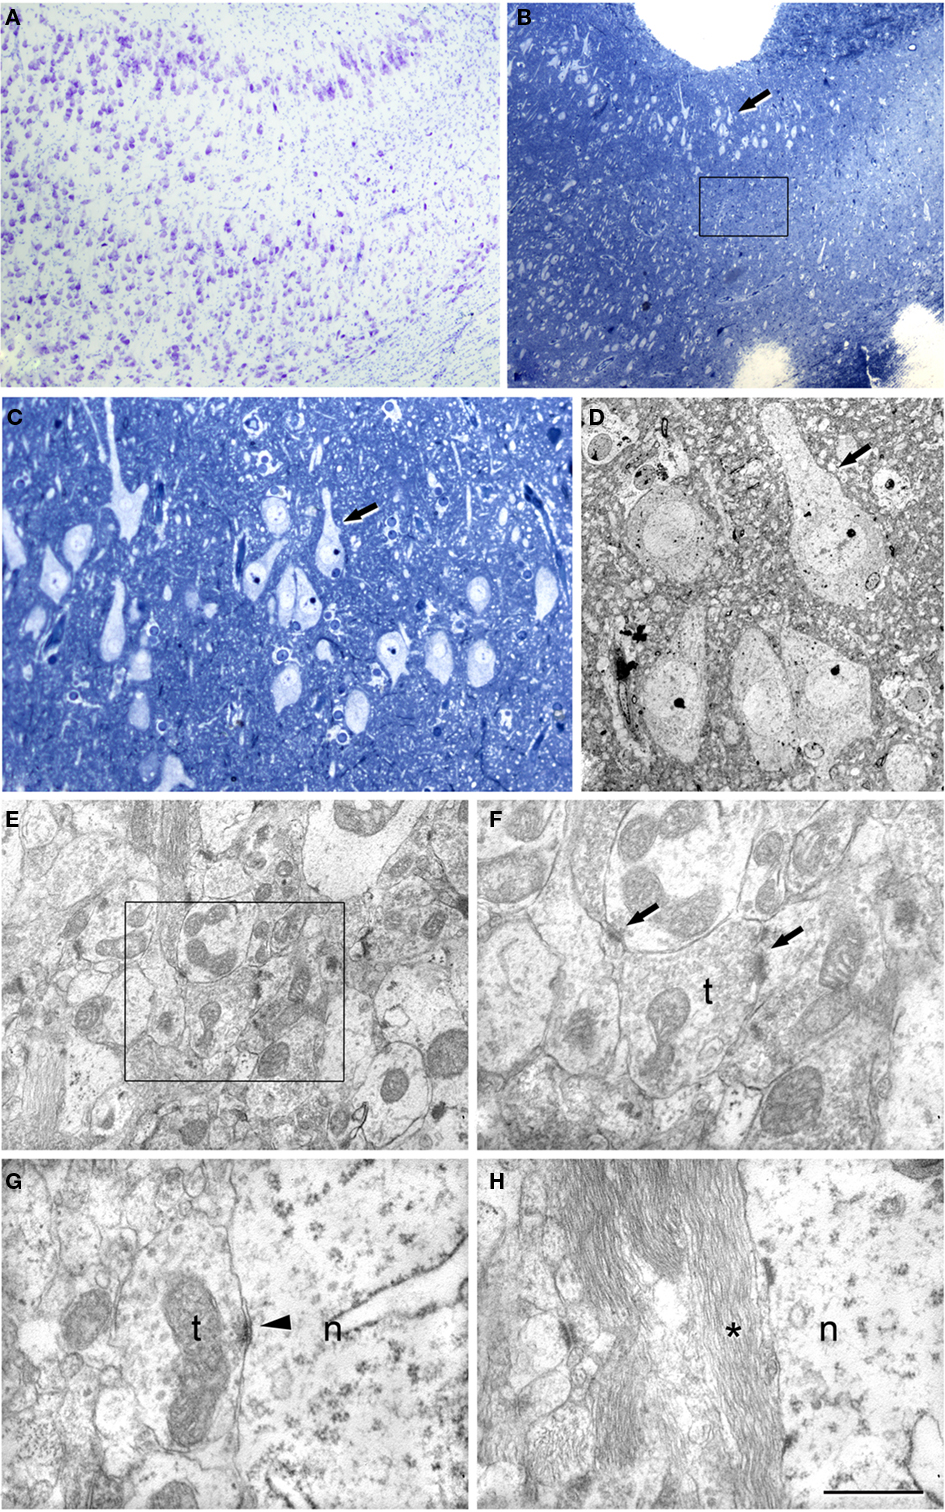
Figure 5. Correlative light and electron microscopy of the subiculum/CA1 region from a sclerotic hippocampus. (A) Photomicrograph of a Nissl-stained section showing the subiculum/CA1 region. (B) Photomicrograph of a 2-μm-thick semithin plastic section stained with 1% toluidine blue to show the gradual loss of neurons. Boxed area illustrates the sampling area for estimation of the synaptic density. (C) Higher magnification of (B). The arrow indicates the same group of neurons as those marked in (B). (D) Low-power electron micrograph of a section from the semithin preparation shown in (B,C) that illustrates the same group of pyramidal neurons. (E) Electron micrograph of the neuropil showing numerous synapses. (F) Higher magnification of the boxed area in (C) showing two synapses. (G,H) High power electron micrographs to illustrate the presence of symmetric synapses on a neuronal cell body (G) and the presence of the glial processes around them (H); n, neuronal cell body; t, axon terminal. Scale bar [in (H)]: 430 μm in (A), 340 μm in (B), 75 μm in (C), 19 μm in (D), 1.6 μm in (E), 0.8 μm in (F), 0.7 μm in (G), and 0.8 μm in (H).
In the sclerotic CA1, numerous glial processes were widespread and the relatively few surviving pyramidal neurons were surrounded by glial processes (Figures 6 and 7). Very few synapses were observed and moreover, these sparse synapses displayed a variety of morphological alterations. These alterations mostly consisted of the presence of organelles that appeared to be degenerating in the presynaptic elements (Figure 6D), as well as a decrease or virtual lack of synaptic vesicles (Figure 7B). Although we did not observe alterations to the postsynaptic elements, we cannot discard that subtle changes passed unnoticed.
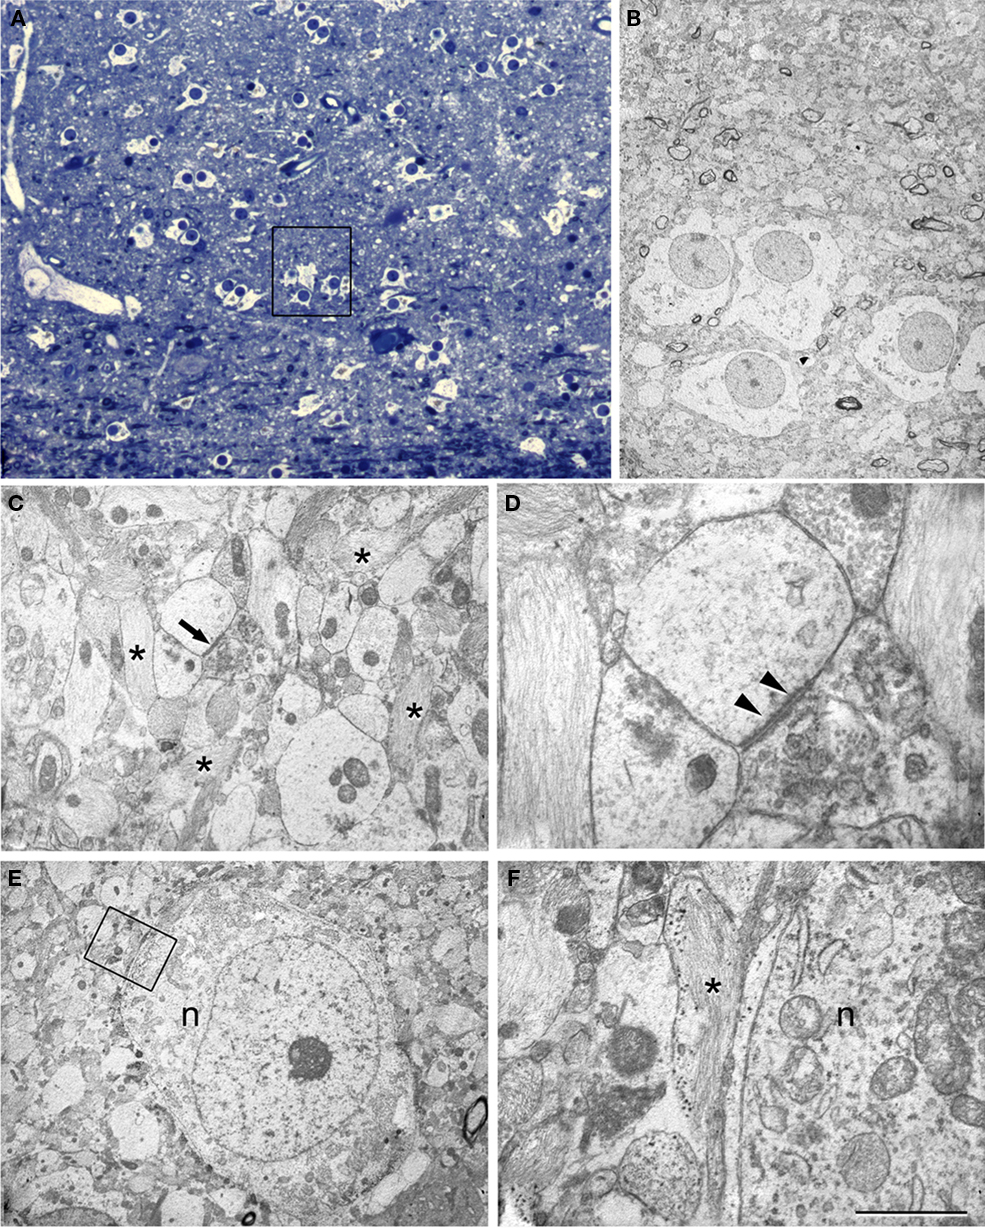
Figure 6. Correlative light and electron microscopy of the CA1 region from a sclerotic hippocampus. (A) Photomicrograph of a 2-μm-thick semithin plastic section stained with 1% toluidine blue to show the numerous astrocytes and very few neurons. (B) Low-power electron micrograph taken after sectioning the semithin preparation of the boxed area in (A) showing the same group of astrocytes. (C) Electron micrograph illustrating the adjacent neuropil with abundant glial processes (some of them indicated with asterisks) and a synapse (arrow). (D) Higher magnification of the asymmetric synapse indicated with an arrow in (C). Note that the presynaptic element is filled with degenerating structures and a prominent postsynaptic density is evident (arrowheads). (E) Electron micrograph of an isolated neuron (n) and its adjacent neuropil. (F) Higher magnification of the boxed area in (E) to indicate the presence of glial processes (asterisk) around the neuronal cell body (n). Scale bar [in (F)]: 70 μm in (A), 11 μm in (B), 2.8 μm in (C), 0.5 μm in (D), 5.6 μm in (E), and 1 μm in (F).

Figure 7. Electron microscopy to illustrate the morphology of the synapses in the sclerotic CA1. (A) Normal symmetric synapse showing a typical thin postsynaptic density (double arrow). An asymmetric synapse (single arrow) displaying a characteristic thick postsynaptic density is found on the same postsynaptic element. (B) Electron micrograph illustrating axon terminals (t) forming synapses with different appearance. The arrow indicates an asymmetric synapse established by a normal-looking axon terminal. The arrowhead points to an asymmetric synapse whose presynaptic axon terminal has an abnormal appearance and in which virtually all synaptic vesicles are close to the synaptic junction. In (A) and (B), some processes of reactive glia are indicated by asterisks. t, axon terminal. Scale bar [in (B)]: 0.5 μm in (A) and 0.4 μm in (B).
Quantitative Electron Microscopy
Synapses were sampled in the neuropil of the middle portion of the pyramidal cell layer in the CA1 region and the subiculum, studying their morphology and density in each region of the sclerotic and non-sclerotic hippocampus described above. The synapses were classified into three categories: asymmetric, symmetric and uncharacterized. In general, on single sections studies, a large proportion of synaptic junctions varying between 40 and 60% are uncharacterized (reviewed in DeFelipe et al., 1999; Table 2). In this study, uncharacterized synapses were included in the final estimate of the total synaptic density. Furthermore, uncharacterized synapses in Figure 8 were included as asymmetric and symmetric types, according to the frequency of both types of synapses. Therefore, the proportion of each type of synapse in this work is an estimate of the real ratio between asymmetric and symmetric synapses (DeFelipe et al., 1999; Alonso-Nanclares et al., 2008).
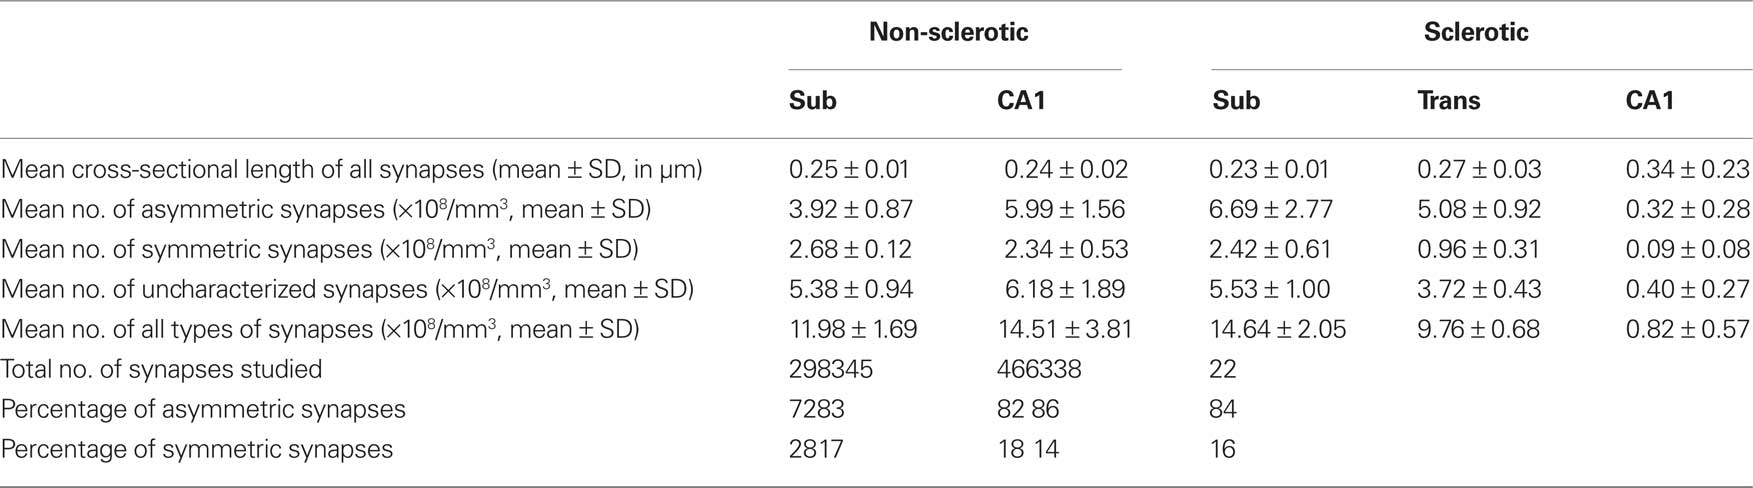
Table 2. Accumulated data from all the hippocampal regions studied. All synapses include asymmetric, symmetric and uncharacterized synapses.
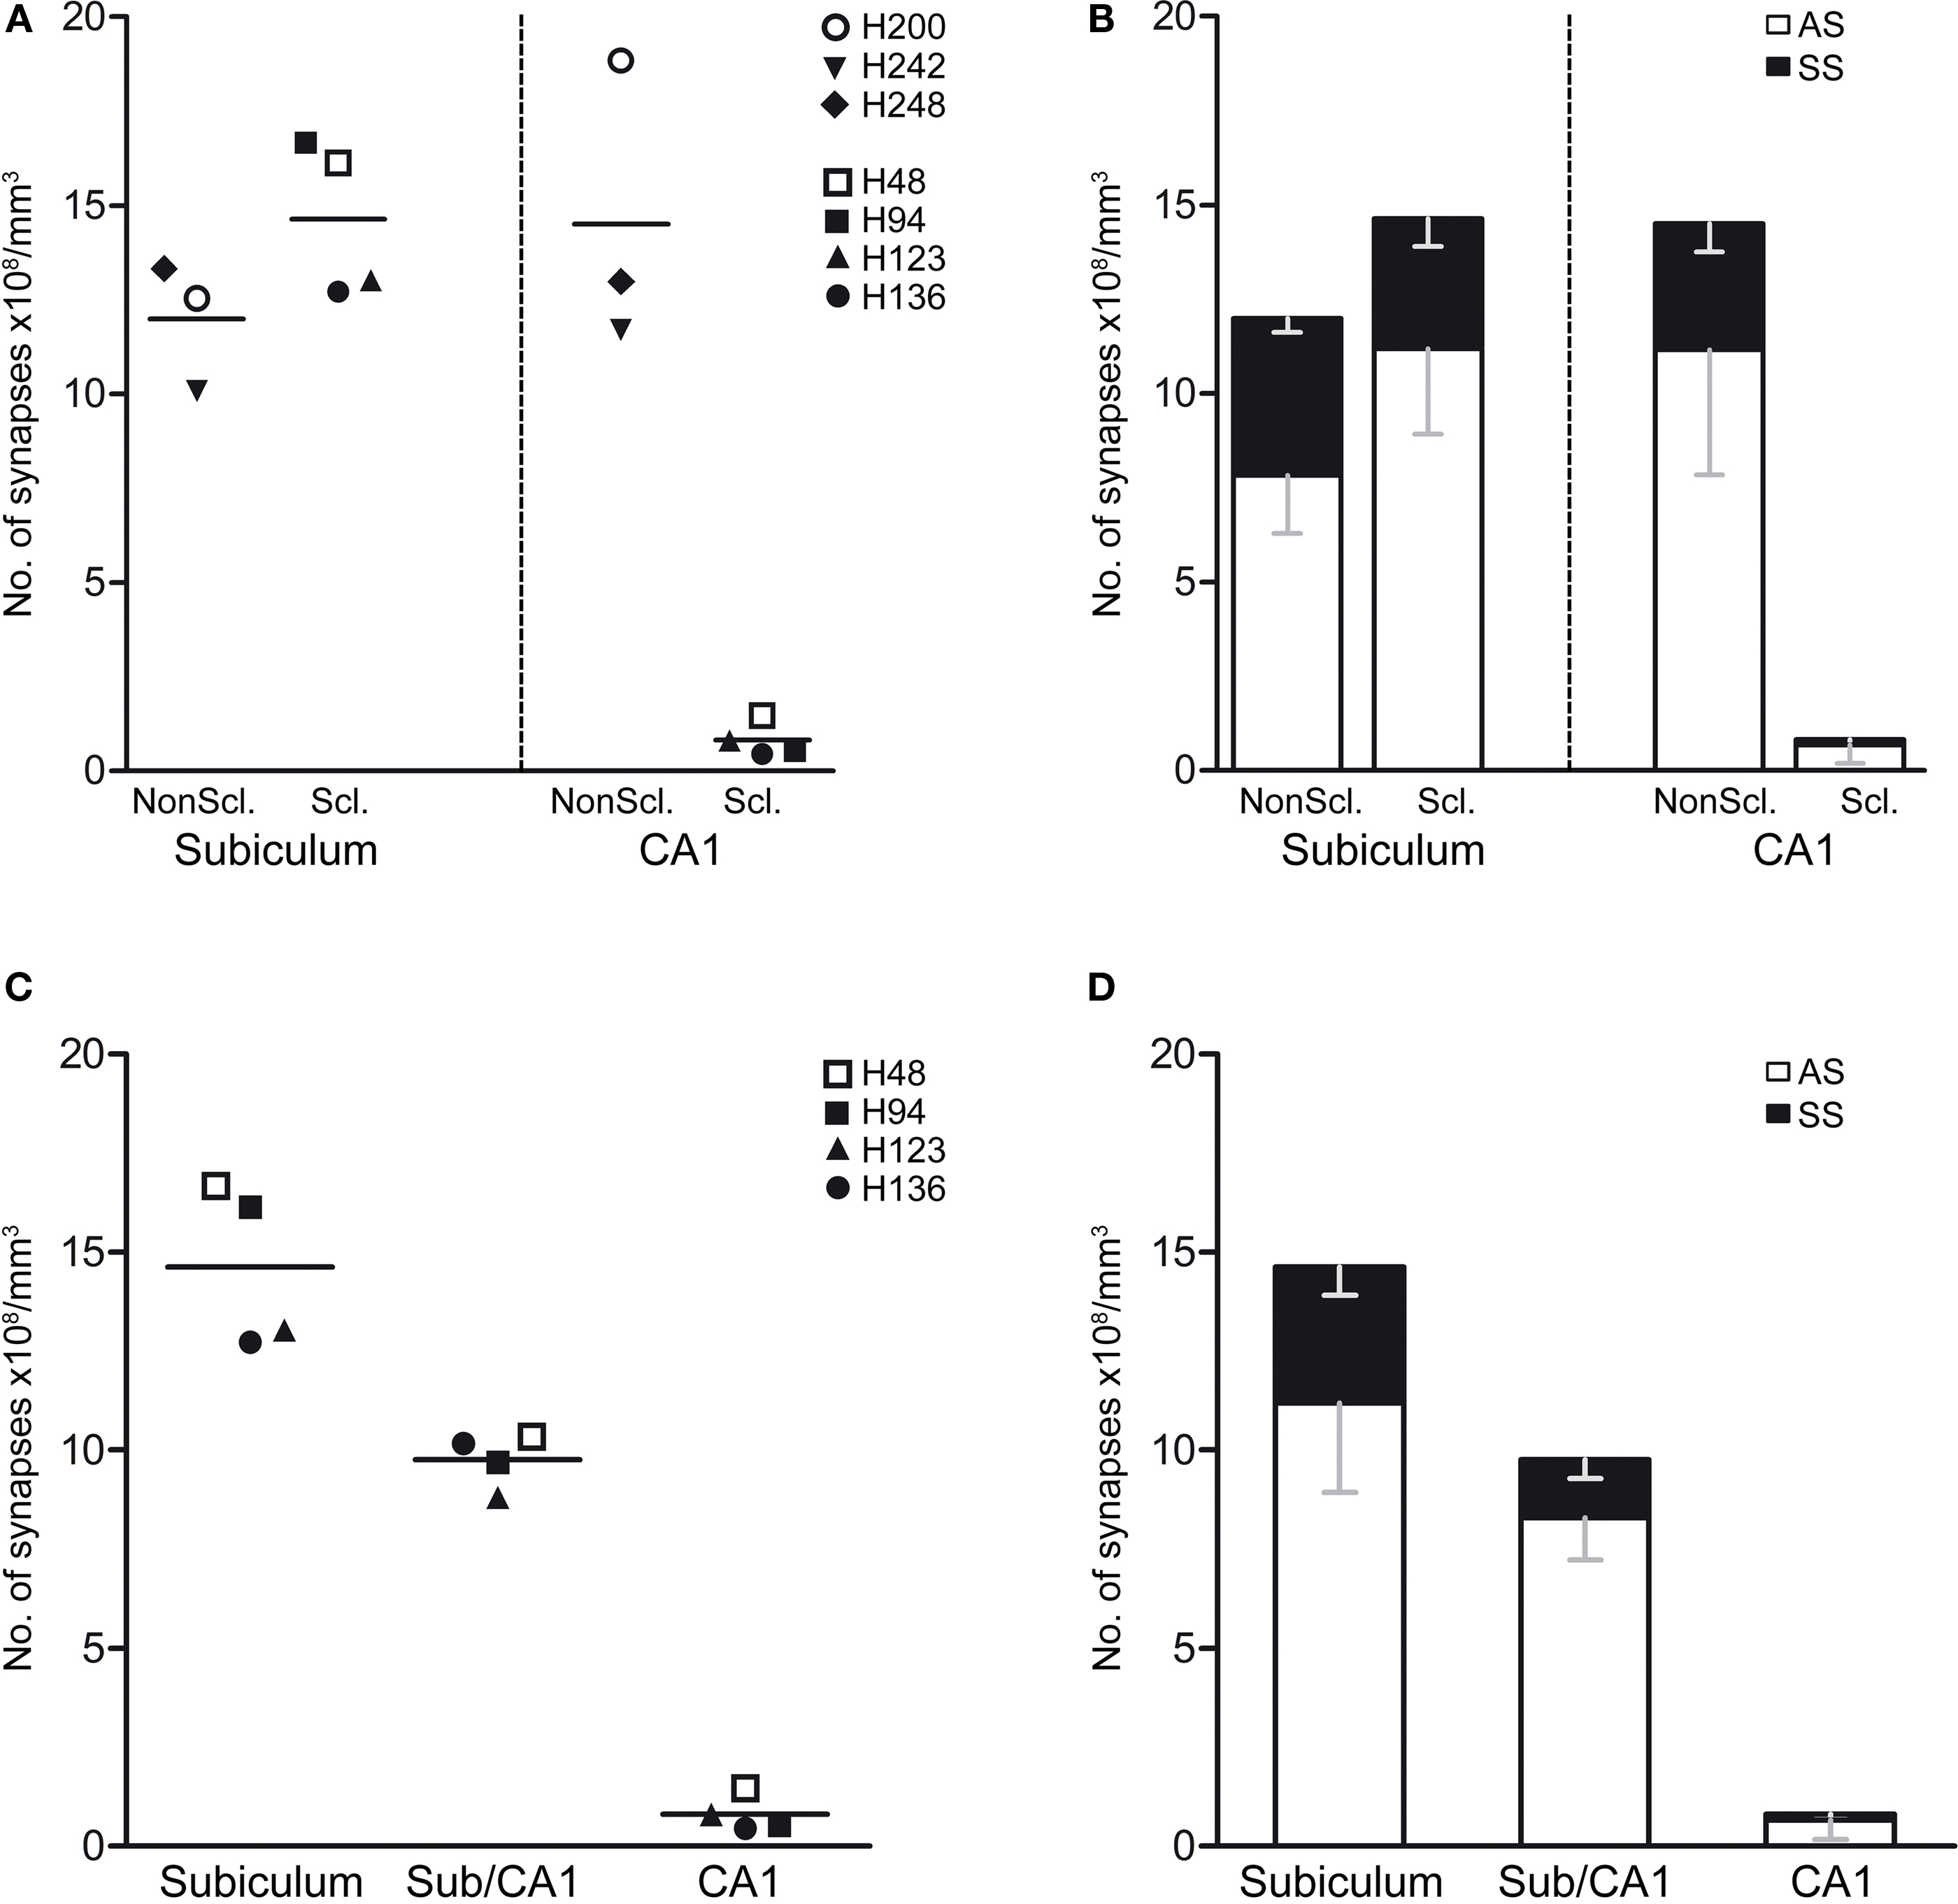
Figure 8. (A,B) Graphs showing the synaptic densities in the non-sclerotic and sclerotic hippocampus in the subiculum and CA1 regions. (A) Graph illustrating the overall synaptic density. Individual points indicate the average values obtained in each case examined. (B) Graph showing the synaptic density (mean ± SD) according to the type of synapse and region examined. (C,D) Graphs of the synaptic densities in the subiculum, subiculum/CA1 and CA1 in the sclerotic hippocampus. (C) Graph illustrating the overall synaptic density. Individual points indicate the average values obtained in each case examined. (D) Graph of the synaptic density (mean ± SD) according to the type of synapse and region. The statistical comparisons are shown in Table 3. Non-sclerotic hippocampus (patients H200, H242, and H248); sclerotic hippocampus (H46, H94, H123, and H 136). See Table 1 for clinical details. AS, asymmetric; SS, symmetric.
Initially, we performed a comparative study of the synaptic density in the subiculum and CA1 between the sclerotic and non-sclerotic hippocampus. In the subiculum, no significant differences were found when considering all types of synapses together or when the different types of synapses were analyzed separately (Tables 2 and 3; Figures 8A,B). Furthermore, while in the subiculum of the non-sclerotic hippocampus there were 72% asymmetric synapses (range 69–76%) and 28% symmetric synapses (range 24–31%), in the sclerotic hippocampus these proportions were 82% (range 74–88%) and 18% (range 12–26%), respectively (Figure 8B), although these differences were not significant. Comparing the synaptic densities between the sclerotic and non-sclerotic hippocampus in the CA1 highlighted a significantly lower density in sclerotic tissue when either all types of synapses were considered or each morphological type of synapses was assessed separately (Tables 2 and 3; Figures 8A,B).
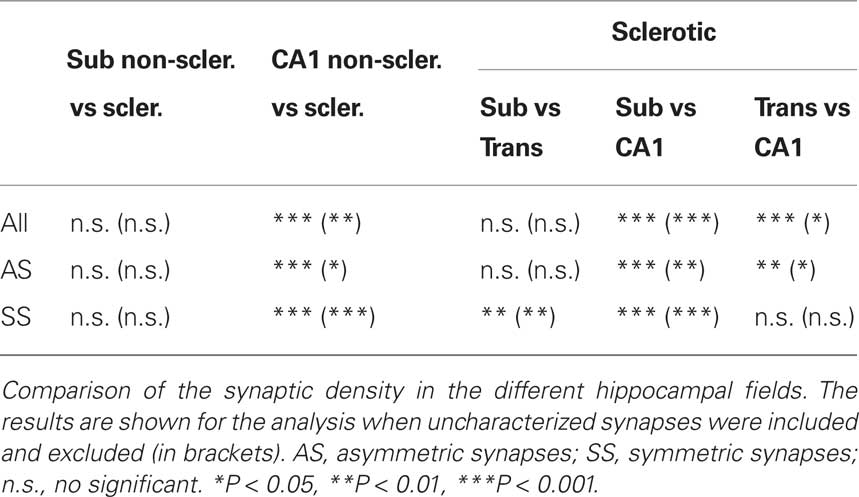
Table 3. Statistical comparison of the synaptic densities between the different hippocampal fields.
Furthermore, we studied the synaptic density in the neuropil within the three regions of the sclerotic hippocampus considered: the subiculum with an apparent normal aspect, the transitional subiculum/CA1 region and the sclerotic CA1 (Figure 1B). Since in the subiculum/CA1 region and the sclerotic CA1 there are very few neurons we studied the synaptic density in the middle part of those regions, corresponding to the pyramidal cell layer (see boxed area in Figure 5B).
When all types of synapses were analyzed, there was a gradual decrease in synaptic density in function of the degree of histological alteration (Figure 8C). That is, the transitional subiculum/CA1 region showed a lower synaptic density (32%) than the subiculum, although this difference was not significant (Table 3; Figure 8C). Moreover, there was a significant lower density of synapses (P < 0.001) in the sclerotic CA1 than in the transitional subiculum/CA1 region (↓91%) or in the subiculum (↓94%). There was also a gradual decrease in the density of asymmetric synapses when they were analyzed individually (Table 3; Figure 8D). Specifically, the density of these synapses was lower (P < 0.001) in the sclerotic CA1 than in the transitional subiculum/CA1 (↓92%) or subiculum (↓94%). Similarly, in the sclerotic hippocampus the density of symmetric synapses was significantly lower in the transitional subiculum/CA1 and sclerotic CA1 than in the subiculum (↓58% and ↓96%, respectively; Tables 2 and 3; Figure 8D). In addition, the proportion of asymmetric and symmetric synapses in each region of the sclerotic tissue was 82 and 18% in the subiculum, 86 and 14% in the transitional subiculum/CA1 region, and 84 and 16% in the sclerotic CA1 (Table 3; Figure 8D). Together these results indicate a general decrease in the density of synapses, as well as a decrease in the proportion of symmetric inhibitory synapses in the affected regions of the sclerotic hippocampus when compared to the normal-looking regions.
The significance of the statistical comparisons when the uncharacterized synapses were excluded was similar to that obtained when the uncharacterized synapses were included in function of the frequency of asymmetric and symmetric synapses (Table 3).
Discussion
Using correlative light and electron microscopy, we have shown here that the number of synapses per volume is selectively altered in specific regions of the sclerotic hippocampus when compared to the non-sclerotic hippocampus of epileptic patients. In particular, synaptic density decreases significantly in the sclerotic CA1, whereas this parameter is not altered in the subiculum of the sclerotic hippocampus. Furthermore, no significant differences were found in the neuropil of the subiculum/CA1 transitional region in the sclerotic hippocampus when compared to the subiculum. In order to help the reader to follow our discussion of the results, we will first address the caveats to our approach and then, the findings in each of the hippocampal fields examined.
Caveats on Ultrastructural Studies of Human Brain
Our data were derived from relatively few epileptic patients (four with hippocampal sclerosis and three with no hippocampal pathological alterations), precluding the extrapolation of the results to the whole population of epileptic patients with this pathology. Although we examined relatively few cases, the differences in synaptic densities between the two groups were highly significant and thus, we consider that these differences must be fairly robust in the general population.
Samples of the hippocampus from the three non-sclerotic epileptic patients were considered to be normal, based on intraoperative electrocorticography and routine histopathological examination. Nevertheless, this material comes from patients with chronic seizures and therefore we could not compare our results with true control specimens.
It is clear that the main limitation in this kind of study is the lack of data from a strictly normal human cortex. The only source of control tissue might be autopsy material (i.e., from individuals who did not suffer any brain pathologies or psychiatric illness, and no brain trauma). While the ultrastructural preservation of postmortem human brain tissue might be acceptable for certain qualitative observations at the electron microscope level (e.g., Wittner et al., 2006; Toth et al., 2010), it might not be suitable for a quantitative stereological analysis. Indeed, the delay in fixation of postmortem human brain tissue usually produces artifacts, such as disruptions in membrane continuity and an increase of the extracellular space, among other geometrical distortions (e.g., Hayat, 2000; Tang et al., 2001). These features represent an important limitation when performing stereological counts of synapses, particularly because the preservation of tissue volume is obviously critical to obtain reliable estimates. Indeed, in our experience with human brain tissue from autopsy, the ultrastructural quality is not good enough for quantitative studies when compared to biopsy material, even when there is only a 2-h postmortem delay (data not shown). It should be highlighted that this is also one of the main reasons for the paucity of data regarding synaptic circuits in the normal human brain.
Resected biopsy tissue can be immediately immersed in fixative and thus, postmortem factors are virtually non-existent. Undoubtedly, this is why the quality of the immunocytochemical staining on human biopsy material at both the light and electron microscopy levels is comparable to that obtained in experimental animals (e.g., Del Rio and DeFelipe, 1994; Alonso-Nanclares et al., 2008). Thus, analyzing resected biopsy tissue that includes the hippocampal formation with no pathological alterations offers us an excellent opportunity to study various ultrastructural aspects of the hippocampus in detail at the electron microscope level. This tissue can be compared to the sclerotic hippocampus, helping us to better understand its microorganization, which would otherwise be impossible to define.
Finally, possible changes in synaptic density due to the effects of anti-epileptic drugs or those related to repeated seizures on synaptic density, preclude comparing between patients with different clinical histories. Nevertheless, the effects of anti-epileptic drugs can be ruled out because non-sclerotic hippocampal tissue was obtained from epileptic patients that were being treated with similar drugs as the patients with hippocampal sclerosis. In addition, all patients were pharmacoresistant with frequent seizures. Thus, differences in the synaptic circuits between non-sclerotic and sclerotic tissue may be interpreted as the result of the pathological changes produced by the hippocampal sclerosis.
CA1
Very few synapses were found in the neuropil of the CA1 from the sclerotic hippocampus, concomitant with gliosis and massive neuron loss. Thus, the surviving neurons in the CA1 of the sclerotic hippocampus are virtually disconnected in terms of synaptic transmission. This is consistent with other studies in which spontaneous activity was rarely observed in the sclerotic CA1, making it unlikely that this region contributes to epileptiform activity (Cohen et al., 2002). Therefore, epileptiform activity might arise in other hippocampal regions.
Subiculum
The subiculum of epileptic patients with hippocampal sclerosis is usually considered to be free of histopathological changes (Babb et al., 1984; Gloor, 1991; Arellano et al., 2004; Dawodu and Thom, 2005). The subiculum is the major output structure of the hippocampus and hence, it is the main brain region encoding neural activity arising from the hippocampus proper (Finch and Babb, 1981; Witter et al., 1989; Amaral et al., 1990; Naber et al., 2001a,b; reviewed in Stafstrom, 2005). Importantly, when seizure onset is restricted to mesial structures in epileptic patients with hippocampal sclerosis, the incomplete removal of the parahippocampal gyrus, and particularly of the subiculum, results in a less satisfactory outcome (Siegel et al., 1990). Therefore, it has been hypothesized that the histologically normal parahippocampal gyrus may serve as a hyperexcitable fringe area that amplifies the relatively few excitatory outputs from the sclerotic Ammon’s horn (Babb and Brown, 1986; Siegel et al., 1990; Wieser et al., 1993).
We found that the density and proportion of the asymmetric vs symmetric synapses is virtually the same in the neuropil of the transitional subiculum/CA1 region and in the sclerotic subiculum. However, a number of alterations evident at the light microscope level have been described in this transitional subiculum/CA1 region. For example, in this region some surviving neurons lacked GABAergic perisomatic innervation whereas other neurons are hyperinnervated (Arellano et al., 2004; Muñoz et al., 2007). In addition, alterations in this region of the sclerotic hippocampus have been observed in the expression of the NKCC co-transporter, as well as in the expression of the extruding KCC (Huberfeld et al., 2007; Muñoz et al., 2007; Wittner et al., 2009). Since the intracellular Cl− concentration determines the polarity of the GABAA-induced neuronal Cl− currents, and the intracellular Cl− concentration is established by the activity of these co-transporters, such alterations in the sclerotic hippocampus may contribute to the depolarizing responses induced by GABAergic signaling through GABAA receptors in some neurons (Cohen et al., 2002).
Although there is massive neuronal loss in the sclerotic CA1, the synaptic density in the transitional subiculum/CA1 region is similar to that in the subiculum, and synaptic inputs to this region may arise from the axonal arborization of the surviving CA1 neurons and/or, from other hippocampal and extra-hippocampal afferent systems, such as the entorhinal cortex (for reviews see Duvernoy, 1998). The fact that the density of synapses was relatively high in the transitional subiculum/CA1 region (see Table 3) implies that the number of synapses per neuron should be higher in this region, and whatever the source of these synapses, such an increase would mainly be due to the proliferation of asymmetric (excitatory) synapses. Thus, these changes may contribute to the hyperexcitability of the sclerotic hippocampus.
In the subiculum of the sclerotic hippocampus, we observed a greater neuronal density (48%) when compared to the non-sclerotic hippocampus, according to previous studies (Andrioli et al., 2007). Since the number and proportion of synapses (asymmetric and symmetric) was similar in the subiculum from both the sclerotic and non-sclerotic hippocampus, the ratio of synapses per neuron diminishes in the sclerotic hippocampus.
A possibility is that patients with mesial TLE have a greater density of neurons in the subiculum independently of hippocampal sclerosis. Alternatively, it could be explained simply by the concurrence of hippocampal atrophy (reviewed in Van Paesschen, 2004).
The reduction in the relative number of synapses per neuron in the subiculum is probably due to the loss of axons arising from pyramidal CA1 neurons (source of the majority of asymmetric synapses). In addition, we previously reported a reduction in the proportion of PV-Ir neurons in the subiculum of the sclerotic hippocampus when compared to the non-sclerotic hippocampus from epileptic patients and to the normal hippocampus from autopsy cases (Andrioli et al., 2007). PV-Ir interneurons are one of the main sources of perisomatic GABAergic axon terminals, a population of neurons that includes basket and chandelier cells, considered to be the most powerful inhibitory interneurons (reviewed in DeFelipe, 1999; Freund and Katona, 2007). Moreover, the expression of PV by interneurons is closely related to their electrophysiological properties (Caillard et al., 2000; Toledo-Rodriguez et al., 2004). Recent studies in mice have examined the functional significance of PV interneurons in cortical circuits, showing that inhibition of these interneurons suppresses gamma oscillations (which are thought to enhance information processing), whereas their stimulation generates the rhythmicity in the gamma-frequency (Sohal et al., 2009). Therefore, such changes in the human subiculum from sclerotic hippocampus would imply significant functional alterations to hippocampal circuits in these epileptic patients.
Finally, we must not only consider changes in the relative number of synapses but also, the fact that many synapses in the CA1 and CA1/subiculum regions from sclerotic hippocampus are morphologically affected and therefore, their functional properties would be altered (see also Witcher et al., 2010). Thus, the transitional CA1/subiculum region and the adjacent subiculum from epileptic patients with hippocampal sclerosis, suffer profound neurochemical alterations (Muñoz et al., 2002, 2007; Arellano et al., 2004; van Vliet et al., 2004; Wittner et al., 2005; Andrioli et al., 2007) that are probably directly involved in seizure activity, as revealed by the good surgical outcomes. It remains to be determined whether all these changes contribute to epilepsy, or whether only particular changes are indeed epileptogenic and others are induced as compensatory plastic changes unrelated to seizure activity.
Significance of the Changes in Synaptic Density in the Sclerotic vs Non-Sclerotic Hippocampus
In the sclerotic hippocampus there is a notable lack of synapses in the CA1 field, in conjunction with gliosis and massive neuron loss. Thus, the few surviving neurons in the CA1 of the sclerotic hippocampus are likely to have few synaptic connections, at least at the level of the dendritic arbor. Furthermore, we previously found a consistent and highly significant loss of microvessels in the sclerotic hippocampal CA1 field, and a variety of vascular alterations in the remaining blood vessels (Kastanauskaite et al., 2009). All these features make it unlikely that this region contributes to epileptiform activity.
In the transitional subiculum/CA1 region of sclerotic tissue, the density of synapses is virtually the same as that found in the adjacent subiculum. Moreover, the subiculum of the sclerotic hippocampus displays a significant increase in neuronal density, although there is a similar synaptic density in the subiculum from non-sclerotic hippocampus. Since the number and proportion of synapses was similar in the subiculum from both the sclerotic and non-sclerotic hippocampus, the ratio of synapses per neuron must clearly diminish in the sclerotic hippocampus. Thus, we propose that while the subiculum appears to be unaltered in standard histopathological analyses of the sclerotic hippocampus, it actually suffers profound alterations in neuronal circuits that are probably critical for the development or maintenance of seizure activity.
Conflict of Interest Statement
The authors declare that the research was conducted in the absence of any commercial or financial relationships that could be construed as a potential conflict of interest.
Acknowledgments
We thank Dr. R. G. Sola and his team (Neurosurgery Service, Hospital de la Princesa, Madrid, Spain) for providing the tissue from the epileptic patients, and A. I. Garcia and L. Valdés for technical assistance. This work was supported by grants from the following entities: Centre for Networked Biomedical Research into Neurodegenerative Diseases (CIBERNED, CB06/05/0066), Fundación CIEN, the EU 6th Framework Program (PROMEMORIA LSHM-CT-2005-512012), and the Spanish Ministry of Education, Science, and Innovation (grants BFU2006-13395 and SAF2009-09394 to Javier DeFelipe; Cajal Blue Brain Project; a research fellowship for Asta Kastanauskaite, BES/2004/5928).
References
Alonso-Nanclares, L., Gonzalez-Soriano, J., Rodriguez, J. R., and DeFelipe, J. (2008). Gender differences in human cortical synaptic density. Proc. Natl. Acad. Sci. U.S.A. 105, 14615–14619.
Amaral, D. G., Insausti, R., and Paxinos, G. (1990). “Hippocampal formation,” in The Human Nervous System, ed. G. Paxinos (New York: Academic Press), 711–755.
Andrioli, A., Alonso-Nanclares, L., Arellano, J. I., and DeFelipe, J. (2007). Quantitative analysis of parvalbumin-immunoreactive cells in the human epileptic hippocampus. Neuroscience 149, 131–143.
Arellano, J. I., Ballesteros-Yanez, I., DeFelipe, J., Munoz, A., and Sola, R. G. (2004). Histopathology and reorganization of chandelier cells in the human epileptic sclerotic hippocampus. Brain 127, 45–64.
Avoli, M. (1983). Is epilepsy a disorder of inhibition or excitation? Prog. Clin. Biol. Res. 124, 23–37.
Avoli, M., D’Antuono, M., Louvel, J., Kohling, R., Biagini, G., Pumain, R., D’Arcangelo, G., and Tancredi, V. (2002). Network and pharmacological mechanisms leading to epileptiform synchronization in the limbic system in vitro. Prog. Neurobiol. 68, 167–207.
Babb, T. L., and Brown, W. J. (1986). Neuronal, dendritic, and vascular profiles of human temporal lobe epilepsy correlated with cellular physiology in vivo. Adv. Neurol. 44, 949–966.
Babb, T. L., Kupfer, W. R., Pretorius, J. K., Crandall, P. H., and Levesque, M. F. (1991). Synaptic reorganization by mossy fibers in human epileptic fascia dentata. Neuroscience 42, 351–363.
Babb, T. L., Lieb, J. P., Brown, W. J., Pretorius, J., and Crandall, P. H. (1984). Distribution of pyramidal cell density and hyperexcitability in the epileptic human hippocampal formation. Epilepsia 25, 721–728.
Babb, T. L., Ying, Z., Mikuni, N., Nishiyama, K., Drazba, J., Bingaman, W., Wyllie, E., Wylie, C. J., and Yacubova, K. (2000). Brain plasticity and cellular mechanisms of epileptogenesis in human and experimental cortical dysplasia. Epilepsia 41(Suppl. 6), S76–S81.
Caillard, O., Moreno, H., Schwaller, B., Llano, I., Celio, M. R., and Marty, A. (2000). Role of the calcium-binding protein parvalbumin in short-term synaptic plasticity. Proc. Natl. Acad. Sci. U.S.A. 97, 13372–13377.
Celio, M. R. (1986). Parvalbumin in most gamma-aminobutyric acid-containing neurons of the rat cerebral cortex. Science 231, 995–997.
Cohen, I., Navarro, V., Clemenceau, S., Baulac, M., and Miles, R. (2002). On the origin of interictal activity in human temporal lobe epilepsy in vitro. Science 298, 1418–1421.
Colonnier, M. (1968). Synaptic patterns on different cell types in the different laminae of the cat visual cortex. An electron microscope study. Brain Res. 9, 268–287.
Dawodu, S., and Thom, M. (2005). Quantitative neuropathology of the entorhinal cortex region in patients with hippocampal sclerosis and temporal lobe epilepsy. Epilepsia 46, 23–30.
de Lanerolle, N. C., Kim, J. H., Robbins, R. J., and Spencer, D. D. (1989). Hippocampal interneuron loss and plasticity in human temporal lobe epilepsy. Brain Res. 495, 387–395.
DeFelipe, J., and Fairen, A. (1982). A type of basket cell in superficial layers of the cat visual cortex. A Golgi-electron microscope study. Brain Res. 244, 9–16.
DeFelipe, J., and Fairen, A. (1993). A simple and reliable method for correlative light and electron microscopic studies. J. Histochem. Cytochem. 41, 769–772.
DeFelipe, J., Marco, P., Busturia, I., and Merchan-Perez, A. (1999). Estimation of the number of synapses in the cerebral cortex: methodological considerations. Cereb. Cortex 9, 722–732.
Del Rio, M. R., and DeFelipe, J. (1994). A study of SMI 32-stained pyramidal cells, parvalbumin-immunoreactive chandelier cells, and presumptive thalamocortical axons in the human temporal neocortex. J. Comp. Neurol. 342, 389–408.
Engel, J. Jr. (1987). “Outcome with respect to epileptic seizures,” in Surgical Treatment of Epilepsies, ed. J. Engel Jr. (New York: Raven Press), 553–571.
Falconer, M. A. (1974). Mesial temporal (Ammon’s horn) sclerosis as a common cause of epilepsy. Aetiology, treatment, and prevention. Lancet 2, 767–770.
Finch, D. M., and Babb, T. L. (1981). Demonstration of caudally directed hippocampal efferents in the rat by intracellular injection of horseradish peroxidase. Brain Res. 214, 405–410.
Fritschy, J. M., Meskenaite, V., Weinmann, O., Honer, M., Benke, D., and Mohler, H. (1999). GABAB-receptor splice variants GB1a and GB1b in rat brain: developmental regulation, cellular distribution and extrasynaptic localization. Eur. J. Neurosci. 11, 761–768.
Gloor, P. (1991). “Mesial temporal sclerosis: historical background and an overview from a modern perspective,” in Epilepsy Surgery, ed. H. Luders (New York: Raven), 689–703.
Gray, E. G. (1959). Electron microscopy of synaptic contacts on dendrite spines of the cerebral cortex. Nature 183, 1592–1593.
Gundersen, H. J., Bagger, P., Bendtsen, T. F., Evans, S. M., Korbo, L., Marcussen, N., Moller, A., Nielsen, K., Nyengaard, J. R., and Pakkenberg, B. (1988). The new stereological tools: disector, fractionator, nucleator and point sampled intercepts and their use in pathological research and diagnosis. APMIS 96, 857–881.
Hayat, M. A. (2000). Principles and Techniques of Electron Microscopy: Biological Applications. Cambridge: Cambridge University Press.
Honavar, M., Meldrum, B. S., Graham, D. I., and Lantos, P. L. (1997). “Epilepsy,” in Greenfield’s Neuropathology, eds J. G. Greenfield, W. Blackwood, and J. A. N. Corsellis (London: Arnold), 931–971.
Houser, C. R. (1992). Morphological changes in the dentate gyrus in human temporal lobe epilepsy. Epilepsy Res. Suppl. 7, 223–234.
Huberfeld, G., Wittner, L., Clemenceau, S., Baulac, M., Kaila, K., Miles, R., and Rivera, C. (2007). Perturbed chloride homeostasis and GABAergic signaling in human temporal lobe epilepsy. J. Neurosci. 27, 9866–9873.
Kang, T. C., An, S. J., Park, S. K., Hwang, I. K., Bae, J. C., Suh, J. G., Oh, Y. S., and Won, M. H. (2002). Changes in Na(+)-K(+)-Cl(−) cotransporter immunoreactivity in the gerbil hippocampus following spontaneous seizure. Neurosci. Res. 44, 285–295.
Kastanauskaite, A., Alonso-Nanclares, L., Blazquez-Llorca, L., Pastor, J., Sola, R. G., and DeFelipe, J. (2009). Alterations of the microvascular network in sclerotic hippocampi from patients with epilepsy. J. Neuropathol. Exp. Neurol. 68, 939–950.
Kullman, D. (2007). “Synaptic Function,” in The Hippocampus Book, eds P. Andersen, R. Morris, D. Amaral, T. Bliss, and J. O’Keefe (New York: Oxford University Press), 203–241.
Merchan-Perez, A., Rodriguez, J. R., Alonso-Nanclares, L., Schertel, A., and Defelipe, J. (2009). Counting synapses using FIB/SEM microscopy: a true revolution for ultrastructural volume reconstruction. Front. Neuroanat. 3:18. doi: 10.3389/neuro.05.018.2009
Muñoz, A., Arellano, J. I., and DeFelipe, J. (2002). GABABR1 receptor protein expression in human mesial temporal cortex: changes in temporal lobe epilepsy. J. Comp. Neurol. 449, 166–179.
Muñoz, A., Mendez, P., DeFelipe, J., and Alvarez-Leefmans, F. J. (2007). Cation-chloride cotransporters and GABA-ergic innervation in the human epileptic hippocampus. Epilepsia 48, 663–673.
Naber, P. A., Lopes da Silva, F. H., and Witter, M. P. (2001a). Reciprocal connections between the entorhinal cortex and hippocampal fields CA1 and the subiculum are in register with the projections from CA1 to the subiculum. Hippocampus 11, 99–104.
Naber, P. A., Witter, M. P., and Lopes da Silva, F. H. (2001b). Evidence for a direct projection from the postrhinal cortex to the subiculum in the rat. Hippocampus 11, 105–117.
Palma, E., Amici, M., Sobrero, F., Spinelli, G., Di Angelantonio, S., Ragozzino, D., Mascia, A., Scoppetta, C., Esposito, V., Miledi, R., and Eusebi, F. (2006). Anomalous levels of Cl− transporters in the hippocampal subiculum from temporal lobe epilepsy patients make GABA excitatory. Proc. Natl. Acad. Sci. U.S.A. 103, 8465–8468.
Pastor, J., Sola, R. G., Hernando-Requejo, V., Navarrete, E. G., and Pulido, P. (2008). Morbidity associated with the use of foramen ovale electrodes. Epilepsia 49, 464–469.
Peachey, L. D. (1958). Thin sections. I. A study of section thickness and physical distortion produced during microtomy. J. Biophys. Biochem. Cytol. 4, 233–242.
Peters, A., Palay, S. L., and Webster, H. D. (1991). The Fine Structure of the Nervous System. Neurons and Their Supporting Cells. New York: Oxford University Press.
Proper, E. A., Oestreicher, A. B., Jansen, G. H., Veelen, C. W., van Rijen, P. C., Gispen, W. H., and de Graan, P. N. (2000). Immunohistochemical characterization of mossy fibre sprouting in the hippocampus of patients with pharmaco-resistant temporal lobe epilepsy. Brain 123(Pt 1), 19–30.
Siegel, A. M., Wieser, H. G., Wichmann, W., and Yasargil, G. M. (1990). Relationships between MR-imaged total amount of tissue removed, resection scores of specific mediobasal limbic subcompartments and clinical outcome following selective amygdalohippocampectomy. Epilepsy Res. 6, 56–65.
Sloviter, R. S. (1991). Permanently altered hippocampal structure, excitability, and inhibition after experimental status epilepticus in the rat: the “dormant basket cell” hypothesis and its possible relevance to temporal lobe epilepsy. Hippocampus 1, 41–66.
Sohal, V. S., Zhang, F., Yizhar, O., and Deisseroth, K. (2009). Parvalbumin neurons and gamma rhythms enhance cortical circuit performance. Nature 459, 698–702.
Sola, R. G., Hernando-Requejo, V., Pastor, J., Garcia-Navarrete, E., DeFelipe, J., Alijarde, M. T., Sanchez, A., Dominguez-Gadea, L., Martin-Plasencia, P., Maestu, F., Felipe-Oroquieta, J., Ramon-Cajal, S., and Pulido-Rivas, P. (2005). Pharmacoresistant temporal-lobe epilepsy. Exploration with foramen ovale electrodes and surgical outcomes. Rev. Neurol. 41, 4–16.
Spencer, D. D., and Engel, J. Jr. (1993). “Technical controversies,” in Surgical Treatment of Epilepsies, ed. J. Engel Jr. (New York: Raven Press), 583–586.
Stafstrom, C. E. (2005). The role of the subiculum in epilepsy and epileptogenesis. Epilepsy Curr. 5, 121–129.
Sutula, T., Cascino, G., Cavazos, J., Parada, I., and Ramirez, L. (1989). Mossy fiber synaptic reorganization in the epileptic human temporal lobe. Ann. Neurol. 26, 321–330.
Tang, Y., Nyengaard, J. R., De Groot, D. M., and Gundersen, H. J. (2001). Total regional and global number of synapses in the human brain neocortex. Synapse 41, 258–273.
Toledo-Rodriguez, M., Blumenfeld, B., Wu, C., Luo, J., Attali, B., Goodman, P., and Markram, H. (2004). Correlation maps allow neuronal electrical properties to be predicted from single-cell gene expression profiles in rat neocortex. Cereb. Cortex 14, 1310–1327.
Toth, K., Eross, L., Vajda, J., Halasz, P., Freund, T. F., and Magloczky, Z. (2010). Loss and reorganization of calretinin-containing interneurons in the epileptic human hippocampus. Brain 133, 2763–2777.
Unal-Cevik, I., Kilinç, M., Gürsoy-Ozdemir, Y., Gurer, G., and Dalkara, T. (2004). Loss of NeuN immunoreactivity after cerebral ischemia does not indicate neuronal cell loss: a cautionary note. Brain Res. 1015, 169–174.
van der Hel, W. S., Verlinde, S. A., Meijer, D. H., de Wit, M., Rensen, M. G., van Gassen, K. L., van Rijen, P. C., van Veelen, C. W., and de Graan, P. N. (2009). Hippocampal distribution of vesicular glutamate transporter 1 in patients with temporal lobe epilepsy. Epilepsia 50, 1717–1728.
Van Paesschen, W. (2004). Qualitative and quantitative imaging of the hippocampus in mesial temporal lobe epilepsy with hippocampal sclerosis. Neuroimaging Clin. N. Am. 14, 373–400, vii.
van Vliet, E. A., Aronica, E., Tolner, E. A., Lopes da Silva, F. H., and Gorter, J. A. (2004). Progression of temporal lobe epilepsy in the rat is associated with immunocytochemical changes in inhibitory interneurons in specific regions of the hippocampal formation. Exp. Neurol. 187, 367–379.
West, M. J., and Gundersen, H. J. (1990). Unbiased stereological estimation of the number of neurons in the human hippocampus. J. Comp. Neurol. 296, 1–22.
Wieser, H. G., Engel, J. Jr., Williamson, P. D., Babb, T. L., and Gloor, P. (1993). “Surgically remediable temporal lobe syndromes,” in Surgical Treatment of Epilepsies, ed. J. Engel Jr. (New York: Raven Press), 49–63.
Wieser, H. G., Ortega, M., Friedman, A., and Yonekawa, Y. (2003). Long-term seizure outcomes following amygdalohippocampectomy. J. Neurosurg. 98, 751–763.
Witcher, M. R., Park, Y. D., Lee, M. R., Sharma, S., Harris, K. M., and Kirov, S. A. (2010). Three-dimensional relationships between perisynaptic astroglia and human hippocampal synapses. Glia 58, 572–587.
Witter, M. P., Groenewegen, H. J., Lopes da Silva, F. H., and Lohman, A. H. (1989). Functional organization of the extrinsic and intrinsic circuitry of the parahippocampal region. Prog. Neurobiol. 33, 161–253.
Wittner, L., Eross, L., Czirjak, S., Halasz, P., Freund, T. F., and Magloczky, Z. (2005). Surviving CA1 pyramidal cells receive intact perisomatic inhibitory input in the human epileptic hippocampus. Brain 128, 138–152.
Wittner, L., Eross, L., Szabo, Z., Toth, S., Czirjak, S., Halasz, P., Freund, T. F., and Magloczky, Z. S. (2002). Synaptic reorganization of calbindin-positive neurons in the human hippocampal CA1 region in temporal lobe epilepsy. Neuroscience 115, 961–978.
Wittner, L., Henze, D. A., Zaborszky, L., and Buzsaki, G. (2006). Hippocampal CA3 pyramidal cells selectively innervate aspiny interneurons. Eur. J. Neurosci. 24, 1286–1298.
Wittner, L., Huberfeld, G., Clemenceau, S., Eross, L., Dezamis, E., Entz, L., Ulbert, I., Baulac, M., Freund, T. F., Magloczky, Z., and Miles, R. (2009). The epileptic human hippocampal cornu ammonis 2 region generates spontaneous interictal-like activity in vitro. Brain 132, 3032–3046.
WMA. (2008). Declaration of Helsinki, 6th Revision. World Medical Association. Available at: www.wma.net/en/30publications/10policies/b3/17c.pdf
York, M. K., Rettig, G. M., Grossman, R. G., Hamilton, W. J., Armstrong, D. D., Levin, H. S., and Mizrahi, E. M. (2003). Seizure control and cognitive outcome after temporal lobectomy: a comparison of classic Ammon’s horn sclerosis, atypical mesial temporal sclerosis, and tumoral pathologies. Epilepsia 44, 387–398.
Keywords: electron microscopy, gliosis, hippocampal sclerosis, temporal lobe epilepsy, synapses
Citation: Alonso-Nanclares L, Kastanauskaite A, Rodriguez J-R, Gonzalez-Soriano J and DeFelipe J (2011) A stereological study of synapse number in the epileptic human hippocampus. Front. Neuroanat. 5:8. doi: 10.3389/fnana.2011.00008
Received: 26 November 2010;
Accepted: 11 February 2011;
Published online: 24 February 2011.
Edited by:
Patrick R. Hof, Mount Sinai School of Medicine, USAReviewed by:
Teresa A. Milner, Weill Cornell Medical College, USALinnaea Ostroff, New York University, USA
Copyright: © 2011 Alonso-Nanclares, Kastanauskaite, Rodriguez, Gonzalez-Soriano and DeFelipe. This is an open-access article subject to an exclusive license agreement between the authors and Frontiers Media SA, which permits unrestricted use, distribution, and reproduction in any medium, provided the original authors and source are credited.
*Correspondence: Lidia Alonso-Nanclares, Instituto Cajal (Consejo Superior de Investigaciones Cientificas), Avenida Doctor Arce 37, 28002 Madrid, Spain; Laboratorio Cajal de Circuitos Corticales (Centro de Tecnología Biomédica), Universidad Politécnica de Madrid, Campus Montegancedo s/n, Pozuelo de Alarcón, 28223 Madrid, Spain. e-mail: aidil@cajal.csic.es