Do different neurons age differently? Direct genome-wide analysis of aging in single identified cholinergic neurons
- 1 Department of Neuroscience, Evelyn F and William L. McKnight Brain Institute, University of Florida, Gainesville, FL, USA
- 2 The Whitney Laboratory for Marine Bioscience, University of Florida, St Augustine, FL, USA
Aplysia californica is a powerful experimental system to study the entire scope of genomic and epigenomic regulation at the resolution of single functionally characterized neurons and is an emerging model in the neurobiology of aging. First, we have identified and cloned a number of evolutionarily conserved genes that are age-related, including components of apoptosis and chromatin remodeling. Second, we performed gene expression profiling of different identified cholinergic neurons between young and aged animals. Our initial analysis indicates that two cholinergic neurons (R2 and LPl1) revealed highly differential genome-wide changes following aging suggesting that on the molecular scale different neurons indeed age differently. Each of the neurons tested has a unique subset of genes differentially expressed in older animals, and the majority of differently expressed genes (including those related to apoptosis and Alzheimer’s disease) are found in aging neurons of one but not another type. The performed analysis allows us to implicate (i) cell specific changes in histones, (ii) DNA methylation and (iii) regional relocation of RNAs as key processes underlying age-related changes in neuronal functions and synaptic plasticity. These mechanisms can fine-tune the dynamics of long-term chromatin remodeling, or control weakening and the loss of synaptic connections in aging. At the same time our genomic tests revealed evolutionarily conserved gene clusters associated with aging (e.g., apoptosis-, telomere- and redox-dependent processes, insulin and estrogen signaling and water channels).
Introduction: Aplysia as an Emerging Model in the Biology of Aging
The complexity of events associated with age-related changes in nervous systems cannot be overestimated. The problem is further complicated by the enormous diversity of neurons in the central nervous system (CNS) and even in synapses of one neuron within a neural circuit. Large scale single-neuron analysis is not only challenging but mostly impractical for any model currently used in the neurobiological analysis of aging or age-related memory loss. We simply do not know: Do all neurons and synapses age differently or are some neurons (or synapses) more resistant to aging than others? What is happening in any given neuron while it undergoes “normal” aging? What are the genomic changes that make aging apparently irreversible? What would be the balance between neuron-specific vs. global genome-wide changes in aging? In this paper we begin to address these questions by developing a new model to study the entire scope of genomic and epigenomic regulation in aging at the resolution of single functionally characterized cells and even cell compartments.
Biology has often advanced by making use of relatively simple model systems. We selected Aplysia californica as the foremost experimental organism for the goals of the program. The sea slug, Aplysia is a representative of the largest superclade of bilaterian animals (Lophotrochozoa) which include annelids, flat worms and about ten less known phyla. The proposed long-term regulatory age-related mechanisms also take into account a high level of conservation among many epigenetic processes known to be lost in nematodes and flies which have extremely short lifecycles and particularly derived genomes (Figure 1 ).
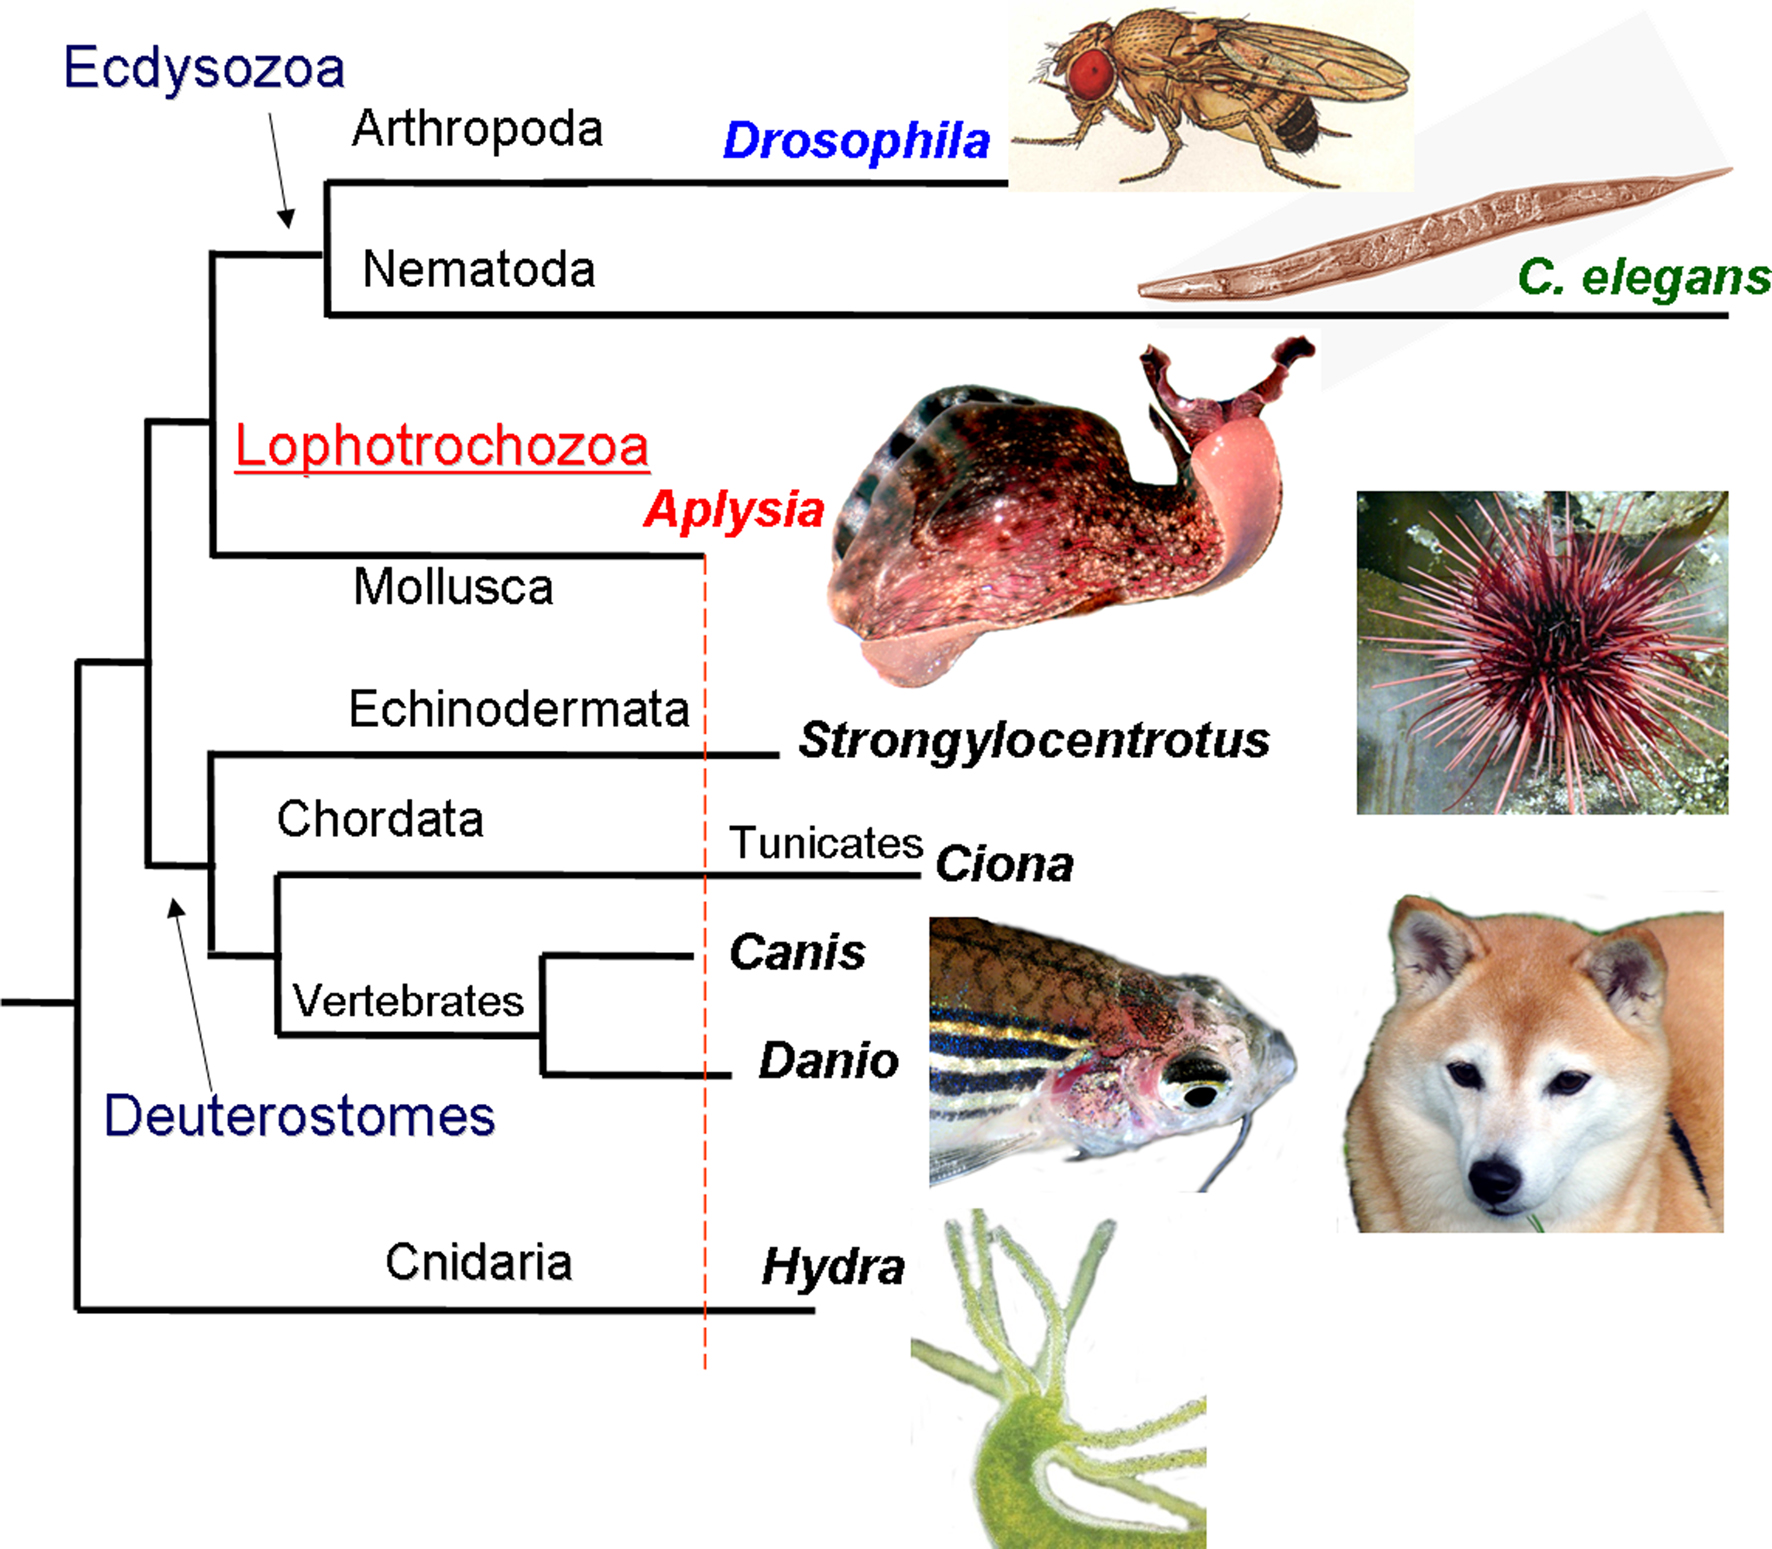
Figure 1. The phylogenetic position of Aplysia among other model organisms. Apparently, the mollusc Aplysia has a relatively slower evolving genome compared to other model organisms such as tunicates, sea urchins, cnidarians, nematodes and insects, with remarkable similarity found between Aplysia and mammals (modified from Moroz et al., 2006 ; Moroz, 2009 ; Walters and Moroz, 2009 ). The lengths of different branches reflect the amino acid replacement rate for 66 KOG genes (a cluster of evolutionarily conserved genes among eukaryotes). The longer branches (e.g., for the representatives of Ecdysozoa, Tunicates and Cnidarians) imply faster evolution rates and occurrence of more derived genomes in the lineages leading to Drosophila, C. elegans, Ciona, Strongylocentrotus and Hydra. A number of homologs of neurological disease related genes found in Aplysia also show a high level of conservation (Moroz et al., 2006 ); similarly DNA methylation, a process known to be lost in nematodes and flies with extremely short lifecycles and particularly derived genomes, remains conserved in Aplysia.
Most importantly, Aplysia posses the largest nerve cells (ranging from 30 to 1,100 μm, see Figure 2 ) in the entire animal kingdom with only eggs being larger (Kandel, 1976 ) and truly gigantic growth cones (up to 630 μm, Lovell and Moroz, 2006 ). These cells can be uniquely identified and mapped in terms of their well-defined interactions with other neurons, and have a limited number of recognized synaptic connections forming relatively simpler neural circuits underlying several stereotypic and learned behaviors (Kandel, 1976 , 1979 ). As indicated in numerous studies dealing with memory mechanisms, synaptogenesis (Kandel, 2001 ; Hawkins et al., 2006 ) and initial genomic characterization (Moroz et al., 2006 ) Aplysia has many parallels and similarities with learning and aging in mammalian models and humans including the presence of NMDA receptors (Moroz et al., 1993 ; Ha et al., 2006 ) and nitric oxide signaling pathways (Katzoff et al., 2002 , 2006 ; Bodnarova et al., 2005 ; Moroz, 2006 ; Antonov et al., 2007 ).
The phenomenology of aging dynamics in Aplysia has been studied in sufficient detail both in nature and under controlled aquaculture environments (Stommes et al., 2005 ; Gerdes and Fieber, 2006 ). Aplysia has a moderately short lifespan with a well characterized life cycle (Kriegstein et al., 1974 ; Kriegstein, 1977 ; Kandel, 1979 ; Heyland and Moroz, 2006 ). Aplysia can live under different conditions and predictably the life expectancy depends on the diet and temperature.
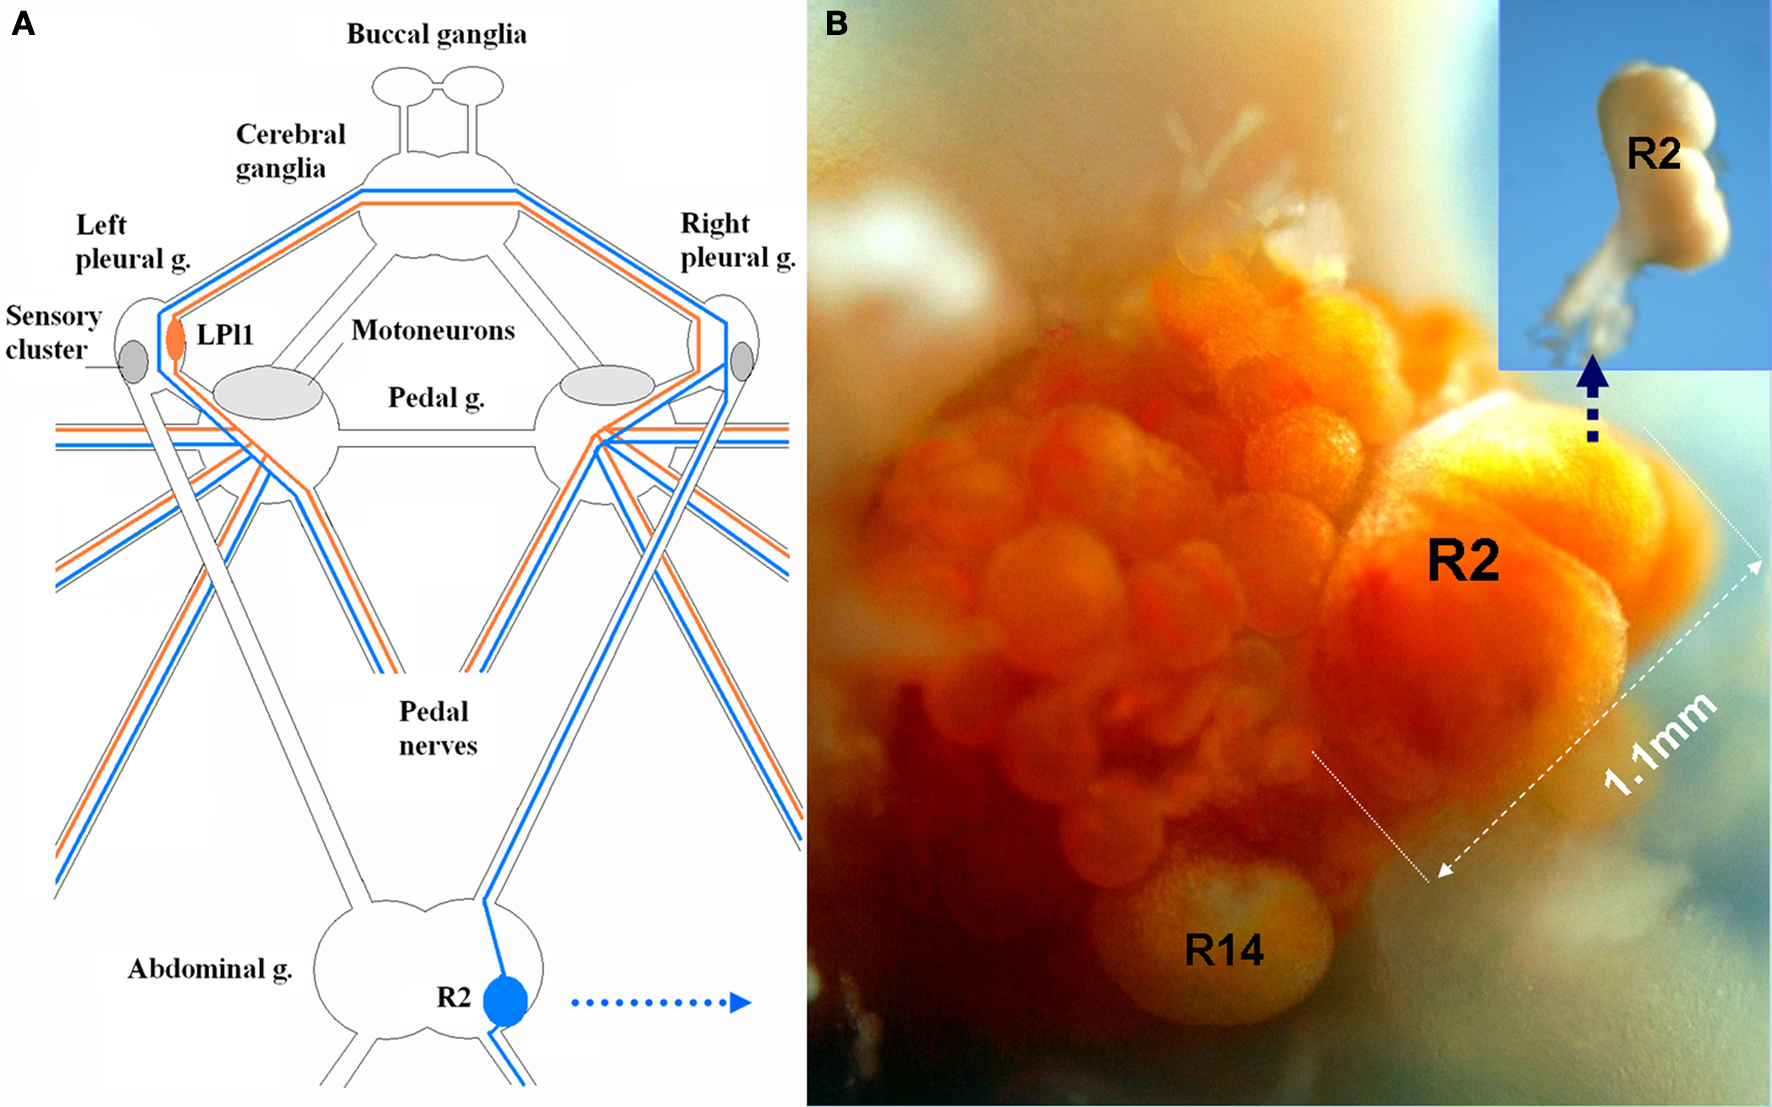
Figure 2. Indentified motor neurons (LPl1 and R2) in Aplysia are among the largest somatic cells in the animal kingdom. (A) A schematic diagram of the central ganglionic nervous system of Aplysia with positions of two giant neurons (LPl1 and R2), mechanosensory pleural neurons (SN) and motor pedal neurons. LPl1 is located in the left pleural ganglion (red lines represent major axonal branches) and R2 in the abdominal ganglion (blue lines represent major axonal branches). Both the positions of these neurons and their axonal pathways are highly conserved across individuals, and these cells can be reliably identified in closely related species of the genus Aplysia (modified from Hughes and Tauc, 1961 ; Kandel, 1976 ) (see details in the text). (B) A photograph of the freshly dissected right abdominal semi-ganglion with the positions of R2 and R14 neurons marked (connective tissues from the ganglionic surface were removed and the natural coloration of cell somata were preserved). This R2 cell is the largest neuron ever photographed reaching 1.1 mm in diameter. When this cell was isolated (insert) and fixed in 100% ethanol it lost its pigmentation. 1.965 μg of total RNA was obtained from this neuron. These cells can also provide from 150 to 250 ng of DNA depending upon cell size.
Aplysia grow linearly for most of their adult life; thus the existence of senescence indicates that aging is not a by-product of the cessation of growth (Hirsch and Peretz, 1984 ). Mean lifespan of animals fed ad libitum was approximately 228 days. In contrast, animals fed limited rations lived much longer (an average of 375 days) and showed a lower initial mortality rate, suggesting that calorie restriction prolongs lifespan (Gerdes and Fieber, 2006 ). Aging rate was highest for animals reared at 21°C and would account for the accelerated lifecycle observed at higher temperatures (Stommes et al., 2005 ). Thus, life expectancy for Aplysia is about 150–350 days under various conditions.
The mechanisms of aging in Aplysia are less investigated. Nevertheless, it was evident from earlier studies that fundamental regulatory processes are impaired by aging beginning with middle aged (3–6 months) animals (Sloan et al., 1999 ). Decreases of excitability, conductivity (Harley, 1975 ; Ohmori, 1981 , 1982 ; Rattan and Peretz, 1981 ) and synaptic plasticity (Ohmori, 1982 ) with aging offer parallels similar to processes in vertebrates but in Aplysia it appears to be remarkably cell-specific. For some motor neurons (such as R2 or L7) it is documented that aging is associated with increased capacitance and reduced input resistance (Harley, 1975 ; Rattan and Peretz, 1981 ) and pigment accumulation (Papka et al., 1981 ). This means that there are specific behaviors, circuits, identified neurons and possibly synapses that are more affected by aging than others. For example, two well-studied behaviors, the gill withdrawal reflex and osmoregulation responses, as well as their neural substrates, are age-sensitive. In contrast, a third, gill respiratory pumping movements and its neurons, is age-invariant (Peretz et al., 1984 ; Peretz, 1988 ).
It is still unclear why some neurons and synapses are age resistant – perhaps because specific functional studies on individual neurons were not linked to molecular analysis of the same cells.
Here we have implemented a single cell expression profiling approach by focusing upon only two classes of cholinergic motor neurons in Aplysia as the proof-of-concept type of study. The unique features of these symmetrical neurons (Figure 2 ) allow one to perform and validate cell by cell comparisons. Our initial analysis indicates that different cholinergic neurons revealed highly differential genome-wide changes following aging, suggesting that on the molecular scale different neurons indeed age differently. In addition, we have identified a number of evolutionarily conserved and group-specific genes that are age-related, including components of apoptosis and chromatin remodeling.
Materials and Methods
Animals and Single Cell Isolation
Specimens of Aplysia californica were obtained from the Aplysia Facility at the University of Miami and maintained for up to 1 week in marine aquaria with running sea water at 16–18°C and fed twice per week with an unrestricted diet of Gracilaria. All dissection and single cell RNA isolation protocols were as described elsewhere (Moroz et al., 2006 ). Briefly, the animals were anesthetized by injection of 370 mM MgCl2. The CNS was immediately dissected; connective tissues from individual ganglia were removed after 45 min treatment with trypsin (1%), washed twice in cold artificial sea water (460 mM NaCl; 10 mM KCl; 55 mM MgCl2; 11 mM CaCl2; 10 mM HEPES, pH 7.6) and then quickly transferred to 100% ethanol. Since the selected identified neurons (LPl1 and R2) are among the largest known neurons and are easily identified at the ganglionic surface, these cells can be unbiasedly recognized and physically isolated using glass microelectrodes within 1–3 min as shown in Figure 2 . Immediately after the isolation step each of the identified neurons was transferred to 100 μl of lysis buffer (Cat # 1291, Ambion) and RNA isolation was performed using an RNA isolation kit (RNAqueous-Micro; Cat # 1291, Ambion). The quality control and quantification of freshly isolated CNS was performed using a Bioanalyzer and by spectrophotometer (Gene Spec III, MiraiBio Inc., Japan) and RNA was stored at −80°C. Since one cell can produce on average high nanogram to low microgram quantities of total RNA (see Table S1 in Supplementary Material or GEO 18783), this amount is sufficient for both microarray and control quantitative real-time PCR (QRT-PCR) tests. Labeling and microarray hybridization experiments were performed within 1–3 days after RNA isolation.
Microarray Experiments and Data Analysis
In the microarray experiments we used two custom 44,000 oligonucleotide arrays which were constructed in collaboration with Agilent Technologies using 60-mer oligonucleotide probes designed from each nonredundant sequence in the Aplysia neuronal EST database as described earlier (Moroz et al., 2006 ). The data including materials and methods discussed in this publication have been deposited in NCBIs Gene Expression Omnibus (GEO) and are accessible through the GEO Series accession number GSE18783 with platform accession numbers; GPL3635 record: Aplysia Annotated Array AAA and GPL3636 record: Aplysia Discovery (un-annotated) Array DAA. Additional details about the protocols used including a list of features on each array can be found at the GEO web site.
Three types of array experiments were designed. Two direct comparison array experiments were initially performed. First, we compared gene expression profiling of the entire abdominal ganglion (approximately 1,000 neurons) from young (∼3–4 months) vs. older (∼7–10 months) animals. The age in commercially reared Aplysia is measured as the time from larvae hatching. That can be detected directly since the age of egg masses and hatching is routinely recorded.
Second, we made direct comparison of single individually isolated R2 cells from young animals (∼3- to 4-month-old, 25–40 g) with R2 isolated from older animals (∼7–10 months, 1000–1500 g). Third, a reference design scheme was implemented (Figure 3 A) in order to compare age-related changes in two different cell types R2 and LPl1, both cholinergic motor neurons (Figure 2 A). In this experiment we combined RNA isolated from the CNS (all nine central ganglia, from four middle-age animals: 200–250 g) as a reference platform. Thus, we estimated age related changes in two different neurons to a reference sample. Importantly, here we used the very same material from individual “old” R2 neurons as in the second experiment with direct comparison of R2 young and R2 old (different young R2s were used because of less RNA obtained from these cells).
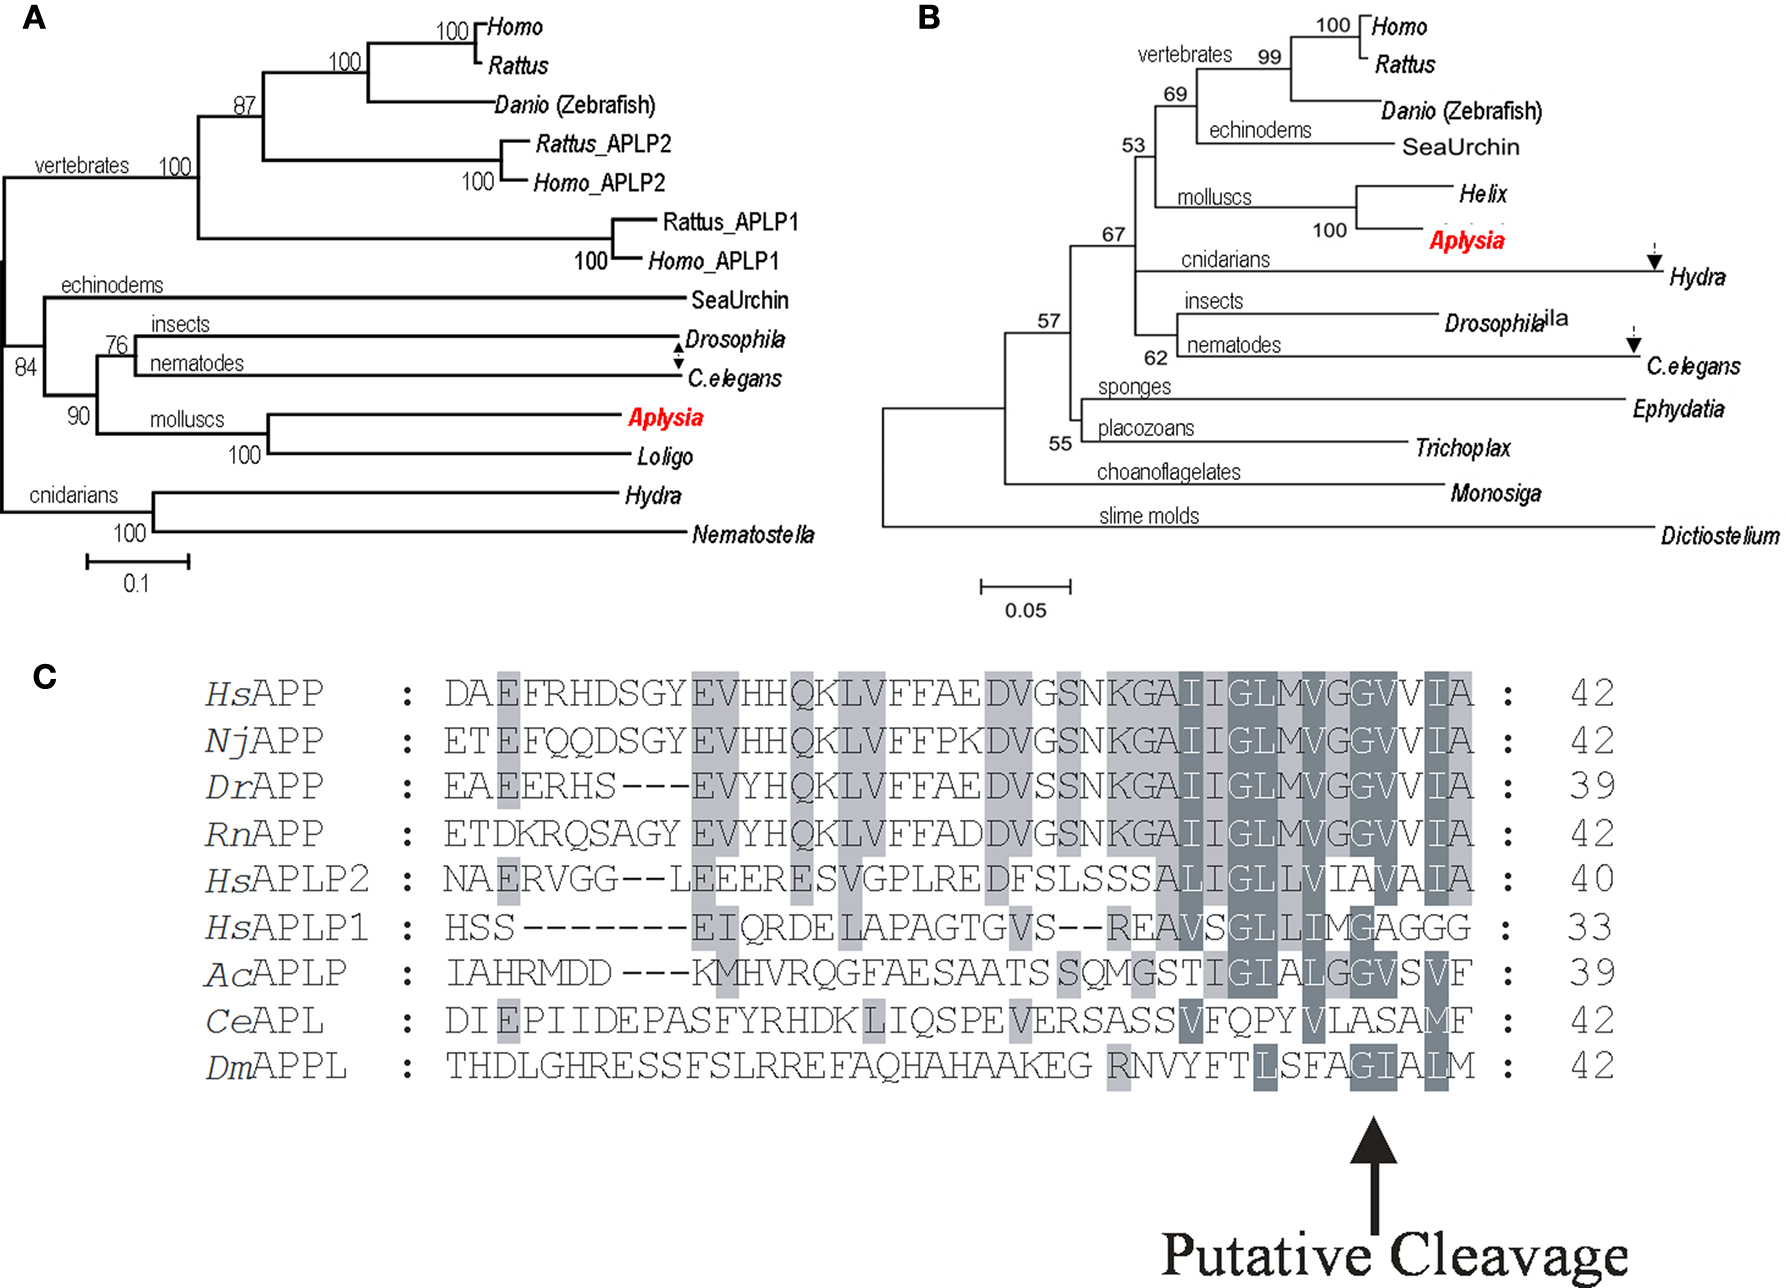
Figure 3. Phylogeny of Alzheimer’s disease associated proteins. (A) The phylogenetic tree for amyloid precursor protein. (B) Phylogenetic Tree for Presenilins. The position of Aplysia homologs is marked by red while arrows indicate the position and branch length for Drosophila and C. elegans homologs as more derived proteins (see text for details). (C) Predicted Aplysia amyloid-like B peptide and the conservation of a putative cleavage site. Aplysia amyloid-like B peptide shares higher identity to the human APP, BAA22264, APLP1, NP_005157.1 and APLP2, NP_001633.1, including the putative cleavage site by γ-secretase, than C. elegans, AAK68242 or Drosophila, NP_476626.2. Shark, Narke japonica BAA24230.1, zebrafish, Danio rerio AAK64495, and rat, Rattus norvegicus AAH62082.1 are included. Tree construction and sequence analysis. The phylogenetic tree was generated using default parameters and 10,000 iterations of the maximum likelihood algorithm implemented in the program TREE-PUZZLE (http://www.tree-puzzle.de ). The initial multiple alignment was done using ClustalX (Thompson et al., 1997 ; Jeanmougin et al., 1998 ) with default parameters; all gaps were removed manually in GeneDoc (Nicholas et al., 1997 ) prior to tree construction. The numbers at branches represent bootstrap values for 10,000 iterations. Branch-length scale bars represent 0.1 (APP) and 0.05 (presenilins) amino acid substitutions per site. The graphical output was generated using Treeview (Page, 1996 ). All protein predictions were determined with Prosite (www.expasy.org/cgi-bin/scanprosite ) and SMART (www.smart.embl-heidelberg.de ). GB accession numbers for APP and APLP proteins are as follows: Aplysia californica, AY535409; Nematostella vectensis, XP_001637354.1; Hydra magnipapillata, XP_002154415.1; Caenorhabditis elegans, AAK68242.1; Loligo pealei, ABI84193.2; Drosophila melanogaster, NP_476626.2; Homo sapiens APP, CAA31830.1; Homo sapiens APLP1, NP_001019978.1; Homo sapiens APLP2, EAW67769.1; Danio rerio (zebrafish), NP_690842.1; Strongylocentrotus purpuratus (sea urchin), XP_790315.2; Rattus norvegicus APLP1, EDM10627.1; Rattus norvegicus APLP2, XP_001056087.1; Rattus norvegicus APP, NP_001094272.1. For the presenilin proteins: Aplysia californica, AY535407(1-1); Helix lucorum, AAG28518.1; Trichoplax adhaerens, EDV23712.1; Ephydatia fluviatilis, BAE19681.1; Monosiga brevicollis MX1, EDQ85205.1; Dictyostelium discoideum AX4, XP_635158.1; Hydra magnipapillata, XP_002168313.1; Drosophila melanogaster, NP_524184.1; Homo sapiens, BAD96893.1; Rattus norvegicus, EDL81456.1; Danio rerio (zebrafish), CAB40386.1; Strongylocentrotus purpuratus (sea urchin), XP_001178864.1.
In all cases three biological replicates were performed. All data are deposited at GEO Series accession number GSE18783. For a list of the animal weight, diameter of cell isolated, and the amount and concentration of RNA extracted see Table S1 in Supplementary Material at GEO GSE18783.
False Discovery Rate (FDR) was performed using significance analysis of microarrays (SAM – a statistical technique for finding significant genes in a set of microarray experiments). Analysis for the direct comparison array experiments was performed by significance tests with a 5% FDR and 2-fold change cut-off. All descriptions of the tests and statistical analysis are also deposited at GEO Series accession number GSE18783.
The reference design microarray experiment was analyzed by a standard multivariate analysis of variance (MANOVA) that is a generalized form of univariate analysis of variance (ANOVA). This analysis is used in cases where there are two or more dependent variables as well as identifying whether changes in the independent variable(s) have significant effects on the dependent variables (MANOVA is also used to identify interactions among the dependent variables and among the independent variables). Our MANOVA model has three factors (or effects): Tested Cells/treat (R2, LPl1, CNS), Age (Young, Old, Reference – middle age), and Cells/*Age. Our major focus was on single cell specific expression changes as well as their changes as a function of age. The reported column correlates are GENENAME, HITDEF, best hit definition, EVALUE evalue for the best hit definition, ABUNDANCY the abundance of the target sequence in EST collection Effect, TREAT_TREAT, FOLD CHANGE which is an estimated log ratio between the two samples: log (Old R2/Young R2), base e = 2.718 StdErr the error bar of Estimate. Probt is the probability that the effect is just random noise. A smaller Probt means the effect is significant in the differential expression among different samples. All data were trimmed to ≥2-fold Change and a Probt ≤0.05 or a 95% confidence level which means <5% false positives. All data and their analysis for each microarray feature is also deposited at GEO Series accession number GSE18783.
Cloning of Transcripts of Interest
Selected transcripts showing differential expression in the array experiments were cloned, then their expression was validated by QRT-PCR or in situ hybridization (Tables 2 and 3 ). We used previously reported Aplysia EST data (Moroz et al., 2006 ) for the initial probe design. These probes from the transcripts of interest were used as the starting points for cloning of all transcripts. Both 5′ and 3′ RACE were performed to obtain the full-length cDNA transcripts which were cloned into pCR 4-TOPO (Cat # K4575-01, Invitrogen) then eight clones were sequenced. Full-length cDNA sequence for AcAPP (GenBank accession number AY535409) was obtained using terminal primers: 5′-CACCAACGTAGTGGAGGCCTG-3′ and 5′-CTCAAAGTATTTGTACGTGGGGT-3′ with amplified cDNA from the CNS and buccal ganglia libraries. Full-length cDNA sequence for AcPSEN1-1 (GenBank accession number AY535407) was obtained using terminal primers: 5′-ATATTGACTGCATGAATCC-3′ and 5′-GAAAGTGACAGTCGTACGCTAT-3′ with amplified cDNA from the CNS library. The full-length transcripts were deposited in GenBank with the accession numbers listed in Tables 1 and 2 .
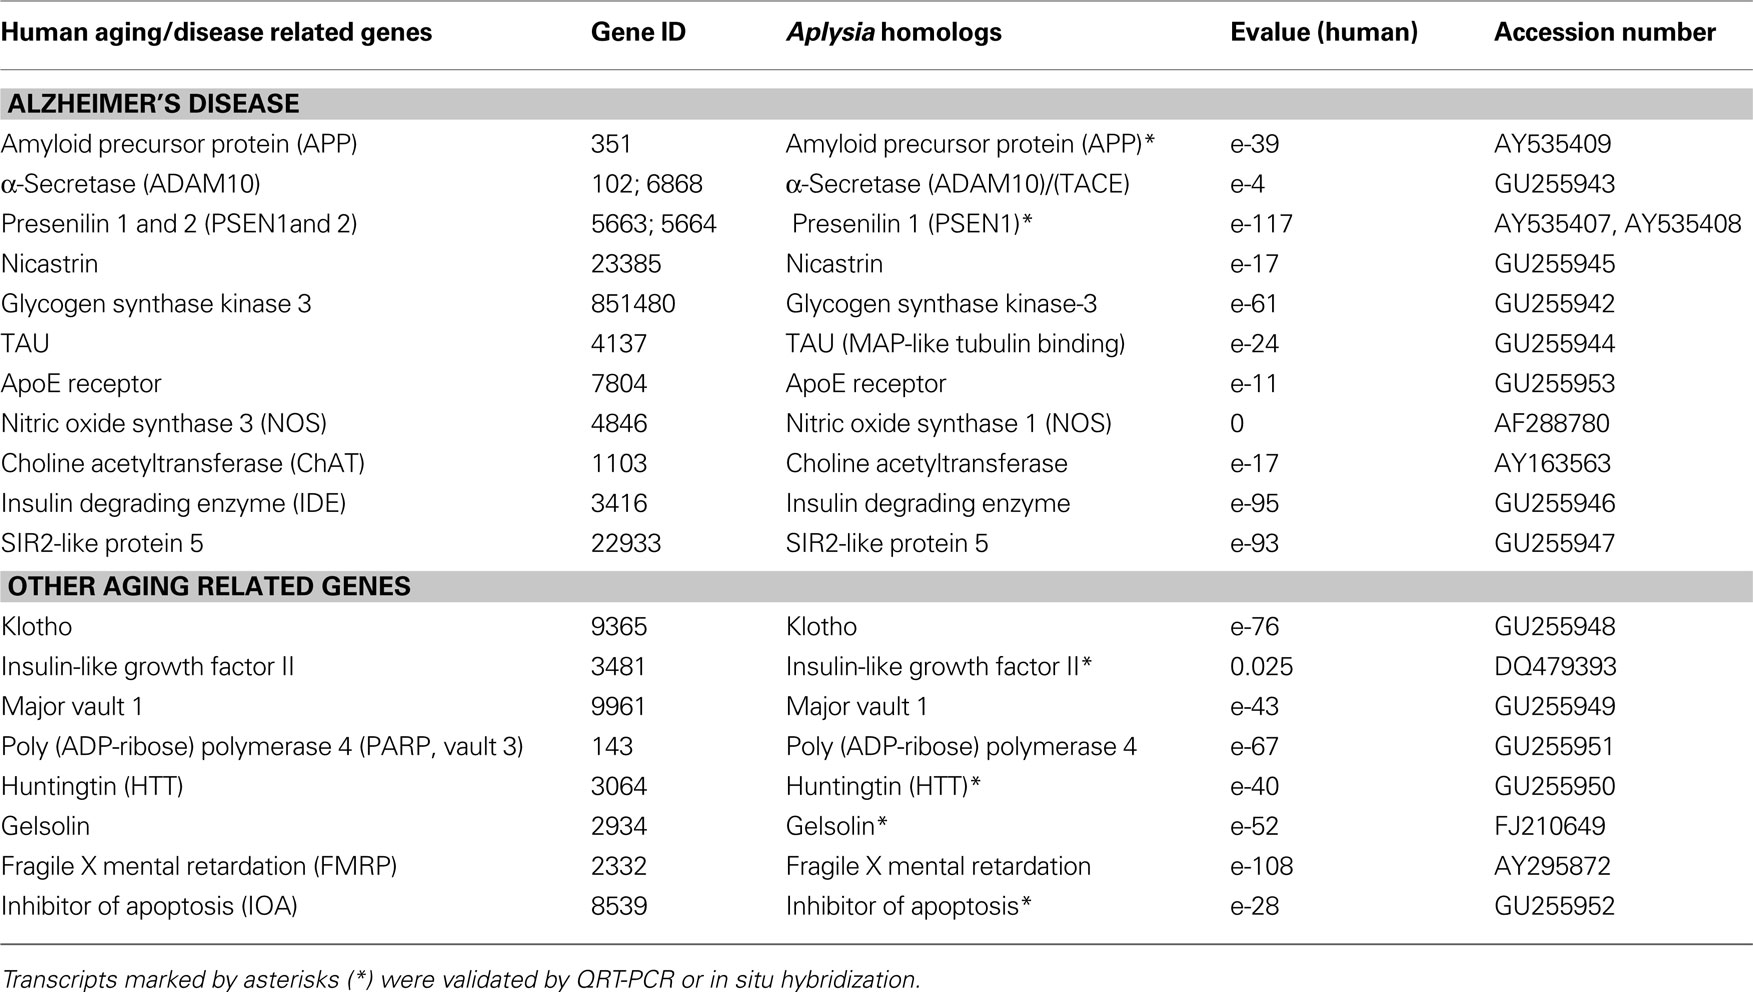
Table 1. Identified Aplysia homologs of genes involved in Alzheimer’s disease and aging (human GeneIDs were obtained from OMIM® Online Mendelian Inheritance in Man).
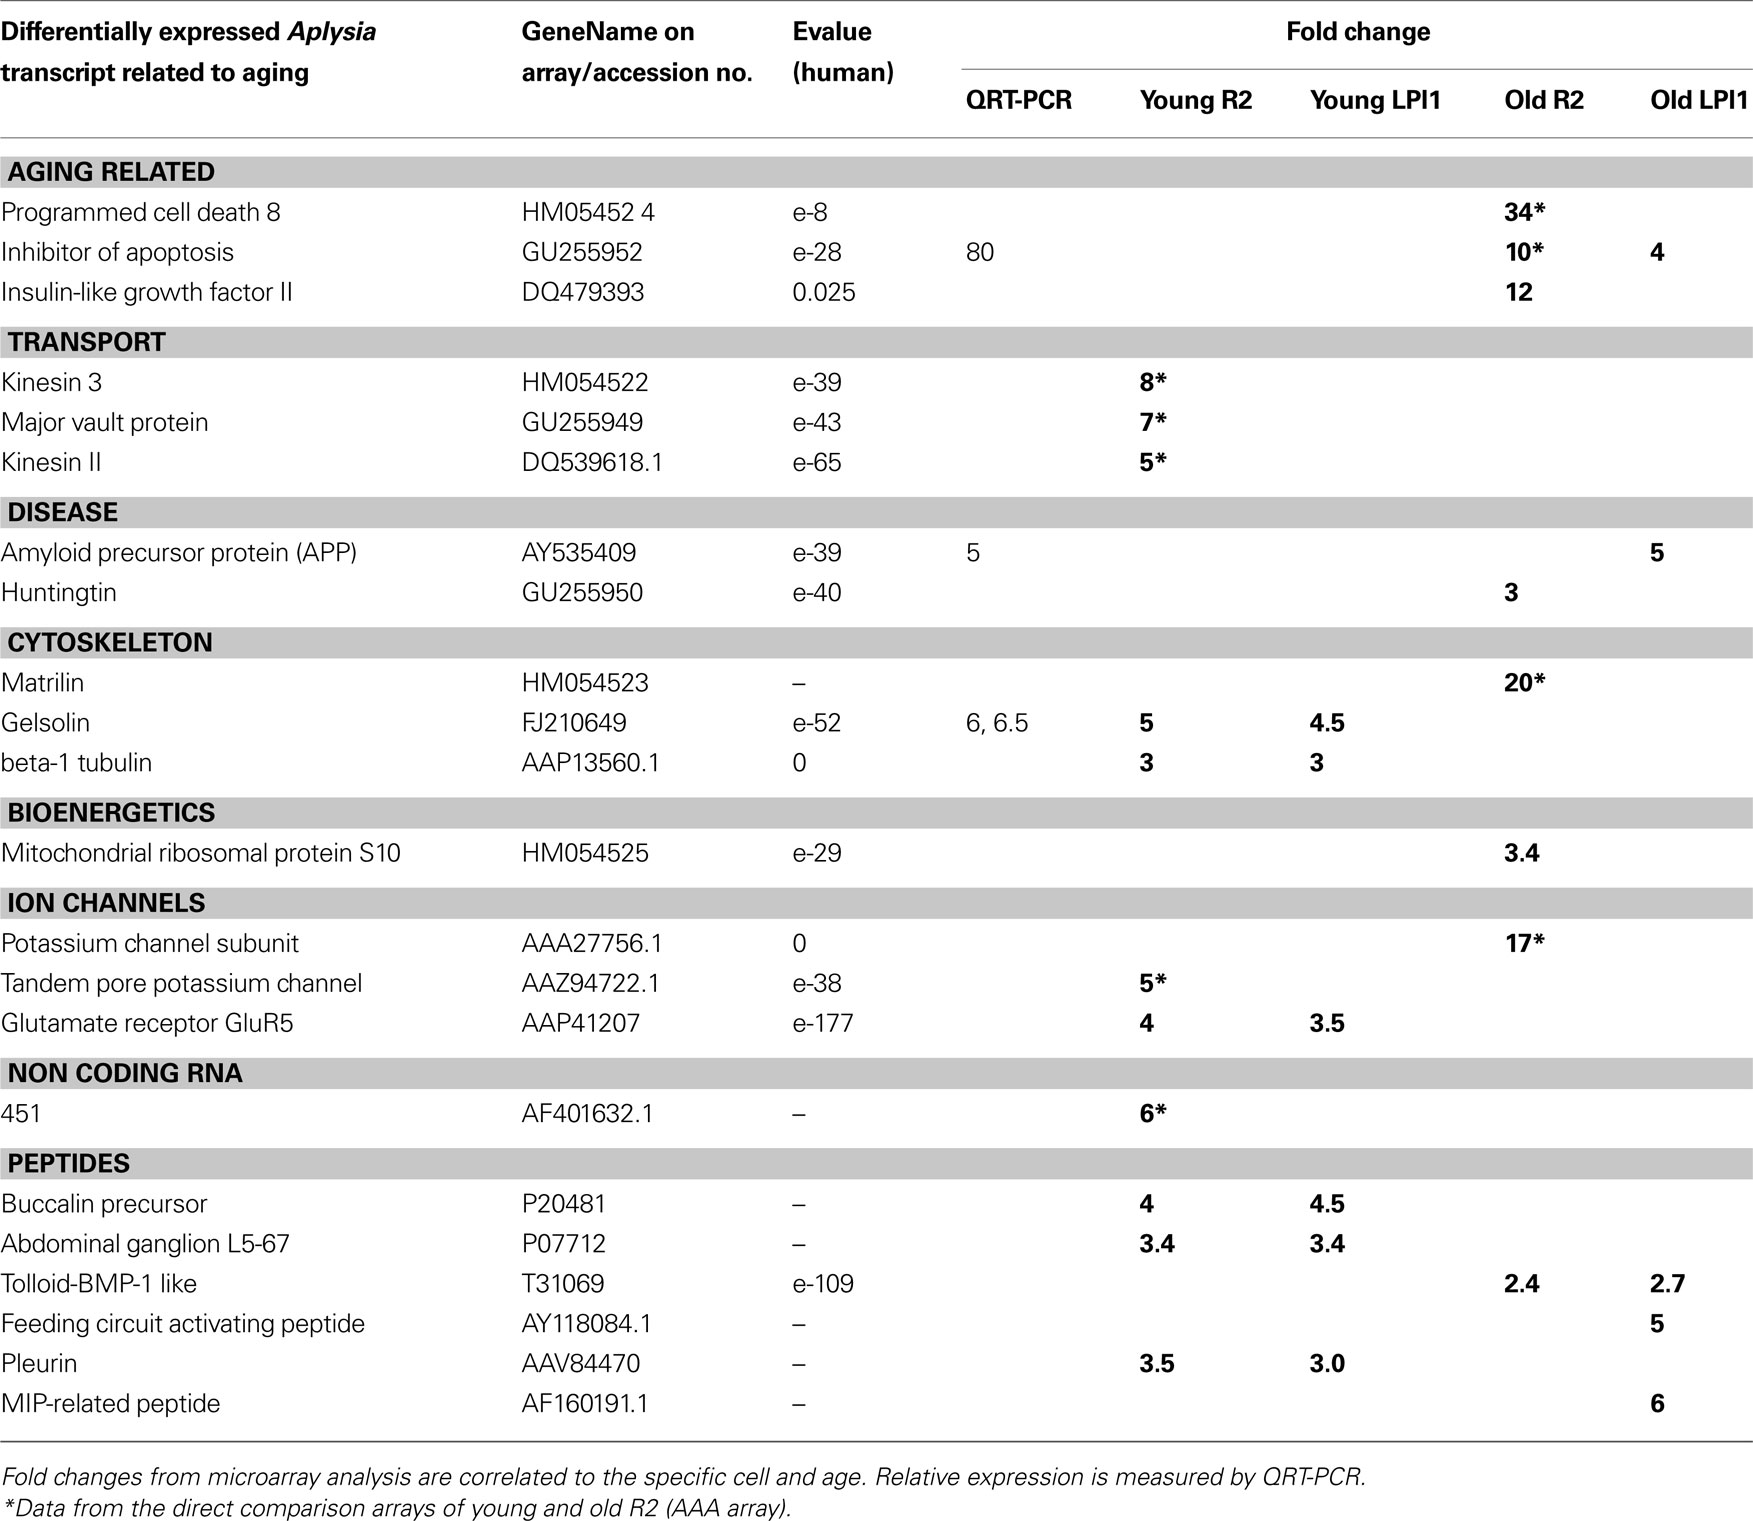
Table 2. Age-related changes in expression of selected genes between two identified cholinergic neurons: R2 and LPl1.
Tree Construction and Sequence Analysis
The phylogenetic tree was generated using default parameters and 10,000 iterations of the maximum likelihood algorithm implemented in the program TREE-PUZZLE 1 . The initial multiple alignment was done using ClustalX (Thompson et al., 1997 ; Jeanmougin et al., 1998 ) with default parameters; all gaps were removed manually in GeneDoc (Nicholas et al., 1997 ) prior to tree construction. The numbers at branches represent bootstrap values for 10,000 iterations. Branch-length scale bar represents 0.1 amino acid substitutions per site. The graphical output was generated using Treeview (Page, 1996 ). All protein predictions were determined with Prosite 2 and SMART 3 .
Quantitative Real-Time PCR
Quantitative real-time PCR was used to validate differentially expressed transcripts on the arrays. RNA was extracted from similar single cells of young or old animals as described above using RNAqueous-Micro (Cat # 1291, Ambion). The RNA is DNased as described in the RNAqueous-Micro kit. cDNA synthesis was produced with random hexamers as the primers and SuperScript� II (Cat # 18080-093, Invitrogen). cDNA products were diluted and aliquoted to 100 ng total RNA input. Sequences of the genes of interest were loaded into Primer Express® software (Applied Biosystems) and primers designed. Amplicon lengths were between 75–125 bp. Two-Step RT-PCR was performed in which the RT and PCR were done separately with the SYBR Green PCR Master Mix (Applied Biosystems, catalog # 4309155) on an ABI 7700 Sequence Detection System (Applied Biosystems). The linear dynamic range of the input RNA (cDNA) from 1 ng to 10 pg was determined. All primer sets were tested for optimal dissociation curves and amplification efficiencies between 85 and 100% and all primer sets not meeting the standards were redesigned. All runs were normalized to 18s RNA, our endogenous control. The relative standard curve method was employed for analysis and an expression ratio calculated for each sample pair. All data were performed in quadruplicate and statistics analyzed by the relative standard curve method.
Direct Single Cell 454 Pyrosequencing
We used an unbiased method of library construction, applicable for single neurons, for transcriptional profiling that is both quantitative and qualitative and that preserves the direction of transcripts. We used commercially available kits (Marathon® cDNA Amplification Kit, Cat #634913, Clontech) to ensure consistency and reproducibility. Methods for single neuron manipulation, RNA extraction, and RNA quantification were the same as described above. Due to the limited amount of material for single cell applications total RNA quantification and quality is critical. For cDNA library constructions we used one cholinergic R2 neuron, one L7 motor neuron, three serotonergic MCC neurons and a cluster of approximately 200 sensory neurons. Library construction starts with total RNA reverse transcribed to cDNA with an oligo dT primer, then second strand generated. The double stranded cDNA is fragmented with the restriction enzyme Alu1 (Cat # R0137s, New England Biolabs Inc.) then 454 specific adaptors are ligated onto the double-stranded cDNA. The 5′ or 3′ preferential directions of the constructed libraries are determined by timing of the digestion and the ligation of adaptors. Fragmented DNA with ligated adaptors is processed through an emulsion-based clonal amplification (emPCR) then captured onto beads as required for subsequent sequencing steps. DNA-captured beads are placed on a PicoTiterPlate device for pyrosequencing using the 454 FLX platform. The sequencing method is both qualitative and quantitative as well as preserving the direction of transcripts. We validated the quantitative aspect with absolute RT-PCR and spiked in controls; the direction was similarly validated with spiked in controls. In summary, we obtained over 2.3 million sequences or 321 million bases from these four neuronal libraries. These data allow us to quantify a given transcript by obtaining the number of reads specific to that transcript and expressing a % relative to the total number of sequences for the neuron of interest (Figure 5 A). In addition the sense and antisense of any specific transcript can be determined and reported as % antisense (Figure 5 B).
In situ hybridization for whole mount CNS from Aplysia was performed as described in detail elsewhere (Jezzini and Moroz, 2004 ; Walters et al., 2004 ; Jezzini et al., 2005 ). Briefly, we used cloned full-length cDNA from Table 2 for the preparation of in situ probes. The antisense probe was generated by digesting plasmid DNA with NotI (Cat # R0189s, New England Biolabs Inc.) then transcribed with T3 polymerase from the DIG RNA Labeling Kit (Cat # 11 175 025 910, Roche Diagnostics). The control sense probe was produced by the same protocol but used Pme1 (Cat # R0560s, New England Biolabs Inc.) to digest the cDNA and T7 polymerase for transcription. The DIG-labeled antisense probes were hybridized to whole mount CNS preparations, and the neurons containing the probe-target duplex were localized and visualized with alkaline phosphatase-conjugated anti-DIG antibody fragments (Cat # 11 093 274 910, Roche Diagnostics). Expression patterns in the CNS were investigated in all central ganglia from at least three experimental (antisense probe) and three control (sense probe) CNS preparations. Control in situ hybridization experiments with full-length sense probes revealed no specific and selective staining in the CNS under identical conditions and labeling protocols. Images were acquired with a Nikon Digital Sight DS-5M digital camera mounted on an upright Olympus SZX12 microscope.
Results
Identification of Age-Related Gene Homologs in Aplysia
Aplysia, similarly to many other representatives of the superclade Lophotrochozoa, has a relatively slow rate of evolution of its genes, suggesting preservation of an ancestral subset of genes compared to faster evolving genomes as in nematodes and flies (Figure 1 ). Thus, it is likely that Aplysia neurons possess a diversity of gene homologs known to be associated with aging diseases in humans, including Alzheimer’s. We addressed this question by both direct sequencing from specific cells and analysis of gene expression patterns using microarrays.
As a result, we have identified a suite of human age-related homologs in Aplysia (Table 1 ). All of these genes have recognizable and highly conserved motifs with their human counterparts. The reconstructed phylogenetic trees (Figures 3 A,C) show that the evolutionary distance (represented by branch length) from Aplysia to humans is shorter than the distance from some other invertebrate models to humans. This indicates that the amino acid replacement rate has been lower in the lineage leading to Aplysia than in the lineages leading to Drosophila and C. elegans for example.
Previous comparative analysis of evolutionarily conserved genes supports this hypothesis: greater similarity was found between human and Aplysia proteins, confirming a slower rate of protein evolution than in the lineages leading to Drosophila and C. elegans or sea urchin (Moroz et al., 2006 ). It was also shown that more than a hundred homologs linked to human neurological diseases are expressed in the CNS of Aplysia (Moroz et al., 2006 ) while a fraction of them were lost in flies and nematodes.
Aplysia homologs of genes associated with alzheimer’s disease
Two prominent Aplysia homologs of the Alzheimer’s disease (AD) related transcripts are amyloid precursor protein (AcAPP) and presenilins or gamma-secretases. In the etiology of AD, cleavage of the APP by β and γ secretases leads to the deposition of an amyloid β peptide (Aβ) as plaques in brain tissue of AD patients (Selkoe, 1991 , 1999 ; Hardy and Higgins, 1992 ; Hardy and Selkoe, 2002 ; Walsh et al., 2007 ).
AcAPP cDNA is a 2074-bp transcript that encodes a putative 668 amino acid protein. The Aplysia AcAPP shares 29% overall identity with the human APP while the predicted Aplysia Aβ like peptide has higher (∼50%) identity to the human Aβ peptide (including the putative secretase cleavage site – Figure 3 B) compared to Drosophila at 15% or C. elegans at 4%. The predicted AcAPP contains all functional domains such as the A4_EXTRA and β-amyloid precursor protein C-terminus domains. Phylogenetic analysis for the family of APP genes implies that at least two gene duplication events occurred for the APP gene family: the vertebrate APP, APLP2 duplication event and an earlier duplication event for the APLP1 genes (Figure 3 A). The majority of the invertebrate APP gene family forms a separate lineage that is more basal to the others.
The AcAPP was widely distributed across the CNS. In fact, it is one of the most highly expressed transcripts, comparable in abundance to cytoskeleton proteins and selected neuropeptides. The AcAPP is expressed in a majority of neurons throughout the CNS but it is not uniformly distributed, having prominent expression in several groups of motor neurons (e.g., E- and A-/B-cluster cells Figure 4 D) such as cholinergic neurons (including R2 and LP1, Figure 4 B) as well as in modulatory serotonin containing interneurons (MCC, Figure 4 D) known to be involved in feeding arousal (Weiss and Kupfermann, 1976 ; Kupfermann et al., 1979 ; Kupfermann and Weiss, 1982 ).
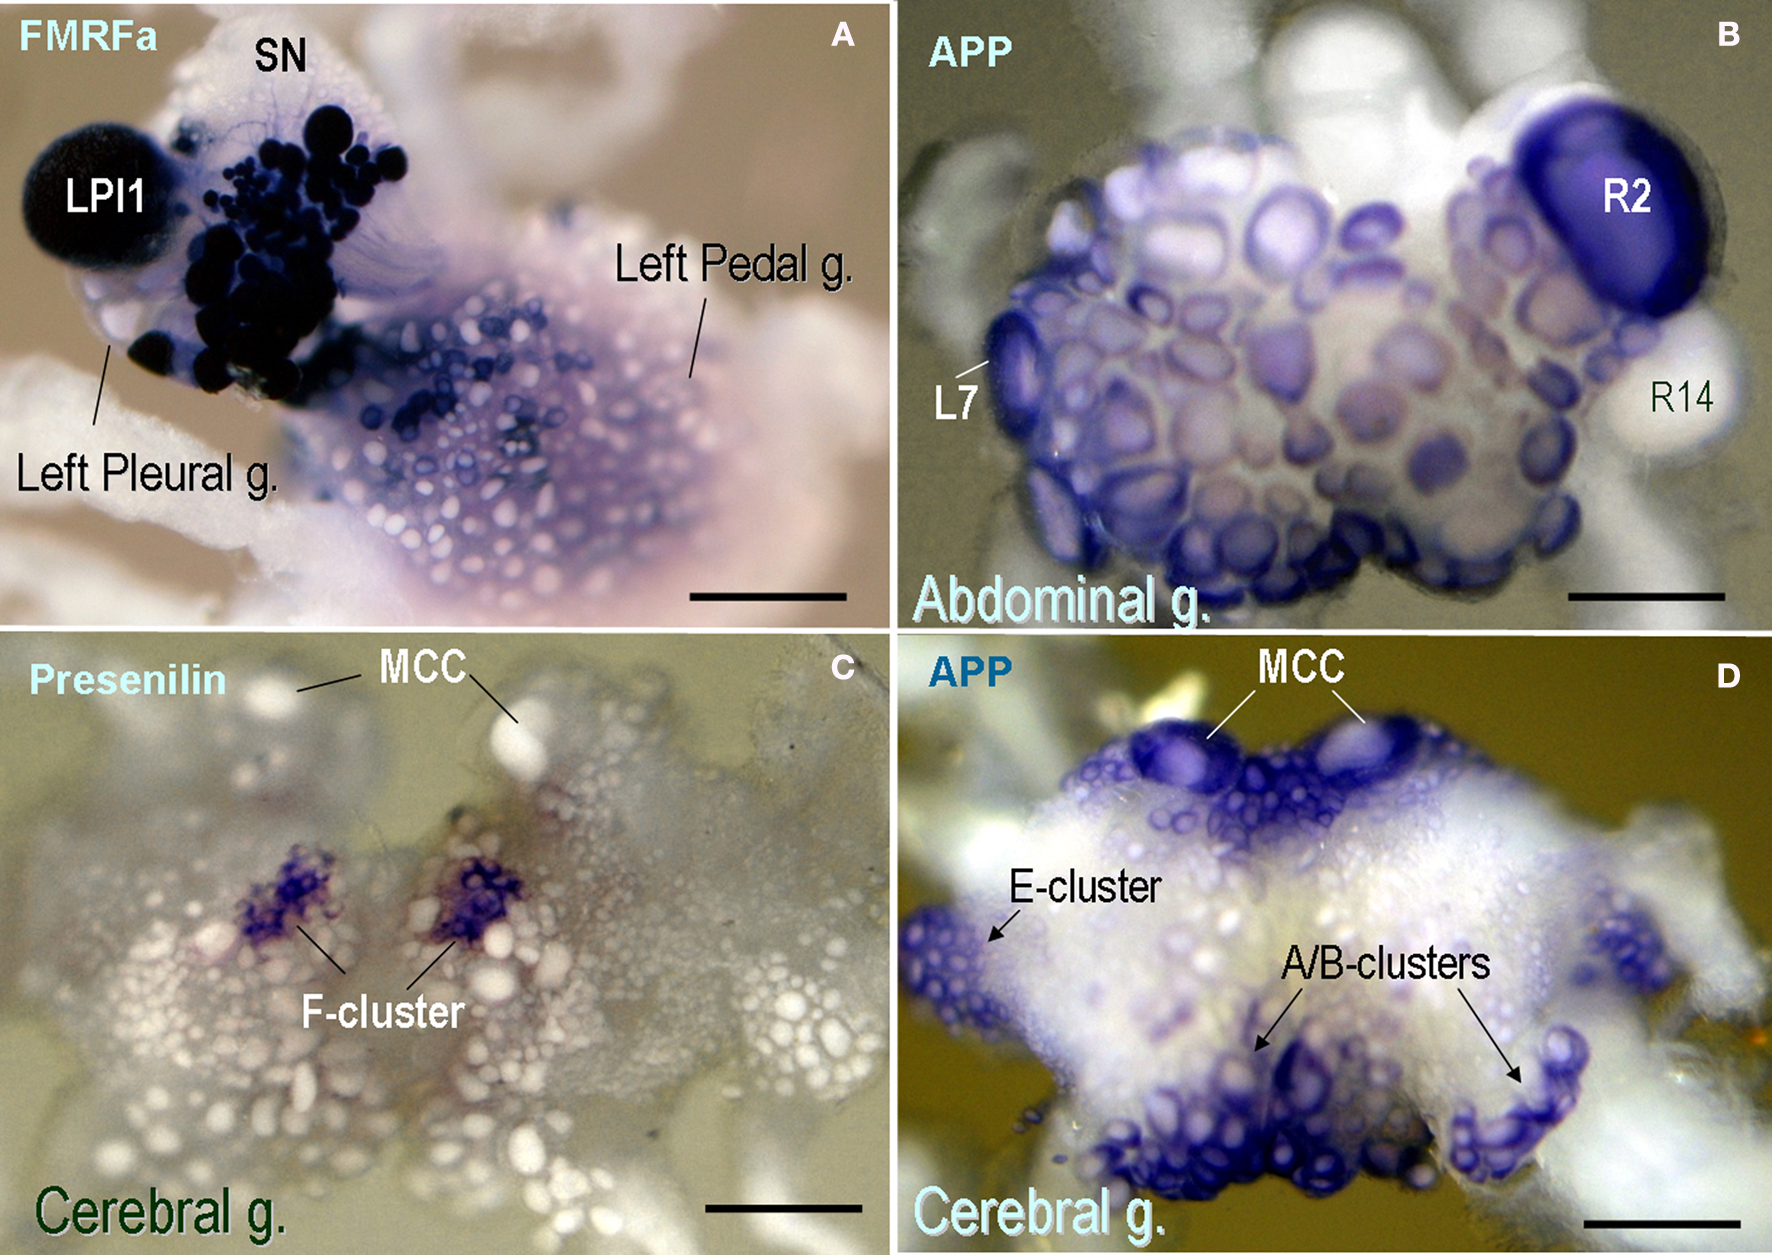
Figure 4. Expression patterns of selected neuronal genes in the CNS of Aplysia californica (in situ hybridization). (A) FMRFamide expression in the pleural-pedal ganglia (dark-blue cells); Giant LPl1 neurons (as well as R2 neurons – not shown) contain FMRFamide while pleural sensory neurons (SN) do not express this transcript. (B) The expression of the amyloid precursor protein (APP) mRNA in the abdominal ganglion (dorsal view). Note a prominent expression of APP in R2 and selected motoneurons including L7. The neurosecretory neuron R14 does not show any noticeable expression of this mRNA. (C) Aplysia presenilin is selectively expressed in F-cluster neurons known as a neurosecretory center involved in control of animal bioenergetics. Serotonergic modulatory MCC neurons are shown in the anterior part of the cerebral ganglion (dorsal view) for orientation purposes; these cells are involved in feeding arousal and do not express a detectable amount of presenilin. (D) The expression of the amyloid precursor protein (APP) mRNA in the cerebral ganglion. Note a prominent expression of APP in MCC and selected groups of motoneurons including E-, A- and B-clusters (arrows). Scale bars: (A) 450 μm; (B) 500 μm; (C) 400 μm; (D) 410 μm.
In mammals, presenilins 1 and 2 (PSEN1 and PSEN2), which are processing enzymes of APP and the ApoE4 protein, are implicated in the etiology of AD (Walsh and Selkoe, 2004 ; Selkoe and Wolfe, 2007 ). In Aplysia we indentified two putative isoforms of Presenilin 1-1 and 1-2 (AcPSEN1-1 and 1-2); each contains all 8 transmembrane regions and the peptidase_A22B domain. These predicted proteins AcPSEN1-1 (581aa) and 1-2 (561aa) share high identity with each other and 46% identity with human PSEN1. Two highly conserved aspartic acid residues are necessary for γ-secretase function and are present in both AcPSEN1s at Asp291, Asp466 for AcPSEN1-1 and Asp271, Asp446 for AcPSEN1-2 (Tandon and Fraser, 2002 ). The presenilin family of proteins appear to be phylogenetically ancient and well conserved across a diverse range of eukaryote species, including slime molds, choanoflagellates (as a sister group for animals), basal metazoans, molluscs, insects, fish and vertebrates (Figure 3 C). In addition to the reported data for Aplysia, it is only mammals that have the closely related PSEN2.
In contrast to APP, presenilins are less abundant in the CNS. The in situ hybridization shows very localized expression in the CNS with the highest levels for the AcPSEN transcript in the F-cluster (Rubakhin et al., 1999 ) – a neurosecretory center involved in feeding arousal and control of animal energetics (Figure 4 C).
Neuron-specific expression of sense and antisense transcripts
Analysis of the relative abundance of AD related and other cloned transcripts has also revealed enormous cell specificity in their expression including sensory (SN) and motor (L7) neurons of a simple Aplysia memory forming circuit (Kandel, 1976, 2001 ; Walters et al., 2004 ). Since the implemented 454 sequencing libraries are directional, we were able to compare presence and relative expression level of natural sense and antisense transcripts within the same identified neurons (Figure 5 ).
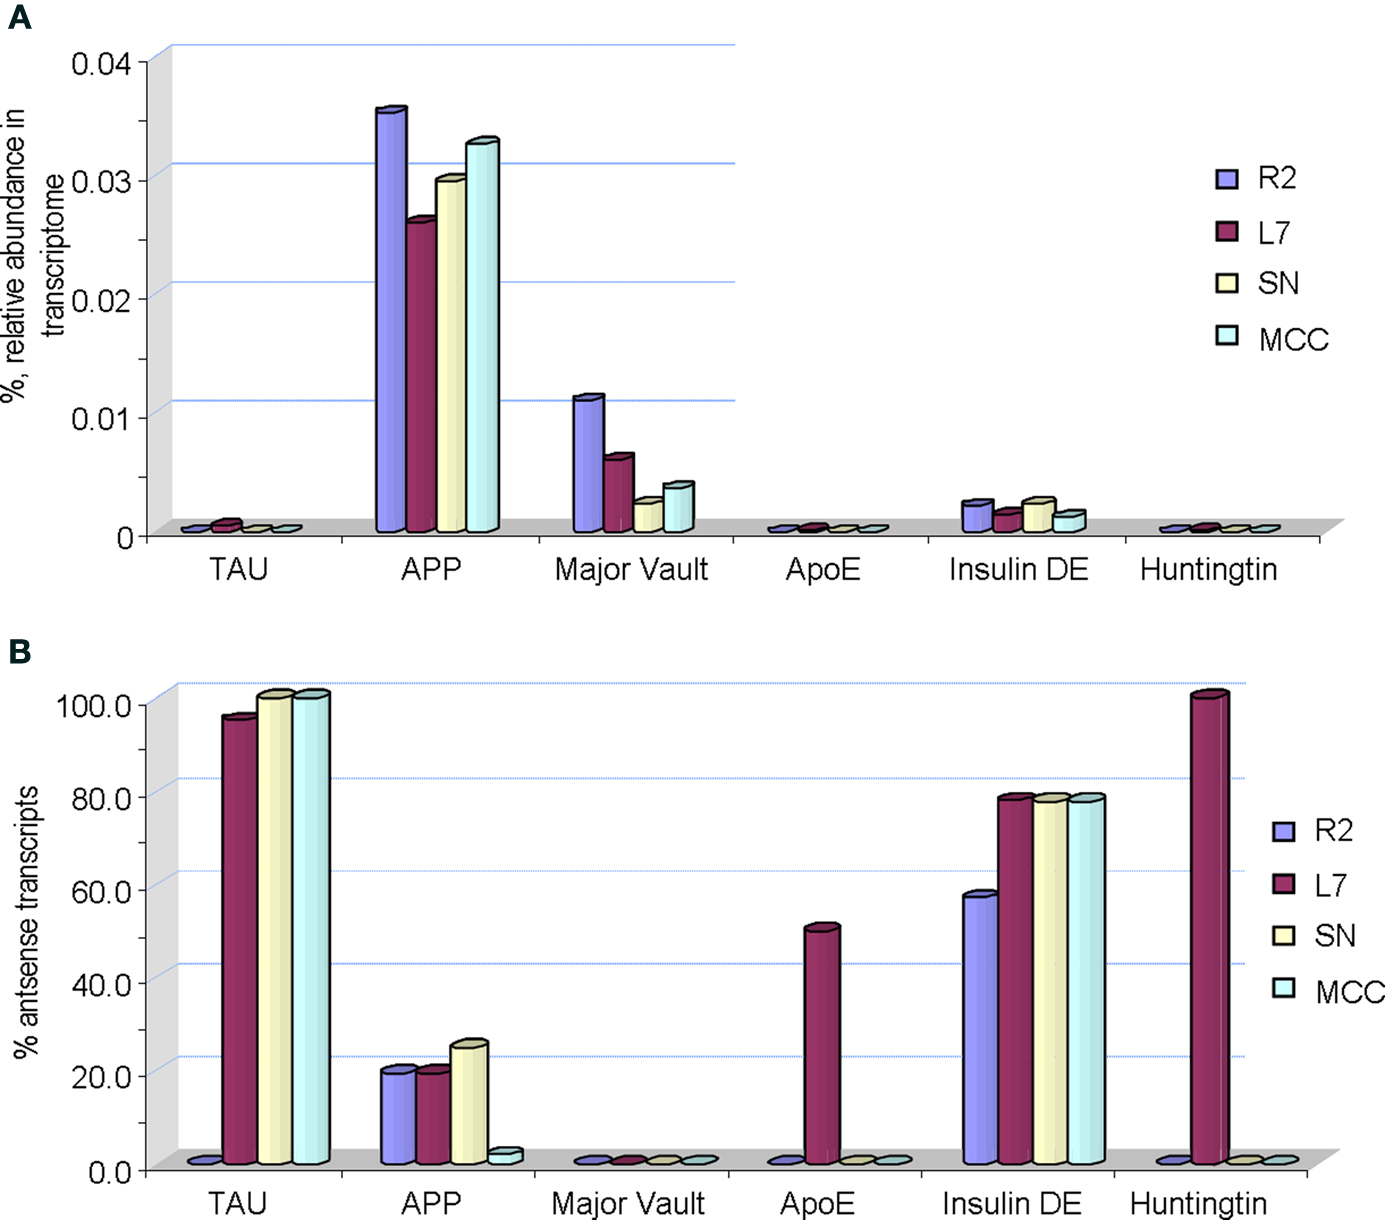
Figure 5. Single cell digital expression profiling of selected age-related transcripts in Aplysia. (A) Sense transcripts (actual mRNAs) shown as % of their relative abundance in a transcriptome of a given identified neuron (R2 – cholinergic mucus releasing motoneuron; MCC – serotonergic modulatory neurons; SN – glutamergic mechanosensory neurons; L7 – one of the major motoneurons of the siphon-/gill- withdrawal reflex). (B) Relative abundance of corresponding antisense transcripts. It is shown as a percentage of antisense transcripts to the total number of both sense and antisense transcripts in a transcriptome of a given neuron generated by 454 pyrosequencing (see details in the text). Abbreviations for Aplysia gene homologs: TAU is the tau protein (GB# GU255944); APP – the amyloid precursor protein (GB# AY535409); Major Vault – the major vault protein (GB# GU255949); ApoE receptor – the appoprotein E (GB# GU255953); Insulin DE – putative insulin degrading enzyme (GB# GU255946); Huntingtin (GB# GU255950). See also Table 1 for information about individual genes.
Remarkably, the distribution of antisense transcripts is also neuron-specific. For example, it appears that all tested neurons do express a relatively low fraction of sense Tau transcripts (Tau mRNA) while antisense Tau transcripts are predominant in these cells (reaching 95–98% of the total amount of sense and antisense Tau transcripts). Similar relationships are observed for transcripts encoding cloned insulin degrading enzyme where the fraction of antisense transcripts can be as high as 50–75% of corresponding mRNAs. High abundance of antisense transcripts for ApoE receptor and huntingtin were found in the L7 motoneuron but not other tested cells. In contrast, APP and major vault proteins (a class of RNA binding proteins) mRNAs (sense) had relatively elevated abundances compared to corresponding antisense transcripts (Figure 5 B). The nature and functional role of such cell specific antisense transcription is unclear but an inhibitory regulatory role in control of translation has been suggested and tested for other classes of RNAs (Katayama et al., 2005 ; He et al., 2008 ; Mercer et al., 2008 , 2009 ; Brosnan and Voinnet, 2009 ; Mattick, 2009 ; Ponting et al., 2009 ; Szulwach et al., 2009 ; Wilusz et al., 2009 ).
In summary, the initial survey of potential age-related genes in Aplysia revealed highly differential levels of expression in a majority of tested neurons suggesting that transcriptional changes in the course of normal aging may also be cell-specific. To further test this hypothesis, we selected two identified cholinergic motor neurons named R2 and LPl1.
Differential Aging in Cholinergic Neurons
The selection of LPl1 and R2 neurons was based on several criteria including their size, their reliable identification in all preparations, their similar cell and transmitter phenotypes, as well as their functions.
Size: both these cells are truly gigantic with an expected enormous yield of RNA. In fact, the R2 neuron shown in Figure 2 B is the largest neuron ever found, measured or photographed so far, reaching 1.1 mm in a 1.3-kg animal! It appears that in this case the neuronal size had reached its potential limit since the neuron started to lose its spherical shape with the appearance of some obvious folds (convolutes) on its surface. It should be noted that we isolated the very same cell after photography (Figure 2 B, see insert) then extracted a record 1.965 μg of RNA from this single neuron!
Identification: the CNS contains only a single copy of LPl1 and a single copy of R2. As a result, these neurons are among a few cell types with the easiest possible visual and a robust neuronal identification and are in perfect lateral ganglionic positions for isolation purposes. These cells were recognized by Tauc and Hughes as symmetrical homologous, left (LPl1) and right (R2) motoneurons (Hughes and Tauc, 1961 ). Because of complex evolution and asymmetric fusion of ganglia in Aplysia development these cells are located in ganglia of different sizes (the larger abdominal ganglion is a result of fusion of three separate ganglia while the left pleural ganglion remains the same as the ancestral prototype).
These motoneurons control mucus release from body surfaces (Rayport et al., 1983 ; Ambron et al., 1988 ). We have cloned choline acetyltransferase ChAT from Aplysia (AY163563, Table 1 ) and confirmed its specific expression in these cells (not shown). Earlier biochemical measurements also suggested the presence of enzymatic ChAT activity in these cells and their cholinergic nature (Eisenstadt and Schwartz, 1975 ; Treistman and Schwartz, 1977 ). In addition these neurons co-express FMRFamide (Figure 4 A), a neuropeptide with opioid like properties. Both neurons have largely symmetrical patterns of axonal branching and innervations (Hughes and Tauc, 1961 ; Kandel, 1976 ); a slight asymmetry might still exist since the animal does not have complete bilateral symmetry; there are asymmetrical reproductive, digestive and excretory organs and corresponding orifices. Known pharmacological and electrophysiological properties of these neurons are also nearly identical.
In summary, this pair of cells is a good model to perform an unbiased comparison of the transcriptional outputs from identified neurons as well as their changes due to aging. Thus, we decided to compare single-cell gene expression patterns from individual homologous neurons from young and old animals using two types of experimental array experiments: direct and reference designs – as described in the method section. All together we performed gene expression profiling from 22 individual neurons. For each experiment we analyzed expression data for ∼55,000 non-redundant transcripts (details of statistical analysis can be found in GEO GSE18783 and in the Section Materials and Methods).
Global transcriptional profiling in aging
Figure 6 illustrates the importance of single-cell gene expression profiling vs. profiling from a relatively large population of heterogeneous cells (such as a single abdominal ganglion with about 1,000 neurons). Indeed, individual direct comparisons of “old” and “young” abdominal ganglia revealed about 1,300 differentially expressed transcripts with more than 2-fold change in expression. However, we could not achieve statistically reproducible identification of differentially expressed genes when comparing abdominal ganglia from different animals of two age groups (statistical tests with ≥2-fold change and a 5% FDR). In contrast, when we performed direct single-cell comparisons from individual “old” R2 vs. “young” R2 (i.e., neurons obtained from old and young animals) we detected statistically significant changes in expression of 3855 transcripts (Figure 6 B and Table S2 in Supplementary Material at GEO Series accession number GSE18783) and these age-related differently expressed genes were independently supported in our reference design tests (Figure 7 A) and validated by QRT-PCR (Figure 8 ). Differentially expressed transcripts for the single cell R2 experiments can be found in GEO Series accession number GSE18783.
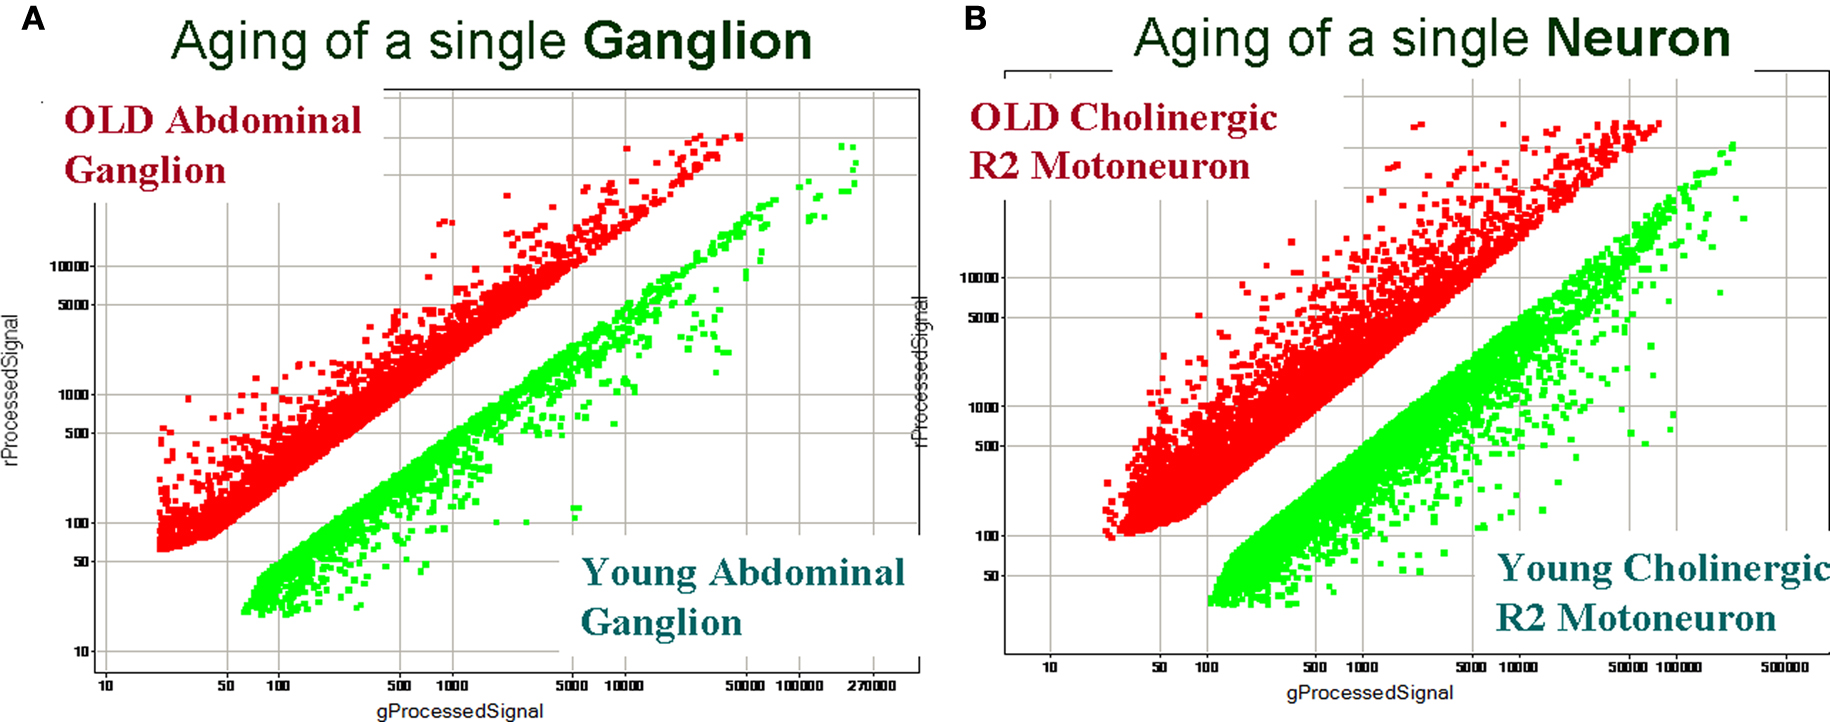
Figure 6. A comparison of gene expression profiling between heterogenous ganglionic and single-cell samples from young and old animals. (A) Identification of age-related transcripts using the abdominal ganglion (∼1000 cells). (B) Identification of age-related transcripts in the identified cholinergic motoneuron R2. Both scatter plots show differential expression between the two samples of interest (log base 10). Differentially expressed transcripts from old animals are shown as red dots, and from young animals as green dots. Common transcripts (i.e., transcripts with similar expression levels in two samples) are removed. The scatter plot for a representative array in (A), when two abdominal ganglia were compared, indicates a smaller scale of detected differential expression vs. single-cell gene expression profiling (B) under the same hybridization conditions. The single-neuron experiment also shows much higher diversity of differentially expressed transcripts (e.g., transcripts affected by aging). The direct comparison array experiment (B) identified 3,855 differentially expressed genes in young and old R2 neurons (or 9% from the total number of tested transcripts: 2,291 transcripts were found to be differentially expressed in young R2 and 1,566 transcripts in old R2 at >2-fold change and a 5% FDR). These results also illustrate the importance and need for single cell analysis that takes into consideration the observed heterogeneity of even small neuronal samples (see text for details). All direct comparison arrays were performed with three biological replicates from different ganglia or single cells isolated from different animals. Differentially expressed transcripts for the single cell R2 experiments can be found at GEO Series accession number GSE18783 and Table S2 in Supplementary Material.
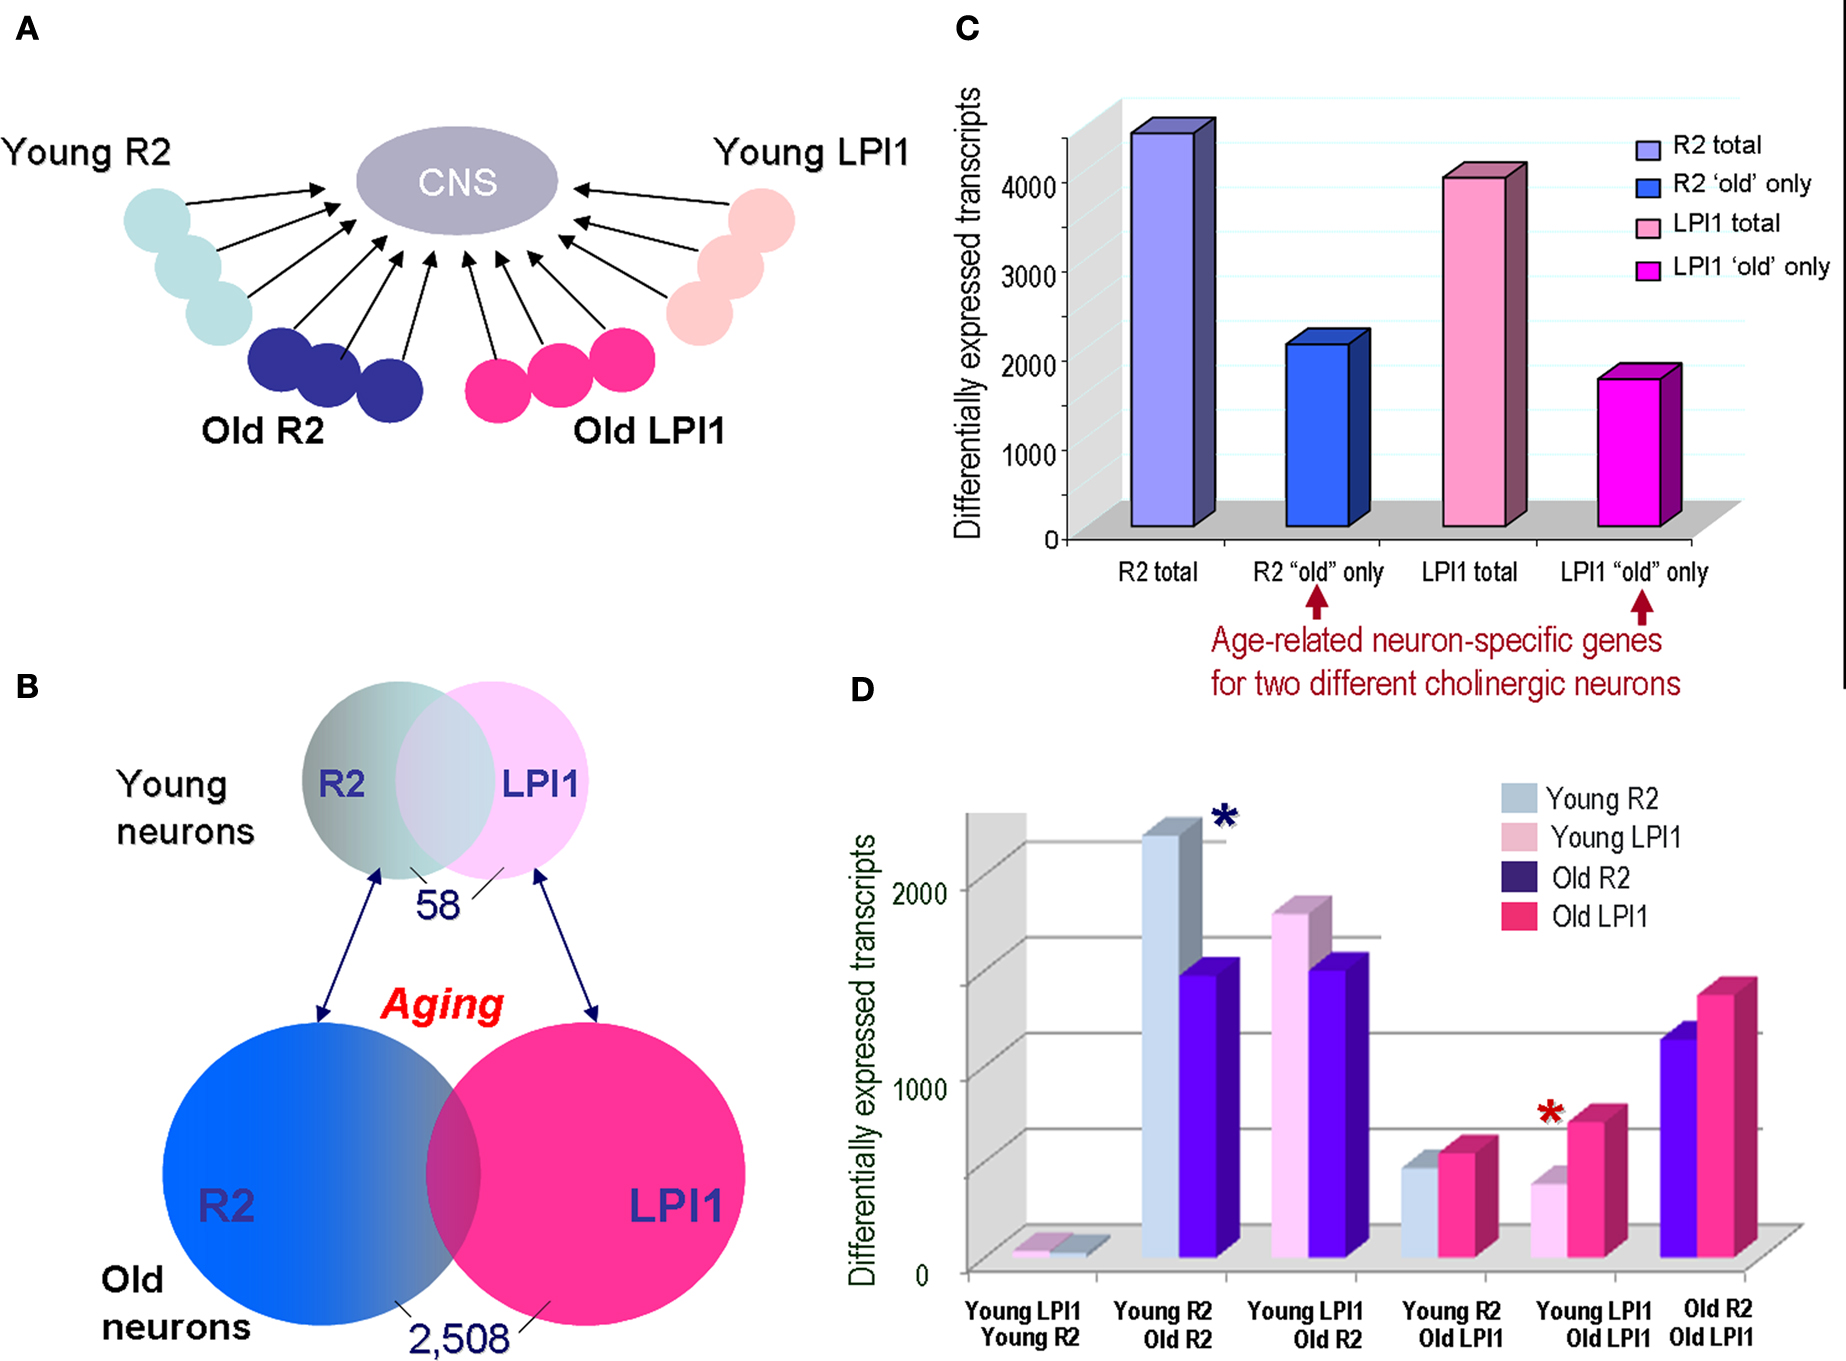
Figure 7. Comparison of age-related changes in gene expression between two identified cholinergic neurons LPl1 and R2. (A) The schematic representation of the reference design microarray experiments to compare two different cell types R2 and LPL1 during the aging process. In these microarray tests, individual neurons were compared to the same reference CNS sample [see Materials and Methods, and legends for (C,D) below]. The individual circles represent single neurons (LPl1 – red tones; and R2 – blue tones) from young or old animals. (B) We found that only 58 neuronal transcripts (∼0.1%) are differentially expressed when LPl1 and R2 neurons are compared from young animals. In contrast, when the same cells were directly compared from old animals, we identified 2508 differentially expressed transcripts (∼4.5%). This suggests that identified cholinergic motoneurons are more similar to each other in younger animals than the same neuronal types in older animals. (C) The scope of detected age related transcripts in indentified neurons from a reference design experiment as in (A). This histogram shows the total number of transcripts differentially affected by aging in both LPl1 (3930) and R2 (4440), as compared to a reference CNS sample, and a fraction of transcripts whose differential expressions were only found in one but not another neuronal type. For example, 2057 transcripts were found to be differentially expressed only in R2 neurons without significant changes for the same transcripts in LPl1; correspondingly, we identify 1660 transcripts that changed their expression in aged LPl1 neurons but not in R2. (D) Cross cell comparisons of uniquely expressed transcripts among the four neuronal samples (young R2, old R2, young LPl1 and old LPl1) from a reference design. The number of the differentially expressed transcripts was plotted for all the combinations of cell–cell comparisons: (i) Young LPl1–Young R2; (ii) Young R2–Old R2; (iii) Young LPl1–Old R2; (iv) Young R2–Old LPl1; (v) Young LPl1–Old LPl1; and (vi) Old R2–Old LPl1. The most remarkable of these comparisons is a confirmation of the data from (B): the Young LPl1_Young R2 with a total of 58 transcripts differentially expressed. However, Old R2–Old LPl1 has >2500 transcripts differentially expressed suggesting neuronal transcriptomes change dramatically during aging. Second, it appears that the scope of age related changes is much more prominent in R2 neurons than in LPl1 neurons (compare blue asterisks for R2 and red asterisks for LPl1). The data summarized in (C,D) are based on the MANOVA analysis for both the single cell and aging effects within the reference type experiments as illustrated in (A). A >2-fold change and a ≤5% FDR differentially expressed transcripts for all the single cells were determined from combined AAA and DAA array data, see GEO series accession number GSE18783 and Tables S3 and S4 in Supplementary Material. Combined, these results suggest that the aging process in these neurons is not identical; differential subsets of genes uniquely and cells specifically change their expression as these neurons undergo normal aging. Examples of specific transcripts are listed in Table 2 .
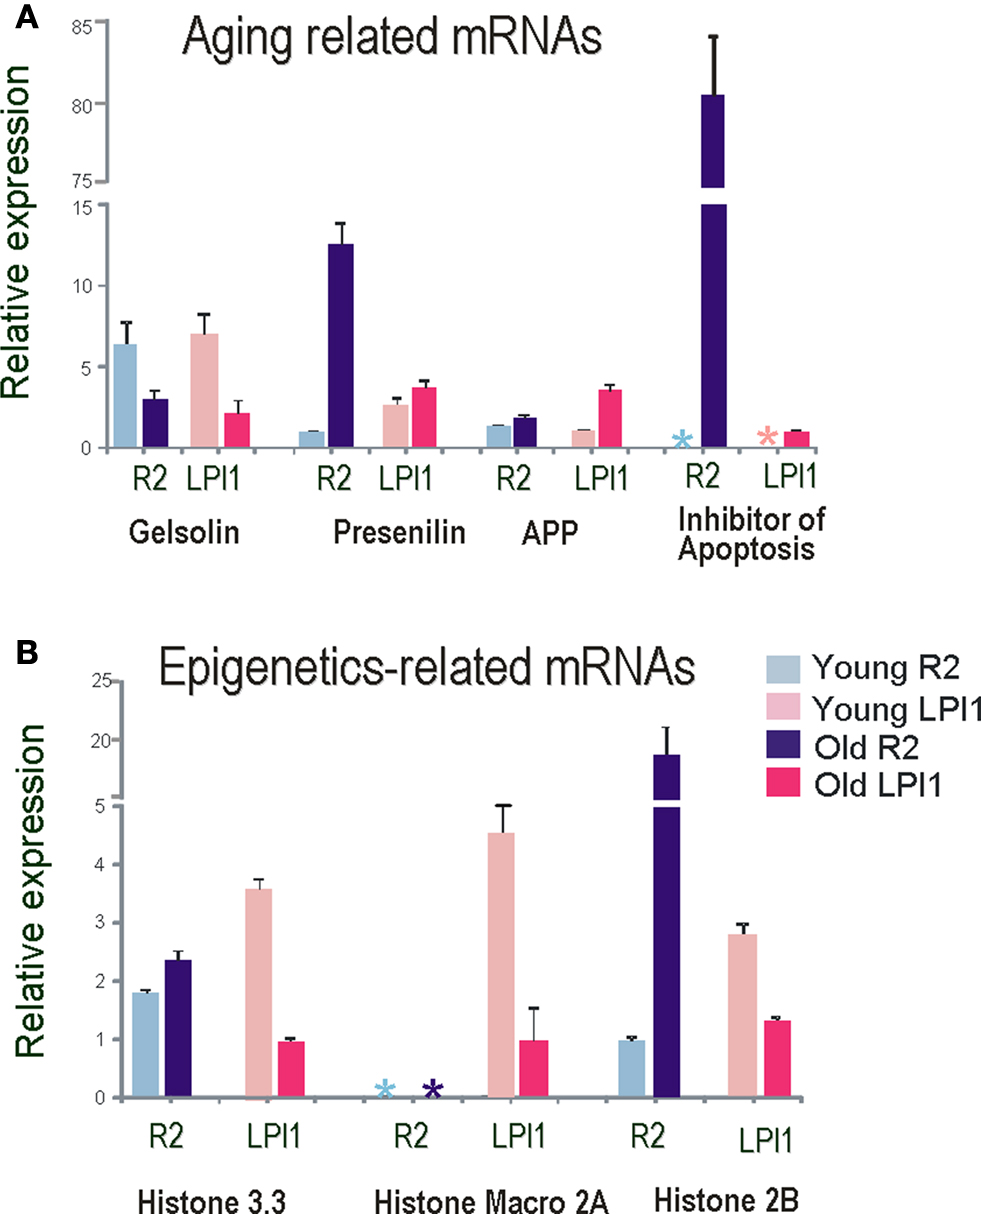
Figure 8. Single cell Q-RT-PCR analysis of differentially expressed transcripts as a function of aging in identified neurons. Several transcripts differentially expressed on the microarrays were validated by Quantitative RT PCR. All data were normalized to 18S RNA and all tests were performed in quadruplicate and statistically analyzed (see text and Materials and Methods for details). (A) Relative expression of Gelsolin and Alzheimer’s disease related transcripts in identified cholinergic neurons R2 (blue bars) and LPl1 (red bars). Asterisks indicate no detectable levels of expression in a given cell (R2 and LPl1) for inhibitors of apoptosis in young animals. These results were validated by reported values obtained from microarray tests. (B) Relative expression of different histone variants in identified cholinergic neurons R2 (blue bars) and LPl1 (red bars). Asterisks indicate no detectable level of expression in macro 2A histone in R2 neurons isolated from both young and old animals.
One of the proposed explanations of these results is the possibility of profound cell-specific changes in aging. For example, changes in opposite directions of the same groups of transcripts in different neurons will result in smaller or no detectable overall outcome because cell-specific changes will cancel each other in a highly heterogeneous sample. On the other hand, when uniquely identified neurons were compared directly to each other, “contributions” from other neuronal groups are eliminated and observed age-related changes in gene expression can be unmasked.
Figure 7 B shows the scope of differential expression as a function of age between two neurons LPl1 and R2 from the reference design experiments and standard microarray statistical tests (n = 6 for R2 and n = 6 for LPl1, significance tests with a 5% FDR and 2-fold change cut-off; see Materials and Methods and the access to the GEO 18783 project at NCBI site). We found that only 58 of 55,000 transcripts tested were differentially expressed between symmetrical young LPl1 and R2 neurons. In contrast, the same identified neurons from old animals had 2058 differentially expressed transcripts (MANOVA and significance tests with a 5% FDR and 2-fold change cut-off). Importantly, in both cases we identified 2057 transcripts that are uniquely expressed in older R2 (but not in older LPl1) and 1660 transcripts in LPl1 from old animals but not in R2 from the same animals (Figure 7 C; the transcripts identified as common can be found in Table S3 in Supplementary Material at GEO Series accession number GSE18783). About half of the genes significantly affected by aging in these neurons appear to be occurring in one but not the other cholinergic neuron tested (Figure 7 D; number of transcripts for each of the combinations are in Table S4 in Supplementary Material at GEO Series accession number GSE18783).
We interpret these data as cell-specific differential transcriptional changes underlying normal aging in these neurons. In other words, at the level of transcriptional outputs neurons do age differently.
A brief overview of transcriptional changes in cholinergic neurons
Although in this study we focused at neuron-specific differences in aging, the overall scope of detected transcriptional changes was quite extensive, totaling more than 5000 non-redundant transcripts with about 1000 annotated (see Table S5 in Supplementary Material, at GEO Series accession number GSE18783). These combined results allow identification of an initial subset of gene categories that are shared among different neuronal classes. There are several evolutionarily conserved classes of genes encoding basic metabolic functions including apoptosis- and redox-dependent processes and insulin signaling. Many of these have already been recognized as important components of aging mechanisms in other model organisms (McCarroll et al., 2004 ).
Among Aplysia neuronal genes with up-regulated expression in aging are components of the mitochondrial respiratory chain (e.g., cyt c oxidase sub II), mitochondrial DNA polymerase involved in mitochondrial replication, catalase, V-ATPase, calmodulin, selected gap junction proteins, tumor necrosis factor receptors, transposases, DEAD/DEAH box helicases, prominin-1 (the stem cell marker), antistasin, cys-rich protein enriched in motor neurons, c-Jun N terminal kinase, selected 5-HT- and Glu-type receptors and plexin A4.
Among transcripts down-regulated in old animals are superoxide dismutase (SOD), insulin-like growth factor binding proteins, water channel protein – aquaporin-3, actin, epidermal growth factor receptor and pathway substrates, cell defense immune protein, and painless protein (transient receptor potential cation channel).
The transcripts showing highest differential expression in old R2 most notably are involved in systemic inflammation such as proinflammatory cytokines, and tumor necrosis factor and its receptor (the same phenomenon also is observed in humans). Other examples of gene families up-regulated in “old” cholinergic neurons are oxidant stress related kinases, cell death proteins, gap junction proteins, five K-channels, >30 receptors, and, importantly, several transposases and transposons. Also notable transcripts showing high differential expression in old R2 are Huntington’s disease related transcripts (including huntingtin and huntingtin-interacting protein, and huntingtin associated transcripts).
In young R2 one of the most highly expressed transcripts is Msf1, encoding a predicted mitochondrial protein involved in neurodevelopment (Dee and Moffat, 2005 ). A novel family of mitochondrial proteins differentially expressed in young R2 is represented by homologs to Drosophila genes such as slmo and prel. Illustrative examples of gene families down-regulated in “old” cholinergic neurons were estrogen-regulated growth inhibitor, nexin and hyperpolarization-activated cAMP gated channel.
Finally, the list of differentially expressed “aging” genes includes RNA binding proteins such as major vault proteins that were up-regulated in “old” neurons whereas transcripts encoding Nogo protein (associated with synaptic functions and transport) were down-regulated.
In conclusion, this initial survey implies that transcriptomes of identified neurons change dramatically during aging. As the next step, we focused upon two broad gene categories crucial for a large spectrum of modifications involved in control of neuronal identity and plasticity.
Validation of age-related differential dxpression for genes involved in cytoskeleton dynamics and chromatin remodeling
We used QRT-PCR to validate both cell specificity and differential expression for selected genes. In all cases, we confirmed the direction and scale of changes from our microarray experiments (Figure 8 , Tables 2 and 3 ). As shown in Figure 8 A the expression level of both presenilin and amyloid precursor protein (APP) mRNAs was higher in older animals (similar changes were also found for MCC neurons). Nevertheless, the expression of presenilin was more prominent in R2 (12-fold) than in LPl1 (1.5-fold) whereas changes in APP mRNAs were greater in LPl1 (5-fold) then in R2 (2-fold).
Remarkably, neuron specific changes in aging were also found for an inhibitor of apoptosis homolog protein (80-fold). This mRNA was not detectable (virtually not expressed) in young neurons (including MCC) but was highly abundant in R2 neurons from older animals (with a minor increase in LPl1). This may help explain the fact that senescent cells are resistant to apoptosis (Campisi, 2001 ).
In contrast, for transcripts associated with cytoskeleton remodeling we showed significant reductions of their expression levels in older animals. For example, expression of gelsolin (actin capping protein involved in microtubule dynamics (Burtnick et al., 2001 ; Silacci et al., 2004 ; Spinardi and Witke, 2007 ), was less in all tested neuronal types (LPl1, R2 and MCC) from old animals (Figure 8 A).
Two key motor proteins are known to be involved in directional anterograde (kinesin) and retrograde (dynein) transport of RNAs, mitochondria and organelles in cells, including establishment and maintenance of neuronal polarity and long-term plasticity via targeted delivery of RNA cargo to support local protein synthesis at synaptic sites (Puthanveettil et al., 2008 ). The levels of expression for these motor proteins were significantly lower in neurons obtained from old animals [i.e., for kinesin II (5-fold higher in young R2) and dyneins (35-fold higher in young R2)] suggesting alteration of the dynamic interaction between distant synapses and the cell nucleus in aging.
Importantly, we detected significant changes in components associated with epigenetic modifications (Figure 8 B and Table 3 ). High expression levels of histone 3.3 (H3.3) are associated with active transcription (Lacoste and Almouzni, 2008 ; Jin et al., 2009 ). We found that H3.3 is slightly up-regulated in older R2 and MCC but down regulated in older LPl1. Significant changes were also found for the histone H2B (20-fold higher in old R2, see also Figure 8 B).
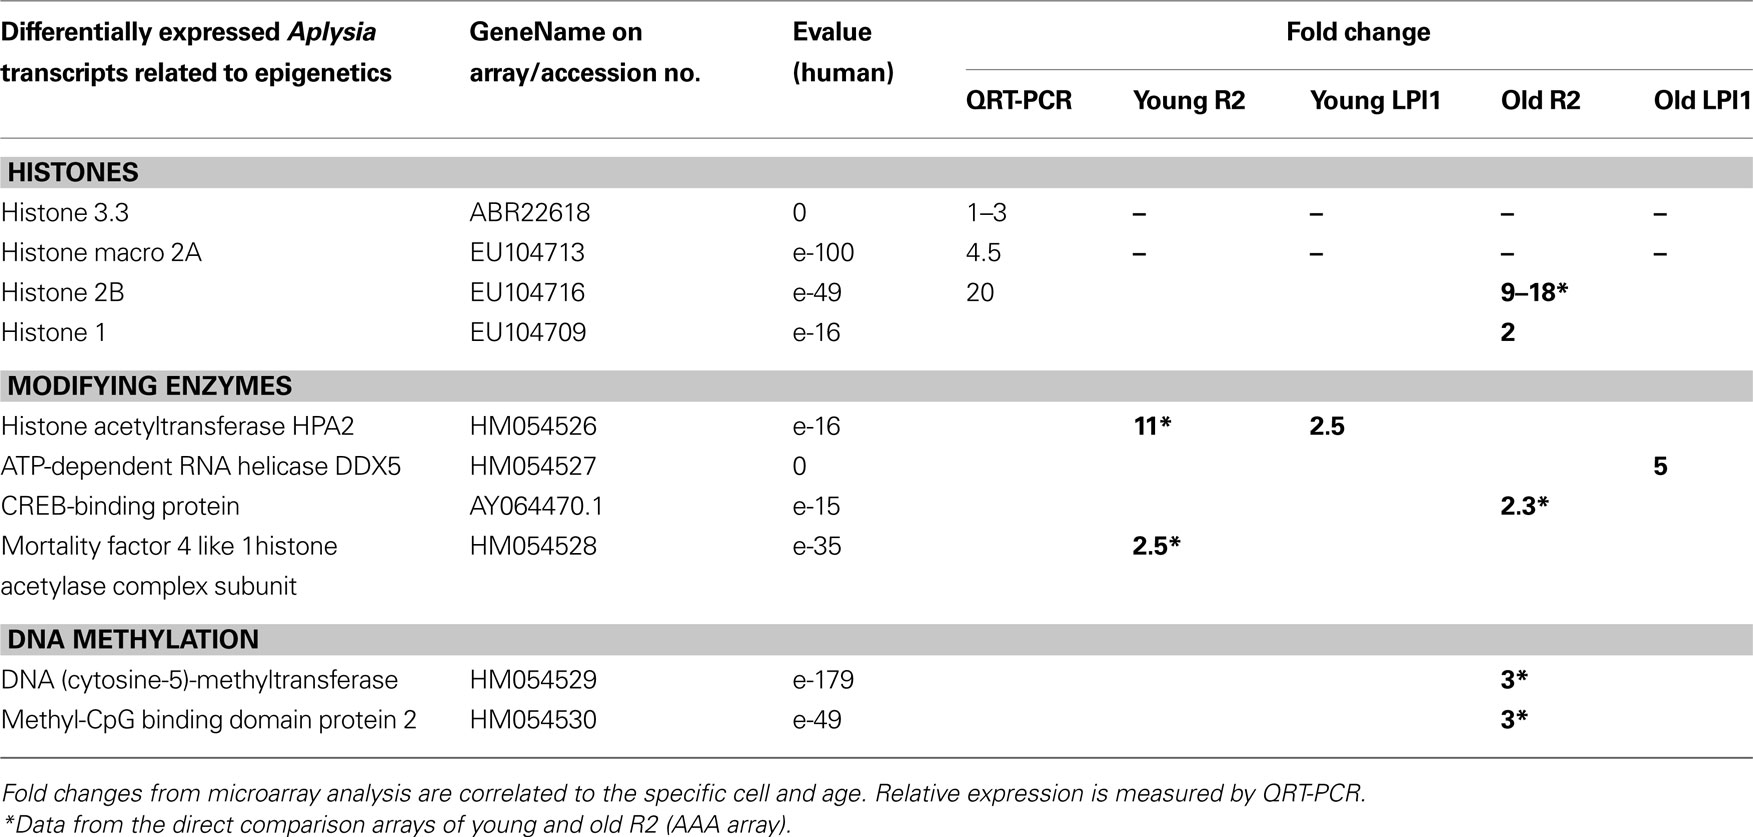
Table 3. Neuron-specific changes in expression of selected genes related to chromatin remodeling from two identified cholinergic neurons: R2 and LPl1.
Cell-specific changes were the most pronounced in a distinct histone variant named histone Macro2A. So far histone-Macro 2A is described only for vertebrates but we were able to clone it from Aplysia (GB# EU104713). Out of three cell types tested (R2, LPl1 and serotonergic interneuron MCC) this histone variant is apparently highly expressed only in LPl1 neurons and its level is significantly reduced in neurons from aged animals (Figure 8 B). In Aplysia the functional role of histone-macro2A is unknown. However, microarray-based analysis in mammals uncovered occupancy of macroH2A variants at many genes encoding key regulators of development and cell fate decisions. Specifically, macroH2A contributes, as an epigenetic mark, to the fine-tuning of temporal activation of HOXA cluster genes and regulation of the gene expression program during cellular and neuronal differentiation (Chang et al., 2008 ; Buschbeck et al., 2009 ; Timinszky et al., 2009 ).
Age-related changes in Aplysia neurons were also observed for histone modifying proteins. For example transcripts for putative histone acetyltransferase HPA2/1 were found to be less expressed in R2 (11-fold) suggesting suppression of transcription for a number of genes.
One of the most remarkable features of Aplysia is the presence of DNA (cytosine-5)-methyltransferase (DNMT-1) and subsequent DNA methylation. Apparently this process was lost in both Drosophila and C. elegans (Suzuki and Bird, 2008 ). Here we found a 3-fold greater expression level for DNMT-1 in R2 from older compared to younger animals, further suggesting that DNA methylation transcriptional repression might play an important role in the control of genome-wide chromatin reorganization in aging. Consistent with this idea, we discovered that the transcriptional repressor MBD2 (methyl-CpG binding domain protein 2, see Dhasarathy and Wade, 2008 ; Tiwari et al., 2008 ; Martin Caballero et al., 2009 ) is also more abundant in R2 from old animals.
In summary, our data suggest that epigenetic mechanisms can be crucial for normal aging and be important players responsible for neuron-specific changes accumulated during this process.
Discussion and Future Directions
Differential Aging in Neurons as a Widespread Phenomenon
Functional, morphological and chemical heterogeneity of neurons is the most fundamental and distinct feature of virtually any neuronal circuit or nervous system. The Allan Brain Atlas project (Lein et al., 2007 ) added a new dimension to this picture. It revealed unprecedented complexity of genome-scale variations across cell populations suggesting that the majority of neurons in our nervous system are unique cells in terms of their genomic organization, connectivity and specific functions. Numerous clinical and experimental studies dealing with neurodegenerative diseases also indicate prominent cell-type specificity in vulnerability or resistance of various cell populations. This view can be reasonably applied to mechanisms of aging and age-related diseases in our brain.
In this study, using direct single-cell genomic profiling, we wanted to test the hypothesis that different identified neurons can age differently even if they belong to the same class of motoneurons. For comparison we selected one pair of identified cholinergic motoneurons that control mucus release from the body surface as a part of the defense reflex but that also contribute to a tonic steady state mucus release under basal conditions. In fact, these are two very similar homologous cells innervating the left (LPl1) and right (R2) part of the body respectively (although they do not have absolutely identical innervation fields and development).
One of the major conclusions of this study is the evidence that the aging process in these neurons is not identical; different subsets of genes uniquely and cell specifically change their expression as these neurons undergo normal aging.
Our initial confirmation that different neurons do age differently is not a very surprising outcome per se considering the enormous molecular heterogeneity within neuronal populations. What is more remarkable is the scale of differential changes in gene expression profiles even between two very closely related neurons such as LPl1 and R2 (Figure 7 ). Indeed, the age related differences between two symmetrical cholinergic neurons are more complex than we initially expected. It appears that as neurons age they become as different from their counterpart young neuron as a different cell type. The scale of 4–7% differences in differently expressed genes between young and old neurons of the same type (vs. ∼0.1% between two different young neurons) is comparable to differences between sensory and motor neurons found in our previous microarray tests (Moroz et al., 2006 ).
In our analysis and QRT-PCR validation tests (Figure 8 ) we primarily focused on highly abundant transcripts. However, we predict that the extent of cell–cell differences could be significantly greater because microarrays have a lot of constraints, including limited sensitivity and difficulties in detection of low abundance transcripts (and even transcripts with medium abundance). Expression profiling using the direct sequencing strategy (or RNA-Seq – Tang et al., 2009 ; Wang et al., 2009 ) would be more efficient than microarrays to further validate these hypotheses and quantify transcripts within the whole dynamic range of their abundance. These approaches are feasible for single Aplysia neurons (Kohn et al., 2008 ). Massive parallel sequencing technologies (e.g., 454, Illumina, SOLID and other established and emerging platforms) will be essential for direct and unbiased analysis of the operation of the entire cellular genome across different cell types in aging (sequencing and annotation of the Aplysia genome is in progress now).
Epigenetic Landscape during Aging and Cell Fate Specification
An organism’s longevity and aging is caused by numerous interacting factors such as nuclear and mitochondrial genome mutations, shortened telomeres, oxidative damage to DNA and other macromolecules, senescence, apoptosis and many more (Masoro and Austad, 2006 ; Campisi and d’Adda di Fagagna, 2007 ; Vijg, 2007 ; Vijg and Campisi, 2008 ). We show here that homologous neurons age differently, with prominent changes in epigenetic components during their aging process.
An analogy to the classical Waddington’s epigenetic landscape could be applied as a conceptual visualization for differential aging in neurons (Figure 9 ). In other words, differential aging can be comparable to distinct cell fate specification with non identical molecular mechanisms. Under this hypothesis, epigenetic mechanisms serve as master regulators controlling genome-wide chromatin remodeling and transcription. On the other hand, the same components acting in different neurons would also operate within specific chromosome territories and gene regulatory regions to maintain neuronal homeostasis and cell specificity.
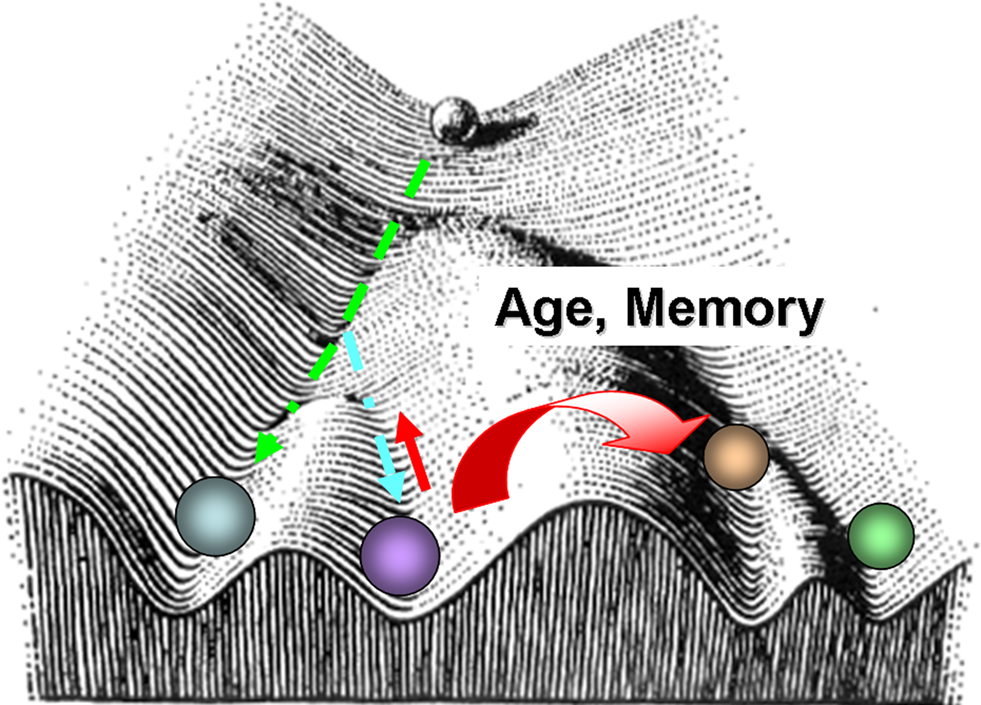
Figure 9. Waddington type landscape superposed with the distinct epigenetic trajectories for different neuronal types as a function of aging. The landscape diagram is modified from Waddington, C. H., 1956 (Principles of Embryology, op. cit., p. 412). Following Waddington’s visual schematics, the ball represents a neuronal fate. The valleys are the different fates a given neuron might roll into. At the beginning of its journey, development is plastic, and a cell can have many fates. However, as development and aging proceeds, certain molecular events occur randomly and this can lead to different underlying molecular phenotypes and decisions that cannot be reversed.
Similarly, large-scale analysis of molecular markers involved in cell lineage development in C. elegans confirmed that the same cell fate can be achieved using different gene regulatory pathways and mechanisms (Liu et al., 2009 ).
Our data clearly suggest that all three components of chromatin remodeling machinery – different histone variants (e.g., H2B, histone-macro2A), histone modifying enzymes and DNA methylation components (DNMT1 and associated methyl-CpG binding domain protein – MBD2) change as a function of aging. Importantly, all of them do show some degree of cell specificity suggesting that these changes might underlie differential expression of thousands of genes in identified neurons. Finally, our pilot in situ hybridization data indicate differential expression in the CNS of Aplysia DNMT1 (not shown, Kohn et al., 2009 ), suggesting that the tonic level of DNA methylation can also be an important mechanism for controlling cellular phenotypes in neural circuits. Ultimately, it would be not surprising to find out that each neuron has its own epigenome.
Even though each neuron tested (e.g., MCC, LPl1 and R2) shows profound transcriptional changes during aging, most of them also show remarkable cell-specificity both in their expression patterns and in directional changes in young and mature animals. These results imply that global and possibly stochastic molecular events in aging could be an important factor of permanent and irreversible changes in both selective gene expression patterns and the entire transcriptional output of neurons. Some of our unusual findings that need further analysis and validation are the potential involvement of transposons and transposases in aging. Although these categories of regulators are not annotated in Aplysia, a number of expressed transcripts belong to recognized evolutionarily conserved subgroups of mobile genomic elements and can be responsible for irreversible changes in DNA, genomic instability in aging (Busuttil et al., 2004 ) and senescence.
Cytoskeleton and Synaptic Function in Neuronal Aging
A second large category of transcripts consisting of regulators of local protein synthesis and regional transport was also found to be differentially expressed in aging. Indeed, single-neuron microarray tests suggest that both kinesin and dynein expression are down-regulated in “old” cholinergic neurons. These two proteins are major cargo complexes mediating anterograde (kinesin) or retrograde (dynein) transport of mRNAs and organelles. Thus, their suppression in aging should have significant functional consequences for synaptic function (e.g., likely leading to a decrease of synaptic plasticity, maintenance of neuronal morphology and polarized connections, see Puthanveettil et al., 2008 ). Our data also revealed that changes in antisense profiling can be as complex as the expression profile of any single neuron and some of them can be neuron-type specific. This broad class of transcripts that include microRNAs (Rajasethupathy et al., 2009 ) and large non-coding RNAs such as reported here 451 (GB#AF401632.1, Table 2 ) presents unique opportunities in analysis of regulatory mechanisms especially as local regulators of transcription and translation.
Previous studies indicated that changes in transmitter (5-HT, DA, ACh) synthesis or degradation, 5-HT and DA receptor functions, changes in presynaptic proteins and some neuropeptides (FMRFamide and egg-laying hormone) can be important mechanisms of neuronal aging processes in Aplysia (Kindy et al., 1991 ; Peretz and Srivatsan, 1996 ; Flinn et al., 1997 ; Southall et al., 1997 ; Ono et al., 1998 ; Chandhoke et al., 2001 ). Here, we partially confirm these earlier observations (e.g., differential expression of FMRFamide in older animals) as well as expand these data to many other peptides such as buccalin (GB# P20481 (4- to 5-fold less in old animals) and ionotropic glutamate receptors (the level of iGluR5 is less in old animals).
Finally, it should be noted that in Aplysia and related gastropod molluscs the neurons increase in size as the animals grow in body size. Therefore, some observed changes in transcriptional output could be related to changes in neuron sizes and reflect changes in the surface to volume ratios. However, we took this factor into consideration for this study about differential aging. Specifically, we have compared aging of two neurons which grow at similar rates and reach comparable sizes as they age. Thus, we feel that it is unlikely that the observed differences in gene expression patterns between these two neurons as they age can be attributed to neuron sizes.
Nevertheless, the precise relationships between transcriptome, aging and cell growth rate are currently unknown, but this analysis can be performed in the future when multiple cell types of different sizes would be compared. Apparently, the growth rate is not identical for different neuronal classes since even an adult Aplysia has many neurons of small sizes (e.g., sensory cells). Furthermore, separate studies can be performed by comparing various identified neurons from mature vs. very old animals where neurons have comparable sizes between these two stages.
Aplysia as an Emerging Model for the Cell and Genomic Biology of Aging
To the best of our knowledge, this is the first genome-scale profile of identified neurons as a function of aging. At this moment, it is difficult to say whether the changes we observed for Aplysia would be within the same range for human or other mammalian neurons. We hypothesize that this would be the case. The lack of identified neurons and anatomical difficulties in performing such analyses within highly diverse neuronal populations in vertebrate brains are major obstacles in the field. Although it is expected that such experiments would be feasible in the near future (e.g., using transgenic lines with neuron-type specific fluorescent markers), Aplysia offers unique and unprecedented opportunities for single-cell genomic and epigenetic studies of aging and age related memory loss in particular. The development of Aplysia (Kriegstein et al., 1974 ; Kriegstein, 1977 ; Kandel, 1979 ; Heyland and Moroz, 2006 ) and phenomenology of aging as well as age-related changes in Aplysia behavior and physiology, in particular on the gill withdrawal reflex and synaptic plasticity (Peretz et al., 1982 , 1984 ; Peretz and Romanenko, 1986 ; Peretz, 1988 ; Peretz and Srivatsan, 1992 , 1996 ) are well described, providing a solid background for this model.
The molecular and genomic biology underlying elementary cognitive functions and plasticity can be studied in Aplysia with resolution that is difficult to achieve elsewhere because identified neurons, synapses and relatively simpler memory forming circuits have been well characterized (Kandel, 2001 ; Hawkins et al., 2006 ; Bailey and Kandel, 2008 ). The accessibility and size of these neurons is the perfect experimental platform for development and integration of genomic/epigenomic profiling of biochemical and physiological functions at a single cell level. Both single cells and nuclei from specific cells can be isolated within minutes. Moreover, <1% of the cytoplasm from a single cell is all that is needed to directly characterize and quantify hundreds of intracellular metabolites, signal molecules and various peptides using capillary electrophoresis and mass spectrometry (Moroz et al., 1999 , 2005 ; Li et al., 2000 ; Li and Sweedler, 2008 ; Lapainis et al., 2009 ).
In addition, we showed that Aplysia has many common and evolutionarily conserved age-related gene families that are associated with antioxidant defense, stress response, mitochondrial function, insulin signaling and inflammation pathways, as well as gene homologs of neurodegenerative diseases including Alzheimer’s, Huntingtin and Parkinson’s as well as pain (Moroz et al., 2006 ; Walters and Moroz, 2009 ). Differential age-related expression of amyloid peptide precursor (in LPl1) and huntingtin (in R2) suggests that it would be possible to develop and study molecular, cellular and circuit mechanisms in Aplysia at the level of uniquely identified neurons.
Obviously, a paradigm shift is required to study aging in specific neurons with a prospect to perform nearly complete unbiased single-neuron genomic analysis with identification and quantification of all cellular RNAs. Such a new approach, with the ability to perform metabolomic and proteomic profiling from individual neurons and to access identified neurons with different dynamics of natural aging processes, opens a broad spectrum of opportunities to study and understand why some neurons can age at different rates, degenerate or die whereas others can be virtually unaffected by aging. By following such an integrative molecular portrait of individually identified neurons during the aging process we see the virtually unmatched power of Aplysia as the emerging model in the biology of aging.
Conceptually, the use of Aplysia as a novel genomic model can bring integrative genomic, molecular and physiological analyses to the level of single cells and cell compartments. At the same time it will also bridge all levels of system organization during the organism’s aging: from the understanding of dynamic reorganization of the cellular genome to specific neural circuits and then to behaviors, learning and memories. Although we are developing the new marine model for analysis of aging mechanisms, the proposed approaches can be implemented in other organisms in both aging research and genome biology of cognitive functions.
Conflict of Interest Statement
The authors declare that the research was conducted in the absence of any commercial or financial relationships that could be construed as a potential conflict of interest.
Acknowledgments
We are grateful to Mrs. E. Bobkova, T. Brough for help in cloning and in situ hybridization experiments; Dr. T. Ha for advice in microarray statistical tests, Mr. M. Citarella for help in data handling and control blast tests, Mr. J. Netherton for reading and discussing the text. Leonid L. Moroz is supported by NIH and NSF Grants 1RO1NS06076, R21RR025699, NSF-0744649, and in part by McKnight Brain Research Foundation and UF Opportunity Funds.
Supplementary Material
The Supplementary Material for this article can be found online at http://www.frontiersin.org/agingneuroscience/paper/10.3389/neuro.24/006.2010/
Footnotes
References
Ambron, R. T., Rayport, S. G., and Babiarz, J. (1988). Giant Aplysia neuron R2 has distal dendrites: evidence for protein sorting and a second spike initiation site. J. Neurosci. 8, 722–731.
Antonov, I., Ha, T., Antonova, I., Moroz, L. L., and Hawkins, R. D. (2007). Role of nitric oxide in classical conditioning of siphon withdrawal in Aplysia. J. Neurosci. 27, 10993–11002.
Bailey, C. H., and Kandel, E. R. (2008). Synaptic remodeling, synaptic growth and the storage of long-term memory in Aplysia. Prog. Brain Res. 169, 179–198.
Bodnarova, M., Martasek, P., and Moroz, L. L. (2005). Calcium/calmodulin-dependent nitric oxide synthase activity in the CNS of Aplysia californica: biochemical characterization and link to cGMP pathways. J. Inorg. Biochem. 99, 922–928.
Brosnan, C. A., and Voinnet, O. (2009). The long and the short of noncoding RNAs. Curr. Opin. Cell Biol. 21, 416–425.
Burtnick, L. D., Robinson, R. C., and Choe, S. (2001). Structure and function of gelsolin. Results Probl. Cell Differ. 32, 201–211.
Buschbeck, M., Uribesalgo, I., Wibowo, I., Rue, P., Martin, D., Gutierrez, A., Morey, L., Guigo, R., Lopez-Schier, H., and Di Croce, L. (2009). The histone variant macroH2A is an epigenetic regulator of key developmental genes. Nat. Struct. Mol. Biol. 16, 1074–1079.
Busuttil, R. A., Dolle, M., Campisi, J., and Vijga, J. (2004). Genomic instability, aging, and cellular senescence. Ann. N. Y. Acad. Sci. 1019, 245–255.
Campisi, J. (2001). Cellular senescence as a tumor-suppressor mechanism. Trends Cell Biol. 11, S27–S31.
Campisi, J., and d’Adda di Fagagna, F. (2007). Cellular senescence: when bad things happen to good cells. Nat. Rev. Mol. Cell Biol. 8, 729–740.
Chandhoke, V., Southall, M., Holt, R., and Flinn, J. M. (2001). Dopamine receptor subtype density as a function of age in Aplysia californica. Comp. Biochem. Physiol. B, Biochem. Mol. Biol. 130, 461–466.
Chang, E. Y., Ferreira, H., Somers, J., Nusinow, D. A., Owen-Hughes, T., and Narlikar, G. J. (2008). MacroH2A allows ATP-dependent chromatin remodeling by SWI/SNF and ACF complexes but specifically reduces recruitment of SWI/SNF. Biochemistry 47, 13726–13732.
Dee, C. T., and Moffat, K. G. (2005). A novel family of mitochondrial proteins is represented by the Drosophila genes slmo, preli-like and real-time. Dev. Genes Evol. 215, 248–254.
Dhasarathy, A., and Wade, P. A. (2008). The MBD protein family-reading an epigenetic mark? Mutat. Res. 647, 39–43.
Eisenstadt, M. L., and Schwartz, J. H. (1975). Metabolism of acetylcholine in the nervous system of Aplysia californica. III. Studies of an indentified cholinergic neuron. J. Gen. Physiol. 65, 293–213.
Flinn, J. M., Hong, C., Holt, R., and Chandhoke, V. (1997). Serotonin levels as a function of age in Aplysia californica. Invert. Neurosci. 2, 253–260.
Gerdes, R., and Fieber, L. A. (2006). Life history and aging of captive-reared California sea hares (Aplysia californica). J. Am. Assoc. Lab. Anim. Sci. 45, 40–47.
Ha, T. J., Kohn, A. B., Bobkova, Y. V., and Moroz, L. L. (2006). Molecular characterization of NMDA-like receptors in Aplysia and Lymnaea: relevance to memory mechanisms. Biol. Bull. 210, 255–270.
Hardy, J., and Selkoe, D. J. (2002). The amyloid hypothesis of Alzheimer’s disease: progress and problems on the road to therapeutics. Science 297, 353–356.
Hardy, J. A., and Higgins, G. A. (1992). Alzheimer’s disease: the amyloid cascade hypothesis. Science 256, 184–185.
Harley, P. R. (1975). A possible age-related decrement in the conduction velocity of Aplysia neuron R2. Experientia 31, 901–902.
Hawkins, R. D., Kandel, E. R., and Bailey, C. H. (2006). Molecular mechanisms of memory storage in Aplysia. Biol. Bull. 210, 174–191.
He, Y., Vogelstein, B., Velculescu, V. E., Papadopoulos, N., and Kinzler, K. W. (2008). The antisense transcriptomes of human cells. Science 322, 1855–1857.
Heyland, A., and Moroz, L. L. (2006). Signaling mechanisms underlying metamorphic transitions in animals. Integr. Comp. Biol. 46, 743–759.
Hirsch, H. R., and Peretz, B. (1984). Survival and aging of a small laboratory population of a marine mollusc, Aplysia californica. Mech. Ageing Dev. 27, 43–62.
Hughes, G. M., and Tauc, L. (1961). The path of the giant cell axons in Aplysia depilans. Nature 191, 404–405.
Jeanmougin, F., Thompson, J. D., Gouy, M., Higgins, D. G., and Gibson, T. J. (1998). Multiple sequence alignment with Clustal X. Trends Biochem. Sci. 23, 403–405.
Jezzini, S. H., Bodnarova, M., and Moroz, L. L. (2005). Two-color in situ hybridization in the CNS of Aplysia californica. J. Neurosci. Methods 149, 15–25.
Jezzini, S. H., and Moroz, L. L. (2004). Identification and distribution of a two-pore domain potassium channel in the CNS of Aplysia californica. Brain Res. Mol. Brain Res. 127, 27–38.
Jin, C., Zang, C., Wei, G., Cui, K., Peng, W., Zhao, K., and Felsenfeld, G. (2009). H3.3/H2A.Z double variant-containing nucleosomes mark ‘nucleosome-free regions’ of active promoters and other regulatory regions. Nat. Genet. 41, 941–945.
Kandel, E. R. (2001). The molecular biology of memory storage: a dialogue between genes and synapses. Science 294, 1030–1038.
Katayama, S., Tomaru, Y., Kasukawa, T., Waki, K., Nakanishi, M., Nakamura, M., Nishida, H., Yap, C. C., Suzuki, M., Kawai, J., Suzuki, H., Carninci, P., Hayashizaki, Y., Wells, C., Frith, M., Ravasi, T., Pang, K. C., Hallinan, J., Mattick, J., Hume, D. A., Lipovich, L., Batalov, S., Engstrom, P. G., Mizuno, Y., Faghihi, M. A., Sandelin, A., Chalk, A. M., Mottagui-Tabar, S., Liang, Z., Lenhard, B., and Wahlestedt, C. (2005). Antisense transcription in the mammalian transcriptome. Science 309, 1564–1566.
Katzoff, A., Ben-Gedalya, T., Hurwitz, I., Miller, N., Susswein, Y. Z., and Susswein, A. J. (2006). Nitric oxide signals that Aplysia have attempted to eat, a necessary component of memory formation after learning that food is inedible. J. Neurophysiol. 96, 1247–1257.
Katzoff, A., Ben-Gedalya, T., and Susswein, A. J. (2002). Nitric oxide is necessary for multiple memory processes after learning that a food is inedible in Aplysia. J. Neurosci. 22, 9581–9594.
Kindy, M. S., Srivatsan, M., and Peretz, B. (1991). Age-related differential expression of neuropeptide mRNAs in Aplysia. Neuroreport 2, 465–468.
Kohn, A. B., Bobkova, E., and Moroz, L. L. (2009). Epigenetic bases of neuronal diversity and plasticity in Aplysia californica: toward single neuron epigenome. Society for Neuroscience Meeting:481.412/GG424. Available at: http://www.abstractsonline.com/Plan/ViewAbstract.aspx?sKey=e4b1fffd-644c-4714-96bc-0cdbe12ae277&cKey=ee38ae3a-5048-4839-9816-a3110c49a872&mKey={081F7976-E4CD-4F3D-A0AF-E8387992A658} /
Kohn, A. B., Jezzini, S., Ha, T., Bentley-Sloan, J. M. C., Bobkova, E., Lee, C., Yu, F., Shaw, R., Li, J., Colman, B., Clouser, C., Barbaciorus, M., Shan, A., Farmerie, W., and Moroz, L. L. (2008). Nearly complete genomic profiling of individual identified neurons: SOLiD approach. Society for Neuroscience Meeting:880.881. Available at: http://www.abstractsonline.com/Plan/SSResults.aspx/
Kriegstein, A. R. (1977). Development of the nervous system of Aplysia californica. Proc. Natl. Acad. Sci. U.S.A. 74, 375–378.
Kriegstein, A. R., Castellucci, V., and Kandel, E. R. (1974). Metamorphosis of Aplysia californica in laboratory culture. Proc. Natl. Acad. Sci. U.S.A. 71, 3654–3658.
Kupfermann, I., Cohen, J. L., Mandelbaum, D. E., Schonberg, M., Susswein, A. J., and Weiss, K. R. (1979). Functional role of serotonergic neuromodulation in Aplysia. Fed. Proc. 38, 2095–2102.
Kupfermann, I., and Weiss, K. R. (1982). Activity of an identified serotonergic neuron in free moving Aplysia correlates with behavioral arousal. Brain Res. 241, 334–337.
Lacoste, N., and Almouzni, G. (2008). Epigenetic memory: H3.3 steps in the groove. Nat. Cell Biol. 10, 7–9.
Lapainis, T., Rubakhin, S. S., and Sweedler, J. V. (2009). Capillary electrophoresis with electrospray ionization mass spectrometric detection for single-cell metabolomics. Anal. Chem. 81, 5858–5864.
Lein, E. S., Hawrylycz, M. J., Ao, N., Ayres, M., Bensinger, A., Bernard, A., Boe, A. F., Boguski, M. S., Brockway, K. S., Byrnes, E. J., Chen, L., Chen, L., Chen, T. M., Chin, M. C., Chong, J., Crook, B. E., Czaplinska, A., Dang, C. N., Datta, S., Dee, N. R., Desaki, A. L., Desta, T., Diep, E., Dolbeare, T. A., Donelan, M. J., Dong, H. W., Dougherty, J. G., Duncan, B. J., Ebbert, A. J., Eichele, G., Estin, L. K., Faber, C., Facer, B. A., Fields, R., Fischer, S. R., Fliss, T. P., Frensley, C., Gates, S. N., Glattfelder, K. J., Halverson, K. R., Hart, M. R., Hohmann, J. G., Howell, M. P., Jeung, D. P., Johnson, R. A., Karr, P. T., Kawal, R., Kidney, J. M., Knapik, R. H., Kuan, C. L., Lake, J. H., Laramee, A. R., Larsen, K. D., Lau, C., Lemon, T. A., Liang, A. J., Liu, Y., Luong, L. T., Michaels, J., Morgan, J. J., Morgan, R. J., Mortrud, M. T., Mosqueda, N. F., Ng, L. L., Ng, R., Orta, G. J., Overly, C. C., Pak, T. H., Parry, S. E., Pathak, S. D., Pearson, O. C., Puchalski, R. B., Riley, Z. L., Rockett, H. R., Rowland, S. A., Royall, J. J., Ruiz, M. J., Sarno, N. R., Schaffnit, K., Shapovalova, N. V., Sivisay, T., Slaughterbeck, C. R., Smith, S. C., Smith, K. A., Smith, B. I., Sodt, A. J., Stewart, N. N., Stumpf, K. R., Sunkin, S. M., Sutram, M., Tam, A., Teemer, C. D., Thaller, C., Thompson, C. L., Varnam, L. R., Visel, A., Whitlock, R. M., Wohnoutka, P. E., Wolkey, C. K., Wong, V. Y., Wood, M., Yaylaoglu, M. B., Young, R. C., Youngstrom, B. L. Yuan, X. F., Zhang, B., Zwingman, T. A. and Jones, A. R. (2007). Genome-wide atlas of gene expression in the adult mouse brain. Nature 445, 168–176.
Li, L., Garden, R. W., and Sweedler, J. V. (2000). Single-cell MALDI: a new tool for direct peptide profiling. Trends Biotechnol. 18, 151–160.
Li, L., and Sweedler, J. V. (2008). Peptides in the brain: mass spectrometry based measurement approaches and challenges. Annu. Rev. Anal. Chem. 1, 451–493.
Liu, X., Long, F., Peng, H., Aerni, S. J., Jiang, M., Sanchez-Blanco, A., Murray, J. I., Preston, E., Mericle, B., Batzoglou, S., Myers, E. W., and Kim, S. K. (2009). Analysis of cell fate from single-cell gene expression profiles in C. elegans. Cell 139, 623–633.
Lovell, P., and Moroz, L. L. (2006). The largest growth cones in the animal kingdom and dynamics of neuronal growth in cell culture of Aplysia. Integr. Comp. Biol. 46 847–870.
Martin Caballero, I., Hansen, J., Leaford, D., Pollard, S., and Hendrich, B. D. (2009). The methyl-CpG binding proteins Mecp2, Mbd2 and Kaiso are dispensable for mouse embryogenesis, but play a redundant function in neural differentiation. PLoS ONE 4:e4315. doi: 10.1371/journal.pone.0004315.
Masoro, E. J., and Austad, S. N. (eds). (2006). Handbook of the Biology of Aging. Amsterdam: Academic Press.
Mattick, J. S. (2009). The genetic signatures of noncoding RNAs. PLoS Genet. 5:e1000459. doi: 10.1371/journal.pgen.1000459.
McCarroll, S. A., Murphy, C. T., Zou, S., Pletcher, S. D., Chin, C. S., Jan, Y. N., Kenyon, C., Bargmann, C. I., and Li, H. (2004). Comparing genomic expression patterns across species identifies shared transcriptional profile in aging. Nat. Genet. 36, 197–204.
Mercer, T. R., Dinger, M. E., Mariani, J., Kosik, K. S., Mehler, M. F., and Mattick, J. S. (2008). Noncoding RNAs in long-term memory formation. Neuroscientist 14, 434–445.
Mercer, T. R., Dinger, M. E., and Mattick, J. S. (2009). Long non-coding RNAs: insights into functions. Nat. Rev. Genet. 10, 155–159.
Moroz, L. L. (2006). Localization of putative nitrergic neurons in peripheral chemosensory areas and the central nervous system of Aplysia californica. J. Comp. Neurol. 495, 10–20.
Moroz, L. L. (2009). On the independent origins of complex brains and neurons. Brain Behav. Evol. 74, 177–190.
Moroz, L. L., Dahlgren, R. L., Boudko, D., Sweedler, J. V., and Lovell, P. (2005). Direct single cell determination of nitric oxide synthase related metabolites in identified nitrergic neurons. J. Inorg. Biochem. 99, 929–939.
Moroz, L. L., Edwards, J. R., Puthanveettil, S. V., Kohn, A. B., Ha, T., Heyland, A., Knudsen, B., Sahni, A., Yu, F., Liu, L., Jezzini, S., Lovell, P., Iannucculli, W., Chen, M., Nguyen, T., Sheng, H., Shaw, R., Kalachikov, S., Panchin, Y. V., Farmerie, W., Russo, J. J., Ju, J., and Kandel, E. R. (2006). Neuronal transcriptome of Aplysia: neuronal compartments and circuitry. Cell 127, 1453–1467.
Moroz, L. L., Gillette, R., and Sweedler, J. V. (1999). Single-cell analyses of nitrergic neurons in simple nervous systems. J. Exp. Biol. 202(Pt. 4), 333–341.
Moroz, L. L., Gyori, J., and Salanki, J. (1993). NMDA-like receptors in the CNS of molluscs. Neuroreport 4, 201–204.
Nicholas, K. B., Nicholas, H. B. Jr., and Deerfield, D. W. II. (1997). GeneDoc: analysis and visualization of genetic variation. EMBNEW. NEWS 4, 14.
Ohmori, H. (1981). Development of intrinsic burst generation in identified neuron R15 of Aplysia. Brain Res. 222, 383–387.
Ohmori, H. (1982). Development of post-tetanic potentiation at identified inhibitory and excitatory synapses in Aplysia. J. Physiol. 322, 223–240.
Ono, S., Baux, G., Sekiguchi, M., Fossier, P., Morel, N. F., Nihonmatsu, I., Hirata, K., Awaji, T., Takahashi, S., and Takahashi, M. (1998). Regulatory roles of complexins in neurotransmitter release from mature presynaptic nerve terminals. Eur. J. Neurosci. 10, 2143–2152.
Page, R. D. (1996). TreeView: an application to display phylogenetic trees on personal computers. Comput. Appl. Biosci. 12, 357–358.
Papka, R., Peretz, B., Tudor, J., and Becker, J. (1981). Age-dependent anatomical changes in an identified neuron in the CNS of Aplysia californica. J. Neurobiol. 12, 455–468.
Peretz, B. (1988). Long-term change of viability of neuron functioning and its possible behavioral consequences in the adult Aplysia. J. Physiol. (Paris) 83, 217–223.
Peretz, B., Ringham, G., and Wilson, R. (1982). Age-diminished motor neuronal function of central neuron L7 in Aplysia. J. Neurobiol. 13, 141–151.
Peretz, B., and Romanenko, A. (1986). Properties of muscle cells and remodeling of neuromuscular junctions as related to age in Aplysia. Mech. Ageing Dev. 34, 117–131.
Peretz, B., Romanenko, A., and Markesbery, W. (1984). Functional history of two motor neurons and the morphometry of their neuromuscular junctions in the gill of Aplysia: evidence for differential aging. Proc. Natl. Acad. Sci. U.S.A. 81, 4232–4236.
Peretz, B., and Srivatsan, M. (1992). Differences in aging in two neural pathways: proposed explanations from the nervous system of Aplysia. Exp. Gerontol. 27, 83–97.
Peretz, B., and Srivatsan, M. (1996). Chronic stimulation increases acetylcholinesterase activity in old Aplysia. Behav. Brain Res. 80, 203–210.
Ponting, C. P., Oliver, P. L., and Reik, W. (2009). Evolution and functions of long noncoding RNAs. Cell 136, 629–641.
Puthanveettil, S. V., Monje, F. J., Miniaci, M. C., Choi, Y. B., Karl, K. A., Khandros, E., Gawinowicz, M. A., Sheetz, M. P., and Kandel, E. R. (2008). A new component in synaptic plasticity: upregulation of kinesin in the neurons of the gill-withdrawal reflex. Cell 135, 960–973.
Rajasethupathy, P., Fiumara, F., Sheridan, R., Betel, D., Puthanveettil, S. V., Russo, J. J., Sander, C., Tuschl, T., and Kandel, E. (2009). Characterization of small RNAs in Aplysia reveals a role for miR-124 in constraining synaptic plasticity through CREB. Neuron 63, 803–817.
Rattan, K. S., and Peretz, B. (1981). Age-dependent behavioral changes and physiological changes in identified neurons in Aplysia californica. J. Neurobiol. 12, 469–478.
Rayport, S. G., Ambron, R. T., and Babiarz, J. (1983). Identified cholinergic neurons R2 and LPl1 control mucus release in Aplysia. J. Neurophysiol. 49, 864–876.
Rubakhin, S. S., Li, L., Moroz, T. P., and Sweedler, J. V. (1999). Characterization of the Aplysia californica cerebral ganglion F cluster. J. Neurophysiol. 81, 1251–1260.
Selkoe, D. J. (1999). Translating cell biology into therapeutic advances in Alzheimer’s disease. Nature 399, A23–A31.
Selkoe, D. J., and Wolfe, M. S. (2007). Presenilin: running with scissors in the membrane. Cell 131, 215–221.
Silacci, P., Mazzolai, L., Gauci, C., Stergiopulos, N., Yin, H. L., and Hayoz, D. (2004). Gelsolin superfamily proteins: key regulators of cellular functions. Cell. Mol. Life Sci. 61, 2614–2623.
Sloan, M. A., Levenson, J., Tran, Q., Kerbeshian, M., Block, G. D., and Eskin, A. (1999). Aging affects the ocular circadian pacemaker of Aplysia californica. J. Biol. Rhythms 14, 151–159.
Southall, M. D., Flinn, J. M., Holt, R. W., and Chandhoke, V. (1997). Age dependent changes in serotonin and dopamine receptors in Aplysia californica. Comp. Biochem. Physiol. C, Pharmacol. Toxicol. Endocrinol. 118, 137–141.
Stommes, D., Fieber, L. A., Beno, C., Gerdes, R., and Capo, T. R. (2005). Temperature effects on growth, maturation, and lifespan of the California sea hare (Aplysia californica). Contemp. Top. Lab. Anim. Sci. 44, 31–35.
Suzuki, M. M., and Bird, A. (2008). DNA methylation landscapes: provocative insights from epigenomics. Nat. Rev. Genet. 9, 465–476.
Szulwach, K. E., Jin, P., and Alisch, R. S. (2009). Noncoding RNAs in mental retardation. Clin. Genet. 75, 209–219.
Tang, F., Barbacioru, C., Wang, Y., Nordman, E., Lee, C., Xu, N., Wang, X., Bodeau, J., Tuch, B. B., Siddiqui, A., Lao, K., and Surani, M. A. (2009). mRNA-Seq whole-transcriptome analysis of a single cell. Nat. Methods. 5, 516–535.
Thompson, J. D., Gibson, T. J., Plewniak, F., Jeanmougin, F., and Higgins, D. G. (1997). The CLUSTAL_X windows interface: flexible strategies for multiple sequence alignment aided by quality analysis tools. Nucleic Acids Res. 25, 4876–4882.
Timinszky, G., Till, S., Hassa, P. O., Hothorn, M., Kustatscher, G., Nijmeijer, B., Colombelli, J., Altmeyer, M., Stelzer, E. H., Scheffzek, K., Hottiger, M. O., and Ladurner, A. G. (2009). A macrodomain-containing histone rearranges chromatin upon sensing PARP1 activation. Nat. Struct. Mol. Biol. 16, 923–929.
Tiwari, V. K., McGarvey, K. M., Licchesi, J. D., Ohm, J. E., Herman, J. G., Schubeler, D., and Baylin, S. B. (2008). PcG proteins, DNA methylation, and gene repression by chromatin looping. PLoS Biol. 6, 2911–2927.
Treistman, S. N., and Schwartz, J. H. (1977). Metabolism of acetylcholine in the nervous system of Aplysia californica. IV. Studies of an identified cholinergic axon. J. Gen. Physiol. 69, 725–741.
Walsh, D. M., Minogue, A. M., Sala Frigerio, C., Fadeeva, J. V., Wasco, W., and Selkoe, D. J. (2007). The APP family of proteins: similarities and differences. Biochem. Soc. Trans. 35, 416–420.
Walsh, D. M., and Selkoe, D. J. (2004). Deciphering the molecular basis of memory failure in Alzheimer’s disease. Neuron 44, 181–193.
Walters, E. T., Bodnarova, M., Billy, A. J., Dulin, M. F., Diaz-Rios, M., Miller, M. W., and Moroz, L. L. (2004). Somatotopic organization and functional properties of mechanosensory neurons expressing sensorin-A mRNA in Aplysia californica. J. Comp. Neurol. 471, 219–240.
Walters, E. T., and Moroz, L. L. (2009). Molluscan memory of injury: evolutionary insights into chorinic pain and neurological disorders. Brain Behav. Evol. 686, 1–13.
Wang, Z., Gerstein, M., and Snyder, M. (2009). RNA-Seq: a revolutionary tool for transcriptomics. Nat. Rev. Genet. 10, 57–63.
Weiss, K. R., and Kupfermann, I. (1976). Homology of the giant serotonergic neurons (metacerebral cells) in Aplysia and pulmonate molluscs. Brain Res. 117, 33–49.
Keywords: Aplysia, single neuron transcriptome, epigenetics of aging, Alzheimer’s disease, histones
Citation: Moroz LL and Kohn AB (2010) Do different neurons age differently? Direct genome-wide analysis of aging in single identified cholinergic neurons. Front. Ag. Neurosci. 2:6. doi: 10.3389/neuro.24.006.2010
Received: 02 December 2009;
Paper pending published: 05 January 2010;
Accepted: 27 January 2010;
Published online: 19 May 2010
Edited by:
Thomas C. Foster, University of Florida, USAReviewed by:
Rhanor Gillette, University of Illinois, USAMark Miller, University of Puerto Rico, USA
Copyright: © 2010 Moroz and Kohn. This is an open-access article subject to an exclusive license agreement between the authors and the Frontiers Research Foundation, which permits unrestricted use, distribution, and reproduction in any medium, provided the original authors and source are credited.
*Correspondence: Leonid L. Moroz, Department of Neuroscience, Evelyn F and William L. McKnight Brain Institute, University of Florida, 100 Newell Drive, Gainesville, FL 32611, USA; The Whitney Laboratory for Marine Bioscience, University of Florida, 9505 Ocean Shore Boulevard, St Augustine, FL 32080, USA. e-mail: moroz@whitney.ufl.edu