
- 1 Neurobiology Sector, Scuola Internazionale Superiore di Studi Avanzati, Trieste, Italy
- 2 Department of Physics, Northeastern University, Boston, MA, USA
Leeches exploring a new environment continuously meet each other and merge in temporary groups. After 2–3 h, leeches become attracted to each other eventually forming a large and stable group. When their number is reduced, leeches remain solitary, behaving independently. Group formation is facilitated by body injection of serotonin (5-HT) and the level of endogenous 5-HT is elevated in leeches forming a large group. In contrast, intravenous injection of 5-HT antagonists prevented injected leeches from joining a large group of conspecifics. When sensilla near the head were ablated or the supraesophageal ganglion disconnected, leeches remained solitary, but explored the environment swimming and crawling. These results suggest that group formation is initiated by a release of 5-HT triggered by sensilla stimulation and its dynamics can be explained by the establishment of a reinforcement dynamics, as observed during human group formation. As 5-HT affects social interactions also in humans, group formation in leeches and humans share a similar dynamics and hormonal control.
Introduction
Animals from simple invertebrates to mammals and humans, not only interact with the environment but establish social interactions with their conspecifics (Anstey et al., 2009; Makris et al., 2009; Nagy et al., 2010; Sokolowski, 2010; Zhao et al., 2011). In lower invertebrates these interactions lead to a swarming behavior with the formation of groups of several tens and even thousands of conspecifics adopting the same behavior. Locusts can switch from a solitary to a social behavior, advantageous when competing for limited resources or during migration (Buhl et al., 2006; Bazazi et al., 2008; Anstey et al., 2009). Several species of fish form large shoals (Blaxter and Hunter, 1982; Hoare et al., 2000) often before migration (Makris et al., 2009). Birds form flocks able to fly collectively (Ballerini et al., 2008; Nagy et al., 2010). We have studied the emergence of group formation in leeches for two reasons: firstly, because it is possible to quantify their behavior easily and precisely (Garcia-Perez et al., 2005; Mazzoni et al., 2005; Bisson and Torre, 2011). Secondly, the nervous system of the leech Hirudo medicinalis has been extensively studied (Macagno, 1980; Muller et al., 1981) so that it is possible to relate its behavior to underlying neuronal networks (Kristan et al., 2005) and specific neuromodulators, such as serotonin (5-HT), dopamine (DA), and octopamine (Willard, 1981; Puhl and Mesce, 2008). In the present manuscript, we quantify the dynamics of formation of leech groups. When the density of conspecifics is low (less than five conspecifics in 700 cm2) leeches move independently, but when their density is doubled the formation of stable groups is observed. The critical density for group formation is lowered by elevating the level of intracellular 5-HT inside the leech bodies. Ablation experiments show that a neurobiological signal modulating group formation is initiated by sensory receptors located near the leech’s head and processed in the supraesophageal ganglion. We have detected an elevation of the level of endogenous 5-HT in leeches forming a large group and this observation raises the possibility that a somatic, i.e., an extrasynaptic release of 5-HT is involved in group formation. Indeed extrasynaptic release of 5-HT able to diffuse to remote receptor sites has been detected and characterized in several preparations where is associated to functional roles (Bunin et al., 1998; Bunin and Wightman, 1999; De-Miguel and Trueta, 2005; Kaushalya et al., 2008). At a formal level, the formation of stable groups can be explained by the establishment of a reinforcement dynamics (Cattuto et al., 2009; Stehlé et al., 2010) depending on the leech density and the intracellular level of 5-HT, which can be modeled in a mathematical way, very similar to that used to describe human aggregation (Stehlé et al., 2010; Zhao et al., 2011).
Materials and Methods
Animals and Preparations
Adult leeches (Hirudo verbana) obtained from Ricarimpex (Eysines, France) were housed in groups of about 30 animals in 20-l tanks of artificial pond water [Instant Ocean salts (Aquarium Systems) diluted with deionized water to 1/1000 of ocean strength]. Leeches were kept in a circular tank (diameter: 30 cm, height: 6 cm), filled with artificial pond water kept at about 16°C, under daily illumination, and used within few months after shipping. Since Ricarimpex breeds leeches outdoors, we assume that they retain the seasonal rhythm established during development. Observation tanks were illuminated with a circular array of white light LEDs which provided dim, diffuse illumination with no abrupt spatial and/or temporal gradients. No additional sensory stimuli, such as chemical, mechanical, or visual inputs were intentionally applied. A transparent, plastic disk was used to keep leeches inside the tank.
Determination of the Level of 5-HT by HPLC
Serotonin (5-hydroxytryptamine, 5-HT) was quantified in extracts of chains of leech ganglia by reverse-phase high performance liquid chromatography (HPLC). Leeches were positioned in the usual observation tank and after 3–5 h leeches which formed a group of at least eight conspecifics (gregarious leeches) and those who remained solitary were selected for the determination of their body level of 5-HT. Solitary and gregarious leeches were immediately submerged in liquid nitrogen for approximately 1 or 2 min and frozen leeches were placed on an ice cooled block. Chains of ganglia from the tail to the head ganglion – usually composed by around 20 individual ganglia – were dissected out and placed in a 100-μl microhomogenizer containing 50 μl of ice-cold 0.15 M perchloric acid and homogenized for 3 min on ice. The homogenate was transferred to 1.5 ml Eppendorf tubes using a Hamilton syringe and centrifuged at 17500 g for 20 min at room temperature. The supernatant was transferred to a second Eppendorf tube and stored at −80°C until HPLC analysis. A sample of 100–200 μl of their blood was also extracted and treated as treated as chains of ganglia. 5-HT was quantified by reference to external standards.
Delivery of Neuromodulators
Some leeches were injected with specific amounts of 5-HT, ketanserin, or mianserin (Sigma-Aldrich). All neuromodulator stock solutions (5-HT: 1 mM, mianserin: 10 mM, ketanserin: 5 mM) were prepared using distilled water (except ketanserin, which was dissolved in 0.1 M HCl solution), stored at −20°C in 500 μl aliquots and defrosted in 15 min at room temperature. The final concentration was reached by dilution in our normal leech saline solution (in mM: 116 NaCl, 1.8 CaCl2, 4 KCl, 1.5 MgCl2, 10 glucose, 10 Tris maleate buffered to pH 7.4) immediately before use and delivery. We injected 300 μl of 200 μM 5-HT solution using 1 ml insulin syringes with 29 GA and 15 mm long needles. Injection of 150 μl containing 1 mM ketanserin or 2 mM mianserin solutions were followed by another injection of 150 μl containing 400 μM 5-HT solution. Each leech was gently held in one hand and the needle was inserted under the skin of the dorsal side, along its dorsal axis at a depth of about 10% of the body thickness. We calculated that the injected solution was diluted into the extracellular space roughly 25–30% of the leech volume, usually 3–4 ml. Therefore, the final drug concentration injected in the leeches is approximately one-fourth of the injected drug concentration. The body volume of an adult leech is 3–4 ml, while the overall blood volume is about 8–9% of the body mass, corresponding to 240–360 μl (Wenning and Meyer, 2007). Changes of body volume are well tolerated by leeches because they can increase their initial weight by 8–11 times during feeding (Dickinson and Lent, 1984), it is likely that an increase of the body volume (about 10% of its body mass) caused by the injection did not impair the animal’s movements.
Ablation Studies
Leeches were anesthetized with 8% ethanol in leech Ringer’s solution and iridectomy scissors were used to cut away the band of dorsal lip organs visible in the light microscope, with 1 or 2 mm of skin on either side including the rows of smaller lip organs detected with the scanning electron microscope (Elliott, 1986) but not visible in the light microscope. Sham operations were performed in the same way, except that a band of skin dorsally adjacent to the lip organs (along the dorsal surface of the head) was removed and the lip organs themselves were left intact. Leeches were allowed to recover for 1 day in water. The day after surgery, ablated leeches, injected with 300 μl of 200 μM 5-HT and sham-ablated leeches, were tested, along with normal controls, for social interactions.
Imaging
We used a color CCD camera (640 × 480 pixels of image size; model DFK 21BF04; The Imaging Source Europe) to image leeches from above and to monitor their movements (Figure 1A). The camera was connected via the FireWire-output to a frame grabber (PCI-1394; Texas Instruments) installed on a personal computer, able to process images in real-time. Leeches’ bodies were tracked at 7.5 Hz in RGB mode using a software program developed in Matlab language (MathWorks, Natick, MA, USA). The tracking algorithm is composed of two subroutines. The first subroutine is executed in real-time and extracts the borders of all the groups of leeches. Its purpose is to detect and store leech shapes. Each frame was converted into grayscale by means of the average method (i.e., by taking the average of the Red, Green, and Blue signals; Pratt, 1991). The resulting 8 bit grayscale image has values ranging between 0 (corresponding to white) and 255 (corresponding to black). A threshold equal to 50 is then applied to the grayscale image: all the pixels that have values major or equal to this threshold are set to value 255, 0 otherwise. We refer to this resulting image as the binary version of the frame (in which its pixels can assume only two possible values) and each leech – or group of leeches – appears as a black shape or blob. The extraction of the closed contours of each blob was achieved by applying a Radial Sweep algorithm (a contour tracing algorithm; Pavlidis, 1995) to the image, implemented in the Matlab function bwboundaries (Image Processing Toolbox, MathWorks, Natick, MA, USA). Each closed contour defines a blob representing a single leech or a group of leeches (Figures 1E,F, green lines). Blobs with an area below a threshold of 20 pixels2 (usually caused by leech shadows) were discarded, as the average area of a single, small leech, is major than 30 pixels2. The subroutine stores only the pixels belonging to the contour of the detected blobs so that it was possible to monitor leeches behavior for several hours, minimizing the storage size of the recording file.
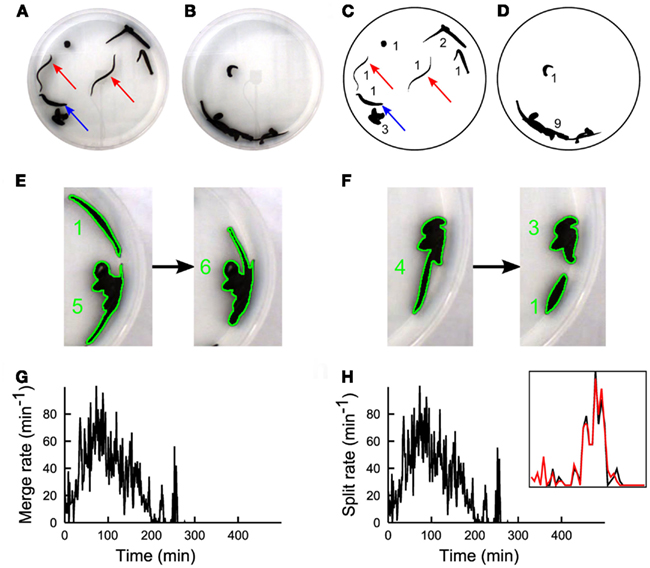
Figure 1. The experimental set-up. A color CCD camera imaged from above the observation tank containing 10 leeches. (A) During the first 2 h, leeches inspected the environment. (B) Following the searching phase a stable large group of leeches in mutual contact was observed. (C,D) Images shown in (A,B), after processing. Numbers in (C,D) indicate the number of conspecifics present in each group. A real-time algorithm extracted the borders of all leech groups (black blobs) and an off-line algorithm determined the number of leeches in each blob (black numbers). During the process of group formation, two kinds of events occurred: two groups could merge (E) forming a larger group, or a single group could split (F) forming two groups. During the searching phase, merge (G), and split (H) rates have similar values, because leeches are highly active and no formation of stable groups can be observed. Inset in panel h shows a zoom of Merge (black) and Split(red) on an enlarged scale. Merge and split plots are very similar because they are evaluated on a sliding time window of size 5 min. Subtle differences between these two signals determine the group formation dynamics.
The second subroutine is performed off-line and processes the previously extracted contours. Its purpose is to determine the number of leeches belonging to the blobs identified by their contour. In the generic frame k, each blob Bk can be labeled as the i-th blob (with i that ranges between 1 and N, where N is the total number of blobs in the k-th frame). If we overlap the frame k over the frame k − 1 we will see that blobs representing a non-moving leech or groups of leeches will match almost perfectly (the small differences being caused by recording noise), whereas blobs representing moving leeches or groups of leeches will share just a portion of their area (usually minor than 80%). Moreover, two blobs observed in frame k − 1, that merge (Figure 1E) between frames k − 1 and k will partially overlap with the resulting blob observed in frame k. Finally, a single blob observed in frame k − 1, that splits (Figure 1F) between frames k − 1 and k will partially overlap with the resulting blobs observed in frame k. The area of intersection between two blobs j and i (the first belonging to frame k − 1, , and the second to frame k, ) can be calculated by performing a multiplication between the binary image containing only and the binary image containing only These two images can be obtained by filling the contours of the two blobs, using a polygon fill algorithm (Hearn and Baker, 1997) implemented in the Matlab function poly2mask. The multiplication is equivalent to performing a logical AND operation: the number of resulting pixels is the area of intersection between the two blobs. We can now define the overlap matrix as:
where A stands for “area” and the symbol ∩ indicates intersection between blobs: the element ωij of the overlap matrix represents the area of intersection between the blob i in frame k and the blob j in frame k − 1 divided by the area of the latter blob. The overlap matrix has size NxM, where N is the number of blobs in frame k and M the number of blobs in frame k − 1. If, for example, row number 3 has more than one non-zero entry, then blob number 3 in frame k is formed by a merge of two or more blobs in frame k − 1 (Figure 1E). If, for example, column number 5 has more than one non-zero entry, then blob number 5 in frame k − 1 splits in two or more blobs in frame k (Figure 1F). The central assumption of the algorithm is that the number of leeches belonging to blob in frame k − 1, multiplied by the non-zero entries ωij of the overlap matrix give a non-integer estimate of the number of leeches belonging to blobs that have non-zero area of intersection with This assumption is supported by the experimental evidence that a leech, in a time interval of 130 ms, cannot vary its shape area in a substantial way and it can be viewed as a rigid body. Let g0 be the Mx1 vector containing the number of leeches belonging to each of the M blobs found in frame 0. The non-integer estimate of g1 (i.e., the Nx1 vector containing the number of leeches belonging to each of the N blobs found in frame 1) is given by:
This estimate is also affected by additive noise μ:
Minimizing the effect of the additive noise μ on the estimate g1 corresponds to minimizing the quantity:
This, in turn, corresponds to solving a quadratic programming problem
Where g* is the integer estimate of g1 (obtained using the floor operator), i.e., the estimate of the number of leeches belonging to the blobs observed in frame 1. The design matrix I (identity matrix) is also positive-definite: this ensures that the problem has a global minimizer. However, the problem needs to be constrained: first, the size of two blobs in frame 1 that are the result of a split of a blob in frame 0 must be equal to the size of the single blob in frame 0. Moreover, the sum of all blob sizes in every frame must be equal to the number of leeches in the tank. A constraint on the merge was not necessary, since it is included in the latter constraint. These two constraints can be included in a single equation, where Aeq is a matrix whose entries are either 0 or 1, opportunely derived from Ω1 (its last column having all entries equal to 1, in order to describe the second constraint) and the first column beq is g0 while all the entries of the second column are equal to the number of leeches in the tank. Finally, we also constrained the number of leeches belonging to a blob, to stay between two reasonable bounds that are dependent on the area of the blob itself: for example, a blob with area 60 pixels2 is likely to contain one leech or at the most three leeches well in contact. We estimated the normal distributions of the areas of a group, given its size (for size ranging from 1 to 20). Then, each blob area was assigned to the closest area distribution, using the Mahalanobis metric.
Where μ and σ are the mean and the standard deviations of the area distribution under consideration: a distance is calculated for each of the 20 distributions, and the minimum one was retained. The closest area distribution (in terms of the Mahalanobis distance) determined the “most likely” size of the considered blob. Thus, the lowest bound l for its size was the size associated to the most likely area distribution to which it belongs, minus 2, while the upper bound u is the size associated to the most likely area distribution to which it belongs, plus 2.
The quadratic programming problem is solved by using the Matlab function quadprog, starting from an initial condition: the sizes associated to each blob in frame 0, which are manually set by the operator, i.e., g0. The algorithm estimates the group sizes of the blobs in frame 1, then in frame 2 and so on. We applied this algorithm to 89 experiments lasting for a time that varied from 1 h to more than 8 h with a number of leeches varying from 5 to 20. The structure of the problem and the constraints imposed seem to guarantee a good performance of the algorithm, with an error of ±1 leech per blob of size major than 1, at the most.
The Model of Group Formation
The model of group formation describes the dynamics of splits and merges of leech groups. The model is based on the reinforcement mechanism already used to model face-to-face human interaction (Stehlé et al., 2010; Zhao et al., 2011). The reinforcement mechanism implies that the longer is the lifetime of a group the less likely it is that its composition changes. This mechanism is responsible for the broad distribution of lifetime of social groups observed in the present experiments with leeches as well as in human face-to-face interactions (Cattuto et al., 2010). In addition to this mechanism we include a second reinforcement mechanism mediated by the role of 5-HT level in the blood, in agreement with the experimental observations reported in the present manuscript. We assume in particular that the level of 5-HT in the blood increases the leech sociality by increasing the probability of merges. Moreover we assume that, as the number of social interactions increases, the level of 5-HT in the blood of the animals increases.
We start from initial conditions in which leeches are connected in groups of size 2. Each group i is characterized by its size ni and its duration Δti= t – ti where ti is the last time in which group i was modified. At each time step first we update the following parameters determining the dynamics of group formations (splits and merges of social groups):
• The variable s, indicating the 5-HT level in the blood of the animals increases proportionally to the number of contacts 〈n2〉 (with multiplicative constant c1) and is at the same time degraded with probability c2. Therefore s is updated at each time according to
• The parameter λ modulates the probability that there is a merge in the dynamics of group formation. We assume that λ is activated by s, the 5-HT level in the blood of the animals, and therefore we take
• The constant Kmet sets the typical scale for the 5-HT level in the blood to activate the “social behavior” and enhances the probability of merges in the group formation dynamics.
At each time we run the dynamics of group formation:
• We choose one random group i;
One conspecific of group i splits from the group with probability
This probability encodes for a reinforcement dynamics responsible for the broad distribution of group lifetimes. The longer leeches interact with each other the less likely they are to split from their own group. We adopt a minimal hypothesis, summarized by Eq. 10 previously used to model face-to-face social interactions in humans during scientific conferences (Stehlé et al., 2010; Zhao et al., 2011) The constants an and bn are responsible for the shape of the lifetime distribution of a group of size n.
• If the split occurs, two options are allowed:
• The animal merges with another group j of size nj and duration Δtj with probability proportional to λ
• The animal remains isolated with probability (1 – λ).
• Finally we update the time of this system according to the expression
Results
We positioned up to 20 leeches H. medicinalis in an observation tank filled with artificial pond water. The tank had a diameter of 30 cm with a height of 6 cm, where leeches could swim, crawl, and search around. A CCD camera viewing the observation tank from above allowed a precise quantification of leech motion and behavior (Garcia-Perez et al., 2005; Mazzoni et al., 2005; Bisson and Torre, 2011). When 10 leeches were in the tank, they inspected the environment (Figure 1A). During this phase, leeches swam (red arrows) or explored the new environment with their head, keeping the tail sucker attached to the bottom of the tank (blue arrow). After 2–3 h leeches appeared to the viewing CCD camera aggregated in a compact silhouette (Figure 1B) formed by almost all the conspecifics. When the number of leeches was less or equal to 5, after an initial transient exploration, leeches stopped moving and rested in isolation. Therefore leeches, as several other species (Buhl et al., 2006; Ballerini et al., 2008; Bazazi et al., 2008; Anstey et al., 2009; Makris et al., 2009; Nagy et al., 2010) exhibit a transition from solitary to social behavior when their density is above a critical threshold.
In order to quantify the dynamics of group formation, we developed a suitable software: Images (640 × 480 pixels) were acquired at 7.5 Hz and binarized (Figures 1C,D) and an algorithm determined in each image Ii (i = 1,…, K) the number of distinct groups Nn(i) formed by n conspecifics (see numbers near black shapes in Figures 1C,D). The algorithm was also able to determine merges, i.e., when two groups of leeches unified in a single group (Figure 1E) and split, i.e., when a group of leeches broke in two subgroups (Figure 1F). From these data we determined:
– M(iΔt) and S(iΔt) the number of merges(M) and splits(S) in the time widow [iΔt, (i + 1)Δt] (Figures 1G,H).
– N*(iΔt) the mean number of groups in the time widow [iΔt, (i + 1)Δt] (Figure 2B).
– <Nn> (iΔt) the mean size of groups in the time widow [iΔt, (i + 1)Δt] (Figure 2C).
– fn,m(iΔt) the frequency that a group of i conspecifics becomes composed of n conspecifics in the time widow [iΔt, (i + 1)Δt] (Figure 3). If m < n a split occurs and if m > n we have a merge.
– <Nmov> (iΔt) the mean number of moving conspecifics in the time window [iΔt, (i + 1)Δt] (Figure 4A).
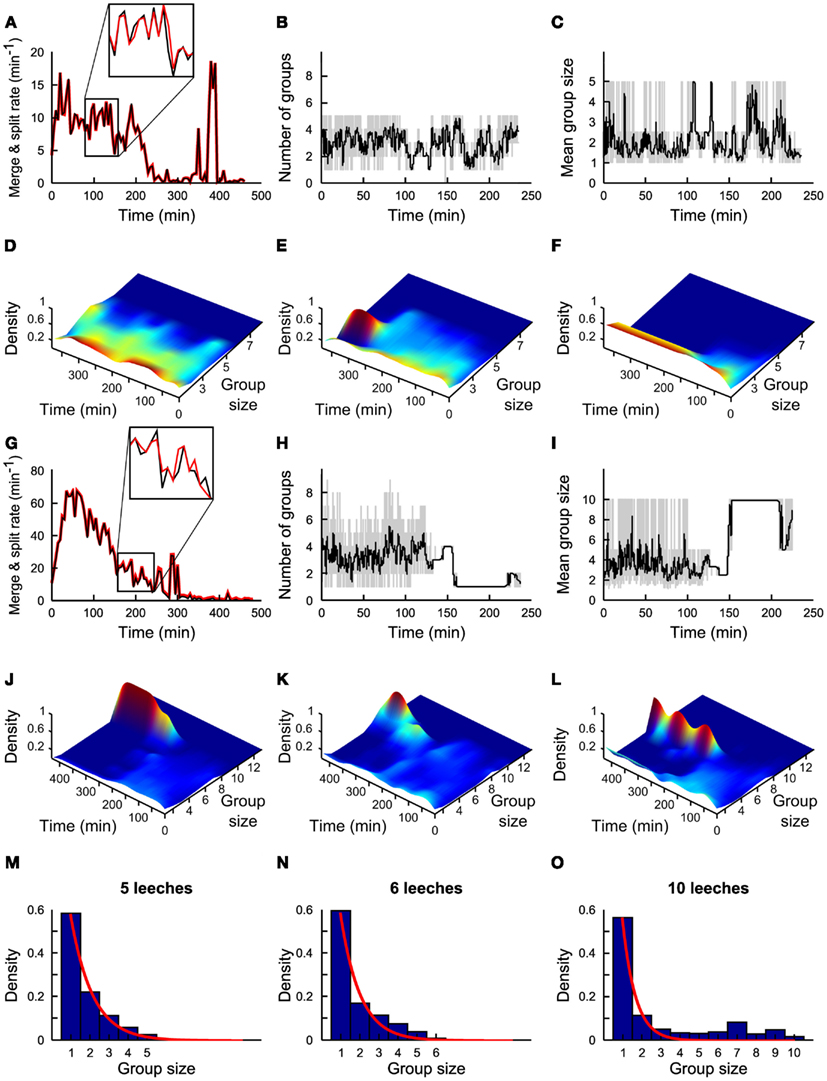
Figure 2. Statistics of group formation. (A) Time evolution of merges (black line) and of splits (red line) in a time window of 5 min. (B) Time evolution of number of groups in a time window of 1 min (gray line) and in 5 min (black line). (C) Time evolution of average group size in a time window of 1 min (gray line) and in 5 min (black line). (A–C) Refer to experiments with five leeches. (D–F) Time evolution of density of groups over 4 h for three different experiments. Color coded scale from dark blue (0 groups) to deep red (5 groups). (G–L) As in (A–F) but with 10 leeches. Inset in panel g shows a zoom of Merge (black) and Split(red) on an enlarged scale. Merge and split plots are very similar but not identical and small differences determine group formation. (M–O) Probability density of group size in the presence of 5, 6, and 10 conspecifics respectively. Plots in (A,G) are averages from 7 and 10 experiments, respectively. Continuous red lines in panels (M–O) are obtained by fitting the experimental data with an exponential distribution21. (B–F) and (H–L) Are based on a single experiment. Plots in (M–O) are averages from 7, 3, and 10 experiments, respectively.
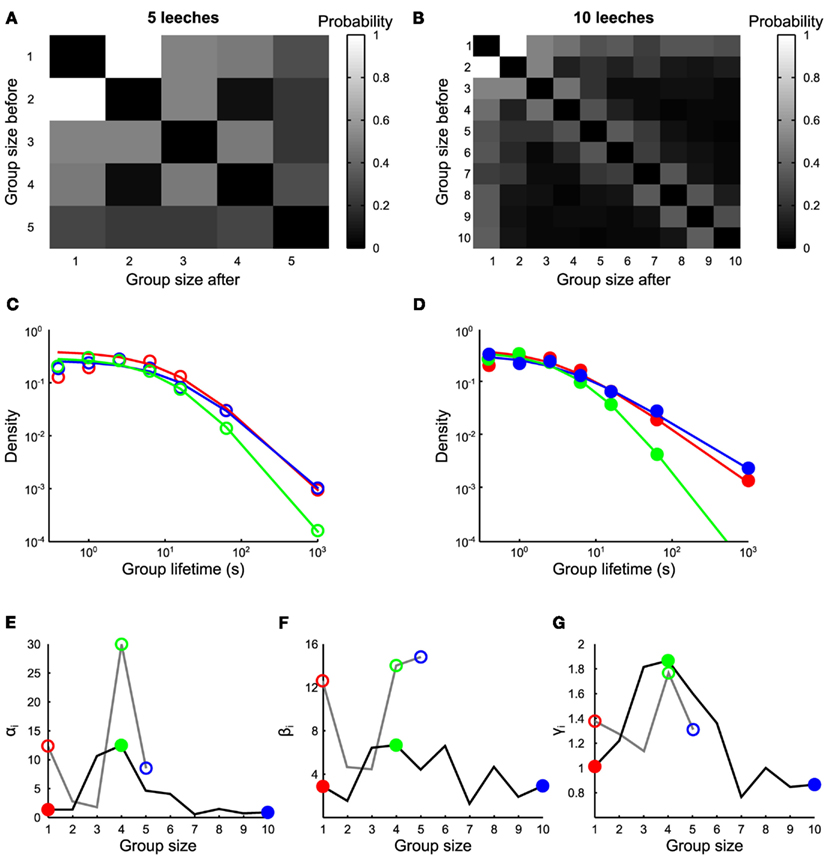
Figure 3. Transitions between groups. (A,B) Transition rates from groups of size n to groups of size m, in the presence of 5 and 10 leeches respectively (average values estimated from 7 and 10 experiments, respectively). (C) Life time density of groups of one (red empty circles), four (green empty circles), and five (blue empty circles) leeches, and associated fit (continuous lines) with Eq. 1 for experiments with five leeches. (D) Life time density of groups of 1 (red filled circles), 4 (green filled circles), and 10 (blue filled circles) leeches, and associated fit (continuous lines) with Eq. 1 for experiments with 10 leeches. (E–G) Values of αn, βn, and γn as a function of n, with 5 leeches (gray continuous lines) and 10 leeches (black continuous lines). Empty and filled colored circles highlight the parameter values of fits reported in (C,D) respectively.
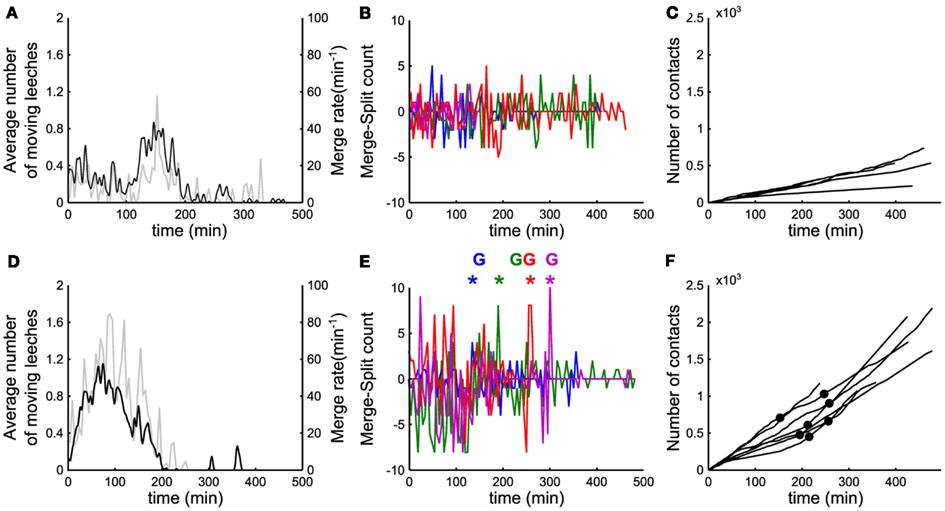
Figure 4. Events leading to group formation. (A,D) Time evolution of the number of moving leeches <Nmov> (nΔt; black line, left vertical axis) and of the merge rate M (nΔt; gray line, right vertical axis) in a window Δt of 5 min. (B) Time evolution of the difference between merges and splits [i.e., M(iΔt) − S(iΔt)] in a window Δt of 5 min. (C) Time evolution of number of contacts per minute (cumulative sum). (A–C) Data for five leeches. (D–F) As in (A–C) but for 10 leeches. In (B,E) data from 4 experiments in different colors. In (E), colored asterisks mark the occurrence of a peak of merges preceding the formation of a stable group, marked with the letter G (same color). In (F), filled black dots mark the time instant in which a stable group forms.
A key feature triggering the transition from solitary to social behavior is the number and duration of encounters among conspecifics. Given the shallow geometry of the tank used for our experiments, we can assume that leeches that belong to a group are also in contact with the majority of them. Therefore, the number of contacts established in the group n of size Nn is at the most The sum of the number of contacts established in all groups at the time kΔT (where ΔT is the capture interval of the frames, i.e., about 130 ms), is Σn Nn(kΔt)2. We quantified the encounters between leeches, by computing the cumulative sum over time of the number of reciprocal contacts per second (Figure 4C), normalized by Nconspecifics (the overall number of leeches in the tank), as
Properties of Group Formation
Groups of conspecifics formed within the first 60 min are not stable. Indeed, during the first 2 h, in the presence of 5 and 10 leeches, the rate of splits and merges could be as high as 20 (Figure 2A) and 80/min (Figure 2E) respectively. In the presence of five leeches the mean number of groups N*(iΔt) varied between 1 and 5 (Figure 2B) and the mean size of these groups <Nn>(iΔt) varied similarly between 1 and 5 (Figure 2C).
Leeches continued to explore the tank for 2–4 h forming transient groups and then slowed down and eventually stopped remaining in isolation (Figures 2D–F). Only rarely (4/53) a group of more than three conspecifics was formed (Figure 2E) and a stable group formed by all five leeches was never observed. In the presence of 10 leeches, a different dynamics was observed: leeches continued to merge and split with a rate often up to 80/min (Figure 2E), but, after 2–3 h, they formed stable large groups of 5–10 conspecifics (Figures 2G–L). In the great majority of experiments performed in spring or summer (see Figure 8, which considers 62 experiments performed over a 2-year period) leeches aggregated in a single group, where they remained in physical contact, possibly moving their heads or tails in an exploratory or a pseudo-swimming behavior. These large groups persisted for additional 3–6 h, i.e., the usual duration of an experiment. We investigated in detail the dynamics when 5 (7 experiments), 6 (3 experiments), and 10 (10 experiments) leeches were in the observation tank. The group size distribution under the assumption of independent behavior (i.e., constant merge and split rates, regardless group size) is expected to be proportional to exp(−λn), where λ is a constant and n is the group size(Gueron and Levin, 1995). When less than five leeches are in the observation tank, the frequency f(n) of finding a group of n leeches is proportional to exp(−λn; blue bars in Figure 2M, theoretical fit in red line) in agreement with the notion of an independent behavior when the leech density is below a given threshold (Bisson and Torre, 2011). When the number of conspecifics in the tank is increased to more than five, f(n) is not proportional anymore to exp(−λn; Figures 2N,O, theoretical fit in red line), indicating the onset of a cooperative behavior in which individual leeches do not remain solitary for long. In order to identify the neurobiological basis of this behavior, we asked whether this transition was mediated by the accumulation in the tank of molecules/pheromones secreted by the leeches. We positioned 20 leeches in the tank and after the formation of a large group of more than 13 conspecifics, leeches were removed from the tank and – leaving the same water – replaced by five naïve leeches. These naïve leeches did not form a group, even though they were sensing the same local chemical medium where previously a large group of conspecifics was formed. Therefore, we posit that group formation is not likely triggered by chemicals secreted into the bath.
Statistics of Transitions between Different Groups
We have also analyzed the frequency of transitions pij between groups of different sizes. The most frequent transitions were those from groups of n conspecifics to groups of n + 1 or n − 1 conspecifics, i.e., merges and splits usually involved one animal leaving or joining a group. This pattern was clearly observed in the presence of 10 (Figure 3B, estimates over 10 experiments) and – to a lesser extent – of five conspecifics (Figure 3A, estimates over 7 experiments). The lifetimes distribution of groups of size n when 5 (Figure 3C) and 10 leeches (Figure 3D) were in the observation tank could be fitted by the equation
With αn, βn, and γn as free parameters. The value of βn controls the average lifetime of a group of n conspecifics (Figure 3F): it has a high value for long lasting groups and varies from 2 to 16 s. The exponent γn in Eq. 14 determines how stable a group of n conspecifics (Figure 3G) is: when 10 leeches were in the tank, the value of γn was close to 1.8 for groups composed by three to five conspecifics, otherwise it was close to 1. Groups of three to four conspecifics had a shorter mean lifetime, indicating that these groups are unstable and either split in smaller groups or merged with other leeches. Groups of more than five leeches are more stable indicating that the presence of a positive feedback value of αn (Figure 3F) influences the ratio αn/βn, which has values varying between 0.2 and 2 s and determines approximately the asymptotic value of short lifetimes. The experimentally observed distribution of lifetimes (Figures 3C,D) strongly deviates from an exponential distribution, expected from a uniform rate of merges and splits (Barrat et al., 2010). A similar deviation is observed also in human behavior (Cattuto et al., 2010), where a power–law distribution of face-to-face interactions is observed. This power–law distribution is explained by a reinforcement dynamics (Stehlé et al., 2010; Zhao et al., 2011) in which the longer a conspecific stays in a group the lesser is likely to leave the group. In humans, the exponent γn increases linearly with n, implying that larger groups are more unstable than smaller groups while the opposite behavior (γn decreasing with n) is observed in leeches. In humans the linear increase of γn with the group size n is explained by assuming that each individual acts independently of the group size. In this view, larger groups are more unstable because there is a larger possibility that individuals of the group decide to leave it or split it. In leeches, however, in order to explain the experimental data we need to suppose that the split probability depends on the group size.
In order to understand the mechanisms leading to the formation of a large group of conspecifics we analyzed in detail the events preceding it. The average number of moving leeches (m.l.) <Nmoving> decreased from an initial value around 0.7 and 1.4 m.l./s for groups of 5 and 10 leeches respectively (Figures 4A,D, average values over 15 and 17 experiments, respectively) to less than 0.2 m.l./s after 3 h. However, after 2–3 h, five leeches in the tank moved more often than 10 leeches (compare Figures 4A,D) and continued to merge and split (Figures 4B,E).
During the initial exploratory phase, encounters among 10 leeches are more frequent: indeed, the average number of contacts <C(iΔt)> (Figures 4C,F) was consistently higher with 10 leeches than with 5, because encounters among conspecifics are easier in a more crowded environment. In the presence of 10 leeches, the number of merges–splits oscillated during the first hour, but had large positive peaks in a time window of 10–30 min (asterisks in Figure 4E) preceding the formation of a large group (G letters in Figure 4E). The results of Figure 4 indicate two features of group formation: (1) – leeches explore for 2–3 h the new environment before coming to rest and (2) – if during the exploratory phase leeches encounter enough conspecifics a reinforcement dynamics is triggered and leeches stop and rest not in isolation but in groups.
The Role of 5-HT in Group Formation
In order to understand the biological basis of group formation, we asked which neurotransmitters could be involved. An elevation of the body concentration of 5-HT shifts locusts from a solitary to a social behavior (Anstey et al., 2009). We isolated from solitary leeches their entire spinal cord from the tail to the head ganglion and we took a sample of 100–200 μl of their blood and we repeated the same dissection from gregarious leeches, which had formed a group of at least eight conspecifics. We measured the concentration of 5-HT with High Pressure Liquid Chromatography: the concentration of 5-HT in ganglia from the spinal cord of gregarious leeches increased by 37% (with a significance of 0.0493; one tail t-test. N = 5 solitary leeches, six gregarious leeches) over that measured in solitary leeches. Also the level of 5-HT in the blood of gregarious leeches was higher but at a lower extent: indeed the level of 5-HT in the blood of gregarious leeches was 25% higher than in solitary leeches (with a significance of 0.04; one tail t-test. N = 4 solitary leeches, 7 gregarious leeches). These experiments were performed from May to September when leeches are more gregarious (see Figure 8). We repeated the same experiments in winter when leeches are less gregarious and do not form easily groups (see Figure 8) and in this period of the year changes of level of 5-HT between gregarious and solitary leeches could not be determined with an adequate statistical significance.
Therefore we studied group formation when five leeches were injected with 300 μl of 200 μM 5-HT solution. In this case (Figure 5A, gray bars: 15 experiments involving five not injected leeches, black bars: 12 experiments involving five injected leeches), groups of three or four conspecifics occur more frequently than what is expected from an independent behavior (red bars). The difference between merges and splits, (Figure 5B and to be compared with Figure 4) approached values close to 0, with positive peaks (asterisks) preceding the formation of a group (G). The average number of contacts <C(iΔt)> for five leeches injected with 5-HT was higher than for the case of five uninjected leeches (Figure 5C). When an isolated leech was injected with 300 μl of 200 μM 5-HT and was moved to a tank where a large group of conspecifics had formed, the injected leech quickly joined the large group (see red trajectory in Figure 5D). The results of these experiments did not have the seasonal variation of spontaneous group formation described in Figure 8.
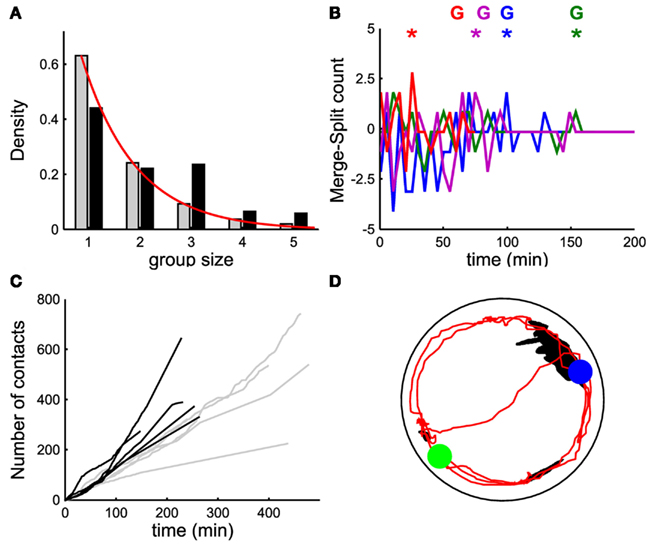
Figure 5. The role of 5-HT. (A) Probability density of group size with five non-injected leeches (gray bars) and with five leeches injected with 300 μl of 200 μM 5-HT solution (black bars). (B) Time evolution of the difference between merges and splits [i.e., M(iΔt) − S(iΔt)] in a window Δt of 5 min for four experiments with five leeches injected with 5-HT; colored asterisks mark the occurrence of a peak of merges leading to the formation of a stable group, marked with the letter G (same color). (C) Time evolution of number of contacts per minute (cumulative sum) for five leeches injected with 5-HT (black lines) and for five non-injected leeches (gray lines). Continuous red line in panel a was obtained by fitting the experimental data with an exponential distribution21. (D) Trajectory (in red) of a leech injected with 5-HT in the presence of an already formed group of eight non-injected leeches (black blob). The blue (green) filled circle indicates the final (initial) position of the injected leech. Leeches injected with 5-HT joined the large leech group within some tens of minutes.
There are many types of 5-HT receptors and several of them have been identified in the leech nervous system: in leeches, 5-HT can activate cationic channels (Sanchez-Armass et al., 1991; Catarsi and Drapeau, 1997; Burrell et al., 2001), anionic channels (Sanchez-Armass et al., 1991; Ali et al., 1998; Burrell et al., 2001), and affect its own reuptake (Bruns et al., 1993; Calviño et al., 2005; De-Miguel and Trueta, 2005). The role of these distinct actions of 5-HT can be dissected by using antagonists such as ketanserin blocking cationic 5-HT gated ionic channels 5-HT2A and 5-HT2C (Sanchez-Armass et al., 1991; Mar and Drapeau, 1996) or mianserin blocking 5-HT gated ionic channels (Gaudry and Kristan, 2009).
In contrast to what observed when a leech is injected with 5-HT (Figure 5D), leeches injected with 150 μl of 1 mM ketanserin (Figure 6A) or of 150 μl of 2 mM mianserin (Figure 6B) and subsequently moved to a tank where a large group of conspecifics had formed, remained solitary and rarely joined the large group. This behavior was also observed when the injection of the antagonist was followed by a subsequent injection of 5-HT (Figure 6C, eight experiments under saline conditions, seven under ketanserin, six under mianserin, eight under 5-HT). Leeches injected with a 5-HT antagonist were picked from the water tank where either they were solitary or formed large groups of conspecifics. Their behavior following the injection of 5-HT antagonist was not dependent whether they were solitary or gregarious in the water tank. Leeches injected with a saline solution (cyan line in Figure 6D) remained solitary, as well as leeches injected with both 5-HT and mianserin or ketanserin (red and green lines, respectively), while those injected with 5-HT joined large groups (blue trajectory). Not injected leeches remained solitary, presumably because they could not encounter their conspecifics during the exploratory phase. The simultaneous injection of ketanserin and mianserin into leeches is expected to have a larger effect of the injection of a single 5-HT antagonist.
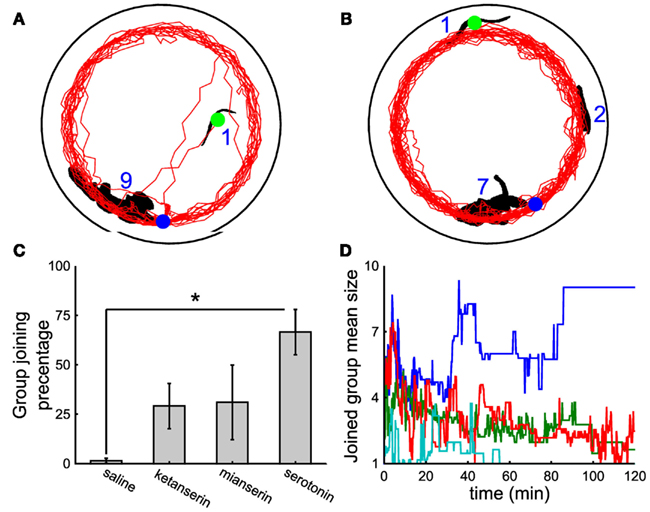
Figure 6. The effect of 5-HT antagonists. (A,B) Black shapes indicate large groups of nine and seven leeches, respectively and the leeches profile (black blob with green circle) injected with 150 μl of 1 mM ketanserin (A) or 2 mM mianserin (B) solutions. Trajectories of injected leeches in red. In both panels, the initial and final positions of the injected leech are marked by the green and the blue dot respectively. Injection of 5-HT antagonists was followed by another injection of 150 μM 5-HT solution. (C) Percentage of time spent by injected leeches in contact with the large group of conspecifics, when leeches were injected with 300 μl of saline solution, with 150 μl of 1 mM ketanserin or 2 mM mianserin solutions, followed by another injection of 150 μl of 400 μM 5-HT solution, or 300 μl of 200 μM 5-HT solution. (D) Time evolution of the mean size of the group joined by the injected leech under the same treatments described in (C) cyan, blue, red, and green lines refer to leeches injected with a saline solution, 5-HT, mianserin, and ketanserin respectively. Student’s t-test, *p < 0.05.
Neurobiological Mechanisms Underlying Group Formation
Leeches are often observed exploring other conspecifics’ bodies by flaring the mouth over their skin, chemoreception could be at basis of group formation. Chemoreception in leeches is mediated by sensilla, ciliated, button-like structures lining the edge of the dorsal lip (Dickinson and Lent, 1984; Elliott, 1984, 1986; Lent and Dickinson, 1984; Gaudry et al., 2010). There are two classes of sensilla: structures with a size of 25–30 μm readily detectable with a light microscope as unpigmented spots in the skin, and smaller structures with a size of 8–10 μm flanking the larger organs not easily detectable with a light microscope (Figure 7A, green dots). The chemical signals detected by sensilla are conveyed to the supraesophageal and subesophageal ganglion. These two ganglia form the head brain of the leech and are connected to the chain of 21 ganglia constituting the central nervous system of the leech (Figure 7A, blue structure).
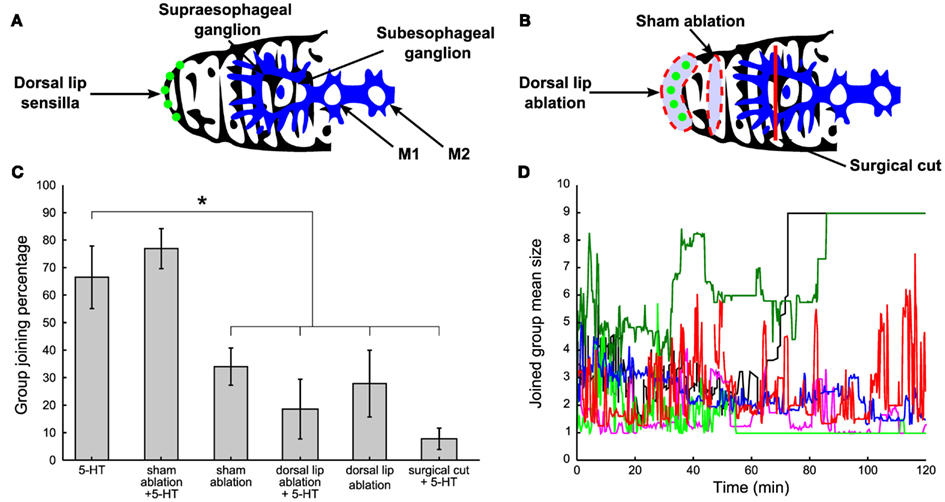
Figure 7. The role of chemoreceptors. (A) Normal control: leeches with intact lips (green dots) and head brain (blue structure) were tested for social attitude previous the injection of 300 μl of 200 μM 5-HT solution. (B) Surgical treatment: the band of dorsal lip organs visible in the light microscope (a, green dots), was cut away in ablated experiments (red dashed line enclosing the green dots). Sham operations were done in the same way except that a band of skin dorsally adjacent to the lip organs (along the dorsal surface of the head) was removed and the lip organs themselves were left intact (red dashed line not enclosing the green dots). The supraesophageal ganglion was surgically disconnected by applying a deep and localized cut (red vertical line). (C) Percentage of time spent by leeches under the above explained surgical treatments in comparison with normal 5-HT injected leeches. Three-hundred microliter of 200 μM 5-HT were injected in both ablated and supraesophageal ganglion impaired leeches. (D) Time evolution of the mean size of the group joined by the injected leech under the same treatments described in (A,B). Blue trajectories refer to 5-HT injected leeches and sham-ablated, 5-HT injected leeches respectively, red trajectories refer to sham-ablated leeches, dorsal lip ablated leeches, while light green trajectories refer to dorsal lip ablated and supraesophageal ganglion impaired leeches, all injected with μl of 200 μM 5-HT. Student’s t-test, *p < 0.05.
Therefore we investigated the effect of the surgical removal of the dorsal lip sensilla visible in the light microscope (Figure 7B, red dashed line enclosing green dots). Sham ablations were done in the same way and a band of the dorsal skin adjacent to the lip organs was removed while leaving sensilla intact (Figure 7B, red dashed line not enclosing green dots). After ablation, leeches were allowed to recover for 1 day in water and exhibited a normal behavior with frequent episodes of swimming and crawling. After recovery from surgery, ablated, and sham-ablated leeches, injected with 300 μl of 200 μM 5-HT were tested. Ablated leeches, either 5-HT injected (N = 5) or not (N = 7), remained solitary (Figures 7C,D, see legend, Student’s t-test, *p < 0.05.), while not ablated (N = 8) and sham-ablated 5-HT injected leeches (N = 6) joined the other leeches (Figures 7C,D, see legend Student’s t-test, *p < 0.05.), indicating that group formation depended on the presence of intact sensilla.
It is possible to disconnect the supraesophageal ganglion from the leech central nervous system by cutting the neuronal projections from the supraesophageal to the subesophageal ganglion (Figure 7B, red vertical line). Leeches with a disconnected supraesophageal ganglion recovered from surgery and 1 day later they swam and crawled as intact leeches do. When these leeches were injected with 5-HT, they remained solitary and did not join and mixed with other leeches and behaved as intact leeches not injected with 5-HT (Student’s t-test, p < 0.05, N = 3).
Seasonal Variability
Deviations from an independent behavior and the formation of large groups of conspecifics were observed both in well-fed and hungry leeches. However, a careful examination of data collected over more than 2 years of experiments showed a seasonal variability: leeches received from the supplier (Ricarimpex, see Materials and Methods) in late spring or summer were more active and prone to social aggregation, while those received in winter did not move very much and appeared to be less “ sociable” and more solitary. Leeches supplied by Ricarimpex were kept outside and therefore were exposed to seasonal changes. We measured several properties of group formation mediating data over a time window of 3 months. In all our experiments the water temperature did not change more than 2°C, from winter to summer, and its average value was about 16°C.
The tendency to group formation was quantified by computing the average group size (Figure 8A), the average number of contacts established within 4 h (Figure 8B), the average velocity during the initial exploratory phase (Figure 8C) and the average number of moving leeches per minute (Figure 8D) when 10 leeches were in the observation tank (N = 62 experiments uniformly performed over 2 years). By using all four criteria, we observed a recurrent dependence between group formation and the season. Leeches were more prone to form large groups between May and September, corresponding to warm weather in continental Europe. During European winter, leeches were less active and more solitary. These results show that the transition from solitary to social behavior is a complex process, likely to depend on the overall state of the animals, also influenced by seasonal variations and possibly by the length of daylight.
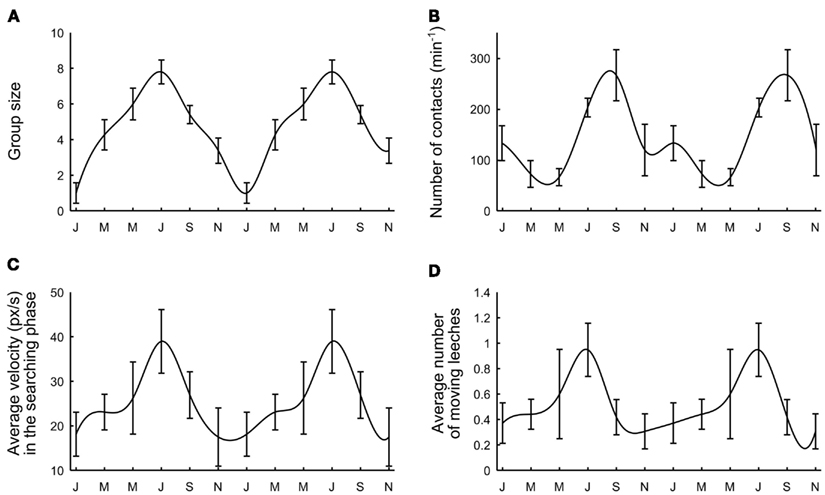
Figure 8. Seasonal variability. (A) Average group size. (B) Maximal number of contacts per minute reached after 1 h. (C) Average leech velocity. (D) Average number of moving leeches. Data were collected over 2 years and were averaged over periods of 3 months. Letters on the time axis indicate months (January, March, May, July, September, November). Smooth curves through the data drawn by eye.
Discussion
Group formation is an important aspect of social interactions (Sokolowski, 2010), occurring when conspecifics make collective decisions and adopt a similar behavior. Group formation can happen for different ethological reasons, but its dynamics – as we show in this study – can be similar in distant species such as leeches and humans (Stehlé et al., 2010; Zhao et al., 2011), when the population of leeches exceeds a critical value, they aggregate in large groups. Similar conspecifics aggregation has been observed in simple model systems, such as the worm C. elegans the fruit fly Drosophila (Sokolowski, 2010), in fish shoals (Makris et al., 2009), in locust swarms (Anstey et al., 2009) but also in higher primates and humans (Goodson and Thompson, 2010). Group formation in several species is not primarily caused by a mutual attraction among conspecifics but is produced by aggregation around abiotic factors, – in worms, for instance – as a response to oxygen levels (De Bono and Bargmann, 1998). Leeches are negative phototactic (Elliott, 1973; Sawyer, 1986b) and they tend to move away from a light source, therefore the observed group formation could have been simply their way to escape from the light and find a shelter among other leeches. When five or less leeches were placed in the observation tank of a given area they hardly noticed each other and their motion and behavior followed the pattern indicating independence with a high statistical significance (Bisson and Torre, 2011). When a higher number of leeches were placed in the same tank, a different dynamics was observed, difficult to reconcile with negative phototaxis. Similarly, group formation observed in a smaller number of leeches injected with 5-HT strongly indicated the emergence of social interactions, i.e., reciprocal attraction among conspecifics.
Similarly to what observed in locusts (Anstey et al., 2009), the hormone 5-HT participates in the onset and control of group formation. 5-HT plays a role similar to oxytocin, arginin, and vasopressin. These non-apeptides mediate social interactions and behavior in several species from invertebrates (Donaldson and Young, 2008) to rodents (Insel, 2010) and possibly also in humans (Goodson and Thompson, 2010). In humans, 5-HT is involved in mood regulation and its disruption is at the basis of several kinds of mood disorders (Chiao, 2010). The segmental ganglia of the leech contain a network of 5-HT releasing neurons (Lent and Frazer, 1977; De-Miguel and Trueta, 2005) modulating the swimming motor program (Ort et al., 1974; Kristan and Nusbaum, 1982; Friesen, 1989). These neurons are one pair of large Retzius cells, one pair of dorso-lateral (DL) and ventro-lateral (VL) interneurons, and two pairs of medial interneurons (cells E and M; Lent et al., 1991). 5-HT is known to influence social behavior and in particular social ranking in lobsters (Kravitz, 1988) and in crayfish (Yeh et al., 1996).
Neurobiological Mechanisms for Group Formation
Sensilla play a strategic role in chemoreception and several associated behaviors such as feeding (Dickinson and Lent, 1984; Elliott, 1984, 1986; Lent and Dickinson, 1984; Gaudry et al., 2010). The presence of conspecifics is detected by chemoreceptors located in the sensilla present in the dorsal lip and the associated neurobiological signal is transmitted through the supraesophageal ganglion to the central nervous system of the leech, where it promotes the increase of the intracellular level of 5-HT. Ablation experiments indicate a specific neurobiological pathway mediating the establishment of social interactions. Impairment of the dorsal lip or of the supraesophageal ganglion compromises conspecifics detection, as in fake group experiments (Bisson and Torre, 2011) and abolishes social attitude. There are many types of 5-HT receptors and several of them have been identified in the leech nervous system, where 5-HT can activate cationic channels, anionic channels, and affect its own reuptake (Calviño et al., 2005). Ketanserin blocking cationic 5-HT gated ionic channels 5-HT2A and 5-HT2C and mianserin blocking 5-HT gated ionic channels make leeches more solitary (Figure 6) suggesting 5-HT could promote group formation by activating the whole population of 5-HT receptors. As the body concentration of 5-HT in ganglia of gregarious leeches is by 37% larger than in solitary leeches we propose that social interactions occur because of an elevation of the body level of 5-HT.
Supraesophageal leech ganglia, similarly to all leech ganglia, have two large Retzius cells able to secrete 5-HT both from the soma and synaptic terminals (Sawyer, 1986a). Retzius neurons are the major serotonergic neurons in the leech central nervous system and indeed contain approximately half of the total concentration of 5-HT (Coggeshall et al., 1972). We speculate, therefore, that 5-HT released extrasynaptically from the soma of Retzius cells in the supraesophageal ganglion diffuse into the leech body and is the source of the measured elevation of 5-HT. 5-HT diffusing out of the release site will have a variety of actions, such as autoinhibition of 5-HT releasing Retzius cells (Cercós et al., 2009) and may also produce slow electrical responses, as happens in dopaminergic neurons (Sombers, 2009) and ultimately triggers group formation. The time course of group formation occurs in 1 h or so and therefore acts on a time scale more compatible with an extrasynaptic release of 5-HT (Bunin et al., 1998; Bunin and Wightman, 1999; De-Miguel and Trueta, 2005; Kaushalya et al., 2008).
Modeling Group Formation
During the analysis of leech aggregation, we observed that the lifetimes distribution of leech groups (Eq. 14 and Figures 3C,D) were very similar to those seen among humans (Stehlé et al., 2010; Zhao et al., 2011). Therefore, we decided to model group formation among leeches, on the basis of the reinforcement dynamics used to describe human social interactions (Stehlé et al., 2010; Zhao et al., 2011). We assumed that leech aggregation (Figure 3B) is determined primarily by transitions of the type
in which a single conspecific leaves or joins another group. As suggested by Figures 3C,D, the probability Dn(Δt) that an animal makes a transition and leaves a group of n conspecifics which has persisted for a time Δt is
This is the simplest and minimal hypothesis able to explain the distribution of lifetimes of Eq. 14. Eq. 14 indicates the existence of a reinforcement dynamics so that the longer a group lasts the less likely it is to split. The constants an and bn set the temporal scale of this reinforcement dynamics and the limit of this probability for Δt → 0.
This transition will be a merge with another random group with probability Dn(Δt) λ or a split with probability Dn(Δt) (1 − λ). In agreement with the presumed role of 5-HT (Figures 5 and 6) merges are promoted by the intra body concentration of 5-HT s, as
This expression assumes that the probability to merge with another group is an activated process modulated by the parameter λ reminiscent of Michaelis–Menten kinetics. Kmet sets the typical scale for s at which the activation process takes place. We assumed also that s increases when leeches encounter their conspecifics and that s is subsequently degraded. These assumptions are modeled as:
Where c1 is the rate at which 5-HT concentration increases for each group contact and c2 is the degradation constant.
From Eqs 3–5 – and the parameter values reported in the legend – we simulated the time evolution of the number of groups in the presence of 5 (Figure 9A) and 10 leeches (Figure 9C): the formation of a large group of conspecifics is observed for 10 leeches and not for 5 as experimentally observed (Figures 9B,D). Also the simulated time course of group size (Figures 9E,G) formation is in agreement with what experimentally observed (Figures 9F,H). The simple model reproduces qualitatively also the lifetime distribution of groups of conspecifics (Figures 9I–L). The essence of the reinforcement dynamics, leading to the formation of a large group with 10 but not with 5 leeches is contained in Eqs 4–5: the asymptotic rate of merges λ increases with the number of conspecifics, because the number of contacts is higher with a larger number of conspecifics (Figure 4).
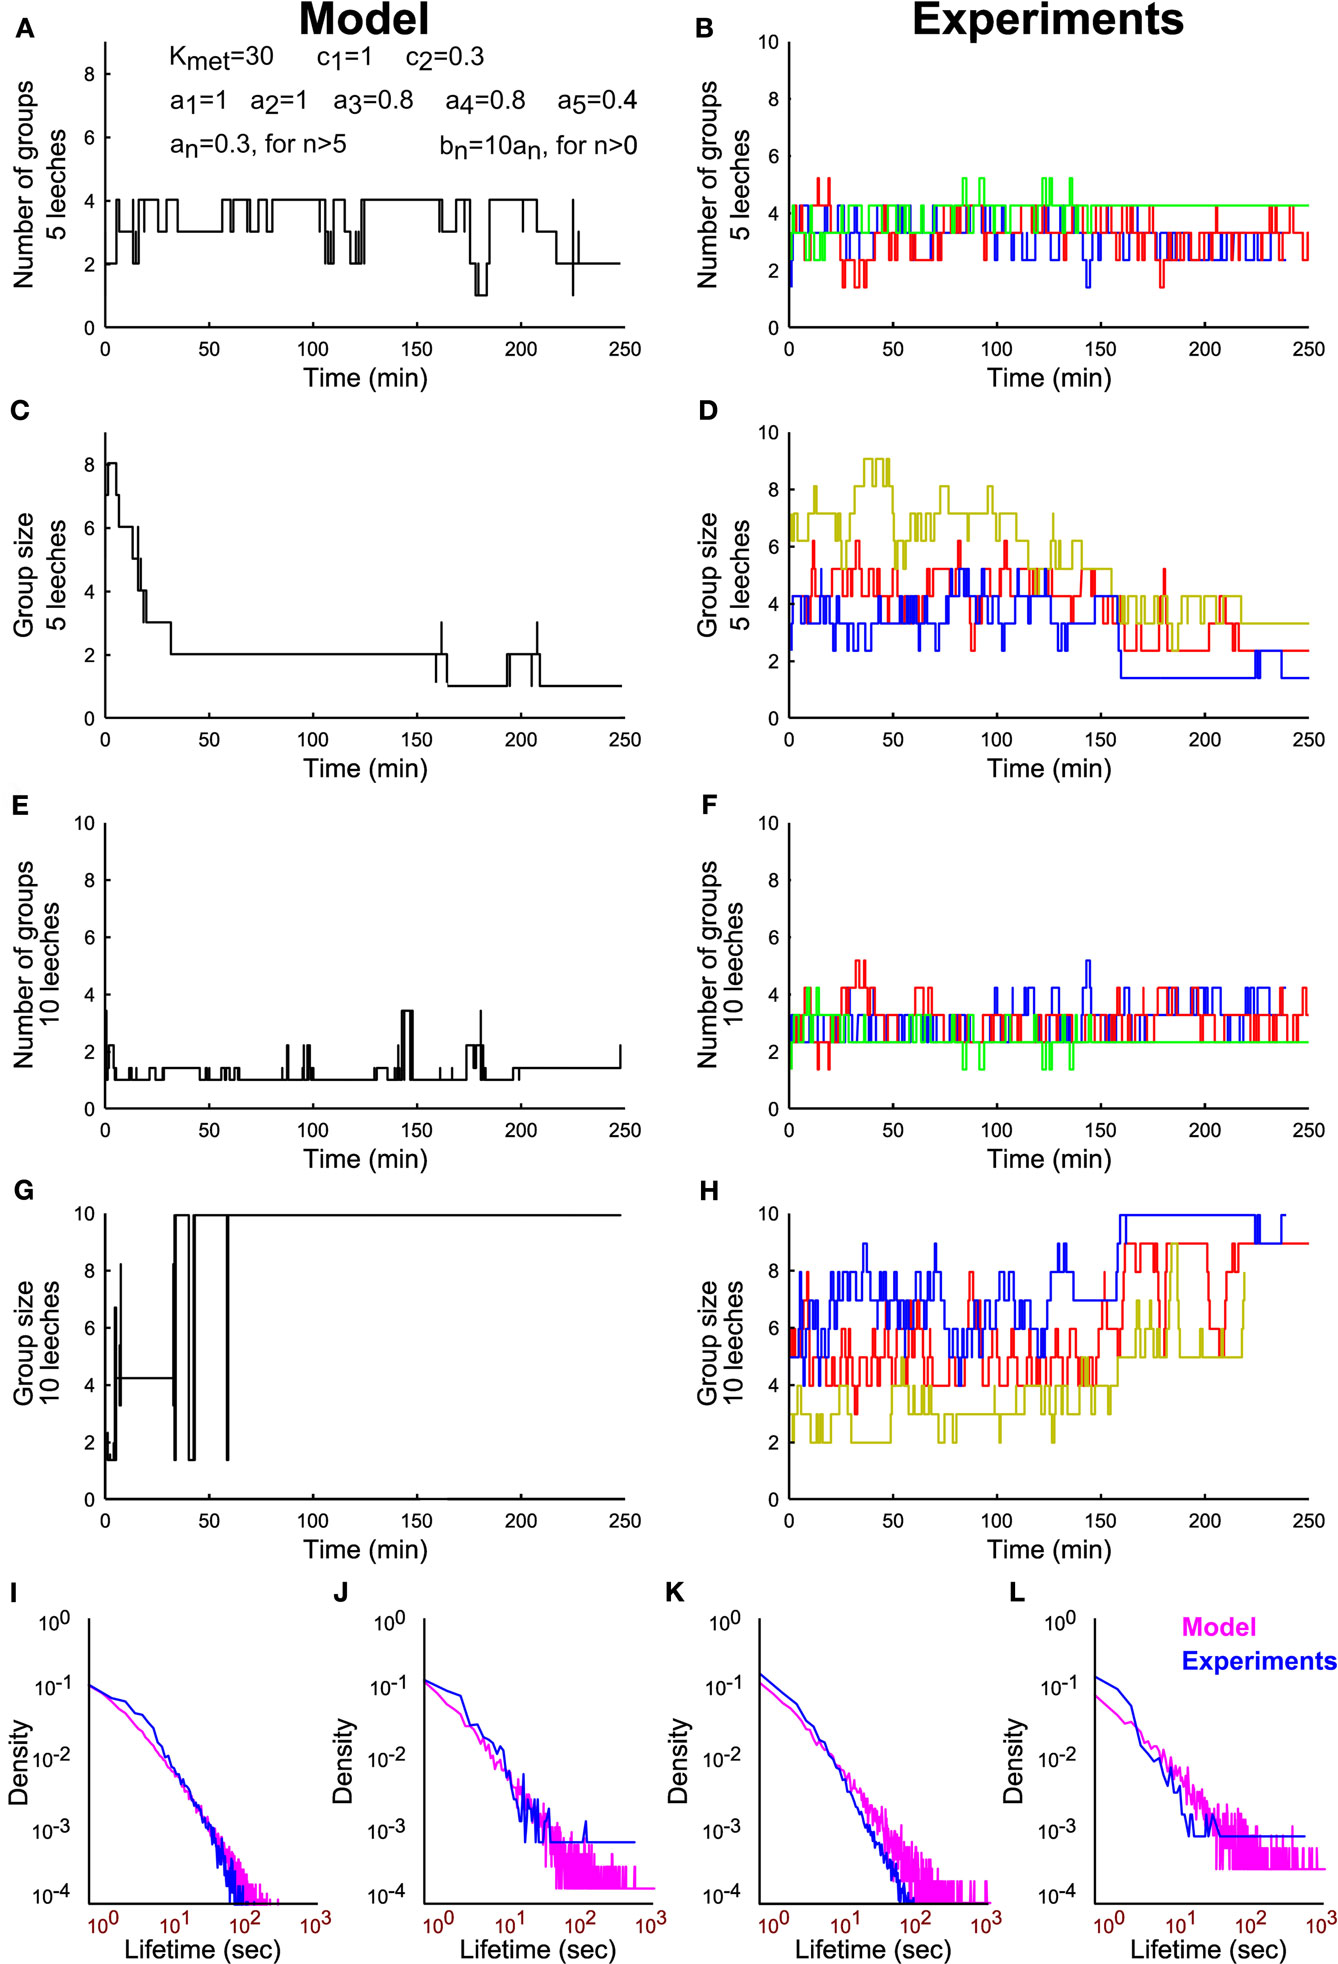
Figure 9. Modeling group formation in leeches and comparison with experimental data. (A) Time evolution of number of groups from a simulation of Eqs 3–5 with five leeches and using the parameters Kmet = 30; c1 = 1; c2 = 0.3; a1 = 1, a2 = 1, a3 = 0.8, a4 = 0.8, a5 = 0.4, and all other an = 0.3, bn = 10*an. (B) Time evolution of number of groups in three different experiments with five leeches. (C) Time evolution of the average group size from a simulation of Eqs 3–5 with five leeches. (D) Time evolution of the average group size in three different experiments with five leeches. (E–H) As in (A–D), but with 10 leeches. (I,J) Comparison of the lifetime distributions that result from experimental data (blue line) and simulated data (magenta line) for groups of size 1 (I) and 5 (J) in experiments with five leeches. (K,L) As in I–J but for groups of size 1 (K) and 10 (L) in experiments involving 10 leeches.
These results indicate that group formation is caused by a reinforcement dynamics that can be modeled by similar equations in different species, such as leeches and humans. The neuromodulator 5-HT promotes group formation in leeches and its involvement in interpersonal relationships among humans is well-established (Goodson and Thompson, 2010). Therefore group formation, important aspect of social interactions in leeches and in humans, share common dynamical properties and specific neuromodulators.
Conflict of Interest Statement
The authors declare that the research was conducted in the absence of any commercial or financial relationships that could be construed as a potential conflict of interest.
Acknowledgments
We are grateful to W. B. Kristan and K. French for giving us many helpful suggestions.
References
Ali, D. W., Catarsi, S., and Drapeau, P. (1998). Ionotropic and metabotropic activation of a neuronal chloride channel by serotonin and dopamine in the leech Hirudo medicinalis. J. Physiol. (Lond.) 509(Pt 1), 211–219.
Anstey, M. L., Rogers, S. M., Ott, S. R., Burrows, M., and Simpson, S. J. (2009). Serotonin mediates behavioral gregarization underlying swarm formation in desert locusts. Science 323, 627.
Ballerini, M., Cabibbo, N., Candelier, R., Cavagna, A., Cisbani, E., Giardina, I., Orlandi, A., Parisi, G., and Procaccini, A. (2008). Empirical investigation of starling flocks: a benchmark study in collective animal behaviour. Anim. Behav. 76, 201–215.
Barrat, A., Cattuto, C., Szomszor, M., Van den Broeck, W., and Alani, H. (2010). Social dynamics in conferences: analyses of data from the Live Social Semantics application. Semant. Web 2010, 17–33.
Bazazi, S., Buhl, J., Hale, J. J., Anstey, M. L., Sword, G. A., Simpson, S. J., and Couzin, I. D. (2008). Collective motion and cannibalism in locust migratory bands. Curr. Biol. 18, 735–739.
Bisson, G., and Torre, V. (2011). Statistical characterization of social interactions and collective behavior in medicinal leeches. J. Neurophysiol. 106, 78–90.
Blaxter, J. H. S., and Hunter, J. R. (1982). The biology of the clupeoid fishes. Adv. Mar. Biol. 20, 1–223.
Bruns, D., Engert, F., and Lux, H. D. (1993). A fast activating presynaptic reuptake current during serotonergic transmission in identified neurons of Hirudo. Neuron 10, 559–572.
Buhl, J., Sumpter, D. J. T., Couzin, I. D., Hale, J. J., Despland, E., Miller, E. R., and Simpson, S. J. (2006). From disorder to order in marching locusts. Science 312, 1402.
Bunin, M. A., Prioleau, C., Mailman, R. B., and Wightman, R. M. (1998). Release and uptake rates of 5-hydroxytryptamine in the dorsal raphe and substantia nigra reticulata of the rat brain. J. Neurochem. 70, 1077–1087.
Bunin, M. A., and Wightman, R. M. (1999). Paracrine neurotransmission in the CNS: involvement of 5-HT. Trends Neurosci. 22, 377–382.
Burrell, B. D., Sahley, C. L., and Muller, K. J. (2001). Non-associative learning and serotonin induce similar bi-directional changes in excitability of a neuron critical for learning in the medicinal leech. J. Neurosci. 21, 1401.
Calviño, M. A., Iscla, I. R., and Szczupak, L. (2005). Selective serotonin reuptake inhibitors induce spontaneous interneuronal activity in the leech nervous system. J. Neurophysiol. 93, 2644–2655.
Catarsi, S., and Drapeau, P. (1997). Requirement for tyrosine phosphatase during serotonergic neuromodulation by protein kinase C. J. Neurosci. 17, 5792–5797.
Cattuto, C., Barrat, A., Baldassarri, A., Schehr, G., and Loreto, V. (2009). Collective dynamics of social annotation. Proc. Natl. Acad. Sci. U.S.A. 106, 10511–10515.
Cattuto, C., Van den Broeck, W., Barrat, A., Colizza, V., Pinton, J. F., and Vespignani, A. (2010). Dynamics of person-to-person interactions from distributed RFID sensor networks. PLoS ONE 5, e11596. doi:10.1371/journal.pone.0011596
Cercós, M. G., De-Miguel, F. F., and Trueta, C. (2009). Real-time measurements of synaptic autoinhibition produced by serotonin release in cultured leech neurons. J. Neurophysiol. 102, 1075–1085.
Chiao, J. Y. (2010). Neural basis of social status hierarchy across species. Curr. Opin. Neurobiol. 20, 803–809.
Coggeshall, R. E., Dewhurst, S. A., Weinreich, D., and McCaman, R. E. (1972). Aromatic acid decarboxylase and choline acetylase activities in a single identified 5-HT containing cell of the leech. J. Neurobiol. 3, 259–265.
De Bono, M., and Bargmann, C. I. (1998). Natural variation in a neuropeptide Y receptor homolog modifies social behavior and food response in C. elegans. Cell 94, 679–689.
De-Miguel, F. F., and Trueta, C. (2005). Synaptic and extrasynaptic secretion of serotonin. Cell. Mol. Neurobiol. 25, 297–312.
Dickinson, M. H., and Lent, C. M. (1984). Feeding behavior of the medicinal leech, Hirudo medicinalis L. J. Comp. Physiol. A Neuroethol. Sens. Neural Behav. Physiol. 154, 449–455.
Donaldson, Z. R., and Young, L. J. (2008). Oxytocin, vasopressin, and the neurogenetics of sociality. Science 322, 900.
Elliott, E. J. (1986). Chemosensory stimuli in feeding behavior of the leech Hirudo medicinalis. J. Comp. Physiol. 159, 391–401.
Elliott, J. M. (1973). The diel activity pattern, drifting and food of the leech Erpobdella octoculata (L.) (Hirudinea: Erpobdellidae) in a lake district stream. J. Anim. Ecol. 42, 449–459.
Friesen, W. O. (1989). Neuronal control of leech swimming movements. J. Comp. Physiol. A Neuroethol. Sens. Neural Behav. Physiol. 166, 205–215.
Garcia-Perez, E., Mazzoni, A., Zoccolan, D., Robinson, H. P., and Torre, V. (2005). Statistics of decision making in the leech. J. Neurosci. 25, 2597.
Gaudry, Q., and Kristan, W. B. (2009). Behavioral choice by presynaptic inhibition of tactile sensory terminals. Nat. Neurosci. 12, 1450–1457.
Gaudry, Q., Ruiz, N., Huang, T., Kristan, W. B., and Kristan, W. B. (2010). Behavioral choice across leech species: chacun à son goût. J. Exp. Biol. 213, 1356–1365.
Goodson, J. L., and Thompson, R. R. (2010). Nonapeptide mechanisms of social cognition, behavior and species-specific social systems. Curr. Opin. Neurobiol. 20, 784–794.
Hearn, D., and Baker, M. P. (1997). Computer Graphics C Version, 2nd Edn. Upper Saddle River: Prentice Hall Press.
Hoare, D. J., Ruxton, G. D., Godin, J. G., and Krause, J. (2000). The social organization of free-ranging fish shoals. Oikos 89, 546–554.
Insel, T. R. (2010). The challenge of translation in social neuroscience: a review of oxytocin, vasopressin, and affiliative behavior. Neuron 65, 768–779.
Kaushalya, S., Desai, R., Arumugam, S., Ghosh, H., Balaji, J., and Maiti, S. (2008). Three-photon microscopy shows that somatic release can be a quantitatively significant component of serotonergic neurotransmission in the mammalian brain. J. Neurosci. Res. 86, 3469–3480.
Kravitz, E. A. (1988). Hormonal control of behavior: amines and the biasing of behavioral output in lobsters. Science 241, 1775.
Kristan, W. B., Calabreseb, R. L., and Friesen, W. O. (2005). Neuronal control of leech behavior. Prog. Neurobiol. 76, 279–327.
Kristan, W. B., and Nusbaum, M. P. (1982). The dual role of serotonin in leech swimming. J. Physiol. (Paris) 78, 743–747.
Lent, C., Zundel, D., Freedman, E., and Groome, J. (1991). Serotonin in the leech central nervous system: anatomical correlates and behavioral effects. J. Comp. Physiol. A Neuroethol. Sens. Neural Behav. Physiol. 168, 191–200.
Lent, C. M., and Dickinson, M. H. (1984). Serotonin integrates the feeding behavior of the medicinal leech. J. Comp. Physiol. A Neuroethol. Sens. Neural Behav. Physiol. 154, 457–471.
Lent, C. M., and Frazer, B. M. (1977). Connectivity of the monoamine-containing neurones in central nervous system of leech. Nature 266, 844–847.
Macagno, E. R. (1980). Number and distribution of neurons in leech segmental ganglia. J. Comp. Neurol. 190, 283–302.
Makris, N. C., Ratilal, P., Jagannathan, S., Gong, Z., Andrews, M., Bertsatos, I., Godo, O. R., Nero, R. W., and Jech, J. M. (2009). Critical population density triggers rapid formation of vast oceanic fish shoals. Science 323, 1734.
Mar, A., and Drapeau, P. (1996). Modulation of conduction block in leech mechanosensory neurons. J. Neurosci. 16, 4335.
Mazzoni, A., Garcia-Perez, E., Zoccolan, D., Graziosi, S., and Torre, V. (2005). Quantitative characterization and classification of leech behavior. J. Neurophysiol. 93, 580.
Muller, K. J., Nicholls, J. G., and Stent, G. S. (1981). Neurobiology of the Leech. Cold Spring Harbor, NY: Cold Spring Harbor Laboratory.
Nagy, M., Ákos, Z., Biro, D., and Vicsek, T. (2010). Hierarchical group dynamics in pigeon flocks. Nature 464, 890–893.
Ort, C. A., Kristan, W. B., and Stent, G. S. (1974). Neuronal control of swimming in the medicinal leech. J. Comp. Physiol. A Neuroethol. Sens. Neural Behav. Physiol. 94, 121–154.
Puhl, J. G., and Mesce, K. A. (2008). Dopamine activates the motor pattern for crawling in the medicinal leech. J. Neurosci. 28, 4192–4200.
Sanchez-Armass, S., Merz, D. C., and Drapeau, P. (1991). Distinct receptors, second messengers and conductances underlying the dual responses to serotonin in an identified leech neurone. J. Exp. Biol. 155, 531–547.
Sawyer, R. T. (1986a). Leech Biology and Behaviour: Anatomy, Physiology and Behaviour, Vol. I. Oxford: Oxford University Press.
Sawyer, R. T. (1986b). Leech Biology and Behaviour: Feeding Biology, Ecology, and Systematics, Vol. II. Oxford: Oxford University Press.
Sombers, L. A., Beyene, M., Carelli, R. M., and Wightman, R. M. (2009). Synaptic overflow of dopamine in the nucleus accumbens arises from neuronal activity in the ventral tegmental area. J. Neuroscicv. 29, 1735–1742.
Stehlé, J., Barrat, A., and Bianconi, G. (2010). Dynamical and bursty interactions in social networks. Phys. Rev. E 81, 035101.
Wenning, A., and Meyer, E. P. (2007). Hemodynamics in the leech: blood flow in two hearts switching between two constriction patterns. J. Exp. Biol. 210, 2627–2636.
Willard, A. L. (1981). Effects of serotonin on the generation of the motor program for swimming by the medicinal leech. J. Neurosci. 1, 936–944.
Yeh, S. R., Fricke, R. A., and Edwards, D. H. (1996). The effect of social experience on serotonergic modulation of the escape circuit of crayfish. Science 271, 366.
Keywords: serotonin, leech nervous system, social behavior, extrasynaptic release
Citation: Bisson G, Bianconi G and Torre V (2012) The dynamics of group formation among leeches. Front. Physio. 3:133. doi: 10.3389/fphys.2012.00133
Received: 06 March 2012; Paper pending published: 23 March 2012;
Accepted: 21 April 2012; Published online: 17 May 2012.
Edited by:
Francisco Fernandez De-Miguel, Universidad Nacional Autonoma de Mexico, MexicoReviewed by:
Hai Huang, Oregon Health and Science University, USAEnrique Hernandez-Lemus, National Institute of Genomic Medicine, Mexico
Copyright: © 2012 Bisson, Bianconi and Torre. This is an open-access article distributed under the terms of the Creative Commons Attribution Non Commercial License, which permits non-commercial use, distribution, and reproduction in other forums, provided the original authors and source are credited.
*Correspondence: Vincent Torre, Neurobiology Sector, Scuola Internazionale Superiore di Studi Avanzati, Via Bonomea 265, 34136 Trieste, Italy. e-mail: torre@sissa.it