Optophysiological analysis of associational circuits in the olfactory cortex
- Department of Molecular and Cellular Biology, Center for Brain Science, Harvard University, Cambridge, MA, USA
Primary olfactory cortical areas receive direct input from the olfactory bulb, but also have extensive associational connections that have been mainly studied with classical anatomical methods. Here, we shed light on the functional properties of associational connections in the anterior and posterior piriform cortices (aPC and pPC) using optophysiological methods. We found that the aPC receives dense functional connections from the anterior olfactory nucleus (AON), a major hub in olfactory cortical circuits. The local recurrent connectivity within the aPC, long invoked in cortical autoassociative models, is sparse and weak. By contrast, the pPC receives negligible input from the AON, but has dense connections from the aPC as well as more local recurrent connections than the aPC. Finally, there are negligible functional connections from the pPC to aPC. Our study provides a circuit basis for a more sensory role for the aPC in odor processing and an associative role for the pPC.
Introduction
The olfactory cortex is a collection of brain regions that receive direct input from the olfactory bulb (OB), and includes the anterior and posterior piriform cortices (aPC and pPC), anterior olfactory nucleus (AON), olfactory tubercle, entorhinal cortex, dorsal peduncular cortex, ventral tenia tecta, and cortical areas associated with the amygdala (Luskin and Price, 1983b; Haberly, 1998). Sensory information from the OB reaches the primary olfactory cortical areas through the lateral olfactory tract (LOT), made up of mitral/tufted cell axons. In addition to direct sensory input, olfactory cortical neurons also receive extensive associational inputs arising from recurrent local connections as well as connections from other regions of the olfactory areas (Haberly, 1998; Isaacson, 2010). These associational connections are thought to allow the integration of information from multiple odor cues, other sensory modalities, and past experience (Haberly, 1998, 2001; Isaacson, 2010).
The AON, which has many features of a cortical area, is at the hub of the inter-areal connection diagram, processing information from both hemispheres (Brunjes et al., 2005). It receives direct sensory inputs from the ipsilateral OB, and associational inputs from other olfactory cortical areas, including the contralateral AON and the PC of both hemispheres. The PC, a 3 layer paleocortex, receives ipsilateral input directly from the OB, as well as bilateral indirect input from the AON. These and other extensive connections have been studied in classic tracer experiments in many species (Haberly and Price, 1978; Luskin and Price, 1983b; Piredda and Gale, 1985; Behan and Haberly, 1999; Ekstrand et al., 2001; Neville and Haberly, 2004), but information at the level of cellular connectivity remains scarce (Franks and Isaacson, 2005; Wiegand et al., 2011). Modern molecular biological and viral techniques promise to yield more information on the identities of the originating and target cell types (Yan et al., 2008).
Unraveling the detailed circuitry of these interconnections, and their roles in odor-evoked responses, is vital for understanding how odors are recognized and how they are used by the animal to guide its behavior. However, the synaptic properties of the different associational projections have not been characterized, in part due to their extensive anatomic mixing and the consequent difficulty in selectively activating the different axons. Recent advances in optogenetics (Petreanu et al., 2007; Wang et al., 2007; Zhang et al., 2007) allow us to selectively label specific groups of neurons and to activate only the synapses made by those neurons. In addition, functional connectivity can also be investigated efficiently using optophysiological methods involving calcium imaging (Kozloski et al., 2001; Sasaki et al., 2009; Takahashi et al., 2010).
In this study, we applied a combination of optogenetics, calcium imaging, and electrophysiology to examine the connections between the AON and the PC, as well as within the PC. We have uncovered striking differences in the afferent and intrinsic connectivity between the two major subdivision of the PC—the aPC and pPC.
Materials and Methods
All procedures were performed using approved protocols in accordance with institutional (Harvard University Institutional Animal Care and Use Committee) and national guidelines.
Virus Injections for Anatomical Studies
For anatomical studies, adult C57BL/6 mice (Charles River) were anesthetized with a Ketamine (130 mg/kg i.p.; Webster)/Xylazine (13 mg/kg, i.p.; Webster) mixture and set on a mouse stereotactic frame. A small craniotomy was made over the prefrontal cortex with a dental drill. Adeno-associated virus (AAV2; 50 nl) to express ChR2-EYFP (serotype 2/1 kindly provided by Karel Svoboda and serotype 2/9 purchased from Penn Vector Core), was stereotactically injected into the AON (stereotactic coordinates: 1.25 mm to lateral, 3 mm to anterior from Bregma, and depth = 3.5 mm) through a glass micropipette attached to a nanoinjector (MO-10, Narishige).
Three to twelve weeks after the surgery, virus-injected mice were deeply anesthetized again with a Ketamine (200 mg/kg i.p.)/Xylazine (20 mg/kg, i.p.) mixture and perfused transcardially with 20 ml of PBS (pH 7.4) first, followed by 50 ml of 4% paraformaldehyde and 10% picric acid in 0.1 M phosphate buffer (pH 7.4). Brains were removed and cut into 100 μm-thick sagittal sections. For immunohistochemistry, sections were permeabilized and blocked with a solution containing 0.1% Triton X-100 (Tx, Fisher), 0.5% carrageenan (Sigma), and 2.5% goat serum in PBS for 1 h, and incubated overnight with primary antibody against calretinin (CR, 1/2000; SWANT) in blocking solution. Calretinin has been known as a marker for mitral cell axons as well as inhibitory neurons, both in the olfactory bulb and forebrain cortices (Wouterlood and Hrtig, 1995). A secondary anti-mouse antibody conjugated with Alexa-568 (1/500; Invitrogen) was applied for 2 h in 0.1% PBS-Tx. Sections were imaged with a confocal microscope (LSM 510, Zeiss).
Virus Injections for Electrophysiology
For electrophysiology, AAV2 for expression of ChR2-EYFP was injected into Sprague Dawley rat pups (P5-7). Pups were anesthetized with a Ketamine (35 mg/kg i.p.)/Xylazine (4 mg/kg, i.p.) mixture and placed in a stereotactic apparatus. A small craniotomy over the prefrontal cortex was made and viral solution was injected into the AON (coordinates: 1.5 mm to lateral, 3.8 and 4.2 mm to anterior from Bregma, and depth = 4 mm) or into the aPC (coordinates: 2.5 mm to lateral, 2.6 mm to anterior from Bregma, and depth = 4 mm). In the case of AON injections, we injected 50 nl of AAV at two locations (total 100 nl) to span the full extent of AON. For the injection into the aPC, we used 50 nl of AAV at a single position to facilitate the study of intrinsic connections of the aPC.
Acute slices (300 μm) of the PC or AON were prepared from control and virus-injected rats (P16–25) using standard procedures (Franks and Isaacson, 2005; Tyler et al., 2007). Briefly, parasagittal sections were cut along the LOT in ice-cold artificial CSF (ACSF) containing (in mM) 83 NaCl, 2.5 KCl, 3.3 MgSO4, 1 NaH2PO4, 26.2 NaHCO3, 22 glucose, 72 sucrose, and 0.5 CaCl2, and equilibrated with 95% O2/5% CO2. Slices were transferred to a recording chamber and continuously perfused with normal ACSF containing (in mM) 119 NaCl, 2.5 KCl, 1.3 MgSO4, 1 NaH2PO4, 26.2 NaHCO3, 22 glucose, and 2.5 CaCl2 equilibrated with 95% O2/5% CO2 at room temperature. Patch electrodes (3–5 MΩ) contained (in mM) 130 D-gluconic acid, 130 CsOH, 5 NaCl, 10 HEPES, 12 phosphocreatine, 3 MgATP, 0.2 NaGTP, 1EGTA, and 5 mg/ml biocytin (Franks and Isaacson, 2005). For current clamp recordings, we used a KCl based internal solution containing (in mM) 130 KCl, 10 HEPES, 10 phosphocreatine, 3 MgATP, 0.5 NaGTP, 0.2 EGTA, and 2.5 glutamate. Responses were recorded with an Axopatch 200B amplifier (Molecular Devices), filtered at 2 kHz, and digitized at 10 kHz using custom-written acquisition software in Igor (courtesy of Bernardo Sabatini).
After recording, slices were fixed overnight in 4% paraformaldehyde in PBS at 4°C. To identify the recorded cells, biocytin was reacted to streptavidin conjugated with Alexa-594 (Invitrogen) in 0.1% PBS-Tx overnight. Samples were imaged with a Zeiss LSM 510 confocal microscope. The fluorescence intensity of confocal images was analyzed by image processing in Igor Pro. Normalized intensities were summarized as mean ± SEM from three different animals.
Physiological Recordings with Electrical or Optical Stimulation
The two different projections into the PC, the afferent from the LOT and associational fibers, were electrically (6–15 V, 0.03 ms duration) stimulated using a concentric bipolar electrode (CBAPC75, FHC Inc.). To examine the input from the OB to PC, the LOT was stimulated and recordings obtained in the presence of the GABAB receptor agonist baclofen (50 μM, Tocris) to block contamination from associational pathways (Tang and Hasselmo, 1994). The associational pathway was stimulated by positioning the electrode in layer 3 of the PC. For the electrical stimulation experiments, we added the GABAA receptor blocker picrotoxin (PTX, 0.1 mM, Tocris) in the ACSF to block inhibitory responses. AMPA receptor-mediated EPSCs were recorded in layer 2 pyramidal cells by holding them at –70 mV, and mixed AMPA and NMDA receptor-mediated EPSCs recorded at +40 mV.
ChR2 was activated in the entire optical field of view using a custom-built LED-based illuminator (Albeanu et al., 2008; Campagnola et al., 2008; Ghezzi et al., 2008; Sato and Murthy, 2010). A high-powered blue LED (CBT-120B, Luminus Devices Inc.) was coupled to large diameter plastic fibers (NT53-833, Edmund Optics Inc.) to transmit light to the rear lamp-housing of an Olympus BX50WI upright microscope. The electronic control circuitry consisted of a variable current source and a transistor switch circuit to provide microsecond timing control. PTX was used to block GABAA-mediated currents for all experiments reported here, except for those in Figures 1C and 2D. To isolate monosynaptic inputs from ChR2-expressing axons, we added tetrodotoxin (TTX, 1 μM, Tocris) and 4-aminopyridine (4-AP, 100 μM, Tocris) with PTX to the ACSF.
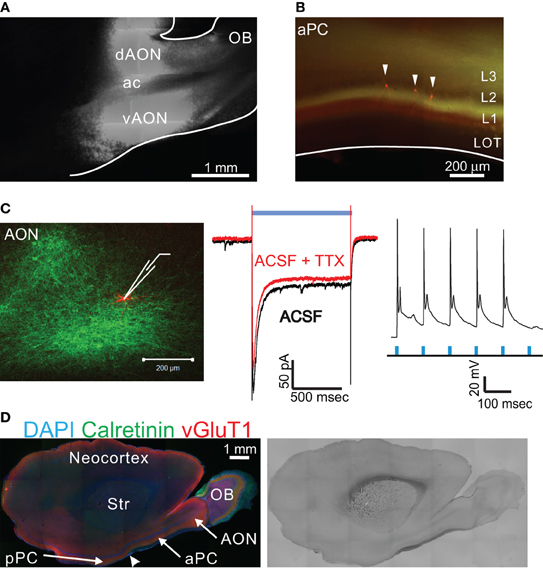
Figure 1. ChR2 expression in AON neurons by virus injection. (A,B) Adeno-associated virus (AAV) designed to express ChR2-EYFP was injected into the rat AON. The strong EYFP signal in the dAON and vAON comes from the expression of ChR2-EYFP in the soma and dendrites of neurons at the injection site. Fluorescence signal was seen coursing into several cortical areas, including the aPC (B). White arrowheads indicate 3 neurons filled with biocytin during electrophysiological recordings. OB, olfactory bulb; dAON, dorsal part of anterior olfactory nucleus; vAON, ventral part of anterior olfactory nucleus; ac, anterior commissure; aPC, anterior piriform cortex; LOT, lateral olfactory tract. (C) Patch-clamp recording from an AON neuron showing a typical adapting ChR2 response to blue light stimulation. The response was largely intact after application of TTX (middle). In current clamp mode, repeated brief light stimulation can evoke multiple action potentials (10 Hz, flash width 1 ms, right). (D) P21 rat brain section in the same angle as that used in the physiological experiments, showing the location of AON, aPC, and pPC. The boundary between aPC and pPC, where the thickness of the LOT decreases dramatically, is indicated by an arrowhead Str - striatum.
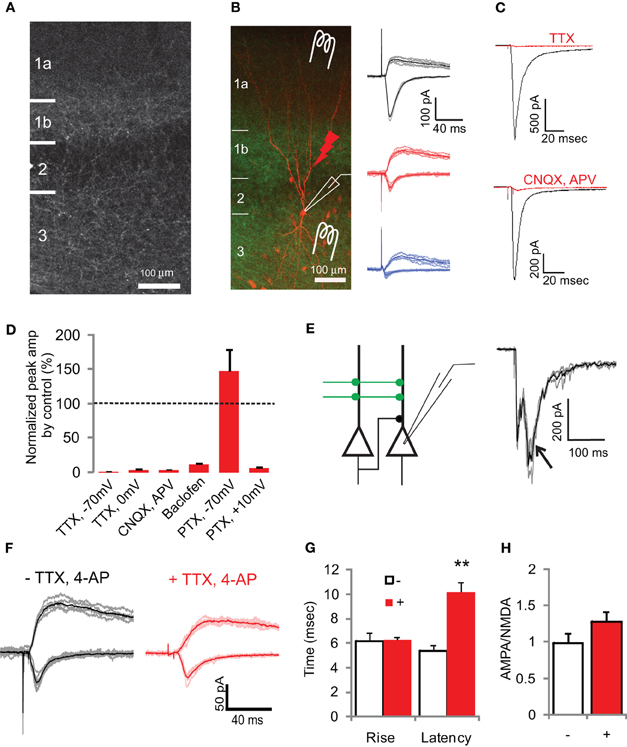
Figure 2. Light-evoked EPSCs at AON to aPC synapses. (A) ChR2-EYFP expressing axon fibers from the AON projecting to the aPC with AAV injection into the AON of a rat pup (P6). Fluorescence intensity was high in layer 1b where most of the associational fibers are found, but there were also labeled fibers in layer 2/3 and layer 1a. (B) A recorded pyramidal cell was visualized using biocytin, with its soma in layer 2, and apical and basal dendrites in layer 1 and layer 3 respectively (left). The green signal is from ChR2-EYFP positive axon fibers from the AON. Other red somata result from background staining due to dye leakage from patch pipettes. Schematic of a pyramidal cell with three different ways of stimulation and examples of synaptic responses. LOT and associational fibers were electrically stimulated with a concentric bipolar electrode placed in the LOT or layer 2/3 respectively. ChR2 positive axon fibers from AON were activated by a 5 ms blue LED flash using a 40 × objective lens. Traces show examples of synaptic responses from the different stimulation protocols (right): LOT electrode (black), associational electrode (blue), and associational LED (red). EPSCs were detected as inward currents at −70 mV and outward currents at +40 mV. Traces are the superposition of five individual trials as well as the average response (thick lines). ACSF contained picrotoxin (PTX) to block inhibitory currents. (C) Inward current recordings from a pyramidal cell at −70 mV evoked with 5 ms blue LED light stimulation without any drugs (black traces). Application of a sodium channel blocker (TTX) suppressed the current to 0.8% (top). Addition of AMPA and NMDA receptor antagonists (CNQX and APV) blocked the inward current to 3.6% (bottom). (D) Results of experiments with various synaptic blockers, with the control responses for each set of experiments set to 100%. PTX refers to picrotoxin. Error bars are SEM. (E) Schematic diagram of the source of multisynaptic responses; AON projections to the PC are indicated by green lines. The recorded pyramidal cell receives not only light-evoked monosynaptic input but also intrinsic input from neighbor pyramidal cells, which also receive ChR2-positive synaptic input. If expression of ChR2 is high, neighboring pyramidal cells could fire action potentials and give rise to disynaptic inputs to the recorded pyramidal cell (left). Typical examples of multisynaptic responses (right, arrow). Three trials from one cell are superimposed (gray) with the average trace (black). (F) Pharmacological isolation of monosynaptic input from the AON to PC. Light-evoked EPSCs with or without TTX and 4-AP show AMPA receptor-mediated inward current at −70 mV, and AMPA and NMDA receptor-mediated outward current at +40 mV. Application of TTX, 4-AP, and PTX reduced the peak amplitude to 50.6%. (G,H) Summary of the data with (+) and without (−) TTX and 4-AP. Rise time is the same, while latency is longer in the case of TTX and 4-AP (**p < 0.01, G). The AMPA:NMDA ratios were not significantly different (H).
Calcium Imaging
Calcium imaging experiments were performed in combined olfactory bulb—piriform cortex parasagittal brain slices of 3–4 week old rats. Slices were prepared in ice-cold artificial CSF (aCSF) containing (in mM) 83 NaCl, 2.5 KCl, 3.3 MgSO4, 1 NaH2PO4, 26.2 NaHCO3, 22 glucose, 72 sucrose, and 0.5 CaCl2, and equilibrated with 95% O2/5% CO2. Slices were allowed to recover for 20 min at 37°C and at room temperature (21–23°C) thereafter. Cells in the olfactory cortex were labeled with the AM ester form of Oregon Green BAPTA-1 (OGB-1-AM, Invitrogen) by ejecting a small volume of dye-containing solution (OGB-1-AM in 0.02% Pluronic F-127, Invitrogen) from a glass pipette (∼2 μm tip) at the surface of the slice maintained at 34°C. Slices were incubated for ∼1 h to allow de-esterification and labeling of cells. During recording, we increased the extracellular K+ concentration to 7.5 mM to increase the excitability of neurons and permit suprathreshold responses during single cell synaptic stimulation. Images were acquired with an Olympus BX51 microscope using a 40X lens and a high speed CCD camera system (CCD-1300, Vosskühler). A demagnifying lens was placed between the objective and the camera to increase the field of view to approximately 300 × 250 μm. Custom-written software in Labview (National Instruments) allowed us to acquire images at 20 Hz at a pixel resolution of ∼0.5 μm (in the image plane). Two seconds of data were acquired before and after stimulation, totaling 80 frames. A single neuron was chosen for patching in transmitted light imaging mode, and whole-cell patch-clamp recordings were obtained using methods described above. During imaging, five action potentials were elicited at 20 Hz in the recorded neuron. Online feedback was provided by displaying a DF/F image (10 frames immediately after stimulus −10 frames immediately before stimulus, divided by prestimulus average). Two trials were recorded for each neuron.
Data Analysis
Electrophysiology
The recorded data were analyzed using NeuroMatic in Igor Pro. We used the peak amplitudes of synaptic currents recorded at −70 mV to characterize AMPA EPSCs, and the amplitude at 50 ms in currents recorded at +40 mV to estimate the contribution of NMDA to EPSCs (AMPA currents are negligible at this time point). Summary data are reported as mean ± SEM.
Imaging
Images were analyzed using custom-written routines in MATLAB (Mathworks). Images were flattened first to ensure homogeneous illumination. In initial analysis, cell bodies were identified by automatic segmentation algorithms (built-in functions in MATLAB or downloaded from online libraries). However, since automated segmentation typically missed many fainter cell bodies, we chose to identify cells by eye using just the resting fluorescence. Fluorescence changes in regions of interest identified as cell bodies were calculated and responses analyzed as follows. Responses were calculated as differences between average fluorescence intensity in 10 frames following stimulation and 10 frames immediately before stimulation, divided by the standard deviation of baseline fluorescence (Figure 7B). Control values for each ROI were also calculated using baseline frames (Figure 7B). For each experiment, the distribution of fluorescence changes for >150 cells was obtained for responses and controls. The control distribution could be fitted to a single Gaussian function, and any cell whose fluorescence change exceeded 3 standard deviations from the mean of the control Gaussian was deemed to be responsive. The threshold for responsive cells was varied in some experiments to ensure our conclusions were robust. This entire procedure was automated in MATLAB.
Results
CHR2 Expression in AON Neurons by Virus Injection
We began by investigating the properties of associational connections between the AON and the PC. The AON receives direct input from the OB and projects bilaterally to the PC (Haberly, 1998). We characterized expression of ChR2 a few weeks after injection of adeno-associated virus (AAV2) carrying the gene for ChR2-EYFP into the AON of postnatal 5–7 day old rats. Strong expression of ChR2 in the soma and dendrites of AON neurons was observed, as well as in axons leaving the area (Figure 1A). Although retrograde axonal transport has been reported for certain types of AAV viruses (Mazarakis et al., 2001; Zheng et al., 2010), we detected no labeled mitral cells in the OB with the injection of AAV into the AON. Occasional accidental labeling of migrating newborn neurons in the rostral migratory stream (RMS), which is close to the AON, resulted in the labeling of a few newborn granule and periglomerular cells in the OB. These cells have only local inhibitory connections in the OB and no axonal projections to the olfactory cortex (Haberly, 1998).
To confirm functional expression of ChR2, we obtained whole-cell patch-clamp recordings from AON neurons in acute slices. Neurons in the injected area showed characteristic inward currents when stimulated with blue light, with a rapid onset and partial inactivation (Figure 1C) (Boyden et al., 2005; Ishizuka et al., 2006; Wang et al., 2007; Zhang et al., 2007). In the recording illustrated in Figure 1C (middle), most of the current recorded under voltage clamp at −70 mV was through ChR2 itself, since addition of TTX (to block evoked synaptic activity) diminished the peak and steady state responses by less than 20% (Figure 1C, middle). In current clamp, light stimulation induced action potentials in ChR2-expressing cells, which could be reliably entrained at 10 Hz (Figure 1C, right).
Anatomy of Projections from the AON to The PC
Axons of virally infected AON neurons could be visualized by their EYFP fluorescence and were seen coursing into several cortical areas, including the olfactory tubercle and the PC (Figure 1B). Consistent with previous studies (Luskin and Price, 1983a,b), ChR2-EYFP expressing axons were found in all layers of the PC except the LOT, with notably higher density in layer 1b (Figures 1B and 2A). Unexpectedly, some EYFP-positive fibers were detected in layer 1a of the PC, which is thought to contain only inputs from the OB (Haberly, 1998). These layer 1a fibers could be mitral cell axons accidentally labeled during AAV injection into the AON, for example via retrograde labeling of mitral cells. To test this possibility, we injected the same virus into the OB. Despite very strong expression of ChR2-EYFP in the injection area, very few mitral cells could be labeled and only a few fibers were detected in the LOT (Appendix Figure A1). This result indicated that AAV2/9 infects mitral cells with a very low probability that is not enough to account for the labeling found in layer 1a after AON injection. An additional point is that after infection by direct OB injection, mitral cell axons were clearly visible in the LOT and collaterals arose perpendicular to layer 1a (Appendix Figure A1D). This is in contrast to the horizontal pattern of axonal innervation in layer 1a after AON injection, with no labeling in the LOT (Figure 2A). Since we detected no ChR2-EYFP positive mitral cells and no axon fibers projecting in the LOT after AAV injection into the AON, we concluded that no retrograde labeling of mitral cells occurred in our study and that the axons found in layer 1a were in fact from AON neurons. Interestingly, the presence of putative associational fibers in layer 1a has been noted in some early studies using classical Timm staining methods (Friedman and Price, 1984).
Properties of Light-Evoked EPSCs at AON → PC synapses
We next characterized the functional properties of synapses made by axons of AON neurons using whole-cell patch recording from PC neurons (Figure 2). At −70 mV, whole-field light stimulation evoked fast inward currents similar to those evoked by electrical stimulation of the LOT or associational fibers (Franks and Isaacson, 2005) (Figure 2B). At +40 mV, where the magnesium block of NMDA receptors is relieved, outward currents had a slower time course (Figure 2B). Light-evoked responses were completely blocked by the sodium channel blocker TTX (1 μM) (Figures 2C,D), suggesting that the responses were synaptic. This was confirmed by the application of AMPA and NMDA receptor antagonists (10 μM, CNQX, and 25 μM, DL-AP5), which reduced light-evoked inward currents to 3.60 ± 0.14% (Figures 2C,D). These experiments indicate that light-evoked synaptic responses of the AON to PC projections were mediated by both AMPA and NMDA receptors.
Light-evoked responses of AON → aPC synapses had rise times that were similar to EPSCs evoked by electrical stimulation of associational fibers, but distinct from those of EPSCs evoked by LOT stimulation (association LED, 6.69 ± 0.65 ms, n = 8 vs. association electrode, 5.70 ± 0.47 ms, n = 8, p = 0.24. Student's t-test; LOT electrode, 8.21 ± 0.66 ms, n = 9, p < 0.01 for comparisons between association and LOT electrical stimulation by t-test). The EPSC latency was longer with photostimulation than with electrical stimulation (association LED, 5.28 ± 0.36 ms, n = 8; association electrode, 3.17 ± 0.18 ms, n = 8; p < 0.01, t-test), presumably because of the time it takes to depolarize axons to threshold by current through ChR2. Paired-pulse stimulation of associational inputs with light revealed similar modulation as that seen with electrical stimulation (association electrode paired-pulse ratio, PPR = 0.85 ± 0.1, n = 8; association LED PPR = 0.97 ± 0.06, n = 8; 500 ms inter-stimulus interval). However, this result should be interpreted with caution since paired responses reflect ChR2 inactivation (Lin et al., 2009) in addition to synaptic plasticity. Association inputs are known to be selectively suppressed by GABAB receptor agonists (Tang and Hasselmo, 1994), and accordingly we found that light evoked EPSCs were largely blocked by baclofen (11.6 ± 1.6%, Figure 2D).
Association inputs to pyramidal cells in the PC have a lower AMPA:NMDA ratio than inputs from the LOT (Franks and Isaacson, 2005). Neurons were held at −70 mV to measure the contribution of AMPA current, and then at +40 mV to measure the mixture of both AMPA and NMDA currents triggered by electrical or light stimulation. The AMPA:NMDA ratio was operationally calculated from the peak amplitude at −70 mV for AMPA and the amplitude measured 50 ms after the response at +40 mV for NMDA, a time by which AMPA currents have decayed to zero (Poncer and Malinow, 2001; Lee et al., 2010). Consistent with previous reports (Franks and Isaacson, 2005), the AMPA:NMDA ratio was significantly higher for synapses made by LOT axons than for associational synapses when stimulation was through electrodes (LOT electrode, 3.48 ± 0.69, n = 9 vs. association electrode, 0.988 ± 0.48, n = 4, p < 0.01, t-test). The ratio with photostimulation was similar to that with electrical stimulation of associational inputs (association LED, 0.987 ± 0.13, n = 6 vs. association electrode, p = 1.0, t-test).
Our results indicate that selective stimulation of AON inputs by whole-field light stimulation evokes synaptic currents that are very similar to those evoked by electrical stimulation of associational inputs.
Monosynaptic Inputs from the AON to the PC
The activation of ChR2-expressing axons projecting from the AON to PC often led to generation of action potentials in monosynaptically connected pyramidal cells. Therefore, EPSCs evoked by light stimulation may include not only monosynaptic inputs from the AON, but also disynaptic recurrent inputs from pyramidal cells in the PC, especially when picrotoxin was used to remove potential contamination from GABAergic synaptic currents (Figure 2E). Although these multisynaptic inputs could be prevented by the reduction of incident light intensity, a reduced intensity also decreased the amplitude of monosynaptic inputs, reducing the signal to noise ratio in the recordings. In addition, because of the variable shapes of the evoked events, we could not preclude polysynaptic contamination in our recordings. To overcome this uncertainty in isolating monosynaptic inputs, we used a previously described technique (Petreanu et al., 2007; Cruikshank et al., 2010) to depolarize ChR2-positive presynaptic terminals directly by blocking action potentials using TTX and potassium channels using 4-aminopyridine (4-AP, 100 μM). TTX prevents recurrent activity, and 4-AP is used to allow more efficient depolarization of axonal and presynaptic membranes.
Light-evoked synaptic responses in the presence of TTX and 4-AP qualitatively resembled those obtained in their absence (Figure 2F), with the peak amplitude of light-evoked EPSCs reduced to 50.6 ± 3.8% with TTX and 4-AP (n = 3). The pharmacologically isolated monosynaptic input was blocked by AMPA and NMDA receptor antagonists (CNQX and APV) to 5.84 ± 0.54%, confirming that the AON projection to the PC was primarily glutamatergic. Additionally, GABAB receptor agonists (baclofen) also blocked the EPSC to 20.5 ± 2.4% as expected from previous experiments using electrical stimulation of associational fibers. The synaptic response had longer latencies with TTX and 4-AP than without these blockers (Figure 2G). This longer latency is likely to be due to the fact that depolarization of the axons under normal conditions is aided by sodium channels, which have a much higher conductance than ChR2; the single channel conductance of ChR2 is ∼1 pS (Lin et al., 2009) while that of a sodium channel is 10–20 pS (Hille, 2001). When sodium channels are blocked, it would take longer to depolarize the axonal membrane to the threshold for activation of voltage-dependent calcium channels. The AMPA:NMDA ratio of synaptic responses in TTX and 4-AP was not significantly different from control (0.987 ± 0.13, n = 6 vs. 1.20 ± 0.12, n = 17, p > 0.2, t-test, Figure 2H).
We next used this method of isolating monosynaptic responses to examine functional connectivity from the AON to PC.
AON Connections on Principal Neurons in the aPC
The PC is generally divided into anterior and posterior parts, with potentially other subdivisions (Haberly, 1998) (Figure 1D). We first examined connections from AON to the aPC. The principal neurons in the aPC are heterogeneous in terms of their structural and functional properties. Historically, they have been divided into three classes: superficial pyramidal (SP) cells, deep pyramidal (DP) cells, and semilunar (SL) cells (Haberly, 1998). Recent studies have determined that the neuronal cell types may lie along a continuum, with the most superficial cells belonging to the SL class, but many properties gradually changing with depth (Suzuki and Bekkers, 2011; Wiegand et al., 2011). These studies also noted that SL and SP cells may differ in their synaptic inputs using electrical stimuli that did not separate the different sources (Suzuki and Bekkers, 2006, 2011). Here, we characterize specific synaptic inputs from the AON to SP and SL cells.
We first recorded from putative superficial pyramidal cells, based on their morphology and input resistance (129.5 ± 11.4 MΩ, n = 18) (Figure 3A). Pyramidal cells exhibited AMPA and NMDA receptor mediated EPSCs with light stimulation in the presence of TTX and 4-AP, indicating that they receive monosynaptic input from AON neurons (Figure 3). We next identified SL cells based on their location, morphology, and higher input resistance (163.7 ± 20.3 MΩ, n = 7). Morphologically, we chose to characterize cells as SL only if they lacked basal dendrites (Figure 3A), even though some cells of this class can possess basal dendrites (Wiegand et al., 2011). The use of TTX to obtain monosynaptic light-evoked responses precluded the characterization of firing patterns. Light-evoked EPSCs recorded in SL cells at −70 mV were very small and often difficult to detect even when neighboring pyramidal cells exhibited large amplitude EPSCs (Figure 3). The average amplitude was 64.2 ± 15 pA for SP cells (n = 18) and only 11.0 ± 3.0 pA for SL cells (n = 7, p < 0.01, t-test). To account for the variability across injections that could lead to different infection rates and expression levels, we compared each of the 7 SL cells with a corresponding SP cell that was recorded in the same slice (Figure 3B; there are nine points since two SL cells were paired with two SP cells each). This analysis confirmed that SL cells receive significantly smaller AMPA inputs from AON than SP cells. Interestingly, the average amplitude of light-evoked AMPA EPSCs in DP cells was not significantly larger than that of SP cells (DP, 136 ± 86 pA, n = 3 vs. SP, 64.2 ± 15 pA, n = 18, p = 0.50, t-test), perhaps due to the small sample size for DP cells. Unexpectedly, robust EPSCs could be recorded at +40 mV in SL cells, even though AMPA responses at −70 mV were weak (Figures 3A–B). Consequently, the AMPA:NMDA ratio was significantly smaller in SL cells (0.447 ± 0.15, n = 7) than in SP or DP cells (SL vs. SP, 1.28 ± 0.14, n = 18, p < 0.01, t-test, and SL vs. DP, 1.18 ± 0.23, n = 3, p < 0.01, t-test). Pairwise comparison of SP and SL cells from matched slices ruled out the possibility that this difference was due to variability in expression of ChR2 across experiments (Figure 3B). The lower AMPA:NMDA ratio may be a general property of all associational synapses made on SL cells, since this was also observed when using electrical stimulation to activate associational fibers more indiscriminately (0.660 ± 0.14).
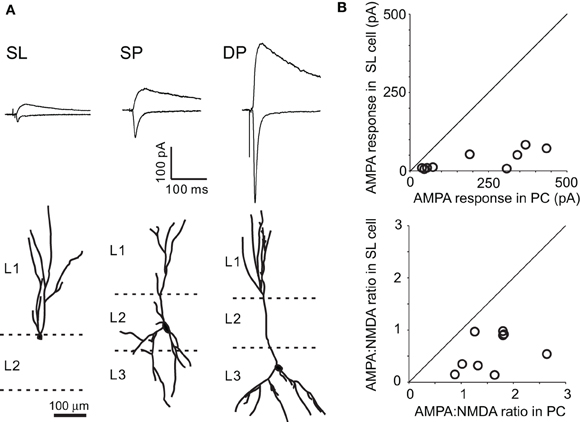
Figure 3. Properties of monosynaptic input from the AON to aPC. (A) Monosynaptic inputs to three types of principal neurons in the aPC. Light evoked monosynaptic EPSCs in SP, superficial pyramidal; DP, deep pyramidal; and SL, semilunar cells. Images show representative examples of each cell type filled with biocytin, indicating the location of the cell body and the extent of apical and basal dendrites (bottom). (B) Comparison of AMPA responses and AMPA:NMDA ratios of SP and SL cells in the same slice. The AMPA responses in the SL cells were significantly smaller than that in SP cells (top). On the other hand, robust EPSCs were recorded at +40 mV in SL cells, even though AMPA responses were weak. Therefore, the AMPA:NMDA ratio was significantly smaller in SL cells (bottom). Each point represents a pair of SL and SP cells recorded in the same slice.
These results indicate that AON projections make strong functional synaptic contacts on pyramidal cells and weaker connections to SL cells. Interestingly, the NMDA component of AON inputs to SL cells may become important when SL cells are depolarized by direct input from the OB. The AMPA:NMDA ratios are also significantly different in the two classes of synapses.
Connections from the AON to the pPC
There is some uncertainty about the extent of AON projections to the pPC (Haberly and Price, 1978; Luskin and Price, 1983a; Brunjes et al., 2005). We could readily identify ChR2-EYFP labeled axons in the ipsilateral pPC when virus particles were injected into the AON (Figure 4A). The distribution of axons was similar to that in the aPC, but the overall fluorescence intensity in the pPC was less than 50% of that in the aPC (Figures 4A–C). Since AON axons in the pPC are more distal than those in the aPC, it is possible that the amount of ChR2-EYFP is substantially reduced, accounting for the dimmer signals. Allowing more time for transport of protein (3 months post injection) did not lead to greater labeling in pPC. Distance alone is unlikely to account for decreased intensity in pPC since AON projections to the contralateral OB, which is at least as far (Haberly and Price, 1978; Brunjes et al., 2005), had an intensity 63.4% of that in ipsilateral aPC. This high fluorescence intensity was observed even within two weeks of injection, indicating that this protein is adequately transported to distal axons. Finally, we obtained higher resolution images of the aPC and the pPC using confocal microscopy under identical conditions. We then quantified the fluorescence intensity of individual axons and varicosities in the two regions. The average fluorescence intensity of EYFP (an indicator of the amount of ChR2-EYFP in the axons) at the single axon/varicosity level was not different in the aPC and pPC (100 ± 2.9% vs. 95.2 ± 3.3%, p > 0.2, t-test, n = 400 boutons each; Figure 4D). We also measured the number of fluorescent pixels that crossed an intensity threshold within standardized regions of interest in the two regions, and found that this value is lower in the pPC than in the aPC. These data indicate that the AON does send projections to the pPC, but the density of projections is lower than that in the aPC.
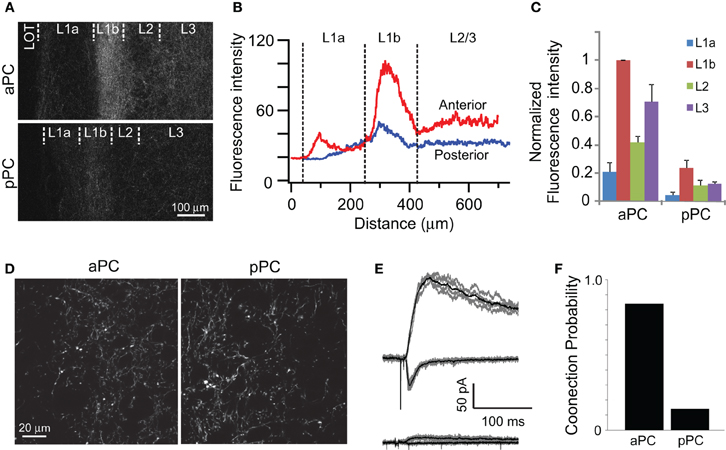
Figure 4. Properties of AON projection to pPC. (A,B) Axons from the AON can be seen projecting to the ipsilateral aPC and pPC. Fluorescence intensity was high in layer 1b where most of associational fibers are found. The intensity was lower in the pPC, but the distribution of projection was largely similar in both aPC and pPC except for layer 1a. (C) Summary of fluorescence intensity. Fluorescence intensity of ChR2-EYFP was measured in layers 1a, 1b, 2, and 3, and was normalized to that in layer 1b of the aPC (N = 3 rats). Fluorescence intensity was always high in layer 1b and reduced to 40% or less in the pPC. Error bars are SEM. (D–F) Comparison of AON projections to aPC and pPC. Measurements of EYFP fluorescence in layer 1b in the aPC and pPC indicated that the single axon/varicosity fluorescence was not different. However, whole-cell patch-clamp recordings in the pPC rarely revealed large synaptic responses (E, top) and mostly very small or no current (E, bottom). The probability was reduced to 0.22 in pPC compared to 0.84 in the aPC (F).
To characterize functional connections from the AON to the pPC, we obtained whole-cell recordings from neurons in the pyramidal cell layer. Light-evoked synaptic currents were recorded as before. Large synaptic currents were obtained only rarely (Figure 4E, top), and most recordings yielded very small or no currents (Figure 4E, bottom). The probability of recording functional connections from the AON was 0.22 (two out of nine cells) for pPC neurons, which is significantly (p < 0.001 Fisher's exact test) lower than that for aPC (0.84, 54 out of 64 cells) (Figure 4F).
These data indicate that although AON axons reach the pPC, their projection density as well as their connection probability is much lower than for the aPC.
Interhemispheric Associational Connections
Another set of associational connections whose functional properties have not been selectively studied are the interhemispheric projections. Optogenetic methods offer an unprecedented ability to examine functional connections made by such long-distance projections from identified neurons (Petreanu et al., 2007). We were able to visualize the projections from AON to the contralateral olfactory cortical areas. Light-evoked synaptic currents could be recorded from contralateral neurons (Figures 5A,B), but the probability of finding connections was much lower than the ipsilateral connections from AON to aPC (0.38 vs. 0.84, p < 0.01 Fisher's exact test, n = 11 out of 29 cells, and 54 out of 64 cells respectively). The average amplitude of AMPA currents recorded in matched experiments was also significantly smaller in contralateral AON compared to ipsilateral aPC (15.4 ± 4.06 pA, n = 23 cells vs. 72.9 ± 16.7 pA, n = 14 cells, p < 0.001, t-test). Ipsilateral AON to AON connections could not be studied in detail because of the significant contamination of ChR2 currents.
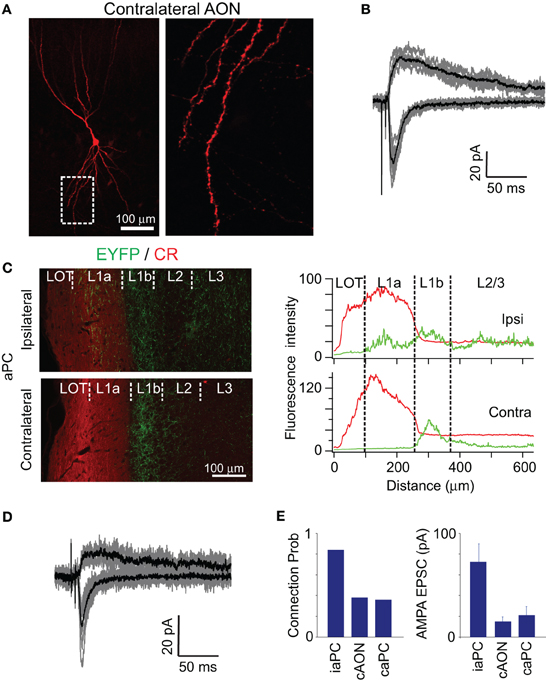
Figure 5. Contralateral projection from AON. (A,B) ChR2-EYFP signal was readily observed in the contralateral AON. Light-evoked synaptic currents were recorded in the contralateral AON neuron (B), but the probability of finding a connection was only 0.38. (C) Axonal projections to the ipsi- and contralateral aPC from AON revealed by injection of AAV into an adult mouse. Sections were stained with anti-calretinin (CR) antibodies (red), a marker of mitral cell axons and some inhibitory neurons within the PC. CR staining allowed us to visualize the border between layer 1a and layer 1b. In the ipsilateral aPC, the EYFP signal was seen from layer 1a to layer 3, with the highest intensity in layer 1b. On the other hand, EYFP signal was more selectively found in layer 1b in the contralateral aPC. Variation in fluorescence intensity of CR (red line) and EYFP (green) in the radial direction from the pial surface is shown below for the ipsi- and contalateral PC. (D,E) Functional connection from the AON recorded in a contralateral aPC pyramidal cell. Probability of connections and amplitude of EPSCs were significantly lower in contralateral AON and aPC compared to that in ipsilateral aPC.
ChR2-EYFP positive fibers were mainly distributed in layer 1b in the contralateral aPC, (Figure 5C), and the intensity was less than 50% of that in layer 1b in the ipsilateral aPC. This reduction was due to reduced density of labeled axons and not reduced levels of ChR2-EYFP in single axons (contralateral axon intensity was 92 ± 3.3% that of ipsilateral intensity, p > 0.2, t-test). Comparing the projection pattern from the AON to ipsilateral and contralateral aPC revealed an interesting difference (Figure 5C). While AON axons were found in layer 1a in the ipsilateral aPC, there were few fibers in contralateral aPC. Similarly the relative density of AON axons in layer 2/3 (compared to density in layer 1b) was lower in the contralateral side (Figure 5C). This resulted in a very clear band of projection in layer 1b on the contralateral side.
Whole-cell recordings revealed low probability of finding functional connections from the AON to contralateral aPC (Figures 5D,E), with only 4 out of 11 cells showing responses above noise. This proportion is significantly lower than that for ipsilateral aPC cells in matched recordings (12 out of 14 connections, p < 0.02 Fisher's exact test). Intriguingly, the AMPA:NMDA ratio was larger for contralateral projections (4.1 ± 0.68) than for ipsilateral ones (0.5 ± 0.09, p < 0.01, t-test). The average amplitude of contralateral synaptic currents was also lower than the ipsilateral ones (21.32 ± 8.12 pA vs. 72.9 ± 16.96 pA, p < 0.02, t-test).
These data suggest that ipsilateral and contralateral projections from the AON have different connection properties in the aPC.
Intrinsic Connections within the PC
We next examined the properties of recurrent connections within the PC by injecting ChR2-EYFP virus into a single location within the aPC (Figure 6A; see Methods). The axonal projections from aPC neurons were distributed from layer 1 to layer 3 in both the aPC and pPC, with the highest density in layer 1b (Figures 6B,C). Notably, labeled fibers were observed in layer 1a (Figures 6B,C), similar to what was found for AON fibers (Figures 2A,B). Labeled fibers were also abundant in the pPC, although the fluorescence intensity was lower than that in aPC (Figure 6B).

Figure 6. Intrinsic connections within the PC. (A) AAV coding for ChR2-EYFP was injected into aPC. The bright signal in the anterior part of the aPC is due to ChR2-EYFP expression in pyramidal and glial cells. (B) EYFP labeled axons projecting to the aPC and pPC are mainly distributed in layer 1b and layer 2/3. Similar to the AON injection, there was some innervation in layer 1a. (C) EYFP fluorescence intensity in the aPC (blue), pPC (gray), and AON (red) plotted as a function of distance from the pial surface. Since pyramidal cells in the AON are located widely in layer 2, there was more fluorescence in this layer relative to the corresponding values in the aPC and pPC. (D) Schematics of intrinsic connection in the PC. (E) In the aPC and pPC, a 5 ms LED flash induced synaptic EPSCs due to activation of ChR2 in presynaptic terminals. Whole-cell patch-clamp recording from neurons demonstrated AMPA receptor-mediated inward current at −70 mV and outward current through the AMPA and NMDA receptors at +40 mV. (F) Probability of synaptic responses was almost 100% in the aPC, and that in pPC was only reduced to 93.3%. Amplitude of AMPA EPSCs was lower in pPC (69.3 ± 16 pA) than in aPC (129 ± 20 pA).
Whole-cell patch-clamp recordings from infected pyramidal cells in the injected area of the aPC showed the typical adapting ChR2 response in the presence of TTX. To examine synaptic responses, we obtained recordings from non-infected pyramidal cells in the aPC, and pyramidal cells in the pPC. Monosynaptic currents were again isolated using TTX and 4-AP as before. Both AMPA and NMDA currents could be recorded in target cells in both regions (Figures 6D–F). The probability of obtaining synaptic currents was almost 100% within the aPC, similar to that reported recently (Franks et al., 2011), and that in the pPC was 93.3% (14 out of 15 cells). AMPA:NMDA ratio was similar for the two target regions (1.44 ± 0.19 vs. 1.22 ± 0.20, n = 18 and 14 respectively, p > 0.4, t-test). Matched recordings from the same slices revealed that the average monosynaptic response amplitudes were lower for aPC to pPC connection compared to intrinsic connectivity within the aPC (69.3 ± 16.9 pA vs. 129.3 ± 19.7 pA, p < 0.05, t-test).
Calcium Imaging Reveals Denser Local Connectivity in the pPC than in the aPC
Experiments with ChR2 did not readily lend themselves to detecting connections originating from single neurons. To examine the functional connectivity of neurons within the aPC, we turned to combined patch-clamp recordings and calcium imaging. Several groups have developed methods to detect the functional targets of single neurons by looking for changes in postsynaptic calcium concentration when a single neuron is made to emit one or more spikes. We labeled a population of cells in the aPC using multicell bolus labeling of OGB-1 (Stosiek et al., 2003; Apicella et al., 2010). Labeled cells were visualized with a CCD camera and patch-clamp recording was obtained from a single neuron within the aPC. In early experiments, we stimulated the LOT at increasing intensities and observed that a large number of labeled neurons in the field of view showed robust increase in fluorescence intensity (Figure 7A). In control experiments, we used high-speed line scanning to confirm that clear fluorescence intensity changes were invariably associated with action potentials (Appendix Figure A2), in line with many previous studies. LOT stimulation also allowed us to assess the health of slices, based on robust responses in a large population of cells. Since intrinsic connections are likely to be weak, we raised the excitability of neurons by increasing the extracellular potassium concentration to 7.5 mM, allowing even weaker synaptic inputs to generate action potentials and the associated calcium signals.
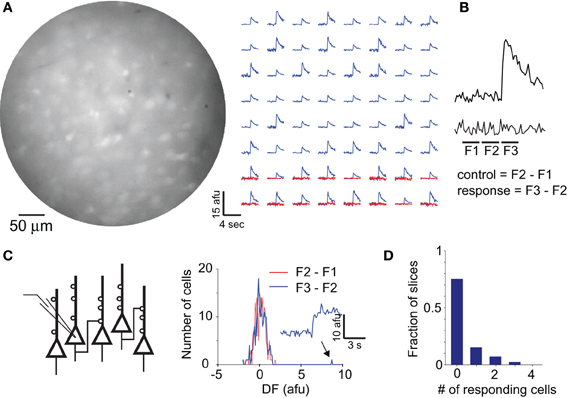
Figure 7. Local connectivity as revealed by calcium imaging. (A) Image of a population of cells in aPC labeled with OGB-1. Fluorescence changes from 64 responding cells to stimulation of LOT are shown in the right panel (blue lines). Control fluorescence traces for trials with no stimulation are shown in red for the bottom 16 cells. Note clear separation of responses from baseline noise. Afu, arbitrary fluorescent units. (B) A bonafide response and a control trace are shown to illustrate the method used to calculate fluorescence response amplitudes. Responses were calculated as difference in fluorescence in the two periods marked as F2 and F3. Noise estimates were obtained from the difference in fluorescence during periods F2 and F1. (C) A single neuron was stimulated to emit 5 action potentials at 20 Hz under whole-cell patch mode, and calcium signals were imaged in neighboring cells. Histogram of response amplitudes (blue) for 150 cells from one such experiment revealed just one cell with a clear response (arrow, and associated fluorescence trace). Noise distribution for the same experiment is shown in red. (D) Distribution of the number of responding cells from all experiments. Note that most experiments had 0 responding cells.
When single neurons within the aPC were stimulated, changes in calcium concentration could be detected in only a small number of cells in the field of view (Figures 7B–D). Responding neurons were identified using a threshold of three standard deviations above baseline fluctuations (see Methods; Figure 7B). On average, we obtained responses in 0.4 ± 0.16 cells (n = 28 slices) out of an average of more than 200 cells in the field of view, with the number of responding cells across experiments following an exponential distribution (Figure 7D). This suggests that the probability of functional connections within a local area is very low in the aPC.
We next examined the intrinsic connectivity in the pPC using calcium imaging. We found that a burst of five action potentials in a single pPC neuron could activate several neighboring neurons (Figure 8A). On average, the number of cells within the imaged field that could be activated was 1.2 ± 0.3 for pPC (n = 16 slices), significantly larger (p < 0.01 Fisher's exact test) than the fraction in aPC (0.4 ± 0.16, n = 28 slices) (Figure 8B). The fraction calculated includes experiments where no cells were activated, and the entire distribution of number of activated cells is shown in Figure 8B.
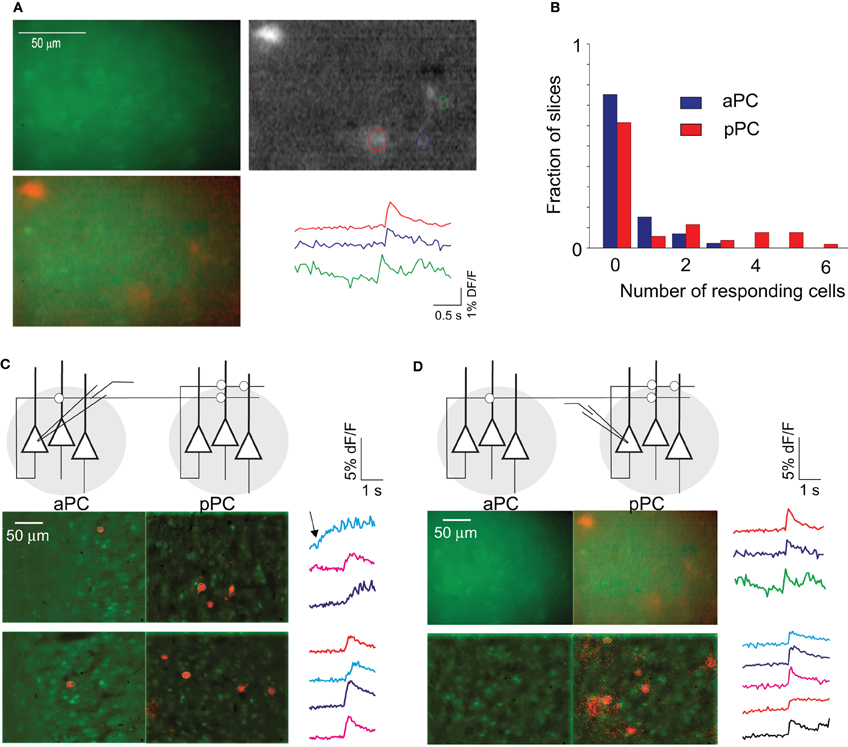
Figure 8. Connectivity in the pPC. (A) Example of a group of cells in pPC labeled with OGB-1 (green), along with the response image when a single neuron was stimulated (grayscale image). The response image was obtained by taking the difference of 10 frames each after and before stimulation. The bright cell to the top left of the image is the stimulated neuron. The two images are superimposed at bottom left (with response image colored red), and the fluorescence traces for the three responding cells are shown at bottom right. (B) The distribution of the number of responding cells from all the experiments is shown for pPC (red). Similar data for the aPC (blue) are shown for comparison. (C) Experiments where a single aPC neuron was activated and calcium signals were recorded in the aPC and pPC (on different trials). Two example images are shown, with responding cells shown in red superimposed on resting fluorescence images (green). At right are traces of the responding cells from the pPC. Note that activation of a single aPC cell in these two experiments causes just 1 cell to respond in aPC, but two or more in pPC. One pPC “response” (blue trace) in top panels was rejected based on the fact that fluorescence rise preceded stimulation (arrow). (D) Similar experiments with activation of a single pPC neuron triggered no responses in the aPC.
Our experiments with ChR2 above indicated that the aPC has strong projections to pPC (Figure 6). We wondered whether the activity of individual aPC cells could drive cells in pPC. After labeling cells in the pPC with OGB1, we obtained whole-cell patch-clamp recordings in the aPC. By moving the field of view to the pPC after obtaining a patch recording in aPC, we were able to determine if cells in the pPC could be activated by a burst of spikes in a single aPC cell. To our surprise, more superficial pPC cells (4.7 ± 0.74 cells, n = 9 slices with at least one pPC cell was active) could be activated by a single aPC neuron than even local aPC cells (1.5 ± 0.46 cells, n = 9 slices with at least one aPC cell active; p < 0.01 Fisher's exact test; Figure 8C). This result was obtained even though our ChR2 experiments indicated that monosynaptic connections were stronger locally within aPC than on pPC neurons. As we discuss below, this was likely due to the denser local connectivity within the pPC which amplifies activation from the aPC. Interestingly, in more than 10 experiments, we never obtained calcium responses in the aPC when stimulating individual pPC cells (Figure 8D).
Discussion
The key findings of our study are that: (1) the AON connects densely to the ipsilateral aPC, but much more sparsely to ipsilateral pPC as well as to contralateral PC, (2) there are target cell-specific differences in the associational connectivity within the aPC, and (3) the intrinsic projections within the aPC are sparser than those within pPC. Our results offer a cellular basis for a sensory role of aPC and a more associative role for pPC. The functional connectivity diagram informed by our studies, showing the probability of connections between areas, is illustrated in Figure 9.
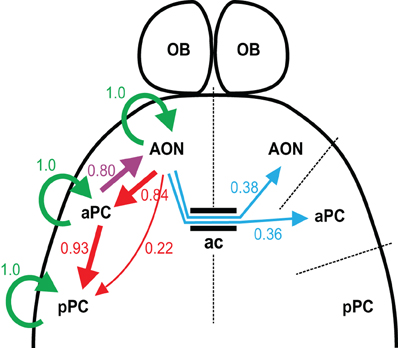
Figure 9. Summary of connections. Wiring diagram based on the probability of finding functional connections in our experiments. The width of the arrow is correlated with the probability, with the numbers appearing next to the arrows. Connections from aPC to AON, and those within the AON are from data not shown in the paper. Ac, anterior commissure.
Acknowledging the Heterogeneity of Associational Synapses
The piriform cortex is often described as an associational cortex, where multiple olfactory cues are combined with each other as well as with non-sensory inputs (Haberly, 2001; Wilson et al., 2004; Gottfried, 2010; Wilson and Sullivan, 2011). The input from the olfactory bulb to the cortex is disperse and apparently non-stereotyped (Haberly, 2001; Wilson et al., 2004; Gottfried, 2010; Ghosh et al., 2011; Miyamichi et al., 2011; Sosulski et al., 2011). This implies that a given location in the PC can potentially receive inputs from a wide area of the bulb (Davison and Ehlers, 2011), and therefore integrate multiple odor cues simply through input diversity. In addition, the associational connections also contribute significantly to odor responses in the anesthetized animal (Rennaker et al., 2007; Poo and Isaacson, 2011; Chapuis and Wilson, 2012).
The associational fiber system is an inclusive phrase for the connections between subregions of the olfactory cortex (Haberly, 1998). Physiological studies have tended to underemphasize the heterogeneity of associational connections. For example, when associational synapses are suppressed using baclofen, inputs from many different sources will be affected. It is unclear, however, whether connections from different sources have different functional roles—for instance, do inputs to the PC from AON play a sensory or associational role? Our study suggests that caution is required in interpreting experiments that indiscriminately activate associational fibers, since different sources have different connection propensity. For example, associational synapses in the pPC do not include significant contribution from the AON, but include significant recurrent intrinsic connections.
The Output of AON
The AON is at the hub of ipsi- and contralateral connections and may play a central role in olfaction (Haberly and Price, 1978; Luskin and Price, 1983a,b; Reyher et al., 1988; Brunjes et al., 2005; Yan et al., 2008; Illig and Eudy, 2009; Kikuta et al., 2010). Our anatomical results confirm classical studies showing abundant connections from the AON to PC. Although the AON has been divided into multiple regions with distinct connectivity (Luskin and Price, 1983a,b; Haberly, 1998; Brunjes et al., 2005; Matsutani, 2010), we chose not to distinguish among the different subregions in these first set of studies because of the technical challenge of injecting viral particles into small subregions without clear boundaries.
Histological reconstructions demonstrated that the projections from the AON are denser in the aPC than in the pPC. The decreased density of projections from the AON to pPC was associated with a significantly lower probability of obtaining light-evoked synaptic responses in the pPC. ChR2-labeled axons in the aPC were mainly in layers 1b and 2/3, but some axons were consistently present in layer 1a where only sensory projections from the OB were expected. These projections were not due to accidental labeling of mitral/tufted cells because those cells were highly resistant to infection even when AAV particles were injected directly into the bulb (Appendix Figure A1). Association fibers were also present in layer 1a when virus injection was done in the aPC (Figures 6B,C). Interestingly, there was no labeling in layer 1a of pPC from either AON or aPC injections. We note that our data are from juvenile animals and these fibers may be eliminated in adult tissue (Schwob et al., 1999). Although we are unable to ascribe any functional role for these associational fibers in layer 1a, our results suggest that some degree of caution is warranted when electrically stimulating layer 1a, especially in the minimal stimulation regime, since inadvertent activation of ectopic associational fibers may lead to misleading results.
The different subregions of the AON and PC are connected through complex reciprocal connections that often cross the midline. Our histological analysis indicated that contralateral projections from the AON to the aPC were sparser than ipsilateral ones. Accordingly, we were unable to detect synaptic responses reliably in contralateral cortical areas in our experiments. The weaker functional connectivity is not due to reduced ChR2 expression in the distal parts of the AON axons, as judged by single bouton fluorescence. Our results indicate that the AON inputs to ipsilateral pPC as well as contralateral aPC and pPC are fairly weak. Any function of these crossed projections must involve subtle modulation of firing properties rather than driving activity on their own (Wilson, 1997; Kikuta et al., 2008).
Target-Dependent Properties of AON Synapses in the aPC
Recent studies of PC circuits have revealed heterogeneity in synaptic inputs received by different principal cells (Suzuki and Bekkers, 2011; Wiegand et al., 2011). In particular, SL cells located superficially receive stronger synaptic inputs from mitral/tufted cells axons than deeper pyramidal cells, which seem to have stronger associational connections (Suzuki and Bekkers, 2011; Wiegand et al., 2011). Here, we report the relative poverty of functional connections from the AON to SL cells. The weak connectivity from the AON to SL cells cannot be simply due to the absence of basal dendrites in these cells, since AON axons have dense projections to layer 1b where the proximal dendrites of SL cells can potentially receive inputs. In fact, experiments with spatially localized stimulation using an optical fiber indicated that both layer 1 and layer 3 synapses are functionally active (Appendix Figure A3). Our studies add support to the view that the aPC circuits are likely to be functionally segregated into sensory and more associative components. We also speculate that the lack of strong associational inputs may partly underlie the selective vulnerability of SL cells, which die within 24 h following removal of the OB (Heimer and Kalil, 1978). It is possible that removal of the OB decreases synaptic inputs to SL cells much more drastically than to pyramidal cells, which have strong associational inputs, and this makes SL cells more vulnerable.
Our results suggest that odor-evoked responses of SL cells will be dominated by sensory inputs from the OB, but those of SP and DP cells influenced by recurrent cortico-cortical connections. The responses of PC cells are thought to be sparse and distributed (Rennaker et al., 2007; Poo and Isaacson, 2009; Stettler and Axel, 2009; Zhang et al., 2010; Poo and Isaacson, 2011), but whether this applies to SL cells is not clear. The contribution of associational connections to odor responses in different cell types can be dissected in future experiments using either pharmacological (baclofen, for example) or optogenetic (inhibitory rhodopsins, for example) manipulations.
We also discovered that synapses made by AON axons on SL cells had a lower AMPA:NMDA ratio when compared to pyramidal cells. In many regions of the brain, higher relative contribution of NMDA currents has been associated with greater synaptic plasticity (Smith and McMahon, 2005; Argilli et al., 2008). Association synapses to pyramidal cells can undergo long-term potentiation and depression in vitro (Lebel et al., 2001; Young and Sun, 2007), and it is possible that SL cell synapses are more plastic.
Recurrent Connectivity
Another novel finding of our study is that recurrent connections within the aPC were functionally sparser than those in pPC. The evidence to support this conclusion came from calcium imaging experiments. Although this method is likely to be agnostic about weak synapses, there was a clear difference in the number of follower cells triggered by a single neuron in aPC and pPC. Our results point to a denser connectivity within the pPC. The weak local connectivity in the aPC was also confirmed with paired patch-clamp recordings. The low probability of connectivity within the aPC is unlikely to be simply due to severing of recurrent axons by slicing since the pPC had higher connectivity under the same conditions, and even the aPC to pPC connectivity was denser than the local connections (Figures 7 and 8).
Based on the estimates of the number of neurons in the imaged region, we calculated a local connection probability of ∼0.002 in the aPC. This value is consistent with an indirect estimate of <0.01 obtained from optogenetic analysis in PC of mice recently (Franks et al., 2011). In the pPC, the connection probability, calculated again using the number of imaged neurons in the field of view, was 0.006. Since the calcium imaging method is likely to be less sensitive than electrophysiology, and some connections are likely to be severed in the slice preparation, our estimates might be low. We also note that there may be differences within the aPC itself, for example the dorsal versus the ventral parts (Illig, 2007), which future studies can address.
The higher intrinsic connection probability in the pPC was also reinforced by experiments where activation of single aPC neurons led to a greater number of activated pPC neurons than aPC neurons in the vicinity of the trigger neuron. Interestingly, our optogenetic experiments using ChR2 indicated that monosynaptic connections from the aPC to the pPC were not any more frequent or stronger than local intrinsic aPC connections. The two observations together suggest that activation of a single aPC neuron monosynaptically activates a small number of neurons in the pPC, which then recurrently activate more neurons in the pPC. We were unable to test the role of local recurrent synapses in pPC vs. synapses from aPC since baclofen would affect both populations.
A recent study in the PC indicated that synaptic connection probability as well as synaptic strength was distance independent (Franks et al., 2011). However, that study did not include recordings from the pPC. We have found that the average amplitude of light-evoked EPSCs was smaller from aPC to pPC compared to local connections within the aPC, suggesting that the aPC to pPC connections may have lower convergence or lower quantal amplitudes. A final intriguing point is that there is a distinct lack of functional projections from pPC to aPC. This is consistent with anatomical evidence based on reconstructions of axon collaterals of individual pPC neurons, as well as bulk tracer labeling (Datiche et al., 1996; Johnson et al., 2000; Chen et al., 2003; ul Quraish et al., 2004; Yang et al., 2004).
Functional Connectivity and the Differing Functional Roles of aPC and pPC
Previous studies have promoted the notion that the aPC interacts with AON (and OB) to produce a synthesized odor representation that is conveyed to a more associative cortical area, the pPC. The pPC is thought to receive not only odor information, but also information from other modalities (Schoenbaum and Eichenbaum, 1995; Haberly, 2001). Therefore, the aPC may be associative mainly within the context of a single modality (olfaction), and the pPC may be associative in a multimodal sense (Haberly, 2001). It has been noted that pPC neurons are less responsive to odor stimulation than aPC neurons (Litaudon et al., 2003), and that the activity in the aPC in behaving animals largely reflects sensory information, whereas activity in the pPC is modulated significantly by other contexts such as reward (Calu et al., 2007). Studies in rodents (Kadohisa and Wilson, 2006; Calu et al., 2007) as well as lower resolution human imaging studies (Gottfried et al., 2006; Howard et al., 2009; Zelano et al., 2011) have suggested that odor identity may be represented in the aPC and odor quality in the pPC. Our findings are consistent with the idea that the aPC receives more sensory information than the pPC. In addition, there is little feedback from the pPC to the aPC. Our data, however, suggest that notions of intrinsic connectivity in the two regions need to be revised.
There has been some uncertainty about the differences between intrinsic connectivity in the aPC and the pPC. Some classical tracing studies (Haberly and Price, 1978; Luskin and Price, 1983a,b) have suggested that the pPC has weaker intrinsic connectivity (Haberly, 2001). Bulk tracer methods are not ideal for studying local connectivity because of the high background at the site of injections. By contrast, single neuron injections, which are technically more difficult, are better suited for detailed analysis of intrinsic connectivity. Indeed, single neuron fills clearly reveal abundant local axonal arbors of pPC neurons (Johnson et al., 2000; Chen et al., 2003; ul Quraish et al., 2004; Yang et al., 2004). Taken together, anatomical studies note a caudal bias in the associational projections from the pPC, but leave open the possibility of strong local intrinsic connections. The only functional study (Ketchum and Haberly, 1993) that compared the intrinsic connectivity in the aPC and pPC suggested sparser intrinsic connectivity in the pPC. This study used an indirect method (current source density analysis) and relied on differences in the latency of a current sink in layer 1b. However, our studies as well as others clearly indicate that associational connections can also be found in deeper layers in addition to layer 1b. Here, we have used a more direct method combining electrophysiology and imaging to measure the functional strength of connections at the level of single neurons. It is also possible that even if the pPC has anatomically sparser intrinsic connectivity than the aPC, the synaptic strength could be higher. This can be tested in future experiments with targeted paired recordings from identified neurons.
Implications for Plasticity
The PC combines sensory information that arrives via LOT axons with other information coming through associational inputs, thus learning associations across odors and even modalities (Haberly, 2001; Wilson et al., 2004; Calu et al., 2007). NMDA receptor-dependent plasticity is more pronounced in the associational inputs, especially after 3 weeks of age (Franks and Isaacson, 2005; Poo and Isaacson, 2007; Johenning et al., 2009). If the potential for plasticity is related to the AMPA:NMDA ratio, our studies indicate that olfactory-related plasticity can occur not just in the recurrent connections within the PC, as often discussed (Haberly, 1998; Brosh and Barkai, 2004, 2009; Gottfried, 2010), but also in the feedforward projection from the AON. By contrast, the feedback projection from the aPC to AON had a much higher AMPA:NMDA ratio (1.79 ± 0.15; data not shown) than the feedforward projections (1.20 ± 0.12, p < 0.01), suggesting that these synapses are less plastic. These predictions about plasticity can be tested experimentally by inducing LTP or LTD using accepted protocols.
Concluding Remarks
Our optophysiological experiments have revealed important information about the organization of the cortico-cortical connections in the olfactory cortex of rodents. We have found that the functional synaptic circuits in the aPC and pPC are different, establishing a cellular and circuit basis for systems-level findings on odor processing in these areas.
Conflict of Interest Statement
The authors declare that the research was conducted in the absence of any commercial or financial relationships that could be construed as a potential conflict of interest.
Acknowledgments
Akari Hagiwara was supported in part by a fellowship from the Astellas Foundation for Research on Metabolic Disorders, and Martin Wienisch was supported by a Human Frontier Science Foundation long-term fellowship. This work in Venkatesh N. Murthy's lab was supported by Harvard University.
References
Albeanu, D. F., Soucy, E., Sato, T. F., Meister, M., and Murthy, V. N. (2008). LED arrays as cost effective and efficient light sources for widefield microscopy. PLoS One 3:e2146. doi: 10.1371/journal.pone.0002146
Apicella, A., Yuan, Q., Scanziani, M., and Isaacson, J. S. (2010). Pyramidal cells in piriform cortex receive convergent input from distinct olfactory bulb glomeruli. J. Neurosci. 30, 14255–14260.
Argilli, E., Sibley, D. R., Malenka, R. C., England, P. M., and Bonci, A. (2008). Mechanism and time course of cocaine-induced long-term potentiation in the ventral tegmental area. J. Neurosci. 28, 9092–9100.
Behan, M., and Haberly, L. B. (1999). Intrinsic and efferent connections of the endopiriform nucleus in rat. J. Comp. Neurol. 408, 532–548.
Boyden, E. S., Zhang, F., Bamberg, E., Nagel, G., and Deisseroth, K. (2005). Millisecond-timescale, genetically targeted optical control of neural activity. Nat. Neurosci. 8, 1263–1268.
Brosh, I., and Barkai, E. (2004). Learning-induced long-term synaptic modifications in the olfactory cortex. Curr. Neurovasc. Res. 1, 389–395.
Brosh, I., and Barkai, E. (2009). Learning-induced enhancement of feedback inhibitory synaptic transmission. Learn. Mem. 16, 413–416.
Brunjes, P. C., Illig, K. R., and Meyer, E. A. (2005). A field guide to the anterior olfactory nucleus (cortex). Brain Res. Brain Res. Rev. 50, 305–335.
Calu, D. J., Roesch, M. R., Stalnaker, T. A., and Schoenbaum, G. (2007). Associative encoding in posterior piriform cortex during odor discrimination and reversal learning. Cereb. Cortex 17, 1342–1349.
Campagnola, L., Wang, H., and Zylka, M. J. (2008). Fiber-coupled light-emitting diode for localized photostimulation of neurons expressing channelrhodopsin-2. J. Neurosci. Methods 169, 27–33.
Chapuis, J., and Wilson, D. A. (2012). Bidirectional plasticity of cortical pattern recognition and behavioral sensory acuity. Nat. Neurosci. 15, 155–161.
Chen, S., Murakami, K., Oda, S., and Kishi, K. (2003). Quantitative analysis of axon collaterals of single cells in layer III of the piriform cortex of the guinea pig. J. Comp. Neurol. 465, 455–465.
Cruikshank, S. J., Urabe, H., Nurmikko, A. V., and Connors, B. W. (2010). Pathway-specific feedforward circuits between thalamus and neocortex revealed by selective optical stimulation of axons. Neuron 65, 230–245.
Datiche, F., Litaudon, P., and Cattarelli, M. (1996). Intrinsic association fiber system of the piriform cortex: a quantitative study based on a cholera toxin B subunit tracing in the rat. J. Comp. Neurol. 376, 265–277.
Davison, I. G., and Ehlers, M. D. (2011). Neural circuit mechanisms for pattern detection and feature combination in olfactory cortex. Neuron 70, 82–94.
Ekstrand, J. J., Domroese, M. E., Johnson, D. M., Feig, S. L., Knodel, S. M., Behan, M., and Haberly, L. B. (2001). A new subdivision of anterior piriform cortex and associated deep nucleus with novel features of interest for olfaction and epilepsy. J. Comp. Neurol. 434, 289–307.
Franks, K. M., and Isaacson, J. S. (2005). Synapse-specific downregulation of NMDA receptors by early experience: a critical period for plasticity of sensory input to olfactory cortex. Neuron 47, 101–114.
Franks, K. M., Russo, M. J., Sosulski, D. L., Mulligan, A. A., Siegelbaum, S. A., and Axel, R. (2011). Recurrent circuitry dynamically shapes the activation of piriform cortex. Neuron 72, 49–56.
Friedman, B., and Price, J. L. (1984). Fiber systems in the olfactory bulb and cortex: a study in adult and developing rats, using the timm method with the light and electron microscope. J. Comp. Neurol. 223, 88–109.
Ghezzi, D., Menegon, A., Pedrocchi, A., Valtorta, F., and Ferrigno, G. (2008). A micro-electrode array device coupled to a laser-based system for the local stimulation of neurons by optical release of glutamate. J. Neurosci. Methods 175, 70–78.
Ghosh, S., Larson, S. D., Hefzi, H., Marnoy, Z., Cutforth, T., Dokka, K., and Baldwin, K. K. (2011). Sensory maps in the olfactory cortex defined by long-range viral tracing of single neurons. Nature 472, 217–220.
Gottfried, J. A. (2010). Central mechanisms of odour object perception. Nat. Rev. Neurosci. 11, 628–641.
Gottfried, J. A., Winston, J. S., and Dolan, R. J. (2006). Dissociable codes of odor quality and odorant structure in human piriform cortex. Neuron 49, 467–479.
Haberly, L. B. (1998). “Olfactory Cortex,” in The Synaptic Organization of the Brain, 4th edn., ed G. M. Shepherd (New York, NY: Oxford University Press), 377–416.
Haberly, L. B. (2001). Parallel-distributed processing in olfactory cortex: new insights from morphological and physiological analysis of neuronal circuitry. Chem. Senses 26, 551–576.
Haberly, L. B., and Price, J. L. (1978). Association and commissural fiber systems of the olfactory cortex of the rat. J. Comp. Neurol. 178, 711–740.
Heimer, L., and Kalil, R. (1978). Rapid transneuronal degeneration and death of cortical neurons following removal of the olfactory bulb in adult rats. J. Comp. Neurol. 178, 559–609.
Hille, B. (2001). “Counting channels and measuring fluctuations,” in Ion Channels of Excitable Membranes. (Sunderland, MA, USA: Sinauer Associates, Inc.), 377–404.
Howard, J. D., Plailly, J., Grueschow, M., Haynes, J. D., and Gottfried, J. A. (2009). Odor quality coding and categorization in human posterior piriform cortex. Nat. Neurosci. 12, 932–938.
Illig, K. R. (2007). Developmental changes in odor-evoked activity in rat piriform cortex. Neuroscience 145, 370–376.
Illig, K. R., and Eudy, J. D. (2009). Contralateral projections of the rat anterior olfactory nucleus. J. Comp. Neurol. 512, 115–123.
Isaacson, J. S. (2010). Odor representations in mammalian cortical circuits. Curr. Opin. Neurobiol. 20, 328–331.
Ishizuka, T., Kakuda, M., Araki, R., and Yawo, H. (2006). Kinetic evaluation of photosensitivity in genetically engineered neurons expressing green algae light-gated channels. Neurosci. Res. 54, 85–94.
Johenning, F. W., Beed, P. S., Trimbuch, T., Bendels, M. H., Winterer, J., and Schmitz, D. (2009). Dendritic compartment and neuronal output mode determine pathway-specific long-term potentiation in the piriform cortex. J. Neurosci. 29, 13649–13661.
Johnson, D. M., Illig, K. R., Behan, M., and Haberly, L. B. (2000). New features of connectivity in piriform cortex visualized by intracellular injection of pyramidal cells suggest that “primary” olfactory cortex functions like “association” cortex in other sensory systems. J. Neurosci. 20, 6974–6982.
Kadohisa, M., and Wilson, D. A. (2006). Separate encoding of identity and similarity of complex familiar odors in piriform cortex. Proc. Natl. Acad. Sci. U.S.A. 103, 15206–15211.
Ketchum, K. L., and Haberly, L. B. (1993). Membrane currents evoked by afferent fiber stimulation in rat piriform cortex. I. Current source-density analysis. J. Neurophysiol. 69, 248–260.
Kikuta, S., Kashiwadani, H., and Mori, K. (2008). Compensatory rapid switching of binasal inputs in the olfactory cortex. J. Neurosci. 28, 11989–11997.
Kikuta, S., Sato, K., Kashiwadani, H., Tsunoda, K., Yamasoba, T., and Mori, K. (2010). From the cover: neurons in the anterior olfactory nucleus pars externa detect right or left localization of odor sources. Proc. Natl. Acad. Sci. U.S.A. 107, 12363–12368.
Kozloski, J., Hamzei-Sichani, F., and Yuste, R. (2001). Stereotyped position of local synaptic targets in neocortex. Science 293, 868–872.
Lebel, D., Grossman, Y., and Barkai, E. (2001). Olfactory learning modifies predisposition for long-term potentiation and long-term depression induction in the rat piriform (olfactory) cortex. Cereb. Cortex 11, 485–489.
Lee, M. C., Yasuda, R., and Ehlers, M. D. (2010). Metaplasticity at single glutamatergic synapses. Neuron. 66, 859–870.
Lin, J. Y., Lin, M. Z., Steinbach, P., and Tsien, R. Y. (2009). Characterization of engineered channelrhodopsin variants with improved properties and kinetics. Biophys. J. 96, 1803–1814.
Litaudon, P., Amat, C., Bertrand, B., Vigouroux, M., and Buonviso, N. (2003). Piriform cortex functional heterogeneity revealed by cellular responses to odours. Eur. J. Neurosci. 17, 2457–2461.
Luskin, M. B., and Price, J. L. (1983a). The laminar distribution of intracortical fibers originating in the olfactory cortex of the rat. J. Comp. Neurol. 216, 292–302.
Luskin, M. B., and Price, J. L. (1983b). The topographic organization of associational fibers of the olfactory system in the rat, including centrifugal fibers to the olfactory bulb. J. Comp. Neurol. 216, 264–291.
Matsutani, S. (2010). Trajectory and terminal distribution of single centrifugal axons from olfactory cortical areas in the rat olfactory bulb. Neuroscience 169, 436–448.
Mazarakis, N. D., Azzouz, M., Rohll, J. B., Ellard, F. M., Wilkes, F. J., Olsen, A. L., Carter, E. E., Barber, R. D., Baban, D. F., Kingsman, S. M., Kingsman, A. J., O'Malley, K., and Mitrophanous, K. A. (2001). Rabies virus glycoprotein pseudotyping of lentiviral vectors enables retrograde axonal transport and access to the nervous system after peripheral delivery. Hum. Mol. Genet. 10, 2109–2121.
Miyamichi, K., Amat, F., Moussavi, F., Wang, C., Wickersham, I., Wall, N. R., Taniguchi, H., Tasic, B., Huang, Z. J., He, Z., Callaway, E. M., Horowitz, M. A., and Luo, L. (2011). Cortical representations of olfactory input by trans-synaptic tracing. Nature 472, 191–196.
Neville, K. R., and Haberly, L. B. (2004). “Olfactory cortex,” in The Synaptic Organization of the Brain, 5th edn., ed G. M. Shepherd (New York, NY: Oxford University Press), 415–454.
Petreanu, L., Huber, D., Sobczyk, A., and Svoboda, K. (2007). Channelrhodopsin-2-assisted circuit mapping of long-range callosal projections. Nat. Neurosci. 10, 663–668.
Piredda, S., and Gale, K. (1985). A crucial epileptogenic site in the deep prepiriform cortex. Nature 317, 623–625.
Poncer, J. C., and Malinow, R. (2001). Postsynaptic conversion of silent synapses during LTP affects synaptic gain and transmission dynamics. Nat. Neurosci. 4, 989–996.
Poo, C., and Isaacson, J. S. (2007). An early critical period for long-term plasticity and structural modification of sensory synapses in olfactory cortex. J. Neurosci. 27, 7553–7558.
Poo, C., and Isaacson, J. S. (2009). Odor representations in olfactory cortex: “sparse” coding, global inhibition, and oscillations. Neuron 62, 850–861.
Poo, C., and Isaacson, J. S. (2011). A major role for intracortical circuits in the strength and tuning of odor-evoked excitation in olfactory cortex. Neuron 72, 41–48.
Rennaker, R. L., Chen, C. F., Ruyle, A. M., Sloan, A. M., and Wilson, D. A. (2007). Spatial and temporal distribution of odorant-evoked activity in the piriform cortex. J. Neurosci. 27, 1534–1542.
Reyher, C. K., Schwerdtfeger, W. K., and Baumgarten, H. G. (1988). Interbulbar axonal collateralization and morphology of anterior olfactory nucleus neurons in the rat. Brain. Res. Bull. 20, 549–566.
Sasaki, T., Minamisawa, G., Takahashi, N., Matsuki, N., and Ikegaya, Y. (2009). Reverse optical trawling for synaptic connections in situ. J. Neurophysiol. 102, 636–643.
Sato, T. F., and Murthy, V. N. (2010). “Light-emitting diodes for biological microscopy,” in Imaging: A Laboratory Manual, ed R. Yuste (New York, NY: Cold Spring Harbor Laboratory). 123–134.
Schoenbaum, G., and Eichenbaum, H. (1995). Information coding in the rodent prefrontal cortex. I. Single-neuron activity in orbitofrontal cortex compared with that in pyriform cortex. J. Neurophysiol. 74, 733–750.
Schwob, J. E., Youngentob, S. L., Ring, G., Iwema, C. L., and Mezza, R. C. (1999). Reinnervation of the rat olfactory bulb after methyl bromide-induced lesion: timing and extent of reinnervation. J. Comp. Neurol. 412, 439–457.
Smith, C. C., and McMahon, L. L. (2005). Estrogen-induced increase in the magnitude of long-term potentiation occurs only when the ratio of NMDA transmission to AMPA transmission is increased. J. Neurosci. 25, 7780–7791.
Sosulski, D. L., Bloom, M. L., Cutforth, T., Axel, R., and Datta, S. R. (2011). Distinct representations of olfactory information in different cortical centres. Nature 472, 213–216.
Stettler, D. D., and Axel, R. (2009). Representations of odor in the piriform cortex. Neuron 63, 854–864.
Stosiek, C., Garaschuk, O., Holthoff, K., and Konnerth, A. (2003). In vivo two-photon calcium imaging of neuronal networks. Proc. Natl. Acad. Sci. U.S.A. 100, 7319–7324.
Suzuki, N., and Bekkers, J. M. (2006). Neural coding by two classes of principal cells in the mouse piriform cortex. J. Neurosci. 26, 11938–11947.
Suzuki, N., and Bekkers, J. M. (2011). Two layers of synaptic processing by principal neurons in piriform cortex. J. Neurosci. 31, 2156–2166.
Takahashi, N., Sasaki, T., Matsumoto, W., Matsuki, N., and Ikegaya, Y. (2010). Circuit topology for synchronizing neurons in spontaneously active networks. Proc. Natl. Acad. Sci. U.S.A. 107, 10244–10249.
Tang, A. C., and Hasselmo, M. E. (1994). Selective suppression of intrinsic but not afferent fiber synaptic transmission by baclofen in the piriform (olfactory) cortex. Brain Res. 659, 75–81.
Tyler, W. J., Petzold, G. C., Pal, S. K., and Murthy, V. N. (2007). Experience-dependent modification of primary sensory synapses in the mammalian olfactory bulb. J. Neurosci. 27, 9427–9438.
ul Quraish, A., Yang, J., Murakami, K., Oda, S., Takayanagi, M., Kimura, A., Kakuta, S., and Kishi, K. (2004). Quantitative analysis of axon collaterals of single superficial pyramidal cells in layer IIb of the piriform cortex of the guinea pig. Brain. Res. 1026, 84–94.
Wang, H., Peca, J., Matsuzaki, M., Matsuzaki, K., Noguchi, J., Qiu, L., Wang, D., Zhang, F., Boyden, E., Deisseroth, K., Kasai, H., Hall, W. C., Feng, G., and Augustine, G. J. (2007). High-speed mapping of synaptic connectivity using photostimulation in Channelrhodopsin-2 transgenic mice. Proc. Natl. Acad. Sci. U.S.A. 104, 8143–8148.
Wiegand, H. F., Beed, P., Bendels, M. H., Leibold, C., Schmitz, D., and Johenning, F. W. (2011). Complementary sensory and associative microcircuitry in primary olfactory cortex. J. Neurosci. 31, 12149–12158.
Wilson, D. A. (1997). Binaral interactions in the rat piriform cortex. J. Neurophysiol. 78, 160–169.
Wilson, D. A., Best, A. R., and Sullivan, R. M. (2004). Plasticity in the olfactory system: lessons for the neurobiology of memory. Neuroscientist 10, 513–524.
Wouterlood, F. G., and Hrtig, W. (1995). Calretinin-immunoreactivity in mitral cells of the rat olfactory bulb. Brain. Res. 682, 93–100.
Yan, Z., Tan, J., Qin, C., Lu, Y., Ding, C., and Luo, M. (2008). Precise circuitry links bilaterally symmetric olfactory maps. Neuron 58, 613–624.
Yang, J., ul Quraish, A., Murakami, K., Ishikawa, Y., Takayanagi, M., Kakuta, S., and Kishi, K. (2004). Quantitative analysis of axon collaterals of single neurons in layer IIa of the piriform cortex of the guinea pig. J. Comp. Neurol. 473, 30–42.
Young, A., and Sun, Q. Q. (2007). Long-term modifications in the strength of excitatory associative inputs in the piriform cortex. Chem. Senses 32, 783–794.
Zelano, C., Mohanty, A., and Gottfried, J. A. (2011). Olfactory predictive codes and stimulus templates in piriform cortex. Neuron 72, 178–187.
Zhang, F., Aravanis, A. M., Adamantidis, A., De Lecea, L., and Deisseroth, K. (2007). Circuit-breakers: optical technologies for probing neural signals and systems. Nat. Rev. Neurosci. 8, 577–581.
Zhang, Y., Yamada, Y., Fan, M., Bangaru, S. D., Lin, B., and Yang, J. (2010). The beta subunit of voltage-gated Ca2+ channels interacts with and regulates the activity of a novel isoform of Pax6. J. Biol. Chem. 285, 2527–2536.
Zheng, H., Qiao, C., Wang, C. H., Li, J., Yuan, Z., Zhang, C., and Xiao, X. (2010). Efficient retrograde transport of adeno-associated virus type 8 to spinal cord and dorsal root ganglion after vector delivery in muscle. Hum. Gene. Ther. 21, 87–97.
Appendix
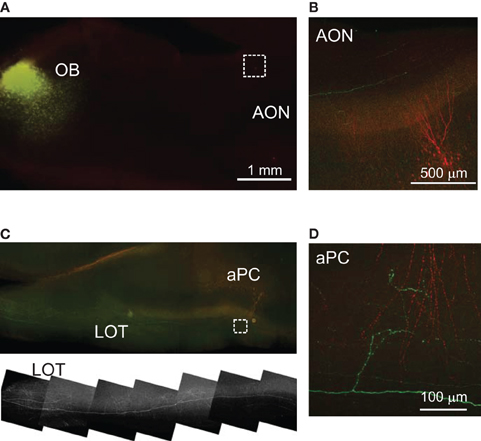
Figure A1. Mitral cell projection to the PC. Direct injection of AAV into the OB induced expression of ChR2-EYFP mostly in periglomelular cells, granule cells, and glial cells at the injection site, with almost no mitral cell labeling (A). Only a few fibers can be recognized passing through the LOT (B,C), and some branched fibers from the LOT innervate layer 1a in the aPC (D).
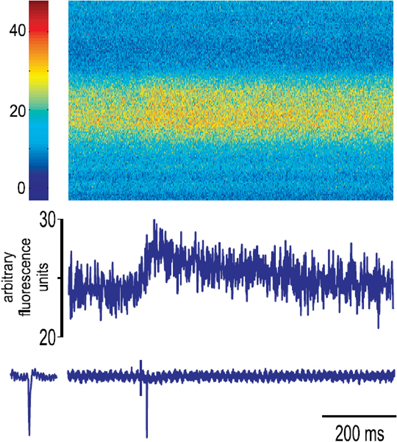
Figure A2. Detection of single action potentials with calcium imaging. After multicell bolus labeling aPC slices with OGB-1, cell attached recordings were obtained from a single neuron. The LOT was stimulated at low intensities to evoke a single spike in the recorded cell. Confocal imaging (LSM510, Zeiss) was performed in the line scan mode and fluorescence changes recorded (top). Single action potentials (bottom trace) were associated with clear fluorescence increases (middle trace).
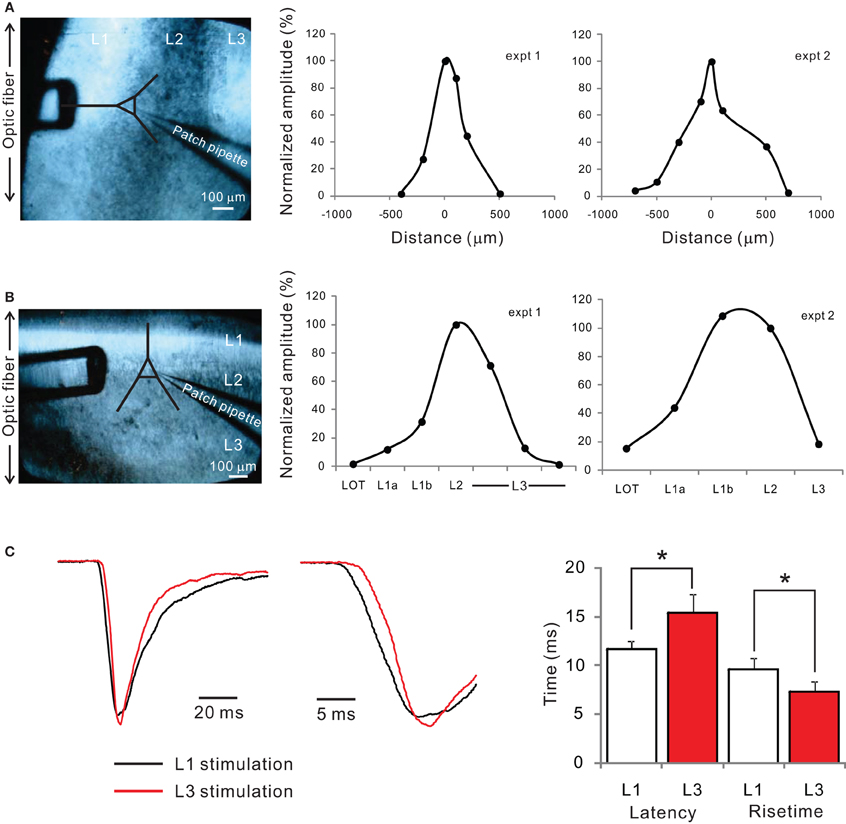
Figure A3. Local stimulation with multimode optic fiber. Focal stimulation of ChR2-expressing axons was performed by coupling a blue laser (GLG 3080B, NEC Inc., emitting approximately 5 mW) onto one end of a 50 μm core, 0.22 NA multimode optic fiber (M14L05, Thorlabs Inc.). The other end was cleaved and threaded through a 25G stainless steel needle (6937A28, McMaster-Carr Inc.) and epoxied to create a makeshift stimulating optrode. Timing of stimulation was controlled by a shutter (Uniblitz VS25S2ZM1, Vincent Associates Inc.) and shutter driver (Uniblitz T132, Vincent Associates Inc.) in the light path between the laser and the fiber. We isolated monosynaptic excitatory inputs from ChR2-expressing axons using tetrodotoxin (TTX, 1 μM, Tocris) and 4-aminopyridine (4-AP, 100 μM, Tocris), and inhibitory currents were blocked by adding PTX in the ACSF. Neurons were held at −70 mV for AMPA EPSC. (A) When the optic fiber was placed parallel to the apical dendrites and moved tangentially along the pial surface, the amplitude of AMPA EPSC decreased with distance from the recording pyramidal cell (ex1 and 2). (B) With the optic fiber placed parallel to the laminar structure, the EPSC amplitude was largest around layer 2. (C) Synaptic currents evoked by stimulation of layer 1 (black trace) and layer 3 (red trace) had slightly different kinetics, with layer 3 synapses showing longer latency and shorter rise time.
Keywords: piriform cortex, anterior olfactory nucleus, recurrent connection, channelrhodopsin-2, calcium imaging, odor processing
Citation: Hagiwara A, Pal SK, Sato TF, Wienisch M and Murthy VN (2012) Optophysiological analysis of associational circuits in the olfactory cortex. Front. Neural Circuits 6:18. doi: 10.3389/fncir.2012.00018
Received: 19 January 2012; Accepted: 26 March 2012;
Published online: 19 April 2012.
Edited by:
Gordon M. Shepherd, Yale University School of Medicine, USAReviewed by:
Donald A. Wilson, New York University School of Medicine, USAPeter Brunjes, University of Virginia, USA
Copyright: © 2012 Hagiwara, Pal, Sato, Wienisch and Murthy. This is an open-access article distributed under the terms of the Creative Commons Attribution Non Commercial License, which permits non-commercial use, distribution, and reproduction in other forums, provided the original authors and source are credited.
*Correspondence: Venkatesh N. Murthy, Department of Molecular and Cellular Biology, Harvard University, 16 Divinity Avenue, Cambridge, MA 02138, USA. e-mail: vnmurthy@fas.harvard.edu
Akari Hagiwara, Faculty of Medicine, Department of Biochemistry, University of Yamanashi, 1110 Shimokato, Chuo, Yamanashi, 409-3898, Japan. e-mail: akarih@yamanashi.ac.jp
† These authors contributed equally to this work