Imaging single photons and intrinsic optical signals for studies of vesicular and non-vesicular ATP release from axons
- Nervous Systems Development and Plasticity Section, National Institute of Child Health and Human Development, National Institutes of Health, Bethesda, MD, USA
The temporal and spatial dynamics of neurotransmitter release are fundamental to understanding activity-dependent signaling between axons and other cells, including neurons, glia, and vascular cells. A microscopic imaging technique is described that enables studying release of the neurotransmitter ATP from axons in response to action potentials. The method combines imaging single-photons, intrinsic optical signal imaging, and high magnification time-lapse microcopy to enable investigations of action potential-induced ATP release together with cell morphology and activity-dependent axon swelling. ATP released from axons catalyzes a chemiluminescent reaction between luciferin and luciferase that generates single photons that can be imaged individually. In addition to vesicular release, ATP release through membrane channels activated by axon swelling was monitored simultaneously with intrinsic optical signals. Repeated emissions of photons were observed from localized 15 μm regions of axons, with a frequency distribution that differed from a normal distribution and from the frequency of emissions outside these localized regions.
Introduction
Intercellular signaling via neurotransmitters and other diffusible molecules regulates a diverse range of functions controlling neurons, glia, and vascular cells in the brain, but the temporal and spatial distribution of relatively few extracellular signaling molecules can be monitored in real time. The spatial and temporal dynamics of extracellular signaling molecules are fundamental to understanding their biological function, making development of methods to obtain such data an important objective.
The common alternative approach is to use fluorescent imaging of second messengers, notably Ca2+, to study cell–cell signaling indirectly in conjunction with manipulating putative extracellular signaling molecules or their membrane receptors. However, this indirect approach is subject to many uncertainties. Direct detection of the neurotransmitter ATP at the low concentrations mediating cell–cell signaling is possible using a specific and highly sensitive chemiluminescence assay. The microscopic technique described here exploits this assay to monitor activity-dependent ATP release from axons in combination with transmitted light microscopy and imaging of intrinsic optical signals that accompanying membrane excitation. This technique provides the ability to obtain temporal and spatial information of vesicular and non-vesicular ATP release from axons firing action potentials in combination with microscopic axon swelling and optical changes in axons accompanying excitation. By monitoring ATP release, this method also could be extended to study vesicular release of other neurotransmitters because ATP is concentrated inside synaptic vesicles (Zimmermann, 1994).
The neurotransmitter ATP is utilized for intercellular signaling by most types of cells in the brain through activation of a large family of membrane receptors for ATP and its breakdown products, ADP, AMP, and adenosine (Fields and Burnstock, 2006). Notably, ATP is the dominant pathway for glial calcium wave propagation (Wang et al., 2000).
Previous studies have shown that ATP is released from axons firing action potentials (Holton, 1959; Su et al., 1971; Stevens and Fields, 2000) and that this signaling regulates development of Schwann cells (Stevens and Fields, 2000; Stevens et al., 2004) and oligodendrocytes (Stevens et al., 2002; Ishibashi et al., 2006) and controls myelination according to impulse activity in premyelinated axons. Myelinating glia are located far from synapses, suggesting that impulse activity releases ATP via other non-synaptic mechanisms, but how ATP is released in an activity-dependent manner from axons was unknown until development of the techniques detailed here (Fields and Ni, 2010).
Recently, volume-activated anion channels (VAAC) that become activated by minute swelling of axons during excitation, have been shown to release ATP from axons firing action potentials (Fields and Ni, 2010). Experiments on astrocytes in co-culture with neurons demonstrated that this non-vesicular release mechanism participates in communicating impulse activity from axons to astrocytes in the absence of synapses.
Cell swelling accompanying electrical excitation is the basis for intrinsic optical signal imaging to monitor neural impulse activity in brain slice (Andrew and MacVicar, 1994; Haller et al., 2001; Asai et al., 2002; Sykova et al., 2003, review see Fields and VanHook, 2010). These optical signals result from changes in light scattering and polarization associated with cell swelling. This method to monitor ATP release from live cells in combination with transmitted light and intrinsic optical signal imaging enables investigation of the temporal and spatial dynamics of ATP release from neurons (and other cells) together with morphological features and changes in cell morphology during electrical excitation.
Alternative Methods for Measuring ATP Concentration
Several methods can be used to measure ATP concentration in biological samples, including electrochemical detection using microelectrodes coated with enzymes requiring ATP (Llaudet et al., 2005), and by monitoring an ATP-specific chemiluminescent assay by luminometry (DeLuca and McElroy, 1978, 1979). ATP-sensitive microelectrodes provide rapid sampling and the ability to monitor ATP concentration deep in the brain in vivo or in brain slice. The threshold sensitivity of ATP assay by microelectrodes (100 nM) is sufficient for many purposes, but it is far less sensitive than chemiluminescent ATP assays and sensitivity using microelectrodes may be insufficient to monitor increases in ATP concentration produced by signaling between cells in close proximity. The ATP-selective microelectrodes are also subject to interference with biological compounds other than ATP, degradation by protein fouling, chemical and electrochemical effects on microelectrode stability, and difficulties in calibration for quantitative measurements. The most significant shortcoming of electrochemical approaches to measure ATP is that they cannot provide cellular and sub-cellular spatial information about ATP release. Achieving this objective would require imaging methods. Single-photon imaging has been used to study ATP release from non-excitable cells (Wang et al., 2000), but it has not been adapted for investigating action potential-induced release of ATP from axons.
Chemiluminescence, the most widely used method of measuring ATP concentration, utilizes the enzyme firefly luciferase and its substrate luciferin (Figure 1). The luciferin/luciferase reaction is extremely sensitive, with a detection limit of 10−18 mol. The light intensity is proportional to ATP concentration linearly over a very broad range of ATP concentrations, and the firefly enzymatic reaction is strictly specific for ATP (DeLuca and McElroy, 1978, 1979). Typically, ATP concentration is measured in samples of conditioned medium added to the luciferin/luciferase reaction mixture in a cuvette and chemiluminescence emission is monitored with a luminometer. Measurements by luminometry provide high sensitivity and specificity, but in comparison with microelectrodes, luminometric assay cannot provide rapid temporal analysis. Analysis of samples of conditioned medium by luminometry represents the net change in ATP concentration produced by the entire population of cells contributing to the sample. Temporal and spatial measurements of ATP release from individual cells are not possible by luminometry, and ATP released during cell–cell signaling may be diluted into the bulk medium to levels that are well below the measurement threshold of the assay.
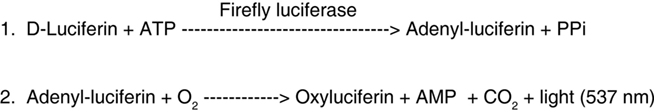
Figure 1. Quantitative measurement of ATP concentration is made possible by using the selective and sensitive firefly luciferin/luciferase reaction for single-photon imaging microscopy.
Single-Photon Imaging
The extremely weak light intensity generated by the luciferin/luciferase reaction in response to the low extracellular concentrations of ATP reached in signaling between cells cannot be detected with conventional video cameras. The standard method of detecting light in digital microscopy is by using a detector (CCD camera typically), which converts light energy into a variable voltage that is directly proportional to incident light intensity. However, so few photons are generated by the luciferin/luciferase reaction at the low concentrations of ATP reached outside axons firing action potentials, that an image cannot be detected with standard methods used for fluorescence microscopy; indeed an image is not formed by the sparse photon emissions. Instead the small number of spatially and temporally separated photons emitted by the ATP-dependent enzymatic reaction must be detected as individual photons. Single-photon events can only be detected with extremely sensitive light detectors such as photomultiplier tubes.
For digital imaging of single-photon events, image intensifiers capable of amplifying extremely low-light levels are required to increase the signal intensity sufficiently for detection by a CCD camera. A typical image intensifier has three components: a photocathode that converts photons into electrons, a microchannel photomultiplier plate that multiplies electron emissions, and a phosphor screen that converts the electrons back into light. Image intensifiers can provide gains of 10,000 to 10 million times.
A CCD camera operated at maximum gain can be used to detect the single-photon events registered on the phosphor screen of the image intensifier. By raising the threshold level of the camera, the discrete single-photon events can be separated from the dark current noise of the CCD camera. At such extremely low-light levels, in which the incident photons are separated in time and space, capturing a continuous image with gray-scale gradation is not possible. The resulting image is not expressed as variations in brightness, but rather as differences in the time and spatial density distribution of the photon emissions, which appear as bright spots on a dark background. At low ATP concentration, only a few light spots appear per second on the output of the phosphor screen, but an image can be obtained by detecting each spot and its position in the frame and integrating several frames over time in image storage memory for display. Counting the number of photon events provides a linear measure of the number of arriving photons and therefore, the concentration of ATP after calibration against known standards. To minimize extraneous photons reaching the detector, experiments must be performed in a dark room with the microscope housed in a light-tight box.
To achieve the objectives of investigating the mechanism of action potential-induced ATP release from axons (and other excitable cells), single-photon imaging microscopy can be combined with transmission light microscopy. By interlacing acquisition of single-photon and transmitted light images and then superimposing the two by post-processing, ATP release can be monitored relative to cellular or sub-cellular morphology. Assembling sequences of such images over time into a time-lapse video enables analysis of changes in ATP release and morphology of cells during excitation. Combining single-photon and transmitted light microscopy also provides the opportunity to obtain images for intrinsic optical signal imaging. By appropriate digital image processing and back-ground subtraction, changes in intensity of light transmitted through axons can be monitored, quantified, and displayed as pseudocolor images. Single-photon measurements of ATP release from axons together with intrinsic optical signaling enables investigation of ATP release associated with axon swelling and micromechanical changes accompanying membrane excitation, hypoxia, osmotic stress, or other conditions.
Intrinsic Optical Signaling
Intrinsic optical signals in axons arise as a consequence of the biophysical basis of membrane excitation. Electrical excitation in nerve fibers is accompanied by many changes in physical properties of axons that closely track the voltage fluctuation during action potential firing. This includes rapid heating and cooling (Abbott et al., 1958; Tasaki and Nakaye, 1985; Tasaki et al., 1989), mechanical displacement of the axon membrane (Hill, 1950; Sandlin et al., 1968; Hill et al., 1977; Iwasa and Tasaki, 1980; Iwasa et al., 1980; Tasaki and Iwasa, 1982; Tasaki and Byrne, 1983, 1984, 1988, 1990; Terakawa, 1983; Mosbacher et al., 1998; Fang-Yen et al., 2004; Kim et al., 2007), and changes in light transmission through axons (Hill and Keynes, 1949; Bryant and Tobias, 1952; Cohen and Keynes, 1968; Tasaki et al., 1968; Cohen et al., 1969, 1970; Salzberg et al., 1985). The rapid changes in light transmission and membrane displacement are caused by transmembrane flux of ions (notably Na+ and Ca2+) and water accompanying the action potential, which is believed to alter the submembrane cytoplasm and osmotic pressure (Bryant and Tobias, 1955; Watanabe, 1986; Tasaki, 1998, 1999; Akkin et al., 2009). Flexoelectric deformation of curved cell membrane can also contribute to membrane displacement during excitation (Brownell et al., 2010). In response to trains of action potentials, axonal swelling increases from the accumulating transmembrane flux of ions and re-distribution of water molecules across the cell membrane (Haller et al., 2001).
Mechanical changes in axons firing action potentials are not limited to cell culture conditions. Previous research has shown physical contraction of the frog spinal cord (Tasaki and Byrne, 1983), dorsal root ganglia (Tasaki and Byrne, 1984), olfactory bulbs (Tasaki and Byrne, 1988), amphibian skin (Tasaki, 1998), invertebrate axons (Hill, 1950; Bryant and Tobias, 1955; Cohen and Keynes, 1968; Iwasa and Tasaki, 1980; Tasaki and Iwasa, 1982; Terakawa, 1983; Akkin et al., 2009), and mammalian neurohypophysis (Salzberg et al., 1985; Kim et al., 2007) after trains of action potentials, and in the squid retina in response to light (Tasaki and Nakaye, 1985). Prior to research showing that ATP is released through VAAC channels activated by action potential-induced axon swelling (Fields and Ni, 2010), the physical phenomena accompanying axon depolarization were not known to have biological significance.
Materials and Methods
Single-Photon Imaging Microscopy
Multi-compartment cultures of mouse DRG neurons were made on glass-bottom dishes (#1 coverslip thickness). The cultures were observed on a Zeiss Axiovert 100 inverted microscope and superfused with balanced saline solution at room temperature containing 40 μg/mL luciferase (Sigma) and 1.5 mg/mL D-luciferin (Sigma). A constant, gentle flow rate of 55 μL/min was maintained using a perfusion pump equipped with a six-way injection valve (Model 7000, Rheodyne Incorporated, CA, USA) to introduce drugs for inhibitor experiments into the superfusion stream with minimal mechanical disturbance of cultures. More stable recordings were obtained by stopping the perfusion briefly during the period of image acquisition.
Photon imaging experiments were conducted in a dark room with the microscope housed inside a light-tight black box to exclude extraneous photons. An oil immersion plan neofluar 40× 1.3 n.a. objective lens was used, and a high-gain, low noise, image intensifier designed for ultra-low-light levels (Hamamatsu C2400-40, Hamamatsu, Bridgewater, NJ, USA) was operated with the intensifier adjusted to maximum gain. The intensifier was coupled through a relay lens to a Hamamatsu CCD video camera, and the signal from the CCD camera was input to a Dage-MTI DSP2000 image processer (DAGE-MTI, Michigan City, IN, USA). The image processor provided high resolution, real-time image processing, frame integration, and storage. The video signal out-put from the signal processer was captured and digitized with a FlashBus frame grabber (Integral Technologies, IN, USA) for analysis using Metamorph and Metafluor image software (Molecular Devices, Sunnyvale, CA, USA). The same software also controlled light shutters and signal routing for image acquisition and illumination.
After signal processing through high-gain amplifiers set near maximum gain and contrast, high-level thresholding of the image was applied to exclude all but single-photon events. Images were acquired at 32 frames/s and integrated (summed) for 1 s.
A transmitted light image was then acquired immediately following the 32 frame integration of single-photon events using the same camera but after rapidly switching off the intensifier to obtain a bright-field image using dim trans-illumination (see IOS method below). Later, bright-field and single-photon images could be combined to correlate the location and density of single-photon events with the microscopic features of the neuron or axon under analysis, or bright-field images were processed for intrinsic optical signals (described below). This acquisition sequence was repeated at 10 s intervals and the digitized images were saved to build a time-lapse video.
The number of photons recorded on each image frame, representing the number of photons accumulated during 1 s, was counted using the automated imaging morphometry analysis software in Metamorph. The photon counts were converted to ATP concentration by calibration against known ATP concentration standards, and the changes in ATP concentration were plotted over time.
Intrinsic Optical Signaling
Intrinsic optical signaling was performed using trans-illumination and methods similar to Andrew and MacVicar (1994). Stable illumination intensity was provided by using a Kepco ATE-15-25M constant current regulated power supply (Kepco Inc., Flushing, NY, USA) in constant power mode to deliver approximately 4 V to a tungsten filament illumination source. The heat filter was removed from the light path to transmit maximal infrared wavelengths, which provide the greatest IOS resulting from light scattering through axons. Two neutral density filters (0.3 and 1.3 n.d.) were used in combination to dim the intensity of illumination through a long-working distance, bright-field condenser. Electronic shutters driven by Metafluor software limited illumination to the 1- to 2-s acquisition period during which 32–64 frames were averaged. Images were acquired every 1–10 s, depending upon the experiment.
The time-lapse images were post-processed for IOS, by back-ground subtraction using an image acquired prior to stimulation, followed by gain and contrast enhancement, and display of images on a pseudocolor scale. Changes in intensity of light transmission through axon fascicles were measured by calculating the mean intensity of pixels in a circular region of interest positioned on several different axon fascicles or cells in the image. Pixel intensity values were expressed as the fractional transmission with respect to the maximum intensity in each experiment to combine data from multiple experiments.
Microscopic Axon Displacement
Axon displacement was detected by increasing the magnification of bright-field images acquired in time-lapse recording by 800% using the digital zoom function in Metamorph. Microscopic axon displacement of axons was imperceptible without post-processing because the changes were small and developed slowly, but they were readily apparent when the time-lapse videos were replayed at high speed. The location of individual pixels in each frame was tracked using the Track Objects function of Metamorph software to obtain a quantitative measure of axon displacement. These changes were near the approximately 0.5 μm resolution of the microscope with the objective lens and long-working condenser used. The X and Y coordinates of a pixel on an axon/fascicle were recorded for each image frame in the time-lapse sequence. To normalize for different orientations of axons in the microscope field, the resultant displacement was calculated (square root of X2 + Y2), and subtracted from the starting location to pool data from several experiments.
Statistical Analysis
Linear regression was by least-squares fitting, and tests of normality in frequency distributions were performed using Anderson–Darling normality test. Student’s t-test was used to compare the significance of difference in means between two-samples in which the data were normally distributed, and Mann–Whitney U non-parametric testing was used for data that were not normally distributed. Calculations were performed using Minitab version 12 (State College, PA, USA) and SigmaPlot version 10 statistical analysis software.
Results
For single-photon imaging microscopy, luciferin and luciferase were added to neuronal cultures and examined using an inverted microscope equipped with an intensified, high-gain video camera capable of detecting single-photon events and appropriate instrumentation and software for controlling image acquisition and analysis. (See Materials and Methods for details.) Primary cultures of mouse DRG neurons were made in multi-compartment cell culture chambers equipped with platinum electrodes for stimulating action potentials in axons as described previously (Fields et al., 1992). Other methods for electrical stimulation of neurons in cell culture could be used.
Electrical excitation of axons was accompanied by a marked increase in the number of single-photon emissions, indicating release of ATP in response to action potentials (Figure 2A). Single-photon imaging revealed that the rise in ATP concentration was delayed by tens of seconds from stimulus onset using 10 Hz stimulation. The latency to the first response was 30 ± 10 s (SEM) and the peak response occurred 49 ± 57 s (SEM) after terminating a 60-s stimulus (p < 0.001 vs. pre-stimulation, n = 11). Calibration of the number of photons against ATP standard solutions (Figures 2E,F) showed that action potential-induced release of ATP reached 1 nM (Figure 2G). These values are much lower than can be detected by ATP-sensitive microelectrodes. The level of ATP recovered to pre-stimulus levels 5–7 min after terminating the stimulus (Figures 2C,G). The declining phase of the ATP response represents multiple processes, including hydrolysis of extracellular ATP by ectoenzymes, re-uptake, and inactivation of the ATP release mechanism.
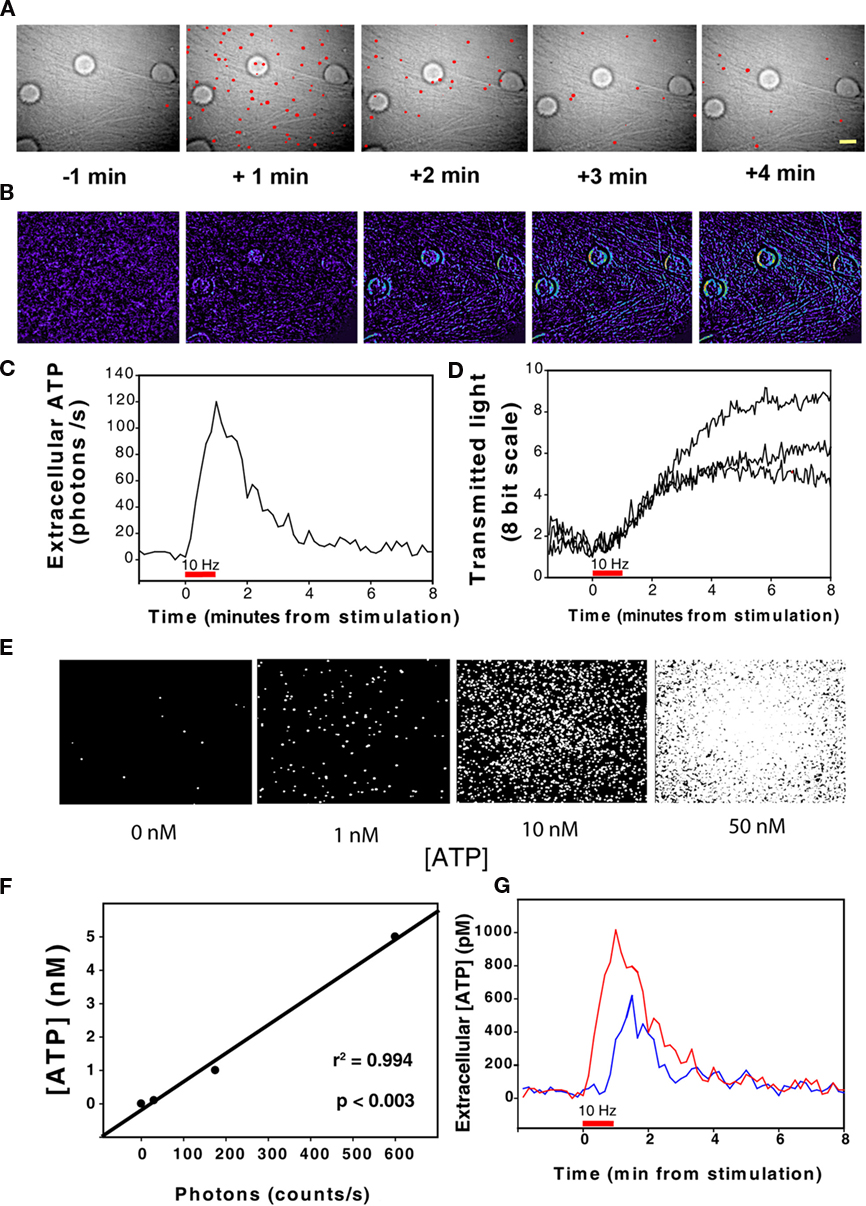
Figure 2. Release of ATP from axons firing action potentials detected by single-photon imaging in combination with transmitted light microscopy and intrinsic optical signal imaging of axon swelling. (A) Axons of mouse dorsal root ganglion (DRG) neurons in multi-compartment cell cultures were stimulated to fire action potentials using 10 Hz stimulation for 60 s (6 V, 0.2 ms pulses). A microscope field containing four neuronal cell bodies on a dense bed of axons is shown. ATP release was detected by single-photon imaging in combination with transmitted light microscopy in cultures containing firefly luciferin and luciferase, utilizing this ATP–dependent chemiluminescence reaction for microscopy. The red spots are single photons detected during 1 s sampling periods. Time is indicated with respect to the onset of electrical stimulation of axons at 10 Hz for 60 s. See Section “Materials and Methods” for details. Scale bar = 20 μm. (B) Intrinsic optical signal imaging interleaved between acquisitions using single-photon imaging indicates cell swelling accompany action potential firing. Activity-dependent swelling of axons decreases light scattering and increases light transmission through axons. Increased light transmission is indicated in warmer colors, and plotted in (D). (C) Quantification of photon emissions over time (representing ATP release) from the experiment shown in (A). The total number of single-photon events in the microscope field collected in 1 s sampling intervals is plotted with respect to stimulus onset. (D) Quantification of the experiment in (B) showing the increase in light transmission through neurons in response to electrical stimulation. Changes in pixel intensity on an 8-bit scale are plotted over time after back-ground subtraction using a pre-stimulus reference image. ATP release [rise to peak as in (C)] was highly correlated with the increase in light transmission through axons (D) (p < 0.0001; r2 = 0.983; n = 12). (E) Single-photon imaging of the luciferin/luciferase reaction provides a quantitative measurement of ATP concentration after calibration against standard ATP solutions. The increase in number of single-photon events is shown in standard solutions of increasing ATP concentrations added to a clean culture dish and imaged as in (A). (F) The number of single-photon events is linearly related to ATP concentration over a wide range of concentrations. (G) The data in (C) re-plotted after calibration against ATP standard solutions shows that action potentials release ATP to reach concentrations near 1 nM (red trace). Action potential-induced ATP release persists in the presence of botulinum toxin (3 nM), indicating that ATP is released in part by non-vesicular mechanisms (blue trace). ATP release was delayed with respect to stimulus onset and the ATP concentration recovered to pre-stimulus levels within several minutes of stopping the stimulus.
Intrinsic optical signal imaging revealed an increase in light transmission through axons, fascicles, and neuronal cell bodies during trains of action potentials at 10 Hz (Figure 2B). The kinetics of increased light transmission (Figures 2B,D) closely paralleled the release kinetics of ATP measured simultaneously by single-photon imaging microscopy in the same cell (Figures 2A,C). The rise to peak concentration of ATP was a linear function of the increase in intrinsic optical signals in neurons stimulated at 10 Hz for 60 s (r2 = 0.983; p < 0.0001, n = 12).
Microscopic axon displacement near the 0.5-μm resolution of the microscope could be measured after further magnification by 8× digital zoom and monitoring by image-tracking software. Axon displacement could be detected with this technique after stimulation with as few as 10 action potentials at 10 Hz (Fields and Ni, 2010). Axon displacement in response to single action potentials has been reported in other experiments using more sensitive and rapid measurement methods, such as atomic force microscopy (Mosbacher et al., 1998; Kim et al., 2007), laser interferometry (Sandlin et al., 1968; Hill et al., 1977; Fang-Yen et al., 2004), optical coherence tomography (Akkin et al., 2007, 2009), and fiberoptic displacement probes and micromechanical displacement sensors (Tasaki, 1998, for review).
Axon displacement and ATP release induced by electrical stimulation require activation of voltage-dependent sodium channels, as both displacement and ATP release are blocked by 1 μM TTX, and these responses can be produced in the absence of electrical stimulation by activating the sodium channels chemically with 2 μM veratridine (Fields and Ni, 2010).
ATP release from axons was not blocked by electrical stimulation in the presence of 3 nM botulinum toxin A, which cleaves the vesicular release protein SNAP-25 (Figure 2G). Botulinum toxin A was added 24 h before experiments and Western blot confirmed enzymatic degradation of SNAP-25 (Fields and Ni, 2010). Four hours of botulinum treatment is sufficient to block neurosecretion from DRG neurons in cell culture for 15 days (Welch et al., 2000). In addition to vesicular release, ATP can be released through several non-vesicular pathways in various types of cells, including through connexin hemi-channels, and ion channels with sufficiently large diameter transmembrane pores (Lazarowski, 2006). Pharmacological blockers of connexin hemi-channels, heptanol, and carbenoxolone, failed to inhibit electrically induced ATP release from DRG axons, but five different chloride channel blockers were effective in inhibiting electrically induced ATP release from axons, with a pharmacological profile consistent with VAAC channels, which are known to release ATP and other small organic anions under osmotic stress in non-excitable cells (Fields and Ni, 2010).
Spatial and Temporal Analysis of ATP Release from Axons
When examined at high magnification, single-photon emissions were observed closely associated with axons and neuronal cell bodies, even though ATP could diffuse from the point of release for up to 10 s during the intervals between sequential acquisitions of single-photon images. Interestingly, time-lapse recording revealed that single photons were often generated repeatedly from the same spots on axons as shown in the montage in Figure 3A and Video S1 in Supplementary Material. The single-photon events from the same location were separated by 10–100 s of seconds (Figure 3C) when observed with sampling interval of 10 s.
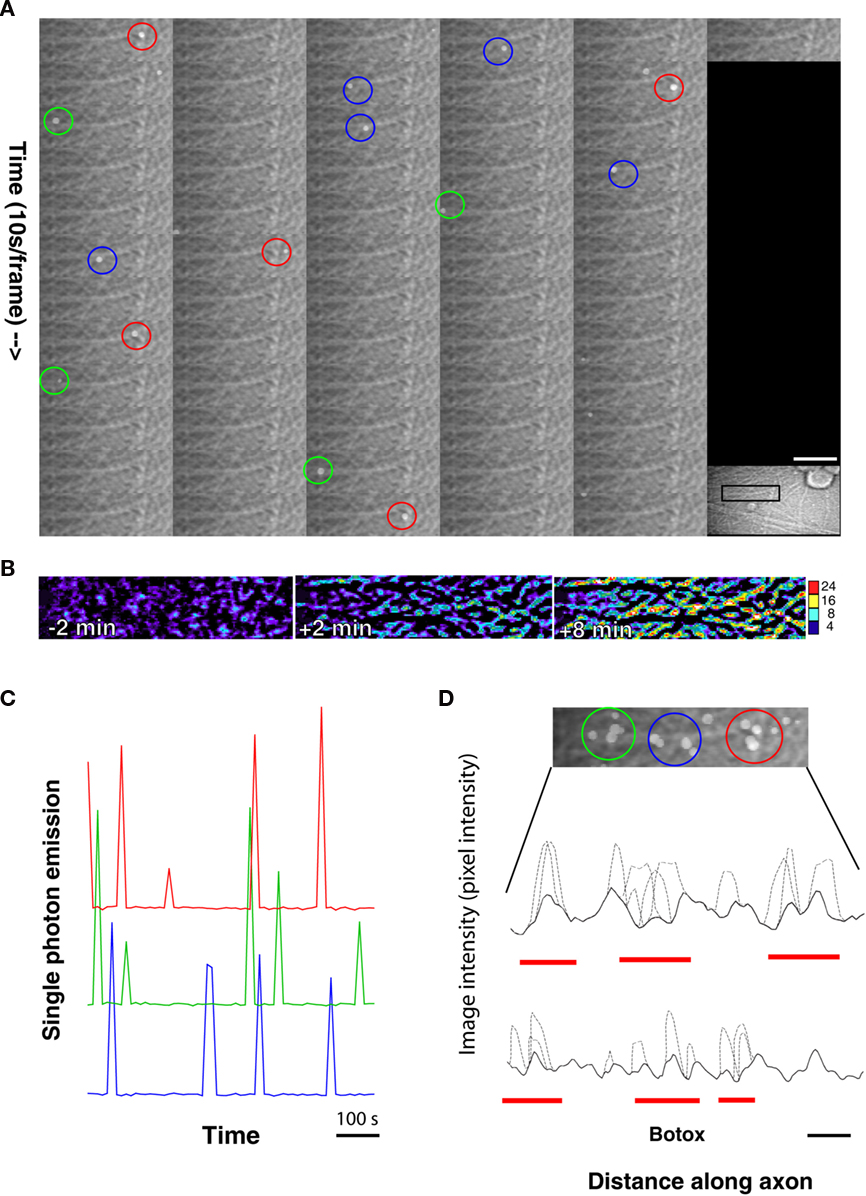
Figure 3. Spatial and temporal dynamics of ATP release from axons firing action potentials. (A) A montage of a time-lapse sequence of single-photon images superimposed on transmitted light images suggests localized sites of repeated ATP release from axons. Images taken at 10 s intervals are shown at high magnification from the microscope field shown in the inset. Scale bar = 23 μm in the montage and 80 μm in the inset. (B) Intrinsic optical signal imaging of the same axon shows an increase in axon swelling, but no obvious correlates with the localized areas of repeated single-photon emissions from axons. Changes in transmitted light intensity are shown on an 8-bit pseudo color scale of pixel intensities. (C) The kinetics of ATP release from localized regions of axons in the 15-μm diameter circular regions of interest shown in (A) are provided by plotting photon emissions over time in colors corresponding to the three regions of interest. Note the repeated release of photons from localized regions of the axon. (D) All 61 images shown in the montage in (A) have been combined to analyze the spatial distribution of single-photon events. Note that the photon emissions over time occur in an uneven distribution along the axon suggesting localized areas of ATP release from axons. A line scan of image intensity along the axon is plotted to that show photon emissions (dotted lines) along the axon are clustered into “hot spots” (red lines). The solid line is the transmitted light intensity profile of the axon. A similar line scan from another experiment shows similar action potential-induced ATP release from axons in the presence of botulinum toxin, which blocks vesicular release. Scale bar (black) = 15 μm (upper line scan) and 9 μm (lower line scan).
The spatial distribution of photon emissions along axons was investigated by measuring the pixel intensity along a line transect placed on individual axons in a composite image formed by superimposing all 61 images collected during a 10-min period (Figure 3D). This revealed an apparently non-uniform distribution of photon emissions along the axon, with localized areas of ATP release (“hot spots”).
The frequency distribution of single-photon events in the localized 15 μm diameter regions of frequent photon emissions (Figure 4A) was significantly different from a normal distribution (R = 0.9437 on a normal probability plot, p < 0.0001, Anderson–Darling normality test, A2 = 3.037). Photons were emitted from hot spots (circular regions of interest of 15 μm in diameter) repeatedly at a mean interval of 95.1 ± 70.18 s (SD); however, the shape of the frequency distribution was multimodal and highly skewed toward shorter intervals. The coefficient of dispersion (CD) was 51.8, which is larger than the CD of 1, characteristic of a Poisson distribution. Further experimentation will be required to determine an explanation for this new observation of potential localized ATP release along axons, and to investigate how they may change during signaling or in association with other cells.
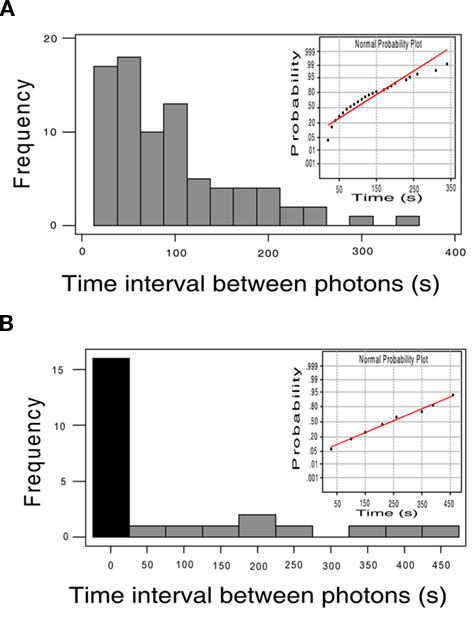
Figure 4. Temporal dynamics of single-photon emissions differ inside and outside localized areas of repeated photon emissions. (A) Repeated emission of photons from localized regions of axons was observed (hot spots). Photon emissions from 15 μm diameter regions of interest appeared at mean intervals of 95.1 ± 70.18 s (SD), but the frequency distribution was multimodal and highly skewed toward shorter intervals. The frequency distribution of photon emissions from hot spots was significantly different from a normal distribution (R = 9.437 on a normal probability plot (shown in inset), A2 = 3.037, p < 0.0001, Anderson–Darling normality test)), and the coefficient of dispersion was 51.8, departing substantially from the CD = 1 of a Poisson distribution. (B) Outside hot spots, photon emissions were much less frequent and the frequency distribution of these events could not be distinguished from a normal distribution. No photon emissions were detected from many 15 μm diameter regions of interest sampled over a period of 10 min (black bar) in the same microscope fields in which hot spots were analyzed. Photons detected from regions outside hot spots appeared at a mean interval of 240 ± 140 s (SD), significantly longer intervals than repeated emissions from within hot spots (p < 0.01 by t-test and p < 0.0001 by Mann–Whitney U non-parametric test). In contrast to the frequency distribution of photon events from within hot spots, outside these regions the normal distribution of photon emissions could not be distinguished from a normal distribution (R = 0.9949 on a normal probability plot (inset), A2 = 0.157, p = 0.925, Anderson–Darling normality test). The coefficient of variation was much lower outside hot spots than inside (CV = 0.583 vs. 8.97).
DRG neurons do not form synapses on other DRG neurons in vivo or in cell culture. Vesicles are commonly seen inside axons by electron microscopy, often accumulating in axonal varicosities. Such vesicles could, in principle, release ATP (and other neurotransmitters) preferentially from discrete locations along the axon, without synaptic specializations. However, the electrically induced release of ATP was not blocked by botulinum toxin, indicating a non-synaptic and non-vesicular mechanism of ATP release. Localized hot spots of ATP release along axons were also observed during stimulation in the presence of botulinum toxin (Figure 3D), suggesting the possibility of localized accumulations of ATP-permeable membrane channels, or localized activation of channels.
No morphological correlates of the ATP release hot spots were evident by transmission light microscopy or intrinsic optical signaling (Figures 3B,D). An alternative explanation for the apparent hot spots could be that they derive from intersections of axons superimposed on one another outside the plane of focus. The apparent repeated release from the same point on axons might also occur by random, but the spatial distribution of multiple photon emissions seems inconsistent with chance events. Many regions of the image had no photon emissions during the 10-min period of observation.
The temporal dynamics of single-photon emissions from these hot spots compared from photons detected from relatively inactive regions of the same microscope field differed markedly (Figure 4B). Outside hot spots, photon events appeared from 15 μm diameter regions of interest at mean intervals of 240 ± 140 s (SD), but many regions experienced no photon events during the 10-min sampling interval. In contrast to single-photon emissions from hot spots, the frequency distribution of single-photon events measured in relatively inactive regions of the same microscope field could not be distinguished from a normal distribution on a probability plot (R = 0.9949, p = 0.925, A2 = 0.157, Anderson–Darling normality test). The coefficient of variation in inter-photon intervals was much lower in regions outside hot spots than inside (CV = 0.583 vs. 8.97).
It appears from differences in these descriptive statistics that the properties of single-photon emissions inside hot spots and outside may differ, not only in the frequency of photon emissions, but also in the probability distribution. This suggests the possibility of different mechanisms affecting the photon events inside and outside hot spots. Definitive interpretations of these differences is not possible because the two areas are necessarily sampled in a non-random manner (by definition), and the relatively few photon events detected outside hot spots provide less information for statistical analysis than is obtained from hot spots. Further studies using additional methods, such as immunocytochemical staining with antibodies against structural proteins, synaptic proteins, and other putative ATP channels or calcium imaging are possible in combination with the techniques described here, and these approaches should provide insight into the phenomenon of apparent localized ATP release.
Discussion
The technique described here of combining single-photon imaging with transmitted light microscopy and analysis of intrinsic optical signals allows the study of ATP neurotransmitter release in combination with changes in axon volume and morphology. The rise in extracellular ATP concentration was linearly related to the swelling of axons monitored by intrinsic optical signaling and by the micro-mechanical displacement of axons. The technique has revealed a new mechanism for activity-dependent neurotransmitter release from axons, and the method will permit further investigations of this phenomenon.
Experiments using this technique show that in addition to vesicular release, the neurotransmitter ATP is released from axons firing action potentials by a mechanism that proceeds after the synaptic-vesicle release protein SNAP-25 is cleaved by botulinum toxin. The release of ATP was observed repeatedly from localized regions of the axon in the presence or absence of botulinum toxin. No morphological correlates of localized photon emissions were evident. The temporal distribution of single-photon events from these regions did not conform well to a Poisson distribution and they deviate significantly from a normal distribution.
Technical Considerations
The extreme sensitivity of the firefly luciferin/luciferase assay for ATP requires that great care must be exercised to avoid contamination, because even small numbers of microbes will contaminate the samples with ATP. Indeed, the chemiluminescent assay is often used to measure bacterial contamination. The use of aseptic technique, including wearing gloves, using sterile pipette tips, reconstituting compounds in sterile-filtered solution in sterile vials and glassware must be followed. Luciferin is easily oxidized in the presence of light and it does not store well in solution. If frozen, 20% degradation with each freeze–thaw cycle is to be expected. Calibration should be checked each day against known ATP standards.
Because ATP is released from cells by mechanical membrane displacement and fluid shear (Burnstock, 1999), mechanical disturbance of cells during handling will release large amounts of ATP. This necessitates care in handling cell cultures, in superfusing cultures, and in changing culture medium. A sufficient period of rest (30 min) undisturbed with constant temperature, pH, and O2/CO2 conditions must be provided prior to measuring ATP release reliably from cells.
The reaction mixture used to measure ATP concentration by luminometry is formulated to provide optimal conditions for the luciferin/luciferase reaction, but in single-photon imaging, the pH and composition of the medium must be maintained to sustain living cells under optimal physiological conditions. These dual requirements can require compromise between the optimal chemical environment for the reaction and the optimal environment for cells. The optimal pH for the luciferin/luciferase reaction is 7.8, but pH 7.4 is suitable. There is negligible shift in emission intensity or excitation within this range, but peak excitation shifts to 620 nm at pH 6.0 (DeLuca and McElroy, 1978). The concentration of Mg2+ must be maintained within 1–10 mM for enzymatic activity, and the optimal temperature for the reaction is 28°C.
A number of compounds can interfere with the luciferin/luciferase assay, either by chemical effects on the reaction or by optical interference with the chemilumenescent assay (by absorbing photons or having chemilumenescent properties). Such interference is a greater problem in single-photon imaging than in ATP assay by luminometry. Although drugs are applied to cells at the same concentration in either case, in luminometry the sample of conditioned medium is diluted 10 times in a reaction mixture that provides optimal conditions for the luciferin/luciferase reaction. This dilution can easily lower the concentration of compounds below levels that interfere with the chemiluminescent assay. High salt concentrations are inhibitory as are SCN−, I−,  and Br−, and Gd3+. Zn2+ shifts the emission spectrum (DeLuca and McElroy, 1978), which will decrease the intensity of fluorescence at the wavelength used to monitor the reaction. For these reasons, the use of KCl to depolarize neurons is problematic. Similarly some blockers of anion channels interfere with the assay. Gd3+, NPPB, chelation of calcium and magnesium, for example, will interfere with single-photon imaging of ATP release using the luciferin/luciferase assay, but these compounds can be used to treat cells and the effects on ATP release measured by luminometry, because the compounds are diluted 10-fold in the reaction assay.
The changes in light transmission through axons and neuronal cell bodies accompanying excitation are very small. This requires a stable light source for transmitted illumination driven by a highly regulated power supply. Movement artifacts, for example from perfusion, will disrupt imaging of intrinsic optical signals, but these effects are readily identified and distinguished from true intrinsic signals by their appearance and by appropriate controls.
Biological Significance and Future Directions
Many types of cells in the nervous system have membrane receptors for ATP, including astrocytes, Schwann cells, oligodendrocytes, endothelial cells, microglia, neuronal cell bodies and dendrites, and progenitor cells (for example NG2 glia, which can give rise to astrocytes, oligodendrocytes, and neurons; Fields and Burnstock, 2006). Vesicular and non-vesicular ATP release from neurons might participate in such diverse functions as activity-dependent effects on development, cell differentiation, vasculature (MacVicar and Salter, 2006) and immune responses or signaling participating in chronic pain (Inoue, 2006; Matsuka et al., 2008; Fields, 2009) in response to neural impulse activity, and in pathological conditions such as spreading cortical depression (Schock et al., 2007), and neuroinflammation (Gourine et al., 2007).
Non-synaptic release of ATP would have a larger and more diverse role than synaptic release, allowing activity-dependent communication between axons, glia, vascular, and other cells that are not coupled together by synapses (Bullock et al., 2005). Non-synaptic mechanisms of activity-dependent communication could enable glial development and function outside synaptic regions to be regulated by axonal firing arising spontaneously in developing neural networks or through environmental experience.
Previous research has shown that action potentials in unmyelinated DRG axons cause the release of ATP from axons which signals to myelinating glia (Schwann cells and oligodendrocytes) to regulate their development and myelination (Stevens and Fields, 2000; Stevens et al., 2002, 2004; Ishibashi et al., 2006). Myelination continues through the first few decades of life and the formation of myelin on unmyelinated axons can be stimulated by impulse activity acting in part by release of ATP along axon segments (Fields, 2010). Myelination of an axon increases impulse conduction velocity roughly 50 times; thus the increased transmission speed will have a significant effect on information processing in that neural circuit (Fields, 2005). Through this mechanism, which involves non-synaptic and non-vesicular ATP release, activity-dependent regulation of myelination could contribute to cognition and learning (Fields, 2010). Abnormalities in activity-dependent myelination could contribute to cognitive dysfunction, including psychiatric illness (Fields, 2008).
This imaging method has wide utility in neuroscience research, because ATP can be released from both excitable and in-excitable cells by many different pathways, including vesicular release and non-vesicular release mechanisms via gap junction hemi-channels and other membrane channels (Beigi et al., 1999; Lazarowski, 2006). In addition to ATP, glutamate and other neurotransmitters can be released by some volume-regulated channels (O’Connor and Kimelberg, 1993; Takano et al., 2005; Sabirov and Okada, 2009), and since high concentrations of ATP are present in synaptic vesicles (Zimmermann, 1994), the imaging method could be useful for monitoring vesicle fusion with the axolemma in non-synaptic regions or at synapses.
In addition to inducing activity-dependent neurotransmitter release from neurons, the activity-dependent swelling of neurons could mediate other forms of cell–cell signaling through activation of other types of stretch-activated channels, interactions between the cytoskeleton and membrane receptors, or intercellular signaling through micromechanical effects on cell adhesion molecules and cell surface molecules interacting with the extracellular matrix. Combining intrinsic optical signaling and time-lapse transmitted light microscopy with single-photon imaging will be useful in exploring the micromechanical effects in cell–cell signaling in combination with neurotransmitter release.
Improvements in the transmitted light imaging, increased rates of image acquisition, and combining single-photon imaging and intrinsic optical signal imaging with fluorescent imaging of intracellular calcium indicators could provide simultaneous live-cell data on morphology, ATP release, and second messenger activation during activity-dependent communication between neurons and other cells.
Conflict of Interest Statement
The author declares that the research was conducted in the absence of any commercial or financial relationships that could be construed as a potential conflict of interest.
Acknowledgments
The author wishes to thank Larry Phillips and Jim Sims, formerly of Universal Imaging Corporation, for technical advice on single-photon imaging instrumentation and software for image acquisition and analysis. This research was supported by NICHD funds for intramural research.
Supplementary Material
The Supplementary Material for this article can be found online at http://www.frontiersin.org/Neuroanatomy/10.3389/fnana.2011.00032/abstract
Video S1. A single-photon imaging experiment showing action potential-induced ATP release from a DRG axon or bundles of axons. The video was constructed from a time-lapse sequence of frames collected at 10 s intervals for 10 min. Stimulation began after 2 min. Note the local areas on the axon where photons are emitted repeatedly.
References
Abbott, B. C., Hill, A. V., and Howarth, J. V. (1958). The positive and negative heat production associated with a nerve impulse. Proc. R. Soc. Lond. B Biol. Sci. 148, 149–187.
Akkin, T., Joo, C., and de Boer, J. F. (2007). Depth-resolved measurement of transient structural changes during action potential propagation. Biophys. J. 93, 1347–1353.
Akkin, T., Landowne, D., and Sivaprakasam, A. (2009). Optical coherence tomography phase measurement of transient changes in squid giant axons during activity. J. Membr. Biol. 231, 35–46.
Andrew, R. D., and MacVicar, B. A. (1994). Imaging cell volume changes and neuronal excitation in the hippocampal slice. Neuroscience 62, 371–383.
Asai, T., Kusudo, K., Ideda, H., and Murase, K. (2002). Intrinsic optical signals in the dorsal horn of rat spinal cord slices elicited by brief repetitive stimulation. Eur. J. Neurosci. 15, 1737–1746.
Beigi, R., Kobatake, E., Aizawa, M., and Dubyak, G. R. (1999). Detection of local ATP release from activated platelets using cell surface-attached firefly luciferase. Am. J. Physiol. 276, C267–C278.
Brownell, W. E., Qian, F., and Anvari, B. (2010). Cell membrane tethers generate mechanical force in response to electrical stimulation. Biophys. J. 99, 845–852.
Bryant, S. H., and Tobias, J. M. (1952). Changes in light scattering accompanying activity in nerve. J. Cell. Comp. Physiol. 40, 199–219.
Bryant, S. H., and Tobias, J. M. (1955). Optical and mechanical concomitants of activity in carcinus nerve I. Effect of sodium azide on the optical response II. Shortening of the nerve with activity. J. Cell. Comp. Physiol. 46, 71–95.
Bullock, T. H., Bennett, M. V., Johnston, D., Josephson, R., Marder, E., and Fields, R. D. (2005). The neuron doctrine, redux. Science 310, 791–793.
Burnstock, G. (1999). Release of vasoactive substances from endothelial cells by shear stress and purinergic mechanosensory transduction. J. Anat. 194, 335–342.
Cohen, L. B., Hille, B., and Keynes, R. D. (1969). Light scattering and birefringence changes during activity in the electric organ of electrophorus. J. Physiol. 203, 489–509.
Cohen, L. B., Hille, B., and Keynes, R. D. (1970). Changes in axon birefringence during the action potential. J. Physiol. 211, 489–509.
Cohen, L. B., and Keynes, R. D. (1968). Evidence for structural changes during the action potential in nerves from the walking legs of Maia squinado. J. Physiol. 194, 85P–86P.
DeLuca, M., and McElroy, W. D. (1978). Purification and properties of firefly luciferase. Meth. Enzymol. 57, 5.
DeLuca, M., and McElroy, W. D. (1979). Factors affecting the kinetics of light emission from crude and purified firefly luciferase. Anal. Biochem. 95, 194–198.
Fang-Yen, C., Chu, M. C., Seung, H. S., Dasari, R. R., and Feld, M. S. (2004). Noncontact measurement of nerve displacement during action potential with a dual-beam low-coherence interferometer. Opt. Lett. 29, 2028–2030.
Fields, R. D. (2005). Myelination: an overlooked mechanism of synaptic plasticity? Neuroscientist 11, 528–531.
Fields, R. D. (2008). White matter in learning, cognition, and psychiatric disorders. Trends Neurosci. 31, 361–370.
Fields, R. D., and Burnstock, G. (2006). Purinergic signalling in neuron-glia interactions. Nat. Rev. Neurosci. 7, 423–436.
Fields, R. D., and Ni, Y. (2010). Nonsynaptic communication through ATP release from volume-activated anion channels in axons. Sci. Signal. 3, ra73.
Fields, R. D., and VanHook, A. M. (2010). Science Signaling Podcast, November 9, 2010. Sci. Signal. 3, 147 pc20.
Fields, R. D., Yu, C., Neale, E. A., and Nelson, P. G. (1992). “Chronic electrical stimulation of multicompartment cell cultures,” in Practical Electrophysiological Methods, Chapter 2.9, eds H. Kettenmann and R. Grantyn (New York: Wiley), 67–76.
Gourine, A. V., Dale, H., Llaudet, E., Poputnikov, D. M., Spyer, K. M., and Gourine, V. N. (2007). Release of ATP in the central nervous system during systemic inflammation: real-time measurement in the hypothalamus of conscious rabbits. J. Physiol. 585, 305–316.
Haller, M., Mironov, S. L., and Richter, D. W. (2001). Intrinsic optical signals in respiratory brain stem regions of mice: neurotransmitters, neuromodulators, and metabolic stress. J. Neurophysiol. 86, 412–421.
Hill, B. C., Schubert, E. D., Nokes, M. A., and Michelson, R. P. (1977). Laser interferometer measurement of changes in crayfish axon diameter concurrent with action potential. Science 196, 426–428.
Hill, D. K. (1950). The volume change resulting from stimulation of a giant nerve fibre. J. Physiol. 111, 304–327.
Hill, D. K., and Keynes, R. D. (1949). Opacity changes in stimulated nerve. J. Physiol. 108, 278–281.
Holton, P. (1959). The liberation of adenosine triphosphate on antidromic stimulation of sensory nerves. J. Physiol. 145, 494–504.
Ishibashi, T., Dakin, K. A., Stevens, B., Lee, P. R., Kozlov, S. V., Stewart, C. L., and Fields, R. D. (2006). Astrocytes promote myelination in response to electrical impulses. Neuron 49, 823–832.
Iwasa, K., and Tasaki, I. (1980). Mechanical changes in squid giant axons associated with production of action potentials. Biochem. Biophys. Res. Commun. 95, 1328–1331.
Iwasa, K., Tasaki, I., and Gibbons, R. C. (1980). Swelling of nerve fibers associated with action potentials. Science 210, 338–339.
Kim, G. H., Kosterin, P., Obaid, A. L., and Salzberg, B. M. (2007). A mechanical spike accompanies the action potential in mammalian nerve terminals. Biophys. J. 92, 3122–3129.
Lazarowski, E. (2006). Regulated release of nucleotides and UDP sugars from astrocytoma cells. Novartis Found. Symp. 276, 73–84.
Llaudet, E., Hatz, S., Droniou, M., and Dale, N. (2005). Microelectrode biosensor for real-time measurement of ATP in biological tissue. Anal. Chem. 77, 3267–3273.
MacVicar, B. A., and Salter, M. W. (2006). Neuroscience: controlled capillaries. Nature 443, 642–643.
Matsuka, Y., Ono, T., Iwase, H., Mitrirattanakul, S., Omoto, K. S., Cho, T., Lam, Y. Y. N., Snyder, B., and Spigelman, I. (2008). Altered ATP release and metabolism in dorsal root ganglia of neuropathic rats. Mol. Pain 4, 66.
Mosbacher, J., Langer, M., Horber, J. K. H., and Sachs, F. (1998). Voltage-dependent membrane displacements measured by atomic force microscopy. J. Gen. Physiol. 111, 65–74.
O’Connor, E. R., and Kimelberg, H. K. (1993). Role of calcium in astrocyte volume regulation and in the release of ions and amino acids. J. Neurosci. 13, 2638–2650.
Sabirov, R. A., and Okada, Y. (2009). The maxi-anion channel: a classical channel playing novel roles through an unidentified molecular entity. J. Physiol. Sci. 59, 3–21.
Salzberg, B. M., Obaid, A. L., and Gainer, H. (1985). Large and rapid changes in light scattering accompany secretion by nerve terminals in the mammalian neurohypophysis. J. Gen. Physiol. 86, 395–411.
Sandlin, R., Lerman, L., Barry, W., and Tasaki, I. (1968). Application of laser interferometry to physiological studies of excitable tissues. Nature 217, 575–576.
Schock, S. C., Munyao, N., Yakubchyk, Y. I., Sabourin, L. A., Hakim, A. M., Ventureyra, E. C. G., and Thompson, C. S. (2007). Cortical spreading depression releases ATP into the extracellular space and purinergic receptor activation contributes to the induction of ischemic tolerance. Brain Res. 1168, 129–138.
Stevens, B., and Fields, R. D. (2000). Response of Schwann cells to action potentials in development. Science 287, 2267–2271.
Stevens, B., Ishibashi, T., Chen, J.-F., and Fields, R. D. (2004). Adenosine: an activity-dependent axonal signal regulating MAP kinase and proliferation in developing Schwann cells. Neuron Glia Biol. 1, 23–34.
Stevens, B., Porta, S., Haak, L. L., Gallo, V., and Fields, R. D. (2002). Adenosine: a neuron-glial transmitter promoting myelination in the CNS in response to action potentials. Neuron 36, 855–868.
Su, C., Bevan, J. A., and Burnstock, G. (1971). [3H]adenosine triphosphate: release during stimulation of enteric nerves. Science 173, 336–338.
Sykova, E., Vargova, L., Kubinova, S., Jendelova, P., and Chvatal, A. (2003). The relationship between changes in intrinsic optical signals and cell swelling in rat spinal cord slices. Neuroimage 18, 214–230.
Takano, T., Kang, J., Jaiswal, J. K., Simon, S. M., Lin, J. H.-C., Uy, Y., Li, Y., Yang, J., Dienel, G., Zielke, H. R., and Nedergaard, M. (2005). Receptor-mediated glutamate release from volume sensitive channels in astrocytes. Proc. Natl. Acad. Sci. U.S.A. 102, 16466–16471.
Tasaki, I. (1998). Repetitive mechanical responses of the amphibian skin to adrenergic stimulation. Jpn. J. Physiol. 48, 297–300.
Tasaki, I. (1999). Rapid structural changes in nerve fibers and cells associated with their excitation processes. Jpn. J. Physiol. 49, 125–138.
Tasaki, I., and Byrne, P. M. (1983). Swelling of frog dorsal root ganglion and spinal cord produced by afferent volley of impulses. Brain Res. 272, 360–363.
Tasaki, I., and Byrne, P. M. (1984). Mechanical changes in the amphibian spinal cord produced by afferent volleys of nerve impulses. Brain Res. 301, 265–272.
Tasaki, I., and Byrne, P. M. (1988). Large mechanical changes in the bullfrog olfactory bulb evoked by afferent fiber stimulation. Brain Res. 475, 173–176.
Tasaki, I., and Byrne, P. M. (1990). Volume expansion of nonmyelinated nerve fibers during impulse conduction. Biophys. J. 57, 633–635.
Tasaki, I., and Iwasa, K. (1982). Rapid pressure changes and surface displacements in the squid giant axon associated with production of action potentials. Jpn. J. Physiol. 32, 69–81.
Tasaki, I., Kusano, K., and Byrne, P. M. (1989). Rapid mechanical and thermal changes in the garfish olfactory nerve associated with a propagated impulse. Biophys. J. 55, 1033–1040.
Tasaki, I., and Nakaye, T. (1985). Heat generated by the dark-adapted squid retina in response to light pulses. Science 227, 654–655.
Tasaki, I., Watanabe, A., Sandlin, R., and Carnay, L. (1968). Changes in fluorescence, turbidity, and birefringence associated with nerve excitation. Proc. Natl. Acad. Sci. U.S.A. 61, 883–888.
Terakawa, S. (1983). Changes in intracellular pressure in squid giant axons associated with production of action potentials. Biochem. Biophys. Res. Commun. 114, 1006–1010.
Wang, Z., Haydon, P. G., and Yeung, E. S. (2000). Direct observation of calcium-independent intercellular ATP signaling in astrocytes. Anal. Chem. 72, 2001–2007.
Watanabe, A. (1986). Mechanical, thermal, and optical changes of nerve membrane associated with excitation. Jpn. J. Physiol. 36, 625–643.
Welch, M. J., Purkiss, J. R., and Foster, K. A. (2000). Sensitivity of embryonic rat dorsal root ganglia neurons to Clostridium botulinum neurotoxins. Toxicon 38, 245–258.
Keywords: neuron–glia interactions, axon volume, intrinsic optical signals, activity-dependent development, synaptic-vesicle release, neurotransmitter release, axon swelling, luciferase
Citation: Fields RD (2011) Imaging single photons and intrinsic optical signals for studies of vesicular and non-vesicular ATP release from axons. Front. Neuroanat. 5:32. doi: 10.3389/fnana.2011.00032
Received: 22 April 2011; Accepted: 26 May 2011;
Published online: 06 June 2011.
Edited by:
Patrik Brundin, Nordic Center of Excellence, NorwayReviewed by:
Henry Markram, École Polytechnique Fédérale de Lausanne, SwitzerlandPatrik Brundin, Nordic Center of Excellence, Norway
Copyright: © 2011 Fields. This is an open-access article subject to a non-exclusive license between the authors and Frontiers Media SA, which permits use, distribution and reproduction in other forums, provided the original authors and source are credited and other Frontiers conditions are complied with.
*Correspondence: R. Douglas Fields, Nervous System Development and Plasticity Section, National Institute of Child Health and Human Development, National Institutes of Health, Building 35, Room 2A211, MSC 3713, 35 Lincoln Drive, Bethesda, MD 20892, USA. e-mail: fieldsd@mail.nih.gov