An agonist–antagonist cerebellar nuclear system controlling eyelid kinematics during motor learning
- 1División de Neurociencias, Universidad Pablo de Olavide, Sevilla, Spain
- 2Instituto Nacional de Psiquiatría Ramón de la Fuente Muñiz, DF, Mexico
The presence of two antagonistic groups of deep cerebellar nuclei neurons has been reported as necessary for a proper dynamic control of learned motor responses. Most models of cerebellar function seem to ignore the biomechanical need for a double activation–deactivation system controlling eyelid kinematics, since most of them accept that, for closing the eyelid, only the activation of the orbicularis oculi (OO) muscle (via the red nucleus to the facial motor nucleus) is necessary, without a simultaneous deactivation of levator palpebrae motoneurons (via unknown pathways projecting to the perioculomotor area). We have analyzed the kinetic neural commands of two antagonistic types of cerebellar posterior interpositus neuron (IPn) (types A and B), the electromyographic (EMG) activity of the OO muscle, and eyelid kinematic variables in alert behaving cats during classical eyeblink conditioning, using a delay paradigm. We addressed the hypothesis that the interpositus nucleus can be considered an agonist–antagonist system controlling eyelid kinematics during motor learning. To carry out a comparative study of the kinetic–kinematic relationships, we applied timing and dispersion pattern analyses. We concluded that, in accordance with a dominant role of cerebellar circuits for the facilitation of flexor responses, type A neurons fire during active eyelid downward displacements—i.e., during the active contraction of the OO muscle. In contrast, type B neurons present a high tonic rate when the eyelids are wide open, and stop firing during any active downward displacement of the upper eyelid. From a functional point of view, it could be suggested that type B neurons play a facilitative role for the antagonistic action of the levator palpebrae muscle. From an anatomical point of view, the possibility that cerebellar nuclear type B neurons project to the perioculomotor area—i.e., more or less directly onto levator palpebrae motoneurons—is highly appealing.
Introduction
The deep cerebellar nuclei are the exclusive source of cerebellar output to red nucleus, thalamus, and inferior olive after integrating inhibitory inputs from cerebellar cortical Purkinje cells with excitatory inputs from spinal cord and brainstem sources. Most models of cerebellar function assume a simple neural activation system controlling eyelid kinematics during motor learning—i.e., a simple dynamic association between the firing activity of neurons in cerebellar cortical and/or interpositus nucleus and the proper performance of conditioned eyelid responses. However, the neural and biomechanical complexity of the different forms of cerebellar learning, call this assumption into question (Ito, 1984; Welsh and Harvey, 1991; Krupa et al., 1993; Llinás and Welsh, 1993; Mauk, 1997; Hesslow and Yeo, 1998; Bracha et al., 2001; Delgado-García and Gruart, 2002; Morcuende et al., 2002; Christian and Thompson, 2003; Freeman and Steinmetz, 2011). Indeed, the different functional types of cerebellar nuclei neurons (Gruart and Delgado-García, 1994; Gruart et al., 1997, 2000a; Chen and Evinger, 2006) and eyelid movements (Evinger et al., 1991; Gruart et al., 1995; Pellegrini and Evinger, 1995; Gruart et al., 2000b) increase the difficulty to understand the role of the cerebellum in motor learning.
A simple eyelid blink involves an integrated biomechanical system of inertial, elastic, and viscous elements, and three active muscular forces in a motor sequence of activation–deactivation of the orbicularis oculi (OO) and levator palpebrae superioris (LPS) muscles. In addition, in those species with a third eyelid, there is the active contraction of the retractor bulbi muscle as well as a pressure force produced by eye retraction into the ocular orbit that squeezes the Harder's gland and passively displaces the attached nictitating membrane (NM) over the cornea (Berthier and Moore, 1990; Berthier et al., 1991; Bartha and Thompson, 1992a,b; Evinger and Manning, 1993; Lepora et al., 2007, 2009; Mavritsaki et al., 2007). The neural complexity of this motor sequence is also evident by the synergistic contributions of the recruited motor [RB motoneurons (Mns), OO Mns, and LPS Mns located in the accessory abducens, facial, and oculomotor nuclei, respectively] and premotor [the action of cerebellar interpositus nucleus via the red nucleus] neuronal units (McCormick and Thompson, 1984; Berthier and Moore, 1990; Gruart and Delgado-García, 1994; Pellegrini et al., 1995; Trigo et al., 1999; Morcuende et al., 2002; Delgado-García and Gruart, 2002, 2005; Chen and Evinger, 2006). In addition, some authors suggest that the globe retraction into the ocular orbit and NM extension over the cornea, as well as the angular displacement of the eyelid on the ocular globe, should be modeled as a linked non-linear system with a more-biophysically based set of equations (Huxley, 1957; Hung et al., 1977; Trigo et al., 2003; Sánchez-Campusano et al., 2003), simultaneously taking into account the relative contributions of eyelid and eye-retraction motor systems to reflex and classically conditioned blink responses, as reported in studies carried out in the rabbit (McCormick et al., 1982; Leal-Campanario et al., 2004).
Recordings of deep cerebellar nucleus neurons during the conditioned eyelid paradigm suggest that interpositus neurons (IPns) facilitate eyelid closure of conditioned and reflex blinks (Gruart et al., 2000a; Porras-García et al., 2010; Campolatarro et al., 2011; Freeman and Steinmetz, 2011). A series of careful experimental studies of eyelid conditioning in behaving cats carried out in our laboratory reveals two types of blink-related IPn—one (labeled type A) that increases its instantaneous firing frequency with the beginning of an eyelid response, and a second type (labeled type B) that decreases its instantaneous firing frequency during the performance of the eyelid responses (Gruart et al., 1997, 2000a; Delgado-García and Gruart, 2002, 2005; Jiménez-Díaz et al., 2004). Those authors interpret the type A IPns as facilitating the OO muscle during eyelid closing, and the type B IPns as promoting activation of the LPS muscle during eyelid opening. In recent studies (Sánchez-Campusano et al., 2007, 2009, 2011a,b), we have worked on integrating the experimental and analytical approaches for a better understanding of the relationships between the kinetic neural commands and the performance (kinematics) of learned eyelid responses. In those works, we have re-analyzed (with an exhaustive analytical approach) the firing activities of only type A cerebellar posterior IPns and OO Mns in alert behaving cats during classical eyeblink conditioning, using a delay paradigm.
Accordingly, we decided to investigate in detail the firing properties of type B IPns (i.e., the neurons that pause during any active downward displacement of the upper eyelid) in comparison with the firing properties of type A IPns (i.e., the neurons that exert a reinforcing-modulating action, via the red nucleus, on OO Mns during the closing of the eyelid), with the help of timing and time-dispersion pattern analyses, as well as raster and 3D representations in the time and frequency domains. Here, we present some functional evidence that the presence of two antagonistic groups of deep cerebellar nuclei neurons is necessary for a proper dynamic control (proper timing and kinetic–kinematic characterization) of eyelid movements.
Materials and Methods
Experimental Subjects
Experiments were carried out with eight adult cats (weighing 2.1–3.2 kg) obtained from an authorized supplier (Iffa-Credo, Arbresle, France). The experiments were conducted in accordance with the guidelines of the European Union (86/609/EU, 2003/65/EU) and Spanish regulations (BOE 252/34367–91, 2005) for the use of laboratory animals in chronic studies and were approved by the Institution Committee for animal care and handling. Selected data collected from these animals have been analyzed for studies of the firing activities of OO Mns (Trigo et al., 1999) and type A and B IPns (Gruart et al., 2000a; Delgado-García and Gruart, 2002, 2005). In the present study, we will concentrate on the comparative analysis (using the cumulative neural integration method, time-intensity dispersion models, multiple parametric evolutions, and raster and 3D representations in the time and frequency domains) of the neuronal firing patterns of the two types of identified cerebellar posterior IPn (types A and B) conforming an agonist–antagonist cerebellar nuclear system for the dynamic control of learned eyelid responses.
Surgical Procedures
Animals were anesthetized with sodium pentobarbital (35 mg/kg, i.p.) following a protective injection of atropine sulfate (0.5 mg/kg, i.m.) to prevent unwanted vagal responses. Animals were implanted with a search coil (five turns, 3 mm in diameter) in the center of the left upper eyelid, at ≈2 mm from the lid margin. The coil was made from Teflon-coated multi-stranded stainless steel wire (50 μm external diameter). Coils weighed ≈1.5% of the cat's upper lid weight and did not impair eyelid responses. Animals were also implanted in the ipsilateral OO muscle with bipolar hook electrodes aimed for electromyographic (EMG) recordings. These electrodes were made from the same wire as the coils, and bared 1 mm at their tips.
Four subjects were prepared for the chronic recording of antidromically identified left posterior IPns: a bipolar stimulating electrode, made from 200 μm enamel-coated silver wire, was implanted in the magnocellular division of the right (contralateral) red nucleus following stereotaxic coordinates (Berman, 1968). For comparative purposes, the other four experimental subjects were prepared for the chronic recording of antidromically identified facial Mns projecting to the OO muscle: two stainless steel hook electrodes were implanted on the zygomatic subdivision of the left facial nerve, 1–2 mm posterior to the external canthus (see Figure 1A). In each experimental subject, a recording window (5 × 5 mm) was opened in the occipital bone to allow access to the cerebellar posterior interpositus nucleus or facial nucleus. The dura mater was removed, and an acrylic chamber was constructed around the window. The cerebellar surface was protected with a piece of silicone sheet and sterile gauze, and covered with a plastic cap. Finally, animals were provided with a head-holding system for stability and proper references of eyelid coil and recording systems. All the implanted electrodes were soldered to a socket fixed to the holding system. A detailed description of this chronic preparation can be found elsewhere (Trigo et al., 1999; Gruart et al., 2000a; Sánchez-Campusano et al., 2007).
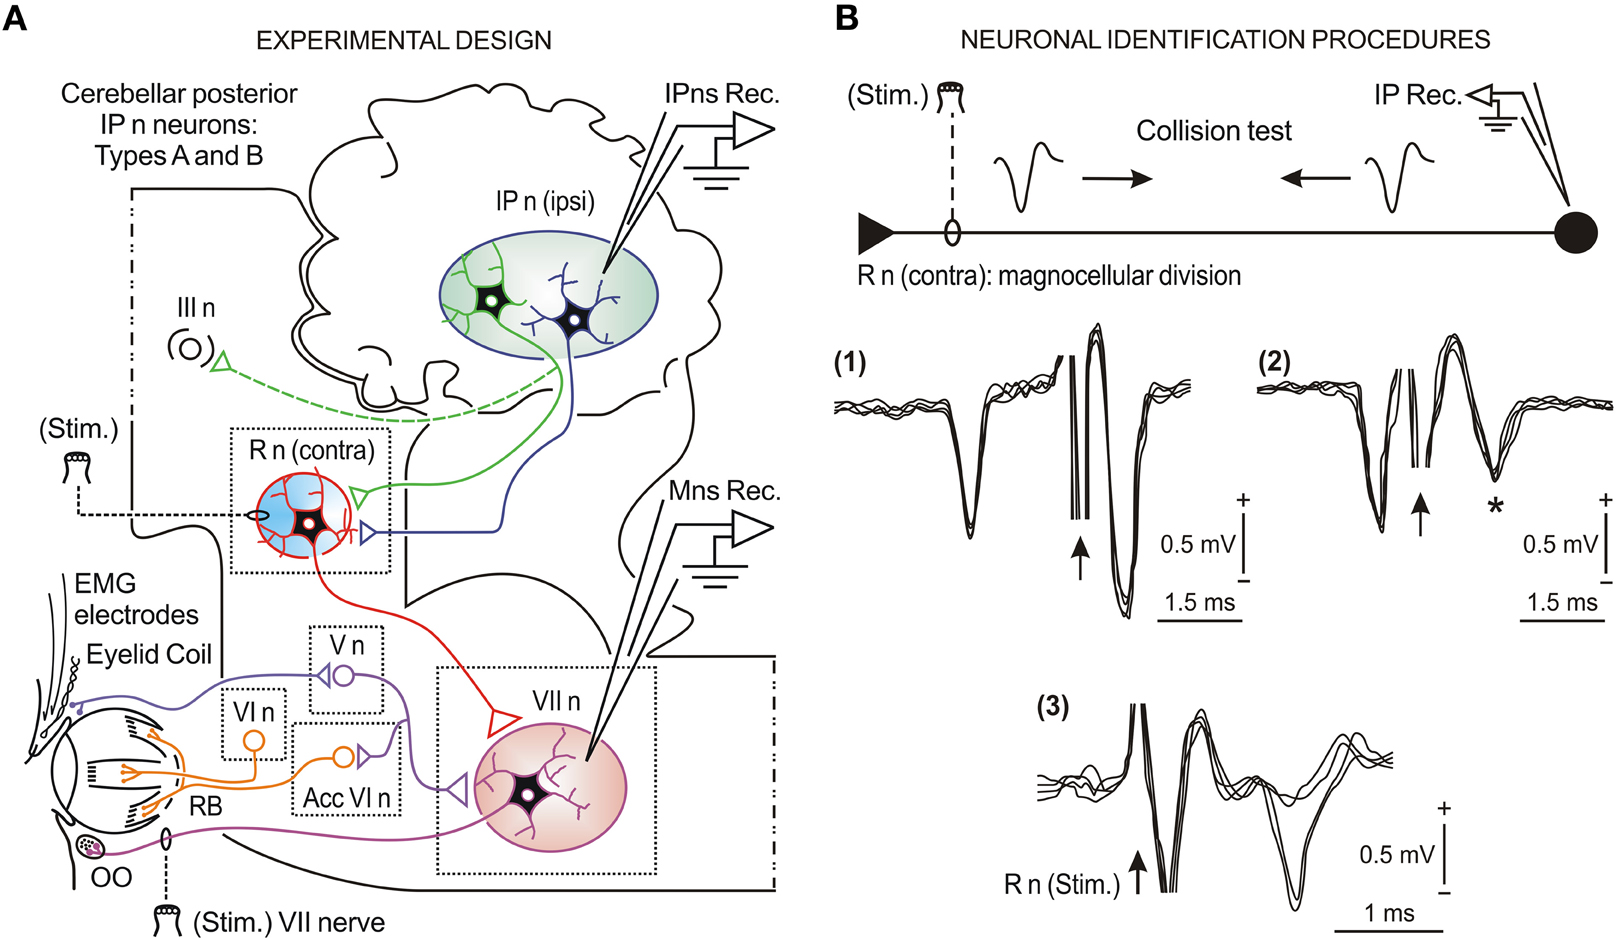
Figure 1. Schematic representation of the experimental design and neuronal identification procedures. (A) Diagram illustrating the stimulating (Stim.) and recording (Rec.) sites, as well as the eyelid coil and EMG electrodes implanted in the upper eyelid. The eyelid kinematics were estimated from the direct recording of the eyelid position by the magnetic field search-coil technique. Kinetic neuronal commands were obtained from the firing activities of antidromically identified neurons (types A and B) located in the ipsilateral cerebellar posterior interpositus nucleus (IP n) and from orbicularis oculi (OO) motoneurons (Mns) located in the facial nucleus (VII n). Abbreviations: R n, red nucleus; III n, oculomotor complex; V n, trigeminal nucleus; VI n, abducens nucleus; Acc VI n, accessory abducens nucleus; RB, retractor bulbi muscle. (B) Collision test [(1) and (2)] of type A and antidromic identification (3) of type B interpositus neurons (IPns) activated from the contralateral R n stimulating electrode. The arrows indicate the stimulus artifact. The asterisk in (2) indicates that with a stimulus latency of < 0.5 ms the amplitude of the field potential decreased due to the collision of the antidromic spike. Similar procedures were applied for the identification of OO Mns activated from the VII nerve stimulating electrode.
Recording and Stimulation Techniques
Eyelid kinematics was recorded with the magnetic field search-coil technique (Gruart et al., 1995). The gain of the recording system was set at 1 V = 10°. The EMG activity of the OO muscle was recorded with differential amplifiers at a bandwidth of 0.1–10 kHz. Neural commands (action potentials and neural firing rates) were recorded in facial and interpositus nuclei with the help of glass micropipettes filled with 2 M NaCl (3–6 MΩ of resistance) using a NEX-1 preamplifier (Biomedical Engineering Co., Thornwood, NY, USA). Neuronal identification techniques, such as antidromic activation (for type B IPns) and collision test (for type A IPns), are illustrated in Figure 1B [see sub-panels (1), (2), and (3)]. For the antidromic activation of recorded neurons, we used single or double (interval of 1–2 ms) cathodal square pulses (50 μs in duration) with current intensities <300 μA. Identification procedures have been described in detail for facial Mns (Trigo et al., 1999) and posterior IPns (Gruart et al., 2000a; Jiménez-Díaz et al., 2004; Sánchez-Campusano et al., 2007). Only antidromically identified posterior IPns and OO Mns have been included and analyzed in this study.
Classical Eyeblink Conditioning
The generation of eyelid conditioned responses (CRs) is a slow process requiring a large number of paired conditioned stimulus (CS)/unconditioned stimulus (US) presentations, as we have already described for mice (Domínguez-del-Toro et al., 2004; Gruart et al., 2006; Porras-García et al., 2010), rats (Valenzuela-Harrington et al., 2007; Fernández-Lamo et al., 2009), rabbits (Gruart et al., 2000b; Leal-Campanario et al., 2007), and cats (Gruart et al., 1995, 2000a; Trigo et al., 1999; Sánchez-Campusano et al., 2007). In this study, classical eyeblink conditioning was achieved by the use of a delay conditioning paradigm (see the general structure of the conditioning protocol in Figure 2A). A tone (370 ms duration, 600 Hz frequency, and 90 dB intensity) was used as CS. The tone was followed 270 ms from its onset by an air puff (100 ms duration and 3 kg/cm2 pressure) directed at the left cornea as US. Thus, the CS and the US terminated simultaneously. Tones were applied from a loudspeaker located 80 cm below the animal's head. Air puffs were applied through the opening of a plastic pipette (3 mm in diameter) located 1 cm away from the left cornea.
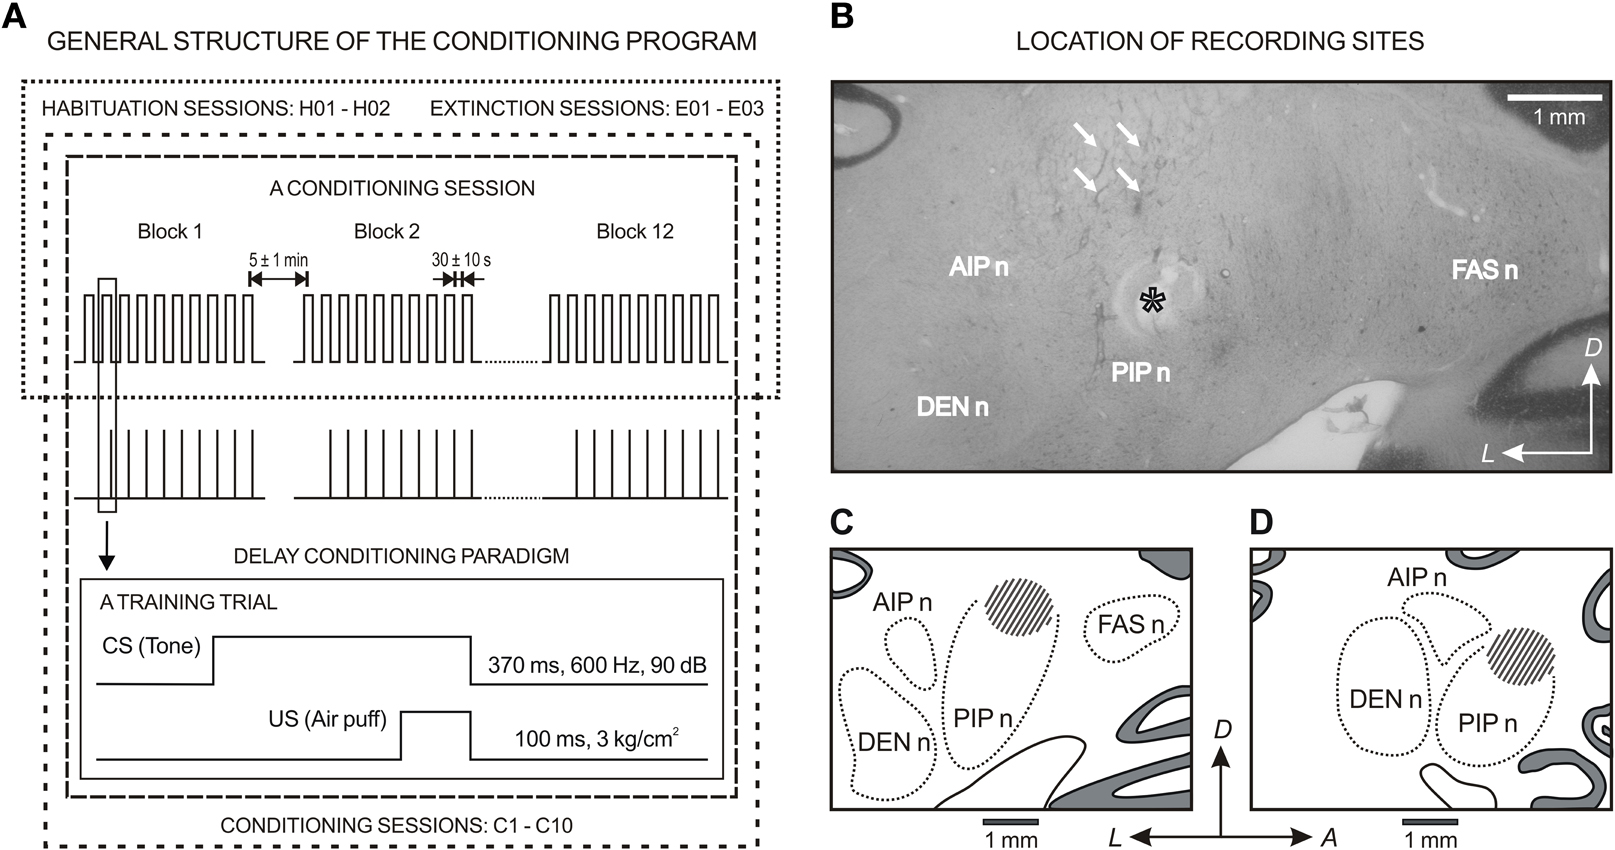
Figure 2. General structure of the conditioning program and location of the recording sites. (A) For classical conditioning of eyelid responses, the experimental animals underwent a sequence of habituation, conditioning, and extinction sessions. In all cases, the session consisted of 12 blocks separated by a varying (5 ± 1 min) interval. Each block consisted of 10 trials separated by intervals of 30 ± 10 s. The conditioned stimulus (CS) was presented alone during habituation and extinction sessions. Classical conditioning responses (CRs) were evoked with the help of a delay paradigm. For this, a tone (370 ms, 600 Hz, 90 dB) was used as CS. The tone was followed 270 ms from its onset by an air puff (100 ms, 3 kg/cm2) directed at the left cornea as an unconditioned stimulus (US). (B) A photomicrograph of a coronal section through deep cerebellar nuclei illustrating several recording tracts (arrows) and an electrolytic mark (asterisk) below recording sites. (C) and (D) are the coronal and sagittal reconstruction of recording sites (dashed area), respectively. (B) and (C) correspond to the coronal plane P10, and (D) corresponds to the sagittal plane L5.6 according to the atlas of Berman (1968). Calibration bar: 1 mm. Abbreviations: DEN n, dentate nucleus; FAS n, fastigial nucleus; AIP n and PIP n, anterior and posterior interpositus nucleus; A, anterior; D, dorsal; L, lateral.
Each animal followed a sequence of two habituation, 10 conditioning, and three extinction sessions. A conditioning session consisted of 12 blocks separated by a variable (5 ± 1 min) interval. Each block comprised 10 trials separated by intervals of 30 ± 10 s. Within each block, the CS was presented alone during the first trial—i.e., it was not followed by the US. A complete conditioning session lasted for ≈2 h. The CS was presented alone during habituation and extinction sessions for the same number of blocks per session and trials per block and with similar random inter-block and inter-trial distributions (see Figure 2A).
Histology
At the end of the recording sessions, animals were deeply re-anesthetized (50 mg/kg sodium pentobarbital, i.p.). Electrolytic marks were placed in selected recording sites with a tungsten electrode (1 mA for 30 s). Animals were perfused transcardially with saline and phosphate-buffered formalin. The brain was removed, the anastomosed side was marked and the brainstem and the overlying cerebellum were cut in 50 mm coronal serial sections with the help of a vibratome (WT1000, Leica Microsystems GmbH, Wetzlar, Germany). Serial sections (50 μm) including the cerebellum and the brainstem were mounted on glass slides and stained with toluidine blue or cresyl violet for confirmation of the recording sites (see a photomicrograph of a coronal section through deep cerebellar nuclei and the coronal and sagittal reconstruction of recording sites, Figure 2B). Site locations have been described in detail for posterior IPns (Gruart and Delgado-García, 1994; Gruart et al., 2000a) and facial Mns (Trigo et al., 1999).
Data Collection and Analysis
Eyelid position, EMG activity of the OO muscle, neuronal activity recorded in facial and cerebellar interpositus nuclei, and rectangular pulses corresponding to CS and US presentations, were stored digitally on a computer, using an analog-digital converter (CED 1401 Plus; Ceta Electronic Design, Cambridge, UK). Commercial computer programs (Spike 2 and SIGAVG; Ceta Electronic Design) were employed for acquisition and on-line conventional analyses. The detailed procedures (including spike detection and sorting, multi-parametric cluster technique, timing correlate, circular time-intensity dispersion method, and frequency domain analysis using the fast Fourier transform), as well as quantification and representation programs were developed by two of us (Raudel Sánchez Campusano and Rodrigo Fernández-Mas) with the help of MATLAB routines (The MathWorks, Natick, MA, USA) and a representation script written in Java language. Only data from successful experiments (i.e., those that allowed a complete study with an appropriate functioning of both recording and stimulating systems) were computed and analyzed (see Figure 3A).
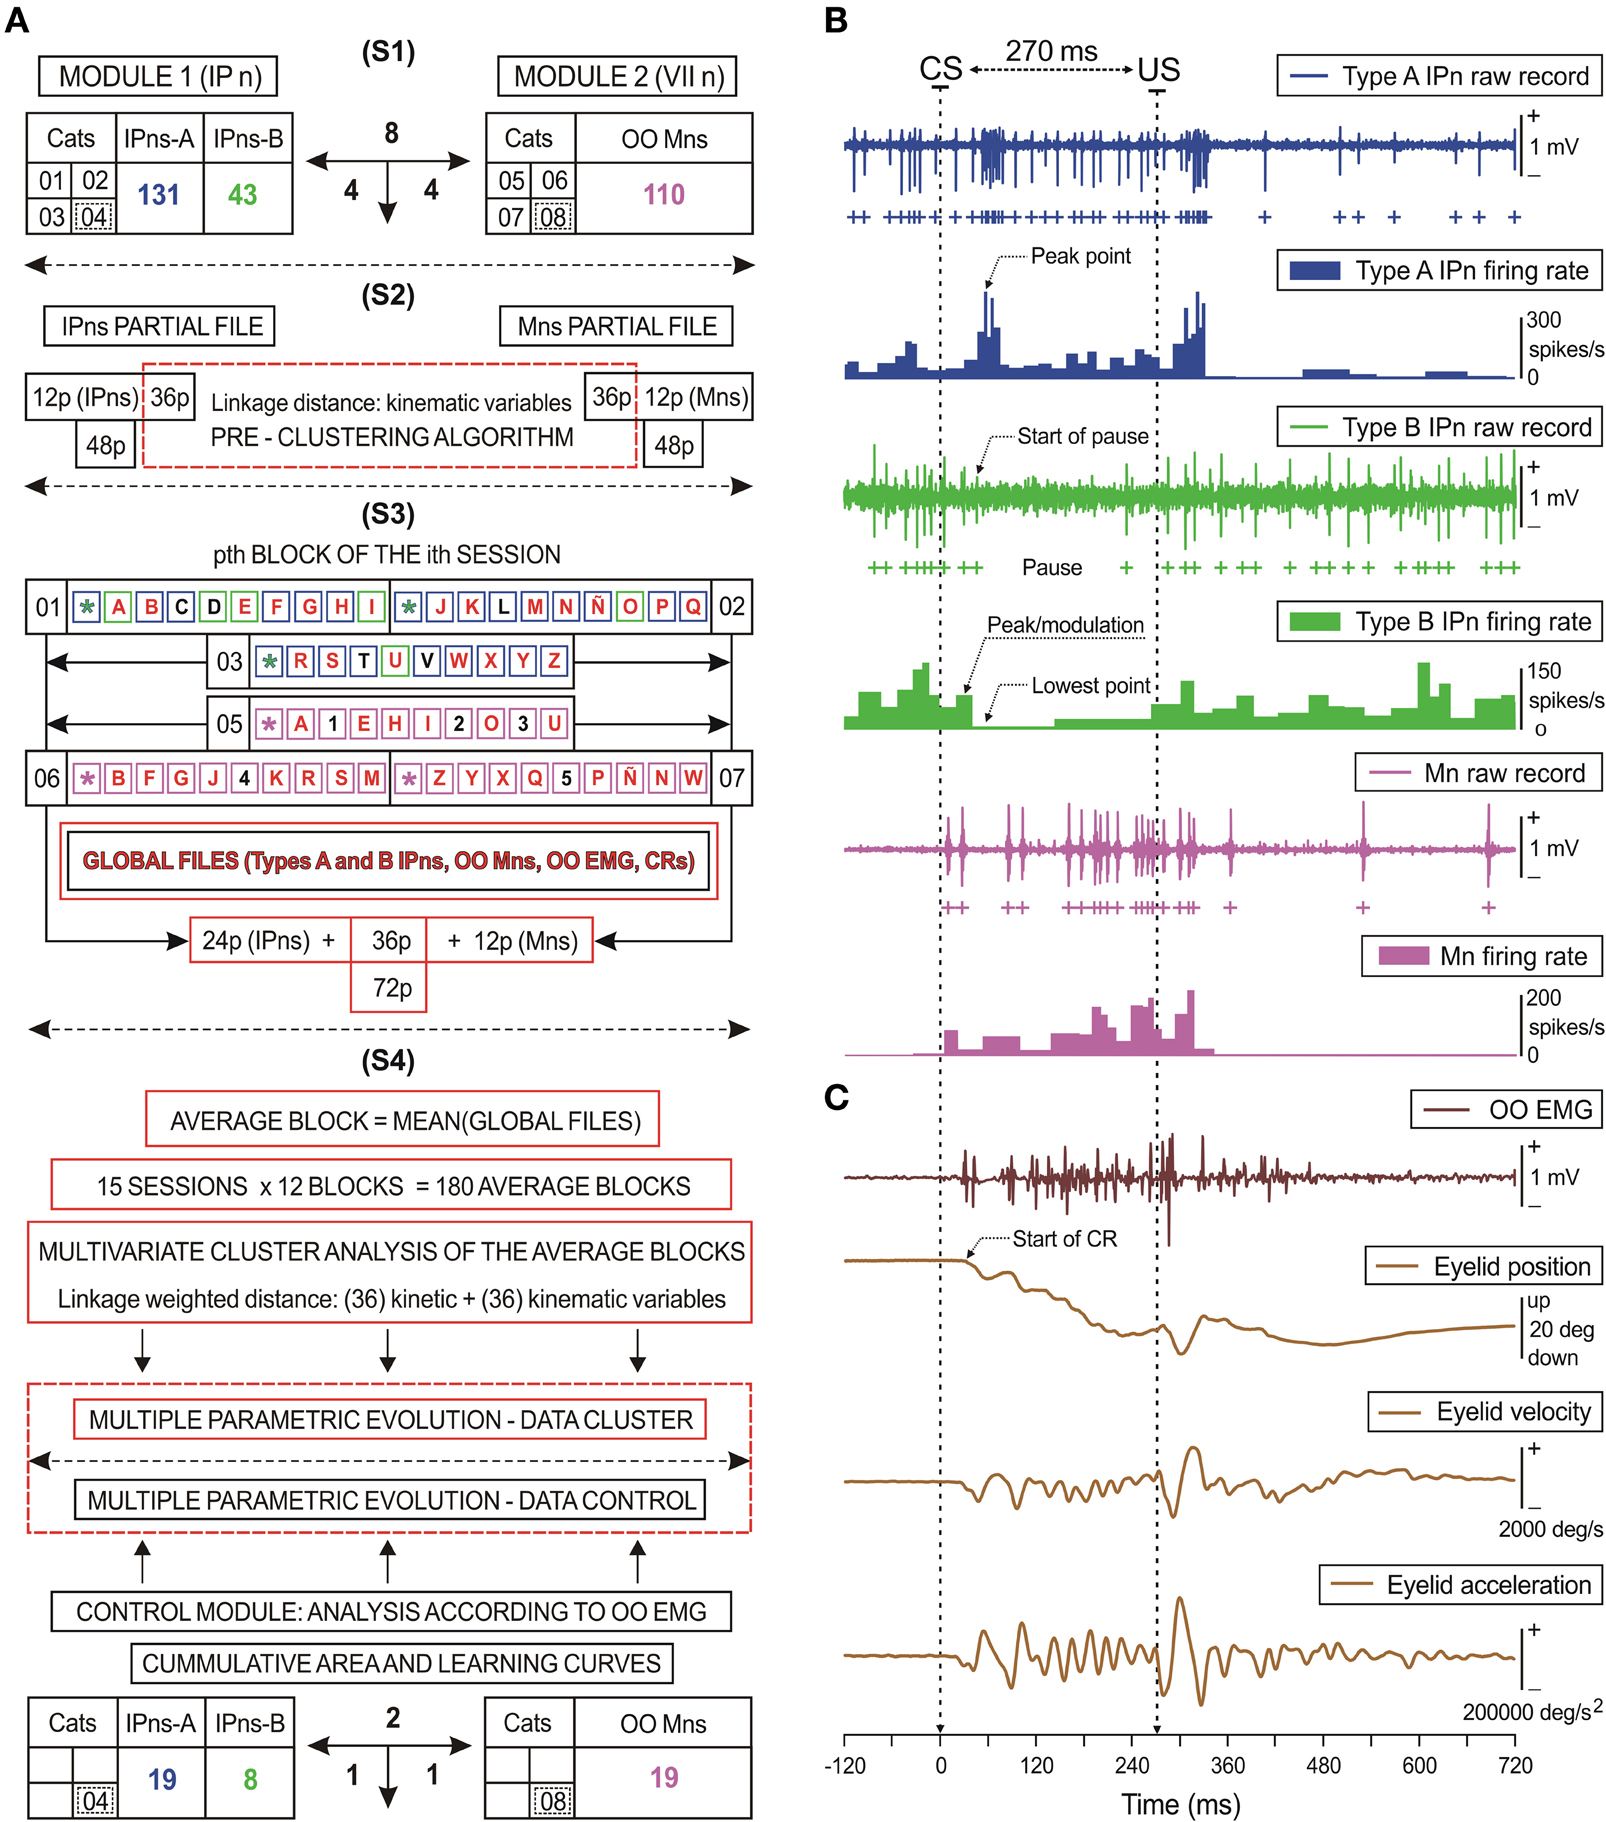
Figure 3. Diagrammatic representation of the data distribution: kinetic neural commands and eyelid kinematics.(A) The first data-processing stage (S1) includes all the experimental cats (n = 8). Four of the animals were used for recordings at the facial nucleus (VII n), while the other four were used for recordings at the cerebellar posterior interpositus nucleus (IP n). The total number of recorded orbicularis oculi (OO) motoneurons (Mns, n = 110), and of type A (n = 131) and type B (n = 43) interpositus neurons (IPns) are also indicated. In the following stage (S2), a pre-clustering algorithm was applied for 36 eyelid kinematic parameters. In the third stage (S3), an example of the possible combinations (corresponding to the pth block of the ith session) in order to form adequate global files. Blue, green, and magenta squares represent the trials of the training blocks for the cats 01–03 (types A and B IPns activities) and the cats 05–07 (OO Mns recording). Since for the first trial of each block the conditioned stimulus (CS) is presented alone (.), its possible combinations were not considered. Squares including the same letter (A–Z) represent a combination between an IPns partial file and an OO Mns partial file in order to form a global file per trial. In the illustrated example appeared a total of 27 global files (illustrated by red letters). Black letters and numbers indicate trials in which kinematic properties were significantly different from those in the rest of the trials of the corresponding block and session. Global files were averaged to form the averaged blocks to be further processed with the multivariate cluster analysis including the 72 selected parameters (i.e., 36 kinetic and 36 kinematic variables). In (S4) is indicated the correspondence between the multiple parametric evolution for n = 6 animals (cats 01–03 and 05–07) and for the control data (cats 04 and 08) using the quantitative analysis of OO EMG activity, the cumulative integration functions, and the learning curves. (B,C) A set of recordings collected in the 10th conditioning session from two representative animals. Here are represented the kinetics [neural commands, in (B)] and the performance [kinematics, in (C)] of eyelid response. (B) The action potentials (IPn spikes) marked with blue (type A) and green (type B) plus signs correspond to the direct representation of the neuronal activity in the IP n (IPn raw recordings) and its respective instantaneous frequency (IPn firing rate). Mns spikes recorded from an OO Mn are indicated with magenta plus signs. The direct representation of the neuronal activity in the facial nucleus (Mn raw recordings) and its corresponding instantaneous frequency (Mn firing rate) are also shown. (C) These traces illustrate the EMG activity of the OO muscle (OO EMG), the direct recording of the eyelid position by the magnetic field search-coil technique, and the estimated eyelid velocity and acceleration profiles. For each of the physiological signals represented, the magnitude and the respective unit of measurement are indicated. The dotted arrows indicate the peak firing rate of type A IPn (peak point); the start of the pause, the peak firing rate in the modulation range of the pause (peak/modulation), and the lowest firing rate (lowest point) of type B IPn; and finally, the start of the CR.
The discharge patterns of IPns and OO Mns were analyzed (Figure 3B). The algorithm also took into account the identification of the activity's standard waveform and the classification of probability patterns of spikes in time and frequency domains, (Jarvis and Mitra, 2001; Brown et al., 2004; Sánchez-Campusano et al., 2007), and in the phase space (Aksenova et al., 2003). Since raw neuronal recordings usually contain overlapping spikes, we used the following computational procedure: with the application of a spike-sorting method, overlapping spikes within an interval of 1 ms were regarded as a single spike (according to the absolute refractory period) and overlapping spikes within an interval of 1–3 ms were regarded as spikes of different classes due to the interspike interval (i.e., the relative refractory period of the neuron) criterion in spike detection. The cluster tools enabled us to determine the numbers of cells, classes, and spikes and their centers by measuring the distances between their trajectories in the phase space (Porras-García et al., 2010). Spike phase-space reconstruction was implemented using the time-delay technique (Chan et al., 2008), and the reconstructed spike waveform (an ideal and undisturbed spike that can be used as a template for the sorting method) preserves essential characteristics and the major phase-space trajectory of the original spike. Finally, the instantaneous firing rate was calculated as the inverse of the interspike intervals (see Figure 3B).
Maximum eyelid displacements during CRs were determined in the CS–US interval, and the function corresponding to the collected data (frequency sample at 1000 Hz) in the CS–US interval was fitted by a simple regression method. This method enabled fixing the trend for the points near the zero level of eyelid position and establishing a standardized algorithm for all the responses across all the blocks of trials. In this way, the typical randomness in the determination of CR onset was avoided. The onset of a CR (see the dotted line in Figure 3C) was determined as the latency from CS presentation to the interception of the regression function with the maximum amplitude level (Sánchez-Campusano et al., 2011b). This method was applied across the successive conditioning sessions, always showing the appropriate precision and robustness. The percentage of CRs was calculated as the ratio (or fraction) between the number of trails that elicited a CR and the total number of CS presentations during a conditioning session (Porras-García et al., 2010; Sánchez-Campusano et al., 2011a). Velocity and acceleration profiles (Figure 3C) were computed digitally as the first and second derivatives of eyelid position records after low-pass filtering of the data (−3 dB cutoff at 50 Hz and zero gain at ≈100 Hz) (Domingo et al., 1997; Sánchez-Campusano et al., 2007).
Computed results were processed for statistical analysis using the Statistics MATLAB Toolbox. As statistical inference procedures, both ANOVA and MANOVA (estimate of variance both within-groups and between-groups on the basis of one dependent measure, and estimate of variance in multiple dependent parameters across groups, respectively) were used to assess the statistical significance of differences between groups. The corresponding statistical significance test was performed with sessions as repeated measures, coupled with contrast analysis when appropriate (Hair et al., 1998; Grafen and Hails, 2002). Here we reported the F[(m−1),(m−1) × (n−1),(l−m)] statistics and the resulting probability P < 0.05, in which, 0.05 was the maximum predetermined significance level for all of the tests. The orders m (number of groups), n (number of animals), and l (number of multivariate observations) and the corresponding degrees of freedom were reported accompanying the F statistics values. According to the F-distribution, if the probability P is less than the predetermined significance level (0.05), then we reject the null hypothesis (no difference between population means). In contrast, if P > 0.05 we do not reject the null hypothesis at the significance level of 0.05.
Wilk's lambda criterion and its transformation to the χ2-distribution used in MATLAB were applied to infer the existence of statistically significant differences between samples from MANOVA results: (1) cluster analysis for cells-classes-spikes classification during the spike-sorting problem in the phase space (Porras-García et al., 2010) and (2) hierarchical cluster-free reconstruction during the kinetic-kinematic characterization of the learning process (Sánchez-Campusano et al., 2007, 2011b). For the circular statistics, we used both the Rayleigh and the Watson hypothesis tests for the von Mises distribution (Fisher, 1993; Jammalamadaka and SenGupta, 2001; Berens, 2009). Readers may refer to Sánchez-Campusano et al. (2011b) for a detailed and practical description of this circular statistics technique to analyze timing and time-dispersion patterns during motor learning.
Results
We recorded and analyzed a total of 174 antidromically identified cerebellar posterior IPns. From their discharge properties, we classified 131 of these 174 neurons as type A IPns and the remaining 43 neurons as type B IPns (Figure 3A). Type A IPns increase their firing frequency in the CS–US interval across successive conditioning sessions (Gruart et al., 2000a; Sánchez-Campusano et al., 2007), whilst type B IPns pause or even stop firing in the CS–US interval during the same conditioning paradigm (Gruart and Delgado-García, 1994; Gruart et al., 2000a). In addition, we recorded and analyzed 110 antidromically identified OO Mns (Figure 3A). Characteristically, OO Mns encode eyelid position during CRs (Trigo et al., 1999; Sánchez-Campusano et al., 2009). The two pools of neurons (IPns and OO Mns) were recorded in separate experiments in behaving cats during classical eyelid conditioning using a delay paradigm. However, and in accord with a previous study (Sánchez-Campusano et al., 2007), the kinetic–kinematic characterization of the recordings (involving the OO Mns and IPns activities and the eyelid responses) and the multivariate cluster analysis of the collected data enabled us to determine the distribution of homogeneities across the training blocks and sessions and the intrinsic coherence of recorded parameters (kinetic and kinematic variables) regarding the actual learning process.
The present study focuses on the comparison of the firing properties of OO Mns and type A IPns to those of type B IPns (Figure 3A). We analyzed the experimental data collected across the successive training sessions using cumulative the neural integration method, time-intensity dispersion models, multiple parametric evolutions, and raster and 3D representations in the time and frequency domains. As a result, the optimized global files were clustered automatically (see an example of a global file in Figures 3B,C) taking into account physiological criteria (see a complete list of kinetic and kinematic parameters in Sánchez-Campusano et al., 2007).
Firing Properties of the Posterior Interpositus Neurons During Classical Conditioning of Eyelid Responses
In those animals (n = 4) prepared for recording the firing activity of identified IPns, deep cerebellar nuclei were systematically explored in order to find unitary activity related with eyelid responses. The unitary activity was recorded during the random presentation of air puffs (10–100 ms, 1–3 kg/cm2) aimed at the ipsilateral cornea (Figure 1A). This procedure took ≤ 5 recording sessions. As confirmed later by the histological study, the dorsomedial part of the posterior interpositus nucleus was found to contain a high density of neurons related to reflexively evoked eyelid responses. Recorded neurons were identified by their antidromic activation (latency of 0.5–1.22 ms) from the contralateral red nucleus (Figures 1A,B). Although other deep cerebellar nuclei (mainly anterior interpositus and dentate nuclei) also contain neurons related to eyelid movements, we consider here only those located in the indicated area of the posterior interpositus nucleus (Figures 2B–D). Once the recording area was located, animals were classically conditioned using a delay paradigm. Posterior IPns were recorded in the four animals across two habituation, 10 conditioning, and three extinction sessions. The mean number of neurons recorded per session was 2.9 (i.e., a mean of 41.37 min of recording per neuron).
Type A IPns (n = 131) fired during active contraction of the OO muscle, and therefore, during the downward movements (either conditioned or unconditioned eyelid responses) of the upper eyelid (see blue profiles in Figure 3B). Tones presented during the two habituation sessions evoked relatively few reflex eyelid responses, which appeared mainly during the first blocks of the first habituation session. During habituation sessions, IPn firing lagged the beginning of evoked eyelid responses by 12–30 ms, but the mean value of this lag decreased progressively across conditioning (Gruart and Delgado-García, 1994; Gruart et al., 2000a; Sánchez-Campusano et al., 2007, 2009). The mean number of spikes generated by type A IPns in the CS–US interval did not change significantly and their mean peak firing rate increased across conditioning and decreased during extinction sessions (for more details see below, the multiple parametric evolutions). According to previous reports, type A IPns exert a reinforcing-modulating action on the OO Mns (via the red nucleus) during the closure of the eyelid (Sánchez-Campusano et al., 2007, 2009, 2011a,b).
Type B IPns (n = 43) were also antidromically activated (Figure 1B) from the red nucleus (0.85–1.25 ms), but presented a noticeable inhibition in their firing (see green profiles in Figure 3B) in coincidence with the downward displacement of the upper eyelid during reflexively evoked blinks (Gruart and Delgado-García, 1994; Gruart et al., 2000a). The firing rate of the type B IPns began to decrease (start of pause), a few milliseconds (<10 ms) before the onset of the CR. However, their firing rate reached the minimum value of amplitude (the lowest point) at 8–25 ms after the onset of the CR (see the dotted arrows in Figures 3B,C). In general, the duration of the pause (including the modulation range) in the activity of type B IPns was from −10 ms to +200 ms with respect to the beginning of the CR. Thus, the main functional difference between type A and type B IPns was that type A neurons increased their firing in the CS–US interval across successive conditioning sessions, whilst type B IPns paused or even stopped firing in the CS–US interval during the same conditioning paradigm.
Integrated Neural Activities of Orbicularis Oculi Motoneurons and Types A and B Cerebellar Posterior Interpositus Neurons
In the other group of animals (n = 4), the facial nucleus was systematically explored in the search for OO Mns antidromically activated from the electrode implanted in the zygomatic branch of the facial nerve (Figure 1A). As already described (Shaw and Baker, 1983, 1985; Gruart et al., 2003) and confirmed histologically, OO Mns are concentrated in the dorsal subdivision of the facial nucleus. These OO Mns (n = 110) were antidromically activated, with a mean latency of 2.19 ± 0.38 ms (mean ± SEM), and their firing started ≈10 ms before air-puff-evoked eyelid reflex responses. Once the recording area was located, animals were classically conditioned as indicated above (Figure 2A). OO Mns fired tonically (magenta profiles in Figure 3B) during the performance of the eyelid CRs (see eyelid position, velocity, and acceleration profiles in Figure 3C). Thus, and as already described (Trigo et al., 1999), their discharge was related to eyelid position (with a gain of 4.5–11.3 spikes/deg; r ≥ 0.92; P ≤ 0.01) during CRs. Interestingly, the total number of spikes generated by OO Mns during the CS–US interval increased across conditioning (see below, the multiple parametric evolutions).
To determine the correlation degree between the discharge rate of facial Mns and that of IPns, we compared the cumulative numerical integration functions obtained as the sum of the trapezoidal integrals of the firing frequencies across the CS–US interval. Figure 4A illustrates the integrated neural activities of three representative interpositus nucleus neurons (IPn1–IPn3) and a representative OO Mn during the 10th conditioning session. It should be noted that all the integrated neural activities showed some slight and relative variations around the local and global maximum instantaneous frequency values. We defined three equivalence times (L1–L3) at the points where IPn2 and OO Mn traces crossed.
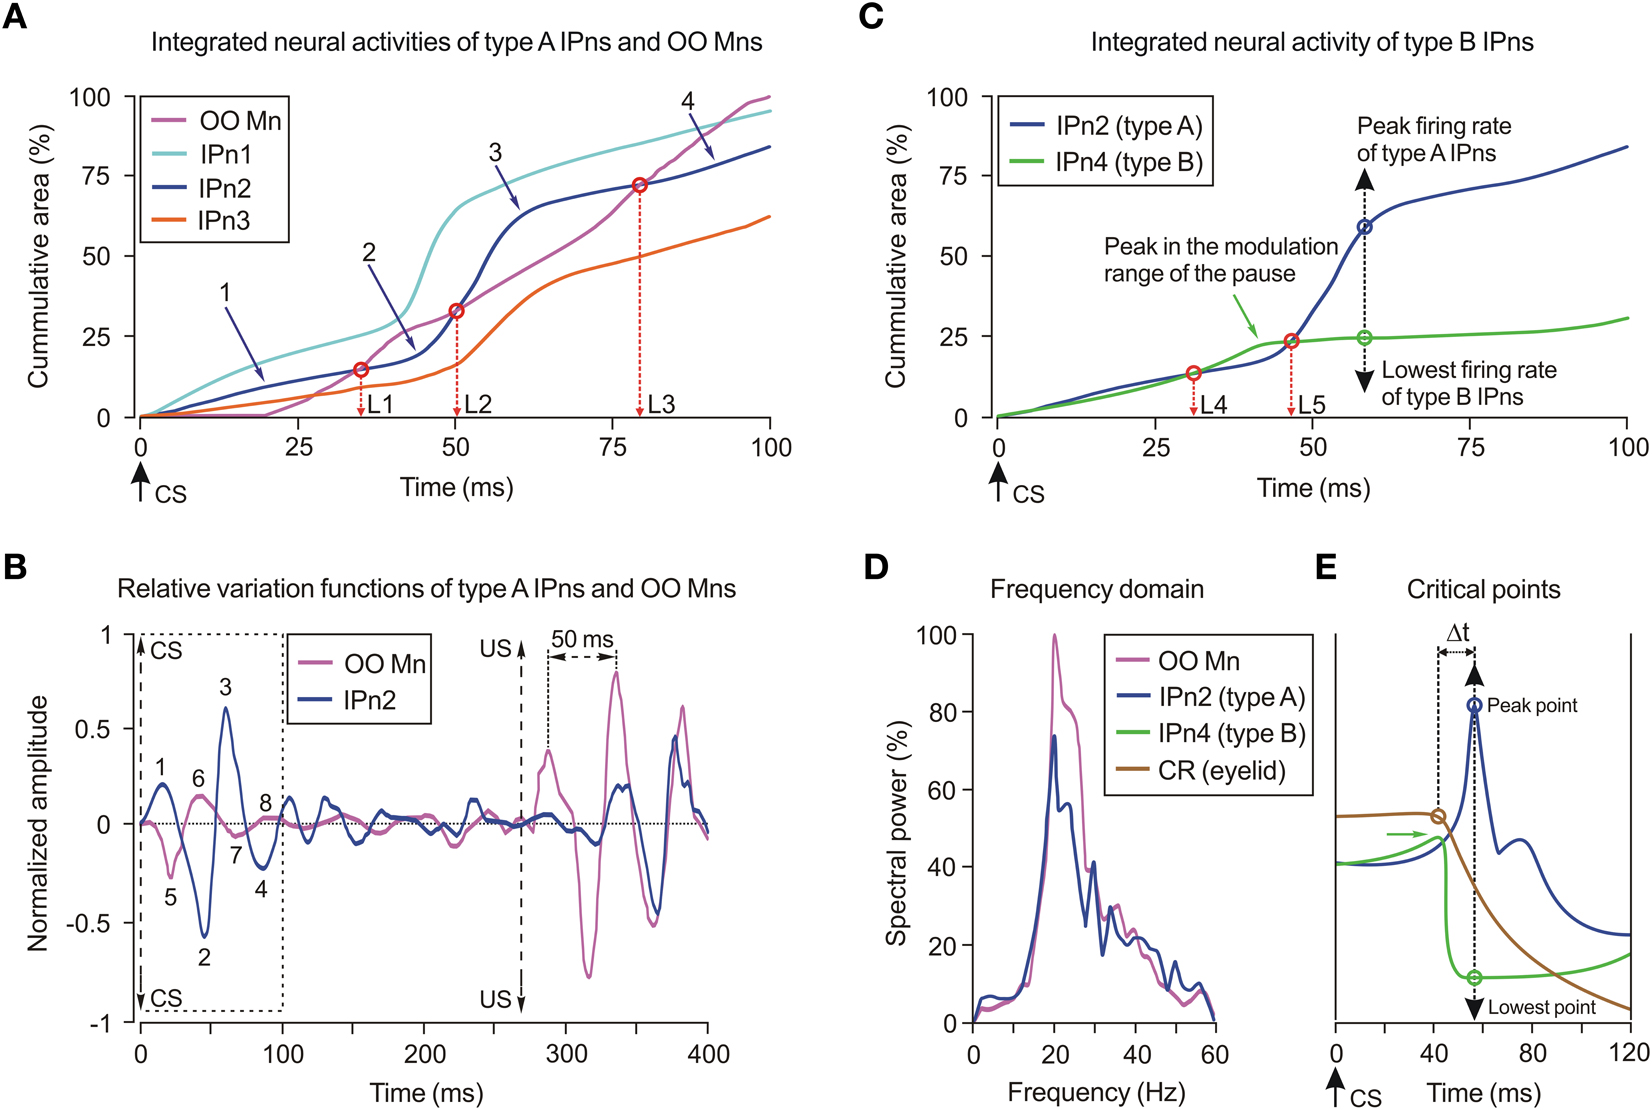
Figure 4. Cumulative neural integration functions of the types A and B cerebellar posterior interpositus neurons. (A) Three of the illustrated traces correspond to the averaged integrated neural activity of identified type A cerebellar interpositus neurons (IPn1–IPn3, see color codes in the inset), while the fourth trace represents the integrated neural activity of a selected orbicularis oculi motoneuron (OO Mn, see code in the inset). Data were collected from the 10th conditioning session. Here, the CS presentation (time 0 ms) and the equivalence times (L1, L2, and L3) of integrated neural activities (IPn2 and OO Mn) are indicated. (B) Oscillatory and phase-inversion properties of type A IPn (e.g., IPn2). Oscillatory curves (relative variation functions) resulting from high-pass filtering (−3 dB cutoff at 5 Hz and zero gain at ≈15 Hz) of integrated neural firing activities illustrated in (A). In (B), OO Mn and IPn2 relative variation functions present a phase difference during their oscillations in the CS–US interval. Here, the components 1, 2, 3, and 4 of the type A IPn2 are totally out of phase with the components 5, 6, 7, and 8 of the OO Mn, respectively. (C) Integrated neural activity of a type B IPn (e.g., IPn4) in comparison with the type A IPn2. Note that the green trace (IPn4) increases, though only slightly, for time values > 40 ms [temporal range of the pause (including the modulation range) in the firing activities of the type B IPn]. The dashed black double arrow indicates the peak (type A, blue circle)/lowest (type B, green circle) firing frequency. (D) Power spectra for the oscillating curves shown in (B). Note that the two illustrated spectra present a significant predominance of spectral components at ≈20 Hz, and significant differences [One-Way ANOVA F-tests, F(1, 3, 238) = 20.11, P < 0.01] between their spectral powers. (E) The critical points (peak and lowest firing frequencies of types A and B IPns, respectively) of the numerical distribution functions of the envelope of the firing rates (type A IPns, blue curve; type B IPns, green curve) in the 0–120 ms interval. The distribution function in brown corresponds to the eyelid position profile and the brown circle indicates the latency to CR onset. The delay Δt ≈16 ms between the critical points and the time to CR onset during the 10th conditioning sessions is also indicated.
The presence of an oscillatory behavior in the firing of IPns and OO Mns was evidenced by high-pass filtering the traces illustrated in Figure 4A. The relative variation functions obtained after the high-pass filtering process presented oscillatory and phase-inversion properties (Figure 4B). Note that on the oscillating curves shown in Figure 4B, components 1–4 of the type A IPn are out of phase with components 5–8 of the OO Mn. These results allow proposing a modulatory role for type A IPns in the final common pathway for the eyelid system (i.e., the motoneuronal pool) which, by progressively inverting phase information, modulate or reinforce eyelid motor responses inversely—not opposed—to the contribution of OO Mns (Sánchez-Campusano et al., 2007, 2009). Furthermore, the maximum amplitude of the OO Mns relative variation function was significant [One-Way ANOVA F-tests, F(9, 27, 98) = 170.26, P < 0.01] both in the CS–US interval and after the US presentation. Finally, the oscillation amplitude of the type A IPn relative variation function increased progressively across the learning process, reaching significant values [One-Way ANOVA F-tests, F(9, 27, 98) = 59.51, P < 0.01] during the 10th conditioning session (Figure 4B).
In Figure 4C, we illustrate the integrated neural activity of type B IPns (IPn4, green trace) in comparison with that of type A IPns (IPn2, blue trace). Here, we defined two equivalence times (L4 and L5) at the points where IPn2 (type A) and IPn4 (type B) traces crossed. Note that the times of equivalence between types A and B IPns are smaller than those between type A IPns and OO Mns (i.e., L4 < L1 and L5 < L2). Thus, the range of initial modulation of the pause (i.e., the decrease of firing rate of type B cells before they stop firing altogether) was from L4 to L5 ms. The main outcomes of this method were the recognition of the cumulative profiles of the neural activities (types A and B IPns) with a definite dissimilarity in the cumulative areas of their firing frequencies, and the identification of a temporal similarity in the range of occurrence of both the peak (in type A IPns) and the lowest (in type B IPns) firing frequencies (see the dashed black double arrow in Figure 4C) in the CS–US interval.
The illustrated power spectra (Figure 4D) presented a significant predominance of spectral components at ≈20 Hz [20.13 ± 0.04 Hz, (mean ± SEM)], and significant differences in their spectral power [One-Way ANOVA F-tests, F(1, 3, 238) = 20.11, P < 0.01] at the asymptotic level of acquisition of this associative learning test (session C10). We also found significant differences in the power spectra of Mn [One-Way ANOVA F-tests, F(9, 27, 98) = 225.48, P < 0.01] and type A IPn [One-Way ANOVA F-tests, F(9, 27, 98) = 216.28, P < 0.01] physiological time series across conditioning sessions. The integrated neural activity of type B IPns did not show oscillatory properties because the pause in their firing activity in the CS–US interval annulled the relative variation of amplitude.
The time-dependent distribution functions of the integrated neural activities (types A and B IPns, blue and green curves, respectively) and the integrated eyelid position (brown trace) are represented in Figure 4E. Here, we show the critical points (maximum and minimum points of the distributions) in correspondence with the peak and lowest firing frequencies of the type A and B IPns (see the dashed black double arrow in Figures 4C,E). Note that the latency to CR onset [for the brown circle, 41.75 ± 0.56 ms (mean ± SEM)] was smaller than the latencies of the critical points (57.61 ± 0.13 ms) during the 10th conditioning session—i.e., the time to peak (type A IPns)/lowest (type B IPns) firing rates with respect to CS onset always lagged (Δt ≈16 ms) the beginning of the CR.
Dynamic Neural Patterns of Types A and B Interpositus Neurons and Multiple Parametric Evolutions Across Conditioning
It has been proposed that learning is a precise functional state of the brain, and that we should take a dynamic approach to the study of neural activity during learning in alert behaving animals to determine whether this is so (Delgado-García and Gruart, 2002; Sánchez-Campusano et al., 2011a). Here, we show a comparative analysis of the dynamic neural patterns of the two types of identified cerebellar posterior IPn using raster and 3D representations of the firing activity in the time domain (Figures 5A,B and 6A,D), multiple parametric evolutions (Figures 5C–E), and raster and 3D representations of the eyelid kinematics in the time (Figures 6B,E) and frequency (Figures 6C,F) domains.
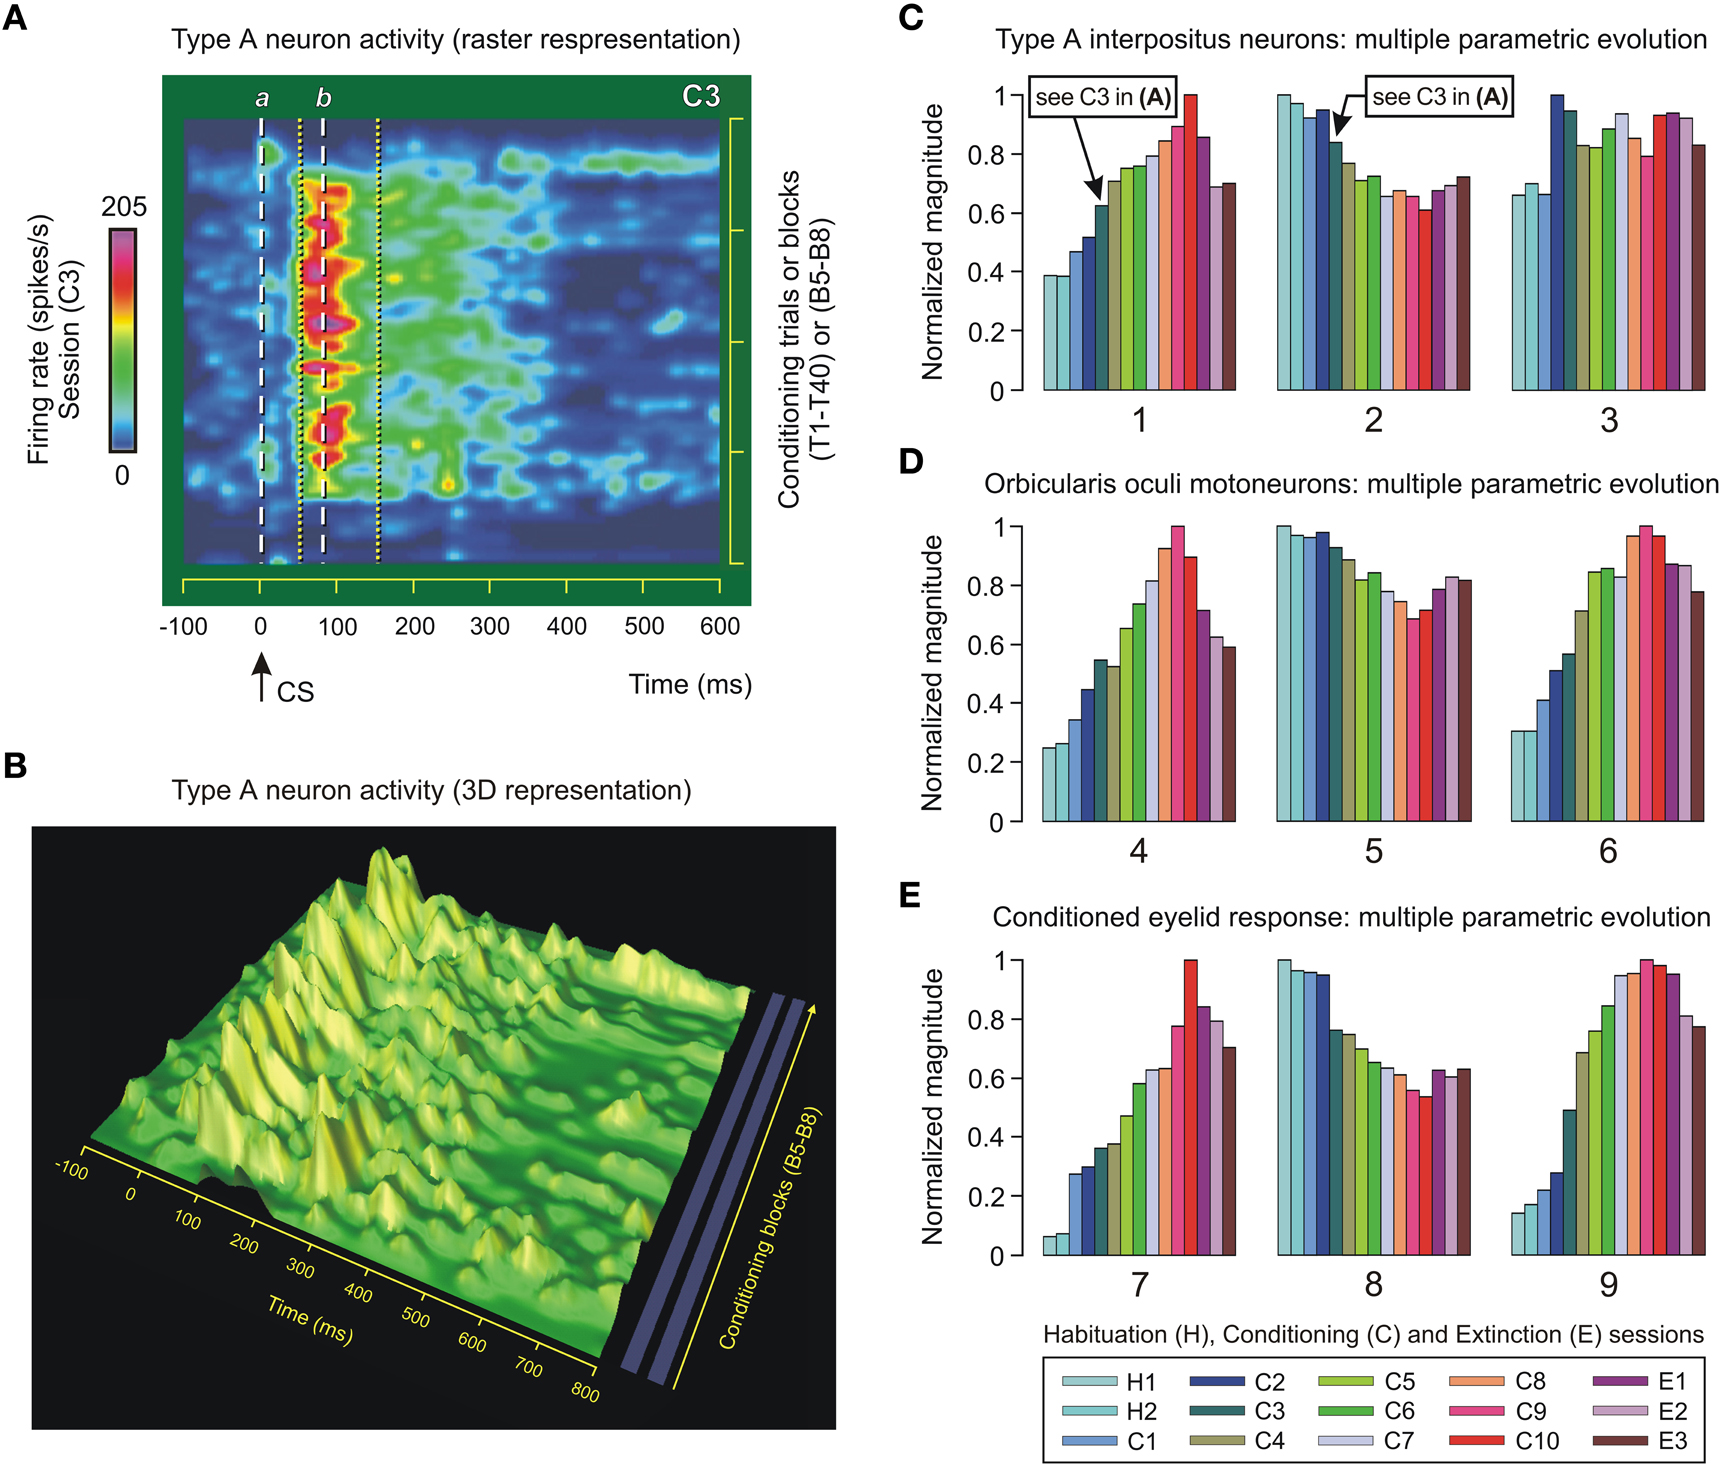
Figure 5. Type A neuron activity in the interpositus nucleus and multiple parametric evolution across conditioning. (A) Color raster display of the firing rate (in spikes/s, see the quantitative color bar to the left of the panel) of a representative type A cerebellar posterior interpositus neuron (IPn) recorded during the third conditioning session (C3) using the delay paradigm. The trials T1–T40 correspond to the conditioning blocks B5–B8 of session C3. Neuronal firing rates of only one in three conditioning trials are represented. The dashed white lines labeled a and b correspond to conditioned stimulus (CS) presentation (line a, 0 ms) and ≈79 ms afterwards—that is, the mean value of the latency (line b) to peak firing rate of the type A IPns in the inter-stimulus interval (ISI). The dotted yellow lines indicate the temporal range of the burst (including the modulation range) in the firing activities of type A IPns. (B) 3D representation of the dynamic evolution of the firing frequency profiles of type A IPn for the same sequence of conditioning trials and blocks as in the panel (A). Here, the time (in ms), the block of conditioning trials, and the firing rate of type A IPn (in spikes/s) are represented on the x, y, and z-axes, respectively. (C–E) A representation of multiple parametric evolutions of physiological parameters collected across conditioning. The color code indicates the corresponding session, and each set of colored bars corresponds to the evolution of a given parameter (numbered from 1 to 9): parameters 1 and 4 (mean peak firing rate, in spikes/s), parameters 2 and 5 (latency of the mean value of the peak firing frequency with respect to CS presentation, in ms), parameters 3 and 6 (total number of spikes in the ISI), parameter 7 [eyelid position amplitude at unconditioned stimulus (US) presentation compared with the amplitude at the start of the conditioned response (CR), in degrees], parameter 8 (latency between the CS and the onset of the CR, in ms), and parameter 9 (the typical learning curve, in %CR). The timing (2 and 5) and kinetic (1, 3, 4, and 6) parameters represented in (C) and (D) were calculated from both IPn and OO Mn recordings, respectively. The arrows in (C) indicate the mean value of the peak firing frequency (0.62—that is, ≈201 spikes/s) and its time of occurrence (0.84—that is, ≈78 ms) during the conditioning session C3. The above values are in correspondence with those represented in (A) (see the color bar for the peak firing rate and the line b). The parameters 7, 8, and 9 in (E) characterize the time-course and kinematics of the learned eyelid response. For this representation, each parameter has been normalized in accordance with its maximum value across conditioning.
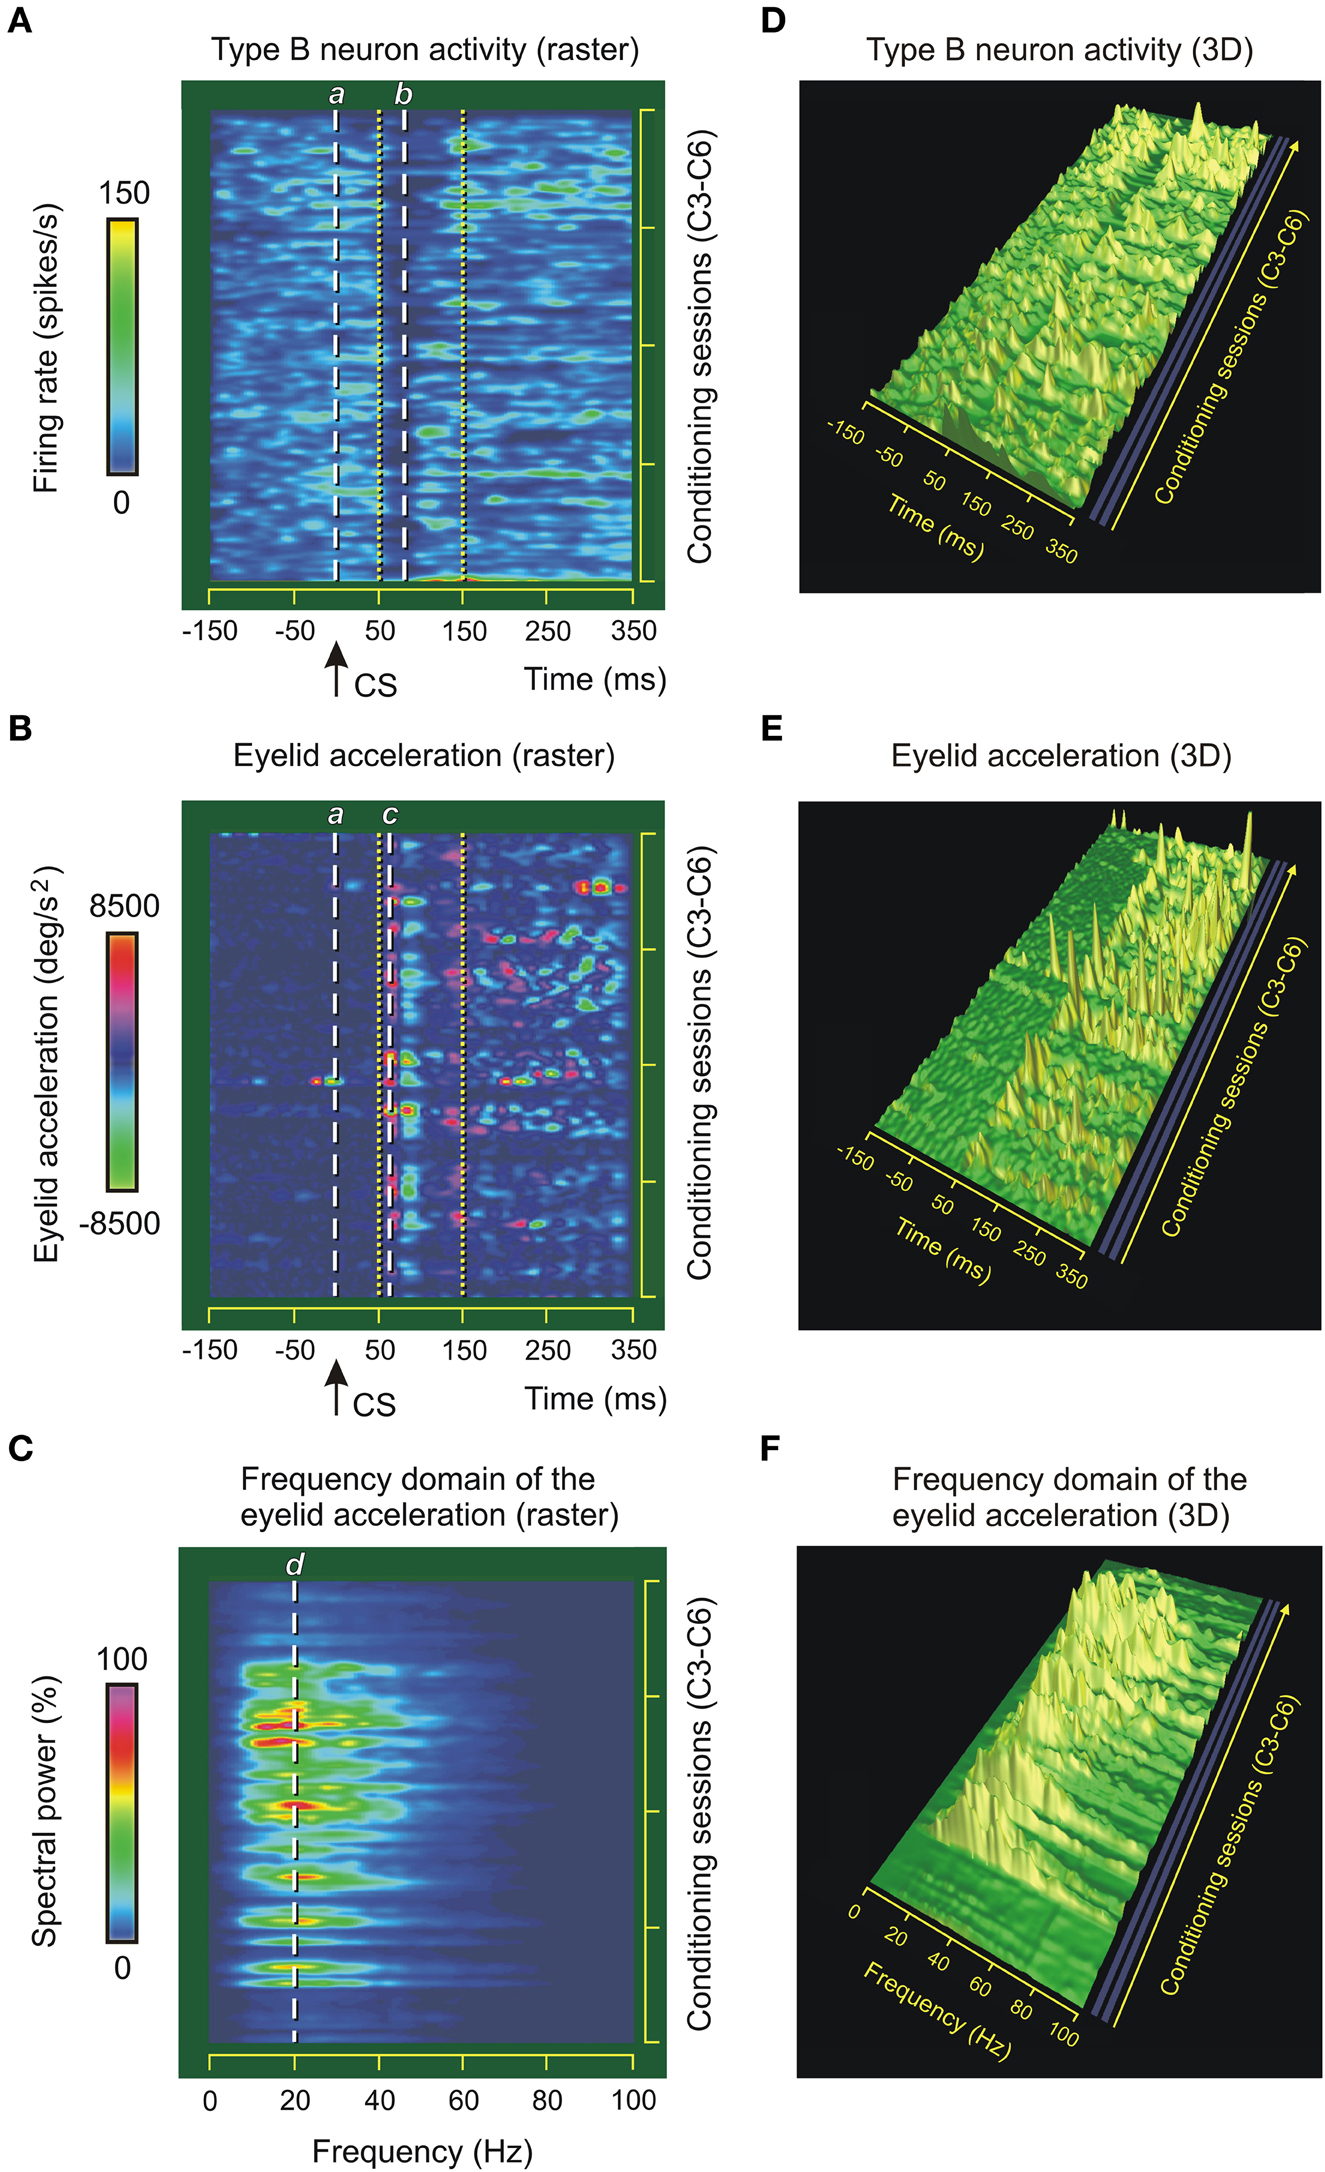
Figure 6. Type B neuron activity in the interpositus nucleus and eyelid kinematics. (A) Color raster display of the firing rates (in spikes/s) of different type B cerebellar posterior interpositus neurons (IPns, n = 9) of a representative animal recorded during four conditioning sessions (C3–C6) using the delay paradigm. The dashed white lines labeled a and b correspond to conditioned stimulus (CS) presentation (0 ms) and ≈80 ms afterwards—i.e., the mean value of the latency (line b) to lowest point of the firing rate of the type B IPns in the inter-stimulus interval. (B) Color raster display of the eyelid acceleration profiles during the same conditioning sessions (C3–C6). The dashed white line c represents the latency between the CS (line a, 0 ms) and the onset of the conditioned response (CR) ≈60 ms. The lines a, b in (A) and c in (B) indicate instantaneous events taking place at the indicated times. Thus, the temporal difference b–c ≈20 ms allowed us to verify that the latencies of the lowest amplitudes of the instantaneous frequencies (in spikes/s, see line b) of type B IPns always lagged the beginning of the CRs. The dotted yellow lines in (A) and (B) indicates the temporal range of the pause (including the modulation range) in the firing activities of type B IPns. (C) Color raster display of the spectral powers (in %) of the eyelid acceleration profiles across conditioning sessions. Note that the frequency domain representation presents a predominance of spectral components at ≈20 Hz—i.e., a predominance of oscillations of eyelid acceleration at ≈50 ms in the time domain. For a more exhaustive interpretation of these raster representations, see the quantitative color bar to the left of each panel. (D–F) 3D representation for the dynamic evolutions of the profiles of the firing rates of the type B IPns in (A), the eyelid accelerations in (B), and their spectral powers in (C), respectively. For all the 3D-plots, the same sequence of conditioning trials, blocks, and sessions was used as in (A–C) (i.e., profiles of only one in three conditioning trials are represented).
In previous studies (Gruart et al., 2000a; Sánchez-Campusano et al., 2007), we analyzed the time-course of the firing activity of type A IPns across conditioning sessions. In the present study, we have analyzed the dynamic evolution of the firing activity of type A IPns using the intra-trial (e.g., Figures 3B,C) and inter-trials (Figure 5A) timing schemes. Figure 5A (raster representation) and Figure 5B (3D-representation) show the profiles (color map and surface plots) of the firing rate (in spikes/s) of type A IPns. The main outcome of the raster representation was the identification of the temporal range of the burst (including the modulation range) in the activity of type A IPns (e.g., the time interval between the dotted yellow lines during the third session, Figure 5A). Here, the latency to peak firing rate of type A IPns was 79.42 ± 0.37 ms (mean ± SEM) (see the dashed white line b in Figure 5A). This latency decreased progressively across conditioning sessions with respect to CS presentation (see below, the multiple parametric evolutions).
The organization of data in the matrix provided by multivariate cluster analysis allowed the selection of the most-significant physiological parameters representing the acquisition and extinction processes. Nine representative parameters (timing, neural, and kinematic variables), numbered from 1 to 9, are depicted in Figures 5C–E. In Figure 5C, we show the maximum instantaneous frequency of type A IPns in the CS–US interval (parameter 1), the latency of their peak firing frequency with respect to CS presentation (parameter 2), and the mean number of spikes generated by type A IPns in the CS–US interval (parameter 3). Note that the parameter 1 [One-Way ANOVA F-tests, F(14, 70, 132) = 143.86, P < 0.01] increases across the conditioning sessions. The irregular evolution of parameter 3 [One-Way ANOVA F-tests, F(14, 70, 132) = 1.63, P > 0.05] suggests that the increase in parameter 1 after CS presentation represented a reorganization (rather than a net increase) of the mean spontaneous firing of type A IPns. In fact, the mean values for the relative refractory period of type A IPns [One-Way ANOVA F-tests, F(14, 70, 132) = 126.44, P < 0.01] and parameter 2 [One-Way ANOVA F-tests, F(14, 70, 132) = 93.87, P < 0.01] decrease in the CS–US interval.
As illustrated in Figure 5D, the mean peak firing rate [parameter 4, One-Way ANOVA F-tests, F(14, 70, 132) = 207.31, P < 0.01] and total number of spikes generated by OO Mns during the CS–US interval [parameter 6, One-Way ANOVA F-tests, F(14, 70, 132) = 187.12, P < 0.01] increase across conditioning sessions. This result indicates that the dorsolateral portion of the facial nucleus (the site where OO Mns are located) was involved as the neural element (kinetic neural command) driving the eyelid CRs. An inverted evolution (from long to short periods or latencies) was obtained for the mean values of the relative refractory period of the OO Mns [One-Way ANOVA F-tests, F(14, 70, 132) = 206.20, P < 0.01] and for the latency (with respect to CS onset) of their maximum instantaneous frequency [parameter 5, One-Way ANOVA F-tests, F(14, 70, 132) = 53.19, P < 0.01] across conditioning sessions.
The representative kinematic parameters (performance of learned eyelid response) are represented in Figure 5E. The peak amplitude of the evoked CR [parameter 7, One-Way ANOVA F-tests, F(14, 70, 132) = 251.27, P < 0.01] increased steadily across conditioning sessions and decreased progressively during the three extinction sessions. However, the mean values of the latency between CS onset and the start of the CR decreased, with significant statistical differences [parameter 8, One-Way ANOVA F-tests, F(14, 70, 132) = 123.50, P < 0.01], along the conditioning process. The typical learning curve (i.e., the percentage of CRs across conditioning) is also represented [parameter 9, One-Way ANOVA F-tests, F(14, 70, 132) = 129.40, P < 0.01].
In summary, in Figures 5C–E are illustrated the multiple parametric evolutions. These representations are analogous to the one observed in typical learning curves using the classical conditioning paradigm, i.e., a curve showing that the level of expression of CRs increases across the successive conditioning sessions and decreases during the extinction sessions (e.g., parameters 1, 4, 6, 7, and 9) or vice versa (e.g., parameters 2, 5, and 8). Here, the 10th session is the asymptotic level of acquisition of this associative learning test, and the extinction is like a (new) learning process with opposite effects on the level of expression of the responses.
Finally, the parameters were normalized in accordance with their maximum values across conditioning (Figures 5C–E). For example, the maximum values for mean peak of the firing frequency were 322.60 spikes/s (parameter 1, session C10) and 158.27 spikes/s (parameter 4, session C9) for type A IPns and OO Mns, respectively. Note that in the session C3, parameter 1 was 201.11 spikes/s. With regard to the mean latency to the maximum instantaneous frequencies, the maximum values were 93.06 ms (parameter 2, session H1) and 259.14 ms (parameter 5, session H1) for type A IPns and OO Mns, respectively. Here, during the session C10, parameter 2 was 56.81 ms (e.g., the dashed black double arrow in Figures 4C,E), and during the session C3 it was 77.90 ms (e.g., the line b in Figure 5A). Furthermore, the maximum values for mean number of spikes generated during the CS–US interval (parameters 6 and 9) were 15.38 spikes (in session C2) and 9.83 spikes (in session C9) for type A IPns and OO Mns, respectively.
In this study we paid special attention to the dynamic neural patterns of type B IPns. Figures 6A,D illustrate the time-course of the firing rate (in spikes/s) across four selected conditioning sessions (e.g., C3–C6) in a representative animal. Note that during the conditioning sessions C3–C6, the duration of the pause (including the modulation range) in the firing activity of type B IPns was ≤ 100 ms (from 50 ms to 150 ms with respect to CS presentation, see dotted yellow lines in Figure 6A), but this range of duration increased progressively from the seventh to the tenth conditioning session. It was evident from simple observation of the firing records obtained at the asymptotic level of acquisition (i.e., the 10th conditioning session) of this associative learning test (see Figure 3B) that the type B IPns pauses and their firing frequency decreased in a specific temporal range (i.e., from 40 ms to 260 ms with respect to CS presentation). Interestingly, during the conditioning sessions C3–C6, the mean value for the latency to lowest point of the firing rate of type B IPns in the CS–US interval was 80.36 ± 0.11 ms (mean ± SEM) after the presentation of the CS (see the dashed white lines a and b in Figure 6A). Note that a similar mean value (79.42 ± 0.37 ms) was obtained for the latency to peak firing rate of type A IPns during the third conditioning session (Figure 5A).
The color raster display and 3D-plot of the eyelid acceleration profiles during the same conditioning sessions (C3–C6) are represented in Figures 6B,E. The observed pattern is characteristic of an oscillatory process describing the quantal organization of reflex and conditioned eyelid responses (Domingo et al., 1997). According to the raster representation, the latency to onset of the CR was 60.45 ± 0.28 ms (mean ± SEM) (see dashed white line c in Figure 6B) after the presentation of the CS (dashed white line a). Therefore, the latency of the lowest amplitude of the instantaneous frequency of type B IPns (line b in Figure 6A) always lagged the beginning of the CR (line c in Figure 6B).
Figures 6C,F illustrates the frequency domain analysis of the eyelid acceleration profiles shown in Figures 6B,E. The predominance of spectral components observed around 20 Hz [19.51 ± 0.09 Hz, (mean ± SEM), see Figure 6C] was probably due to the 50 ms mean period characteristic of eyelid kinematics in the time domain. In fact, an oscillation at the same dominant frequency (≈20 Hz) has been observed in the relative variation functions of both OO Mns and eyelid position (Sánchez-Campusano et al., 2007, 2011b) and in the EMG activity of the OO muscle (Domingo et al., 1997). It should also be noted that the mean values of the spectral powers (in %, Figures 6C,F) increase across the represented conditioning sessions in parallel with the peak amplitudes of the evoked CRs (see parameter 7 in Figure 5E).
Timing and Time-Intensity Dispersion Patterns of types A and B Interpositus Neurons During Motor Learning
A set of techniques referred to as circular statistics has been developed for the analysis of directional data (Batschelet, 1981; Fisher, 1993; Jammalamadaka and SenGupta, 2001; Berens, 2009; Sánchez-Campusano et al., 2011b). The unit of measurement for such data is angular (usually in either degrees or radians) and the circular distributions underlying the techniques are characterized by the proper time-angle and intensity-radius correspondences. In this paper, we adapted this approach to analyze the time-intensity dispersion patterns of the collected data in the 0–270 ms interval (the duration of ISI—i.e., the CS–US interval) during the performance of the CR: for example, the angle of 0 degrees is deemed to correspond to a time of 0 ms—that is, the CS onset instant; and the angle of 270 degrees is deemed to correspond to the time of US presentation—that is, 270 ms after CS onset, according to our delay paradigm (Figure 2A). Here, we complete three simple steps: (1) timing data were expressed as angles in radians and intensity data were normalized in accordance with their maximum value across conditioning (i.e., circumferences of radios ≤1); (2) the corresponding elements of data stored in polar coordinates (angle, radius) were transformed to Cartesian coordinates (x, y); and, (3) the compass plot with components (x, y) as arrows of different lengths emanating from the origin was implemented. In Figures 7A,B we show the circular distributions (using the compass plot representation) of our physiological data across conditioning sessions.
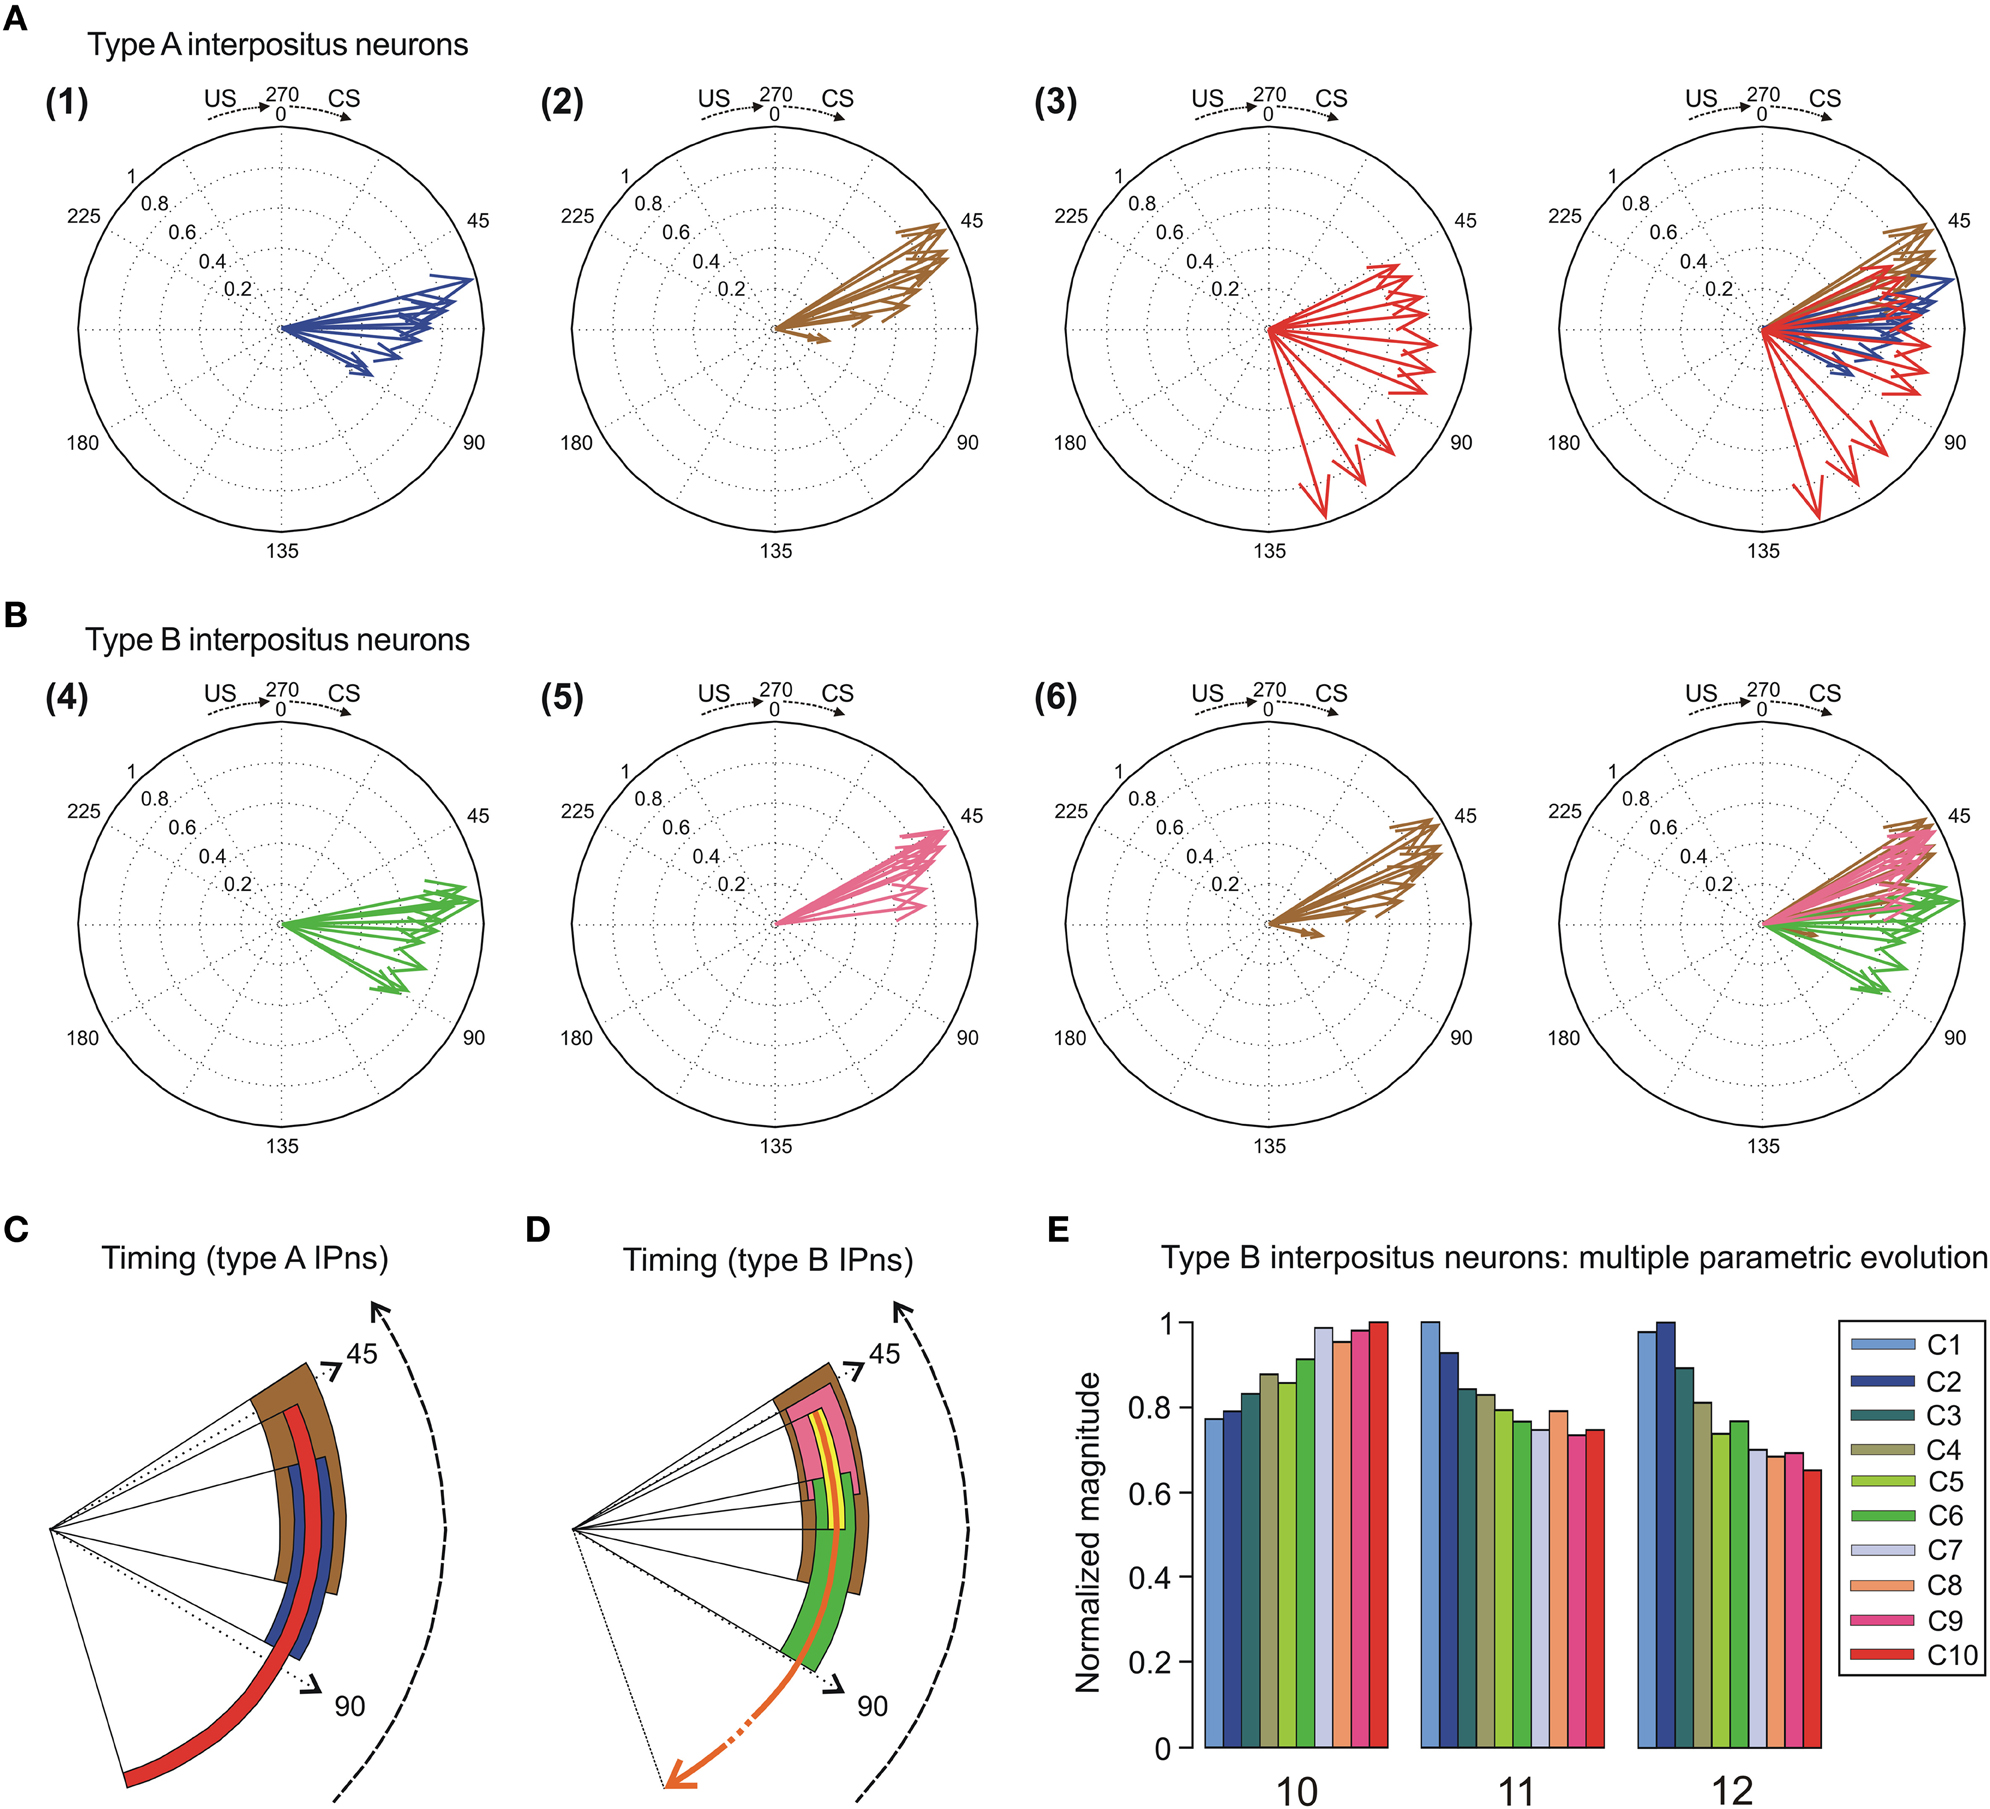
Figure 7. Compass plots of the time-intensity distributions across conditioning sessions. (A) In this representation, the parametric timing-intensity distributions are shown as (1) time to peak firing rate of type A interpositus neurons (IPns) vs. peak firing frequency of type A IPns, blue arrows; and (2) time to conditioned response (CR) onset vs. percentage of CRs, brown arrows. In addition, the time delay-strength distribution is shown as (3) time delay in coupling vs. maximum linear correlation coefficient between type A IPns firing rate and eyelid position, red arrows. These parameters were plotted using the circular statistics for an inter-stimulus interval (ISI, CS–US interval) of 270 ms. The 10 colored arrows (10 conditioning sessions, C1–C10) in each circle illustrate the circular dispersion of the angular datasets represented. (B) The compass plot representation for type B IPns, but according to the following distributions: (4) time to lowest firing rate of type B IPns during the pause [parameter 12 in (E)] vs. the lowest firing frequency during the pause, green arrows; and (5) time to peak firing rate of type B IPns in the modulation range of the pause [parameter 11 in (E)] vs. peak firing frequency of type B IPns in the modulation range of the pause [parameter 10 in (E)], pink arrows. The distribution (6) is the same one that the (2). (C,D) Interactions between parametric timing information and time delay in coupling between the firing rate of the types A and B IPns and the eyelid position response. The colored circular sectors in (C) and (D) illustrate the time-dispersion range of the data distributions represented in the panels (A) and (B), respectively. In (D), the yellow circular sector indicates the temporal range of beginning of the pause, and the orange circular arrow represents the duration of the pause (including the temporal ranges for the yellow and green circular sectors) across conditioning sessions. (E) Multiple parametric evolutions of timing and kinetic variables (parameters 10, 11, and 12) for type B IPns across conditioning sessions.
In Figure 7A, we selected as the timing components of the distributions the time to CR onset (see brown arrows) and the time to peak firing rate of the type A IPns (see blue arrows). The intensity components of the distributions were the percentage of CRs and the peak firing rate of type A IPns, respectively. Here, the timing-intensity associations enabled us to illustrate the simultaneous evolution of the timing and intensity components of the data distributions (from OO Mns and type A IPns firing activities, and eyelid CRs). Note the inverse interrelations between the percentage of CRs and the time to CR onset (brown arrows), and between the peak firing rate of type A IPns and their corresponding time of occurrence (blue arrows) across this associative learning test.
The right-hand circumferences in Figure 7A and the circular sectors in Figure 7C show the relative dispersion patterns of the time-intensity distributions. For example, in Figure 7A the mean values of the time to peak firing rate of type A IPns across the conditioning sessions [blue arrows, σs = 10.92 ± 1.01, (mean ± SEM)] were less spread out than the mean values of either time to CR onset [brown arrows, σs = 14.94 ± 1.23, (mean ± SEM)] or time delay in coupling between type A IPn firing frequency and eyelid position response [red arrows, σs = 45.84 ± 2.48, (mean ± SEM)]. These time-intensity patterns allowed us to verify the previous results,—i.e., the time to peak firing rate of type A IPns always lagged the beginning of the CRs [blue arrows, mean timing  s = 67.64 ± 3.07 ms, (mean ± SEM); brown arrows, mean timing s = 52.62 ± 1.89 ms, (mean ± SEM)]. Interestingly, the dispersion of the time delay of the correlation (type A IPns vs. eyelid position) showed a significantly [One-Way ANOVA F-tests, F(9, 27, 98) = 223.54, P < 0.01] longer transition from larger to smaller values, than did the time to peak firing rate of type A IPns across the sessions. Thus, to the beginning of the learning process the type A IPns encoded (from moderate to weak correlation) eyelid position responses after reaching their maximum firing rate, but at the end of the process (i.e., at the asymptotic level of acquisition of this associative learning test) the IPns encoded (with barely significant correlation) eyelid kinematics before their peak firing rate (but always after the beginning of the CRs). In geometric terms, the centroid of the blue circular sector (corresponding to the time to peak firing rate of the type A IPns in Figure 7C) was much further away from the center of the circumference than the centroid of the red circular sector [corresponding to time delay of the correlation (type A IPns vs. eyelid position)] was from the center of the same circumference—that is, the index of circular spread of the blue circular sector [σ = 5.77 ± 0.56; = 69.74 ± 2.26 ms, (mean ± SEM)] was smaller than the time-dispersion index of the red circular sector [σ = 32.71 ± 1.16, = 77.48 ± 3.05 ms, (mean ± SEM)]. This is generally the case—data sets with a greater degree of dispersion have centroids closer to the center of the circumference.
In the same way, in Figures 7B,D we illustrate the time-intensity distributions for the type B IPns (see the green and orange arrows). Here, we selected as the intensity components of the distributions the peak firing rate of type B IPns in the modulation range of the pause (parameter 10 in Figure 7E) and the lowest firing frequency of type B IPns during the pause. The timing components of the distributions were the time to peak firing rate of type B IPns in the modulation range of the pause (parameter 11 in Figure 7E) and the time to lowest firing frequency of type B IPns during the pause (parameter 12 in Figure 7E) with respect to CS presentation. The time-intensity components of the neuronal distribution allowed us to determinate the relative time dispersion patterns between type B neural commands and the eyelid kinematics (see the green and brown circular sectors in Figure 7D). According to data shown in Figures 7B,D, the time to lowest firing rate of type B IPns always lagged the beginning of the CRs [green arrows, mean timing s = 70.11 ± 2.80 ms, green circular sector, mean timing = 71.26 ± 3.03 ms, (mean ± SEM); brown arrows, mean timing s = 52.62 ± 1.89 ms, brown circular sector, = 56.92 ± 2.17 ms, (mean ± SEM)]. Finally, we illustrate the multiple parametric evolutions (Figure 7E) including the above kinetic (parameter 10) and timing (parameter 11 and 12) variables across conditioning sessions. Interestingly, parameter 10 did not change significantly [One-Way ANOVA F-tests, F(9, 45, 98) = 1.37, P > 0.05] and the parameters 11 and 12 [One-Way ANOVA F-tests, F(9, 45, 98) = 5.92, P < 0.01; F(9, 45, 98) = 2.07, P < 0.05, respectively] decreased across conditioning sessions. However, the time to peak firing rate of type B IPns in the modulation range of the pause with respect to the beginning of the CR (not with respect to CS presentation) did not change significantly [One-Way ANOVA F-tests, F(9, 45, 98) = 1.82, P > 0.05] across conditioning.
In Tables 1 and 2, we summarize the results including the statistical parameters that enabled us to describe the different patterns of dispersions for our dataset distributions. Notice the difference in the values of the dispersion indices between the time-intensity distributions (Table 1) and time distributions (Table 2) of the datasets. For the reports in Table 1, the intensity/strength components for all the data distributions have been normalized previously in accord with their maximum value across conditioning (see Figures 7A,B). In contrast, the matrix of intensity/strength components for the results in Table 2 has been substituted by a matrix of those to fit their values to the unitary circle (see Figures 7C,D). In fact, we calculated the different dispersion indices ( s, s,
s, s,  s, ρs, and σs, see Table 1; and , , , ρ, and σ, see Table 2) to reveal the true parametric timing-intensity and time delay-strength dispersion patterns between eyelid kinematic and either type A or type B IPns activities in the different temporal domains (inter-trials dispersion of the same block, inter-blocks dispersion of the same session, and inter-sessions dispersion along the process)—i.e., the time–intensity contributions (at least in the circular statistical sense) of the different neuronal centers (cerebellar interpositus and facial nuclei) participating in this associative learning process. In accordance with the above results, we analyzed the mean values of angle, timing, radius of centroid, circular kurtosis, and dispersion index for all the circular patterns [form (1) to (5) in Figure 7] using the von Mises distribution (the circular analog of the normal distribution). Thus, we could reject the Watson hypothesis test [e.g., explores whether (i) has the same mean for the different circular distributions of the timing data along the different training blocks, sessions, and for all the subjects] and to verify the temporal order of our physiological data. Here, the mean timing to peak firing rate of type A IPn was always bigger than the mean timing to CR onset respect to CS presentation, and the same for the time to lowest firing frequency of type B IPn. It could thus be concluded that the firing activities of IPns and their temporal dynamics may be related more with the proper performance of ongoing CRs (including the proper time-intensity dispersion patterns) than with their generation and/or initiation (Figures 7A–D and Tables 1–2).
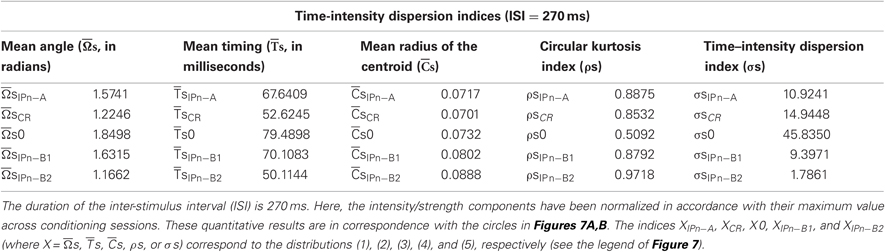
Table 1. The time-intensity dispersion indices corresponding to the circular distributions of the datasets across conditioning sessions.
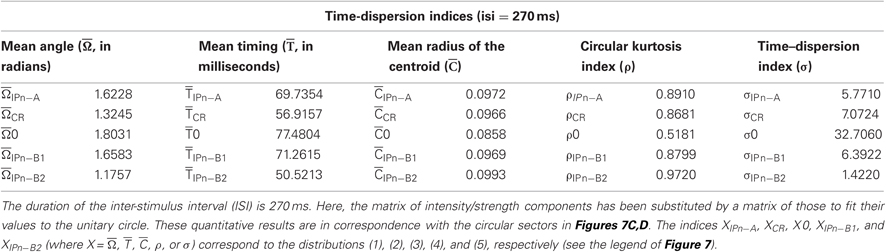
Table 2. The time dispersion indices corresponding to the circular distributions of the datasets across conditioning sessions.
Discussion
Seminal electrophysiological recordings of putative cerebellar nuclei units made in behaving rabbits revealed that eyeblink-related neurons are mostly located in the rostral aspects of the interpositus nucleus (McCormick and Thompson, 1984; Berthier and Moore, 1990). In contrast, eyelid-related neurons in behaving cats seem to occupy more-caudal locations—i.e., in the rostral part of the posterior interpositus nucleus (Gruart and Delgado-García, 1994; Gruart et al., 2000a; Delgado-García and Gruart, 2002). Nevertheless, neurons firing in response to facial mechanoreceptor activation were also observed in both the rostral interpositus and dentate nuclei (Gruart and Delgado-García, 1994). In agreement with recordings made in behaving monkeys (Van Kan et al., 1993), a detailed mapping of the three cerebellar nuclei in alert behaving cats indicates that neurons related to eyelid movements are preferentially located in the rostro-dorso-lateral aspect of the posterior interpositus nucleus (Gruart et al., 2000a). In this regard, recent data collected from mice (Porras-García et al., 2010) and rats (Morcuende et al., 2002; Chen and Evinger, 2006) also located eyeblink-related neurons in the dorsolateral hump and in the posterior interpositus nucleus, but not in the anterior subdivision of the nucleus. To date, there is no better explanation for these disparities in the location of eyeblink-related neurons than the possible neural differences within different species and/or the different experimental procedures used for their recording and identification. Nonetheless, we concentrated here on functional relationships and putative roles of antidromically identified type A and B IPns and OO MNs.
An Agonist–Antagonist Nuclear System Controlling Eyelid Biomechanics During Motor Learning
We have analyzed here the firing activities of type B posterior IPns, and compared them with those of by OO Mns and type A posterior IPns (Trigo et al., 1999; Gruart et al., 2000a; Delgado-García and Gruart, 2002; Sánchez-Campusano et al., 2007, 2009, 2011b). The analytical-experimental approach we developed (cumulative neural integration method, time-intensity dispersion models, multiple parametric evolutions, and raster and 3D representations in the time and frequency domains) enabled us to determine three lines of functional evidence that demonstrate the antagonistic properties of the two types (types A and B) of posterior IPn identified in alert behaving cats during classical eyeblink conditioning, using a delay paradigm.
First, a pause in the firing activity of type B IPns during the active downward displacement of the upper eyelid is not consistent with a role of these neurons in the active modulation of the firing rate of the OO Mns. This decreased activity would reduce the excitatory drive to facial Mns through the contralateral red nucleus (Morcuende et al., 2002; Chen and Evinger, 2006). In contrast, this active modulatory role on the final motor pathway of conditioned eyelid responses during the downward displacement has been described for type A IPns (Gruart et al., 2000a; Delgado-García and Gruart, 2002; Sánchez-Campusano et al., 2007, 2009). According to the present results, the mean peak firing rate of type A IPns increased across conditioning whilst the time interval between CR onset and their maximal discharge decreased, causing a drop in the correlation between the instantaneous discharge of type A IPns and conditioned eyelid responses (see Figure 5C). In addition, the increase in firing rate, in association with the decrease in its mean time of occurrence, caused a drop in the coefficient of correlation between the firing rate of type A IPns and conditioned eyelid responses (see the red arrows in Figure 7A). As a result, the time to maximum correlation (i.e., the time delay) always lagged the beginning of the CR (see the red and brown circular sectors in Figure 7C). Furthermore, our previous analysis of dynamic association (Sánchez-Campusano et al., 2009) allowed us to determine an asymmetric, non-linear, and non-unidirectional coupling between type A IPns and OO EMG recordings—i.e., type A IPs do not directly encode eyelid kinematics. These results could be explained if we assume that there is an indirect reinforcement and/or modulatory effect of type A IPns on OO Mns. In this sense, type A cerebellar posterior IPns could contribute to facilitating a quick repolarization of OO Mns, reinforcing their tonic firing during the active contraction of the OO muscle and, therefore, during the active eyelid downward displacements of the upper eyelid. In turn, the discharge rate of the OO Mns increased progressively across the learning process, with a relative refractory period (minimum interspike time interval) that decreased progressively in the CS–US interval (see Figure 5D). This inference is supported by the experimental fact that the total number of spikes generated by these facial Mns during the CS–US interval increased across the learning process in relation to the increased number of muscular action potentials from OO EMG activity and, therefore, with the progressive increase in the amplitude of the corresponding conditioned eyelid responses (see Figure 5E). Thus, an OO Mn pattern of discharge that correlated significantly with eyelid position (Trigo et al., 1999; Sánchez-Campusano et al., 2007) and OO EMG activity (Sánchez-Campusano et al., 2009, 2011b) during CRs was obtained in all the conditioning sessions.
Second, the integrated neural activity of type B IPns did not show oscillatory properties—e.g., a saturation of the cumulative integrated pattern (Figures 4C,E) determined by the sustained pause in their firing frequency in the CS–US interval (the green profiles in Figure 3B). In contrast, the neural nature of the 50 ms mean period of oscillation characteristic of eyelid kinematics (see the 20 Hz spectral component in Figures 6C,F) can be suitably explained by the oscillatory properties (at the same fundamental frequency and period) of the relative variation functions of both type A IPns and OO Mns integrated neural activities (Figures 4B,D) during this associative learning process. Furthermore, and in accordance with the above results (Figure 4B), the reinforcing-modulating role of cerebellar circuits of ongoing conditioned eyelid responses is highly dependent on their adequate phase modulation with respect to intrinsic facial Mns oscillatory properties. Thus, type A IPns could be considered to behave as a neuronal phase-modulating device supporting OO Mns firing during learned eyelid movements (Sánchez-Campusano et al., 2007).
Third, the timing analysis of the cessation of firing activity of the type B IPns allowed us to demonstrate that their time to peak firing rate in the modulation range of the pause (see green arrow in Figures 4C,E) with respect to the beginning of the CRs (see brown circle in Figure 4E) did not change significantly [One-Way ANOVA F-tests, F(9, 45, 98) = 1.82, P > 0.05] across conditioning sessions. In turn, the mean values of the latency to peak firing rate of type A IPns during the evolution across all the conditioning sessions were always located within the temporal range of the pause of type B IPn firing rate, but always after the onset of CRs. The mean delays between the critical points (peak firing rate of type A IPns, lowest firing rate of type B IPns) and the mean time to CR onset were Δt ≈20 ms during the first days of conditioning (e.g., for the sessions C3–C6, Δt = b–c in Figures 5A and 6A,B) and Δt ≈16 ms at the asymptotic level of acquisition of this associative learning test (i.e., session C10, Figure 4E). Moreover, in accordance with parameters 2 (Figure 5C) and 8 (Figure 5E), the mean delay Δt along the conditioning sessions was 12.81 ± 0.28 ms (mean ± SEM). However, the main outcome of this timing analysis was that the latency to the initial modulation of the pause in type B IPns was always smaller than the latency to the initial modulation of the burst in type A IPns, just the time necessary for the amplitudes of the two firing frequencies (for types A and B IPns) to reach the critical points (peak and lowest firing frequencies, Figures 4E, 5A, and 6A,B) of their antagonistic behavior simultaneously. This inference is supported by the experimental fact that the two types of neuron (types A and B IPns) have similar antidromic latencies (latency in the range 0.5–1.2 ms, see Gruart et al., 2000a; Jiménez-Díaz et al., 2004; Sánchez-Campusano et al., 2007) after red nucleus stimulation, and therefore, an action potential of these neurons should affect EMG activity of the involved eyelid muscles 5–6 ms later, combining an assumption of equal conduction velocities for the interpositus nucleus projection to the red nucleus and for the red nucleus projection to the motoneuronal system with the 2 ms latency of EMG activity after motoneuron discharge (Pellegrini et al., 1995; Chen and Evinger, 2006). Finally, we can suggest that the two types of simultaneous action (facilitation and disfacilitation) are in accordance with a dominant role of cerebellar circuits for the facilitation of flexor responses. Thus, type A IPns fire during active eyelid downward displacements—i.e., during the active contraction of the OO muscle (a facilitation of OO Mns). In contrast, type B IPns present a high tonic rate when the eyelids are wide open, and stop firing during any active downward displacement of the upper eyelid—i.e., a disfacilitation of LPS Mns.
Although the contribution of cerebellar circuits to classical eyeblink conditioning is still controversial (Llinás and Welsh, 1993; Mauk, 1997; Seidler et al., 2002; Koekkoek et al., 2003; Welsh et al., 2005; Delgado-García and Gruart, 2006; Kreider and Mauk, 2010), we can suggest from an anatomo-functional point of view that type B IPns project, by the ascending limb of the posterior peduncle, not only to the red nucleus and to the mesencephalic oculomotor area, but also to, among other structures, the perioculomotor area (Porter et al., 1989; Gonzalo-Ruiz and Leichnetz, 1990; Gonzalo-Ruiz et al., 2004)—that is, more or less directly onto LPS Mns (Gruart and Delgado-García, 1994). In addition, it could be suggested that type B IPns play a facilitative role in the antagonistic action of the LPS muscle. In this sense, our experimental-analytical approach to the study of cerebellar function takes into account the neural (types A and B IPns to modulate the OO and LPS Mns, respectively) and biomechanical (OO and LPS muscles) elements of a double activation–deactivation system controlling eyelid kinematics (eyelid position, velocity, and acceleration profiles) during motor learning.
Conflict of Interest Statement
The authors declare that the research was conducted in the absence of any commercial or financial relationships that could be construed as a potential conflict of interest.
Acknowledgments
Work supported by grants MICINN-BFU2008–0899, P07-CVI-2487 and JA-BIO-122 to José M. Delgado-García, and MICINN-BFU2008–03390 and P07-CVI-02686 to Agnés Gruart. We thank Roger Churchill for his editorial help.
Abbreviations
CRs, conditioned responses; CS, conditioned stimulus; EMG, electromyography; IPn, interpositus neuron; LPS, levator palpebrae superioris; OO, orbicularis oculi; US, unconditioned stimulus.
References
Aksenova, T. I., Chibirova, O. K., Dryga, O. A., Tetko, I. V., Benabid, A. L., and Villa, A. E. P. (2003). An unsupervised automatic method for sorting neuronal spike waveforms in awake and freely moving animals. Method 30, 178–187.
Bartha, G. T., and Thompson, R. F. (1992a). Control of rabbit nictitating membrane movements: 1. A computer model of the retractor bulbi muscle and the associated orbital mechanics. Biol. Cybern. 68, 135–143.
Bartha, G. T., and Thompson, R. F. (1992b). Control of rabbit nictitating membrane movements: II. Analysis of the relation of motoneuron activity to behavior. Biol. Cybern. 68, 145–154.
Berman, A. L. (1968). The Brain Stem of the Cat: A Cytoarchitectonic Atlas with Stereotaxic Coordinates. Madison, WI: University of Wisconsin Press.
Berthier, N. E., Barto, A. G., and Moore, J. W. (1991). Linear systems analysis of the relationship between firing of deep cerebellar neurons and the classically conditioned nictitating membrane response in rabbits. Biol. Cybern. 65, 99–105.
Berthier, N. E., and Moore, J. W. (1990). Activity of deep cerebellar nuclear cells during classical conditioning of nictitating membrane extension in rabbits. Exp. Brain Res. 83, 44–54.
Bracha, V., Zhao, L., Irwin, K., and Bloedel, J. R. (2001). The human cerebellum and associative learning: dissociation between the acquisition, retention and extinction of conditioned eyeblinks. Exp. Brain Res. 136, 41–49.
Brown, E. N., Kass, R. E., and Mitra, P. P. (2004). Multiple neural spike train data analysis: state-of-the-art and future challenges. Nat. Neurosci. 7, 456–461.
Campolatarro, M. M., Kashef, A., Lee, I., and Freeman, J. H. (2011). Neuronal correlates of cross-modal transfer in the cerebellum and pontine nuclei. J. Neurosci. 31, 4051–4062.
Chan, H. L., Wu, T., Lee, S. T., Fang, S. C., Chao, P. K., and Lin, M. A. (2008). Classification of neuronal spikes over the reconstructed phase space. J. Neurosci. Meth. 168, 203–211.
Chen, F. P., and Evinger, C. (2006). Cerebellar modulation of trigeminal reflex blinks: interpositus neurons. J. Neurosci. 26, 10569–10576.
Christian, K. M., and Thompson, R. F. (2003). Neural substrates of eyeblink conditioning: acquisition and retention. Learn. Mem. 10, 427–455.
Delgado-García, J. M., and Gruart, A. (2002). The role of interpositus nucleus in eyelid conditioned responses. Cerebellum 1, 289–308.
Delgado-García, J. M., and Gruart, A. (2005). Firing activities of identified posterior interpositus nucleus neurons during associative learning in behaving cats. Brain Res. Rev. 49, 367–376.
Delgado-García, J. M., and Gruart, A. (2006). Building new motor responses: eyelid conditioning revisited. Trends Neurosci. 29, 330–338.
Domínguez-del-Toro, E., Rodríguez-Moreno, A., Porras-García, E., Sánchez-Campusano, R., Blanchard, V., Lavilla, M., Böhme, G. A., Benavides, J., and Delgado-García, J. M. (2004). An in vitro and in vivo study of early deficits in associative learning in transgenic mice that over-express a mutant form of human APP associated with Alzheimer's disease. Eur. J. Neurosci. 20, 1945–1952.
Domingo, J. A., Gruart, A., and Delgado-García, J. M. (1997). Quantal organization of reflex and conditioned eyelid responses. J. Neurophysiol. 78, 2518–2530.
Evinger, C., and Manning, K. A. (1993). Pattern of extraocular muscle activation during reflex blinking. Exp. Brain Res. 92, 502–506.
Evinger, C., Manning, K. A., and Sibony, P. A. (1991). Eyelid movements. Mechanisms and normal data. Invest. Ophthalmol. Vis. Sci. 32, 387–400.
Fernández-Lamo, I., Montero-Pedrazuela, A., Delgado-García, J. M., Guadaño-Ferraz, A., and Gruart, A. (2009). Effects of thyroid hormone replacement on associative learning and hippocampal synaptic plasticity in adult hypothyroid rats. Eur. J. Neurosci. 30, 679–692.
Fisher, N. I. (1993). Statistical Analysis of Circular Data. New York, NY: Cambridge University Press.
Freeman, J. H., and Steinmetz, A. B. (2011). Neural circuitry and plasticity mechanisms underlying delay eyeblink conditioning. Learn. Mem. 18, 666–677.
Gonzalo-Ruiz, A., and Leichnetz, G. R. (1990). Connections of the caudal cerebellar interpositus complex in a New World monkey (Cebus apella). Brain Res. Bull. 25, 919–927.
Gonzalo-Ruiz, A., Leichnetz, G. R., and Hardy, S. G. P. (2004). Projections of the medial cerebellar nucleus to oculomotor-related midbrain areas in the rat: an anterograde and retrograde HRP study. J. Comp. Neurol. 296, 427–436.
Grafen, A., and Hails, R. (2002). Modern Statistics for the Life Sciences. New York, NY: Oxford University Press Inc.
Gruart, A., Blázquez, P., and Delgado-García, J. M. (1995). Kinematics of unconditioned and conditioned eyelid movements in the alert cat. J. Neurophysiol. 74, 226–248.
Gruart, A., and Delgado-García, J. M. (1994). Discharge of identified deep cerebellar nuclei neurons related to eye blinks in the alert cat. Neuroscience 61, 665–681.
Gruart, A., Guillazo-Blanch, G., Fernández-Mas, R., Jiménez-Díaz, L., and Delgado-García, J. M. (2000a). Cerebellar posterior interpositus nucleus as an enhancer of classically conditioned eyelid responses in alert cats. J. Neurophysiol. 84, 2680–2690.
Gruart, A., Muñoz, M. D., and Delgado-García, J. M. (2006). Involvement of the CA3-CA1 synapse in the acquisition of associative learning in behaving mice. J. Neurosci. 26, 1077–1087.
Gruart, A., Pastor, A. M., Armengol, J. A., and Delgado-García, J. M. (1997). Involvement of cerebellar cortex and nuclei in the genesis and control of unconditioned and conditioned eyelid motor responses. Prog. Brain Res. 114, 511–528.
Gruart, A., Schreurs, B. G., Domínguez-del-Toro, E., and Delgado-García, J. M. (2000b). Kinetic and frequency-domain properties of reflex and conditioned eyelid responses in the rabbit. J. Neurophysiol. 83, 836–852.
Gruart, A., Streppel, M., Guntinas-Lichius, O., Angelov, D. N., Neiss, W. F., and Delgado-García, J. M. (2003). Motoneuron adaptability to new motor tasks following two types of facial-facial anastomosis in cats. Brain 126, 115–133.
Hair, J. F., Anderson, R. E., Tatham, R. L., and Black, W. C. (1998). Multivariate Data Analysis. New Jersey, NJ: Prince–Hall, Inc.
Hesslow, G., and Yeo, C. (1998). Cerebellum and learning: a complex problem. Science 280, 1817–1819.
Hung, G., Hsu, F., and Stark, L. (1977). Dynamics of the human eye blink. Am. J. Optom. Physiol. Opt. 54, 678–690.
Huxley, A. F. (1957). Muscle structure and theories of contraction. Prog. Biophys. Biophys. Chem. 7, 257–318.
Jammalamadaka, S. R., and SenGupta, A. (2001). Topics in circular statistics. Singapore: World Scientific Press.
Jarvis, M. R., and Mitra, P. P. (2001). Sampling properties of the spectrum and coherency in sequences of action potentials. Neural Comput. 13, 717–749.
Jiménez-Díaz, L., Navarro-López, J. de D., Gruart, A., and Delgado-García, J. M. (2004). Role of cerebellar interpositus nucleus in the genesis and control of reflex and conditioned eyelid responses. J. Neurosci. 24, 9138–9145.
Joe, H. (1989). Relative entropy measures of multivariate dependance. J. Am. Stat. Assoc. 84, 157–164.
Koekkoek, S. K., Hulscher, H. C., Dortland, B. R., Hensbroek, R. A., Elgersma, Y., Ruigrok, T. J., and De Zeeuw, C. I. (2003). Cerebellar LTD and learning-dependent timing of conditioned eyelid responses. Science 301, 1736–1739.
Kreider, J. C., and Mauk, M. D. (2010). Eyelid conditioning to a target amplitude: adding how much to whether and when. J. Neurosci. 30, 14145–14152.
Krupa, D. J., Thompson, J. K., and Thompson, R. F. (1993). Localization of a memory trace in the mammalian brain. Science 260, 989–991.
Leal-Campanario, R., Barradas-Bribiescas, J. A., Delgado-García, J. M., and Gruart, A. (2004). Relative contributions of eyelid and eye-retraction motor systems to reflex and classically conditioned blink responses in the rabbit. J. Appl. Physiol. 96, 1541–1554.
Leal-Campanario, R., Fairén, A., Delgado-García, J. M., and Gruart, A. (2007). Electrical stimulation of the rostral medial prefrontal cortex in rabbits inhibits the expression of conditioned eyelid responses but not their acquisition. Proc. Natl. Acad. Sci. U.S.A. 104, 11459–11464.
Lepora, N. F., Mavritsaki, E., Porrill, J., Yeo, C. H., Evinger, C., and Dean, P. (2007). Evidence from retractor bulbi EMG for linearised motor control of conditioned nictitating membrane responses. J. Neurophysiol. 98, 2074–2088.
Lepora, N. F., Porrill, J., Yeo, C. H., Evinger, C., and Dean, P. (2009). Recruitment in retractor bulbi muscle during eyeblink conditioning: EMG analysis and common-drive model. J. Neurophysiol. 102, 2498–2513.
Llinás, R., and Welsh, J. P. (1993). On the cerebellum and motor learning. Curr. Opin. Neurobiol. 3, 958–965.
Mauk, M. D. (1997). Roles of cerebellar cortex and nuclei in motor learning: contradictions or clues? Neuron 18, 343–346.
Mavritsaki, E., Lepora, N. F., Porrill, J., Yeo, C. H., and Dean, P. (2007). Response linearity determined by recruitment strategy in detailed model of nictitating membrane control. Biol. Cybern. 96, 39–57.
McCormick, D. A., Lavond, D. G., and Thompson, R. F. (1982). Concomitant classical conditioning of the rabbit nictitating membrane and eyelid responses: correlations and implications. Physiol. Behav. 28, 769–775.
McCormick, D. A., and Thompson, R. F. (1984). Neuronal responses of the rabbit cerebellum during acquisition and performance of a classically conditioned nictitating membrane-eyelid response. J. Neurosci. 4, 2811–2822.
Morcuende, S., Delgado-García, J. M., and Ugolini, G. (2002). Neuronal premotor networks involved in eyelid responses: retrograde transneuronal tracing with rabies virus from the orbicularis oculi muscle in the rat. J. Neurosci. 22, 8808–8818.
Pellegrini, J. J., and Evinger, C. (1995). The trigeminally evoked blink reflex. II. Mechanisms of paired-stimulus suppression. Exp. Brain Res. 107, 181–196.
Pellegrini, J. J., Horn, A. K., and Evinger, C. (1995). The trigeminally evoked blink reflex. I. Neuronal circuits. Exp. Brain Res. 107, 166–180.
Porras-García, E., Sánchez-Campusano, R., Martínez-Vargas, D., Domínguez-del-Toro, E., Cendelín, J., VoŽeh, F., and Delgado-García, J. M. (2010). Behavioral characteristics, associative learning capabilities, and dynamic association mapping in an animal model of cerebellar degeneration. J. Neurophysiol. 104, 346–365.
Porter, J. D., Burns, L. A., and May, P. J. (1989). Morphological substrate for eyelid movements: innervation and structure of primate levator palpebrae superioris and orbicularis oculi muscles. J. Comp. Neurol. 287, 64–81.
Sánchez-Campusano, R., Delgado-García, J. M., and Gruart, A. (2003). A phenomenological model for the neuromuscular control of reflex and learned eyelid responses. Program No. 78.2. 2003 Neuroscience Meeting Planner. New Orleans, LA: Society for Neuroscience, 2003. [Online].
Sánchez-Campusano, R., Gruart, A., and Delgado-García, J. M. (2007). The cerebellar interpositus nucleus and the dynamic control of learned motor responses. J. Neurosci. 27, 6620–6632.
Sánchez-Campusano, R., Gruart, A., and Delgado-García, J. M. (2009). Dynamic associations in the cerebellar-motoneuron network during motor learning. J. Neurosci. 29, 10750–10763.
Sánchez-Campusano, R., Gruart, A., and Delgado-García, J. M. (2011a). Dynamic changes in the cerebellar-interpositus/red-nucleus-motoneuron pathway during motor learning. Cerebellum 10, 702–710.
Sánchez-Campusano, R., Gruart, A., and Delgado-García, J. M. (2011b). Timing and causality in the generation of learned eyelid responses. Front. Integr. Neurosci. 5:39. doi: 10.3389/fnint.2011.00039
Seidler, R. D., Purushotham, A., Kim, S. G., Ugurbil, K., Willingham, D., and Ashe, J. (2002). Cerebellum activation associated with performance change but not motor learning. Science 296, 2043–2046.
Shaw, M. D., and Baker, R. (1983). Direct projections from vestibular nuclei to facial nucleus in cats. J. Neurophysiol. 50, 1265–1280.
Shaw, M. D., and Baker, R. (1985). Morphology of motoneurons in a mixed motor pool of the cat facial nucleus that innervate orbicularis oculis and quadratus labii superioris, stained intracellularly with horseradish peroxidase. Neuroscience 14, 627–643.
Trigo, J. A., Gruart, A., and Delgado-García, J. M. (1999). Discharge profiles of abducens, accessory abducens, and orbicularis oculi motoneurons during reflex and conditioned blinks in alert cats. J. Neurophysiol. 81, 1666–1684.
Trigo, J. A., Roa, L., Gruart, A., and Delgado-García, J. M. (2003) A kinetic study of blinking responses in cats. J. Physiol. 549, 195–205.
Valenzuela-Harrington, M., Gruart, A., and Delgado-García, J. M. (2007). Contribution of NMDA receptor NR2B subunit to synaptic plasticity during associative learning in behaving rats. Eur. J. Neurosci. 25, 830–836.
Van Kan, P. L. E., Houk, J. C., and Gibson, A. R. (1993). Output organization of intermediate cerebellum of the monkey. J. Neurophysiol. 69, 57–73.
Welsh, J. P., and Harvey, J. A. (1991). Pavlovian conditioning in the rabbit during inactivation of the interpositus nucleus. J. Physiol. (Lond.) 444, 459–480.
Keywords: classical eyeblink conditioning, cerebellar interpositus neurons, kinetic neural commands, eyelid kinematics, motor learning, agonist–antagonist system, timing, dispersion patterns
Citation: Sánchez-Campusano R, Gruart A, Fernández-Mas R and Delgado-García JM (2012) An agonist–antagonist cerebellar nuclear system controlling eyelid kinematics during motor learning. Front. Neuroanat. 6:8. doi: 10.3389/fnana.2012.00008
Received: 05 December 2011; Accepted: 24 February 2012;
Published online: 14 March 2012.
Edited by:
José A. Armengol, University Pablo de Olavide, SpainReviewed by:
Guy Cheron, Université Libre de Bruxelles, BelgiumAdonis Moschovakis, University of Crete, Greece
Copyright: © 2012 Sánchez-Campusano, Gruart, Fernández-Mas and Delgado-García. This is an open-access article distributed under the terms of the Creative Commons Attribution Non Commercial License, which permits non-commercial use, distribution, and reproduction in other forums, provided the original authors and source are credited.
*Correspondence: Raudel Sánchez-Campusano and José M. Delgado-García, División de Neurociencias, Universidad Pablo de Olavide, Ctra. de Utrera, Km. 1, 41013-Sevilla, Spain. e-mail: rsancam@upo.es; jmdelgar@upo.es