The claustrum and insula in Microcebus murinus: a high resolution diffusion imaging study
- 1 Computation and Neural Systems, California Institute of Technology, Pasadena, CA, USA
- 2 Caltech Brain Imaging Center, California Institute of Technology, Pasadena, CA, USA
- 3 Division of Biology, California Institute of Technology, Pasadena, CA, USA
The claustrum and the insula are closely juxtaposed in the brain of the prosimian primate, the gray mouse lemur (Microcebus murinus). Whether the claustrum has closer affinities with the cortex or the striatum has been debated for many decades. Our observation of histological sections from primate brains and genomic data in the mouse suggest former. Given this, the present study compares the connections of the two structures in Microcebus using high angular resolution diffusion imaging (HARDI, with 72 directions), with a very small voxel size (90 micra), and probabilistic fiber tractography. High angular and spatial resolution diffusion imaging is non-destructive, requires no surgical interventions, and the connection of each and every voxel can be mapped, whereas in conventional tract tracer studies only a few specific injection sites can be assayed. Our data indicate that despite the high genetic and spatial affinities between the two structures, their connectivity patterns are very different. The claustrum connects with many cortical areas and the olfactory bulb; its strongest probabilistic connections are with the entorhinal cortex, suggesting that the claustrum may have a role in spatial memory and navigation. By contrast, the insula connects with many subcortical areas, including the brainstem and thalamic structures involved in taste and visceral feelings. Overall, the connections of the Microcebus claustrum and insula are similar to those of the rodents, cat, macaque, and human, validating our results. The insula in the Microcebus connects with the dorsolateral frontal cortex in contrast to the mouse insula, which has stronger connections with the ventromedial frontal lobe, yet this is consistent with the dorsolateral expansion of the frontal cortex in primates. In addition to revealing the connectivity patterns of the Microcebus brain, our study demonstrates that HARDI, at high resolutions, can be a valuable tool for mapping fiber pathways for multiple sites in fixed brains in rare and difficult-to-obtain species.
Introduction
Microcebus murinus, the gray mouse lemur, is a prosimian species native to the island of Madagascar. Microcebus bears many similarities to the common ancestor of primates, which motivated the early study of the microscopic anatomy of its cerebral cortex by Le Gros Clark (1931; A supplemental figure adapted from Le Gros Clark, 1931 is available at http://allmanlab.caltech.edu/). Many sources of evidence indicate that the common primate ancestor probably lived in tropical forests; was highly arboreal; was small in size, weighing 500 g or less; was nocturnal; and fed on both fruits and small animals. M. murinus satisfies all of these criteria (Martin, 1990), and the species’ skull shape and external brain morphology closely resemble the fossil primates of the early Eocene period, 55 million years ago (Radinsky, 1975; Allman, 1977). These observations suggest a possible role of the Microcebus as an extant proxy for the common ancestor of primates, hence motivating us to study the species as a way of exploring the evolution of primate brains.
The claustrum is a thin, sheet-like subcortical cellular structure found in mammalian brains. In primates it is located between the putamen and the insular cortex, usually separated from each of these two structures by the external capsule and the extreme capsule, respectively (Figures 1A,B). Due to the claustrum’s location, size, and shape, it is very challenging to investigate the structure’s connections and function using techniques that are currently available. However, the limited amount of data from other species suggest that it is extensively connected with many cortical areas including the prefrontal, temporal polar, motor, hippocampal, parahippocampal, parietal, and visual cortices (Tanné-Gariépy et al., 2002; Edelstein and Denaro, 2004). Connections with the thalamus, caudate, and amygdala have also been found (LeVay and Sherk, 1981; Arikuni and Kubota, 1985; Jiménez-Castellanos and Reinoso-Suárez, 1985; Amaral and Insausti, 1992; Edelstein and Denaro, 2004).
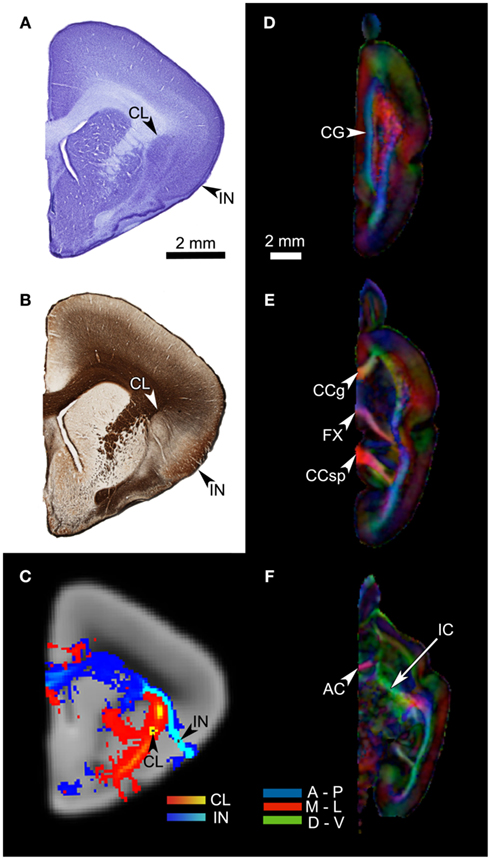
Figure 1. (A) A coronal section of the Microcebus murinus brain, stained for cell body with the cresyl violet Nissl technique. The arrows point to the claustrum (CL) and the insula (IN). (B) An adjacent section, processed with the Gallyas silver staining technique, showing fiber distributions. Note the external capsule segregating the claustrum from the putamen, and the extreme capsule barely separating the claustrum from the insula. (C) A coronal cross-section of the HARDI data, at the level and cutting plane similar to those of the histological sections. The arrows indicate the locations of the claustral and mid-insular seeds. The red-yellow tract originates from the claustral seed, whereas the blue-light blue tract arises from the mid-insular seed. (D–F) The fractional anisotropy (FA) map of the HARDI data, in horizontal planes. This map reflects the distribution of fiber tracts in the brain tissue, with the colors representing fiber directions (blue = anterior-posterior; red = medial-lateral; green = dorsal-ventral). The map clearly shows a number of major fiber bundles, such as the anterior commissure (AC), cingulum bundle (CG), corpus callosum, genu (CCg), corpus callosum, splenium (CCsp), fornix (FX), and internal capsule (IC).
The insular cortex, adjacent to the claustrum and separated from its neighbor by the extreme capsule, has been extensively studied in various animals. In the species whose insular cortices have been often studied – macaque, rat, and mouse, for example – the structure has been divided into three main, cytoarchitecturally distinct, parts: the agranular insula located anteroventrally, and the granular insula in the posterodorsal portion, with the intermediate dysgranular insula in between (Brodmann, 1909; Rose, 1928; Mesulam and Mufson, 1982a; Shi and Cassell, 1998; Van De Werd et al., 2010).
These agranular, granular, and dysgranular portions of the insula show different connectivity patterns and functions. In the macaque, the anterior insula is associated with the perirhinal-entorhinal cortex, anterior cingulate cortex (ACC), and amygdala, hence linking the structure with the gustatory and olfactory systems, as well as emotion processing. On the other hand, the granular insula is connected with the auditory and somatosensory cortices plus the visual area TEm. This implicates the structure in integration of the regions that process the non-chemical sensory input from the outside environment (Mesulam and Mufson, 1982b; Mufson and Mesulam, 1982, 1984). In addition, the non-human primate granular insula receives somesthetic afferents from the lamina I neurons of the spinal cord via the ventromedial nucleus of the thalamus, representing the interoceptive state of the animal (Craig, 2002). The dysgranular insula, whose cytoarchitecture represents the gradual transition between the agranular and the granular cortex, shows agranular connections in its anterior portion and granular connections in the posterior (Mesulam and Mufson, 1982b; Mufson and Mesulam, 1982, 1984). The rat insula shows a similar dissociation in connectivity and function, with the agranular insula richly associated with the limbic areas, whereas the granular and dysgranular insular cortices seem to receive visceral, homeostatic inputs (Allen et al., 1991).
There has been a long debate concerning the ontogenetic origin of the claustrum, with three different views: the opinion that the structure is derived from the adjacent insular cortex (Meynert, 1868; Brodmann, 1909), the view that it is a part of the basal ganglia (Edelstein and Denaro, 2004), and the one that argues for claustrum’s independence from cortical or subcortical origin (Filimonoff, 1966). Meynert (1868) and Brodmann (1909) considered the claustrum to be part of the insular layer VI, and defined the borders of the insular cortex according to the location of the claustrum. Bayer and Altman(1991a,b) supported this view by demonstrating that, in rat embryos, the claustrum and the deep layer of the anterior insular cortex emerge on the same day. This view has also been supported in the context of pallidal evolution in reptiles and birds: Striedter (1997), based on comparative analysis of reptilian, avian, and mammalian brains, argued that the claustrum and the endopiriform nucleus (primate ventral claustrum) are pallidal in origin. In addition, Puelles et al. (2000) have shown that the mammalian homologs of some of the genetic markers for the pallidum in the embryonic chick are expressed in the claustrum, suggesting cortical affinity. The second conception that the claustrum has its closest affinites to the striatum, rather than the insular cortex, is supported by evidence that it is possible for the claustrum to develop into a significant size in near absence of the insula, and that the human claustrum tends to extend much beyond the upper border of the insula. It has also been pointed out that the human embryonic claustrum is not directly connected with the deep layers of the insula. Instead, it is well-separated from the cortex by the uncinate fasciculus as well as the extreme capsule, and closely connected to the amygdala in some parts (Landau, 1919). The opinion that the claustrum is neither cortical nor subcortical was supported by Ramón y Cajal (1900) and by Filimonoff (1966), who, based on an exhaustive study of human adult and embryonic brains, concluded that the claustrum is an intermediate structure between the striatum and the cortex. A recent proteomic study of the rat claustrum agreed with this view, although it also found a claustral affinity with layer VI of the insular cortex (Mathur et al., 2009).
Inspecting histological sections from primate brains available in our laboratory supports the cortical origin of the claustrum. The spatial relationship between the claustrum and insula in the Microcebus is illustrated in the photomicrographs of Nissl- and Gallyas-stained coronal sections (Figures 1A,B) and Nissl- and Heidenhain-stained horizontal sections (Figures 2A,B). These sections show that the two structures are only barely separated from each other. The extreme capsule is very thin and does not entirely segregate the claustrum from the insula, and the claustrum appears to be an extra layer of the insula. This is unlike most other primate brains, in which claustrum and insula are more clearly separated by the extreme capsule: Figures 2C–F show Nissl- and Gallyas-stained sections from the brains of a tarsier (Tarsius bancanus) and an orangutan (Pongo abelii), including the claustrum, extreme capsule, and insula. In the tarsier (Figures 2C,D) the extreme capsule divides only the dorsal half of the claustrum from the insula, while the ventral halves of the two structures appear fused. However, based on the width of the extreme capsule, the dorsal segregation seems quite robust. In the orangutan (Figures 2E,F), the claustrum is completely separated from the insula.
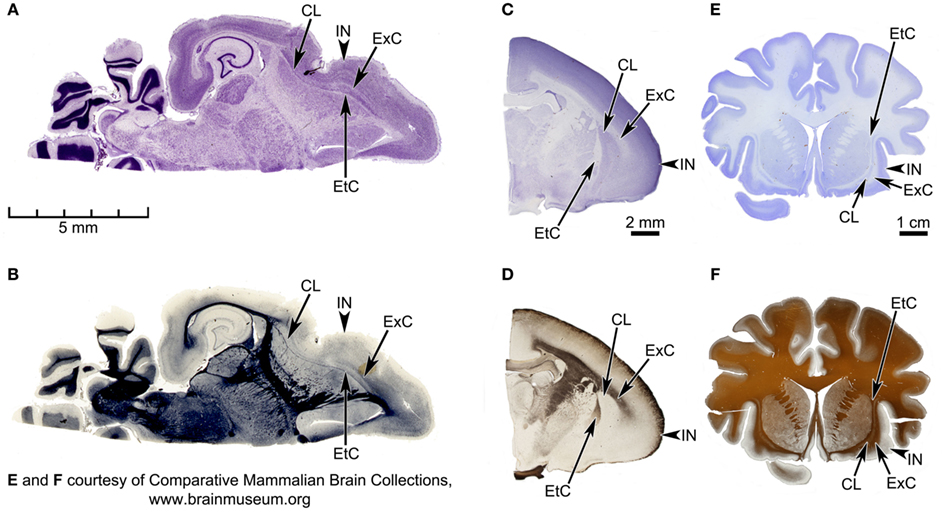
Figure 2. Horizontal sections of the Microcebus brain, and coronal sections of tarsier (Tarsius bancanus) and orangutan (Pongo abelii) brains, depicting the spatial relationship between claustrum and insula in the three species. (A,B) Horizontal sections of the Microcebus brain, stained for cell bodies with the cresyl violet Nissl technique (A) and for axon fibers with the Heidenhain technique (B). (C,D) Coronal sections of the tarsier brain, stained for cell bodies with the cresyl violet Nissl technique (C) and for axon fibers with the Gallyas technique (D). (E,F) Coronal sections of the orangutan brain, stained for cell bodies with the cresyl violet Nissl technique (E) and for axon fibers with the Gallyas technique (F). In all panels, the external capsule (EtC), claustrum (CL), extreme capsule (ExC), and Insula (IN) are labeled. In the tarsier, the claustrum and the insula, while clearly segregated in the dorsal halves, appear fused together in the ventral portions. On the other hand, the extreme capsule in the orangutan is very extensive, completely separating the two structures. In the Microcebus the claustrum and the insula are extremely close together. Also, whereas the external capsule is relatively well defined throughout its entire length, the extreme capsule is almost absent in some parts. (A,B) Courtesy of the Comparative Mammalian Brain Collections (http://www.brainmuseum.org/), a collaborative effort among the University of Wisconsin-Madison, Michigan State University, and the National Museum of Health and Medicine, funded by the National Science Foundation and the National Institutes of Health.
We have also investigated the genetic affinities of the claustrum and the insula, and compared them with those of their neighboring regions. Using Allen Institute for Brain Science’s AGEA (Allen Mouse Brain Atlas, 2004), we studied the gene expression correlation patterns based on 4,376 genes in the claustrum, insula, caudate-putamen, and the olfactory cortex in the mouse. Figure 3 shows the expression pattern of each region: the claustrum has the strongest correlations with the deep cortical layers and a large part of the insula, whereas the caudate-putamen seems mostly self-contained in terms of genetic expressions and shows no special affinity with the claustrum. The olfactory cortex, while moderately associated with all cortical areas, is most significantly correlated with itself. Meanwhile, the anterior insula is highly correlated with the cingulate cortex as well as itself.
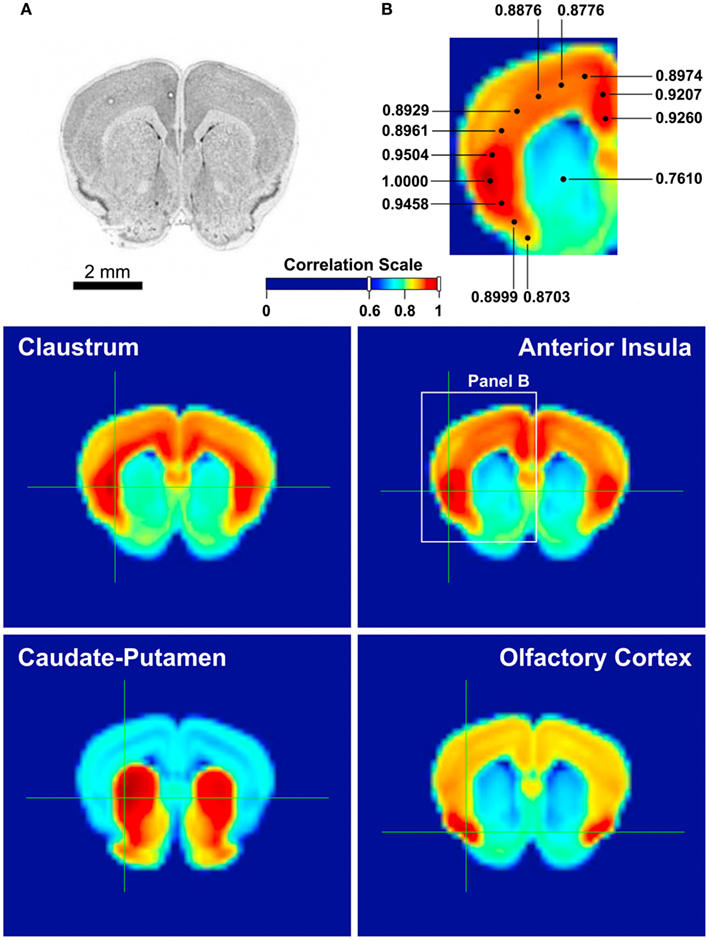
Figure 3. Gene expression correlation maps provided by Allen Brain Atlas AGEA. AGEA, an on-line, open-access tool developed at the Allen Institute for Brain Science, is based on in situ hybridization data from the adult C57Bl/6J mouse brain, which provided the expression patterns of 4,376 genes. User can select a region of interest on the atlas and obtain a three-dimensional map of the mouse brain showing the total gene expression correlation between the region of interest and any of the other regions. AGEA also provides users with lists of genes with enhanced expression in correlated areas (Ng et al., 2009). (A) A reference section of the mouse brain, containing the claustrum, insula, caudate-putamen, and olfactory cortex. (B) A magnified view of the middle right panel, illustrating the strong correlation between the anterior insula and the cingulate cortex. Each number indicates the degree of correlation between the selected area and the location of the dot connected with the number. The dot with the correlation value of 1.0000 is where the selection crosshair was placed. Middle left: The mouse claustrum’s gene expression correlation profile. According to the correlation scale [between (A,B)], the claustrum is most strongly affiliated with the deep layers of the insular cortex. Middle right: The anterior insula’s gene expression is most highly correlated with the cingulate cortex, as well as itself. Bottom left: The caudate-putamen, besides a moderately high correlation with the olfactory tubercle, is mostly contained within itself. Bottom right: The olfactory cortex, other than the moderately high correlation with the cortex, is mostly correlated with itself.
From an evolutionary point of view, our histological evidence from the Microcebus, tarsier, and orangutan suggests a strong affinity between the claustrum and the insular cortex. Given the mouse lemur’s similarities to the common primate ancestor, we believe that the two structures were closely juxtaposed in the beginning of the primate evolution, and gradually diverged due to the expansion of the extreme capsule as tarsiers, monkeys, and apes emerged. Our histological data, showing that the two structures are partially separated in the tarsier and segregated completely in the orangutan, supports this hypothesis. In addition, the gene expression profiles of the mouse claustrum and insula, provided by AGEA, indicate that the genes expressed in the claustrum are highly correlated with those present in the deep layers of the insular cortex and less correlated with gene expression in the striatum. Taken together, our anatomical and genetic evidence points to the cortical affinities of the claustrum.
Given that the claustrum appears to be a deep cellular layer closely juxtaposed with the insula in Microcebus and the close phylogenetic, developmental, and genetic affinities of the claustrum and insula, we hypothesized that the connections of these two structures might be similar in Microcebus. To test this hypothesis, we have emulated standard tracer-microinjection tract tracing studies by placing single-voxel seeds within these structures in our high spatial and angular resolution diffusion imaging dataset for a fixed Microcebus brain. During the past decade a number of studies have explored diffusion MRI’s capability of assaying fiber connectivity in post-mortem, fixed brains. Studies of various species, including the mouse (Mori et al., 2001; Guilfoyle et al., 2003; Sun et al., 2003; Zhang et al., 2003, 2005; D’Arceuil and de Crespigny, 2007), cat (Takahashi et al., 2010, 2011), pig (Dyrby et al., 2007, 2011), rabbit (D’Arceuil et al., 2008), baboon (Kroenke et al., 2005), macaque (D’Arceuil et al., 2007), and human (Roebroeck et al., 2008; Miller et al., 2011; Takahashi et al., 2012), have supported this approach as an effective method of identifying and observing development of fiber bundles. It has also been shown that the anisotropy of fixed tissue does not differ significantly compared to fresh tissue (Sun et al., 2003; D’Arceuil et al., 2007), and that fixed brain tissue retains its original diffusion property for at least 3 years (Dyrby et al., 2011). In addition, one study validated the results of probabilistic tractography in fixed pig brains by directly comparing them with the data from conventional tracer injections (Dyrby et al., 2007), showing that post-mortem diffusion imaging and probabilistic fiber tractography are viable methods. In fact, considering that these approaches are non-invasive, could be seeded in many different regions without a limit (whereas conventional tracer injection method can assay only a few regions per brain), and that diffusion images can be sliced in many different planes for analysis, further developments of these techniques would have a significant impact on the field of neuroanatomy. However, to our knowledge there have been no studies in which an image with very high angular and spatial resolutions was produced, fiber tractography was performed with the image, and the resulting connections were validated with conventional tracer injection data. The very high resolution of our high angular resolution diffusion imaging (HARDI) data, acquired at the magnetic field strength of 9.4 T, has allowed us to study the animal’s claustral connectivity at a spatial resolution (90 micra) that has not been achieved in most HARDI connectional studies.
Materials and Methods
Diffusion MR Imaging
Two paraformaldehyde-fixed M. murinus brains, from lemurs that had died of cancer, were provided by Dr. Russell Jacobs of the Beckman Institute at the California Institute of Technology. The right hemisphere of one of the brains was immersed in an inert, fluorinated fluid (Galden® HT-200 perfluoropolyether, Solvay Solexis, Inc., Thorofare, NJ, USA) and scanned for approximately 33 h in the Bruker 9.4-T MR system (Bruker Biospin, Germany) for a high angular resolution diffusion image (Figures 1C–F) at the Caltech Brain Imaging Center. The HARDI data were obtained with a diffusion-weighted single spin echo sequence, using the following parameters: number of directions = 72, TR/TE = 75/22.8 ms, 256 × 160 × 112 matrix, 23.04 mm × 14.40 mm × 10.08 mm FOV, nominal b-factor = 1170 s/mm2, ∂ = 5 ms, Δ = 10 ms. This yielded seven non-weighted images and 72 diffusion-weighted images, with a voxel size of 90 μm isotropic. Figures 1D–F show the fractional anisotropy map of the HARDI data, reflecting the high quality of our image.
Only two brains were used in the present study, and only one brain was imaged, due to the scarcity of post-mortem fixed Microcebus brains and the very high cost of acquiring a diffusion image with high spatial and angular resolutions.
Histology
The imaged brain was embedded in celloidin, sectioned, and stained with thionin, but the resulting sections were low quality and could not be used for the study. Hence the second M. murinus brain underwent sucrose and phosphate buffer saline baths for cryoprotection, was frozen on a specially designed microtome stage, and sectioned coronally at the thickness of 90 μm. The cut face of the tissue was photographed after every section. These images were used to ensure accuracy in orientation when the sections were mounted on glass slides prior to staining.
All odd-numbered sections were stained with the cresyl violet Nissl technique, which visualizes neuronal cell bodies and glia (Figure 1A). All even-numbered sections were stained for axon fibers (Figure 1B) with the Gallayas method (Gallyas, 1979). Gelatinized slides were used for all Nissl sections and some of the Gallyas sections. However, agitations during the Gallyas procedure caused the tissue to peel off of gelatinized slides, and this prompted the use of SuperFrost Plus slides (Thermo Fisher Scientific, Inc., Waltham, MA, USA), which adhere to tissue electrostatically,
MR Image Processing and Fiber Tractography
FMRIB Software Library (FSL) algorithms (Smith et al., 2004; Woolrich et al., 2009) were used to process and analyze the HARDI data. Eddy current distortions in the diffusion-weighted images were modeled and corrected as affine transformations relative to the mean non-diffusion-weighted image. Diffusion parameters were estimated using the two-fiber Bayesian inference with Markov Chain Monte Carlo sampling algorithm implemented by BEDPOSTX in FSL (Behrens et al., 2007). The non-diffusion-weighted volume was re-oriented using the software Amira® (Visage Imaging, Inc., Australia), then re-sliced with Image J (National Institutes of Health, Bethesda, MD, USA), such that its coronal cutting plane was similar to that of the histological sections.
The histological sections helped us identify the claustrum and the different cytoarchitectural portions of the insula on the diffusion image. We created single-voxel seeds in the two regions based on this anatomical information, and performed probabilistic fiber tractography using the PROBTRACKX algorithm implemented by FSL (Behrens et al., 2007). The same set of parameters were used for each run of probabilistic tracking: number of samples = 10,000; curvature threshold = 0.2; maximum number of steps = 4,000; and step length = 0.09 mm. The Loopcheck option was always used to exclude redundant fibers (Behrens et al., 2003a,b, 2007). Similar tractography experiments were performed in the putamen, olfactory cortex, septum, and amygdala.
Results
Probabilistic Tractography Results
To explore the connectivity patterns of the central portions of the Microcebus claustrum and insula, we first created a single-voxel seed mask in the center of each structure (Figure 1C). Fiber tractography experiments were performed using these masks and the parameters described in the Materials and Methods section. The tractography results suggest that, despite the spatial proximity between the two structures, claustrum and insula in the Microcebus have very distinct connectivity patterns.
Overall, the claustrum seems associated with most cortical regions and olfactory structures: as shown in Figures 4, 5, and 6, the claustral tract reaches the entire frontal pole, frontal cortex, premotor cortex, ventral ACC, ventral temporal cortex, visual cortex, motor cortex, somatosensory cortex, olfactory cortex, and olfactory bulb, and most strongly the entorhinal cortex. It also associates with some subcortical structures, such as the caudate (Figures 4C,D, 5B,C, and 6A), putamen (Figures 4C,D, 5C, and 6B), globus pallidus (Figures 4D, 5C, and 6B), lateral amygdala (Figure 4D), olfactory tubercle (Figures 5B and 6C), and olfactory tract (Figures 4A,B). The connections to the putamen and the globus pallidus appear to involve the external and internal medullary laminae of pallidum, respectively. In addition, the claustrum apparently has cross-hemispheric connections via the anterior commissure (Figures 4C and 5A) and the corpus callosum (Figures 4C,D and 5A–C).
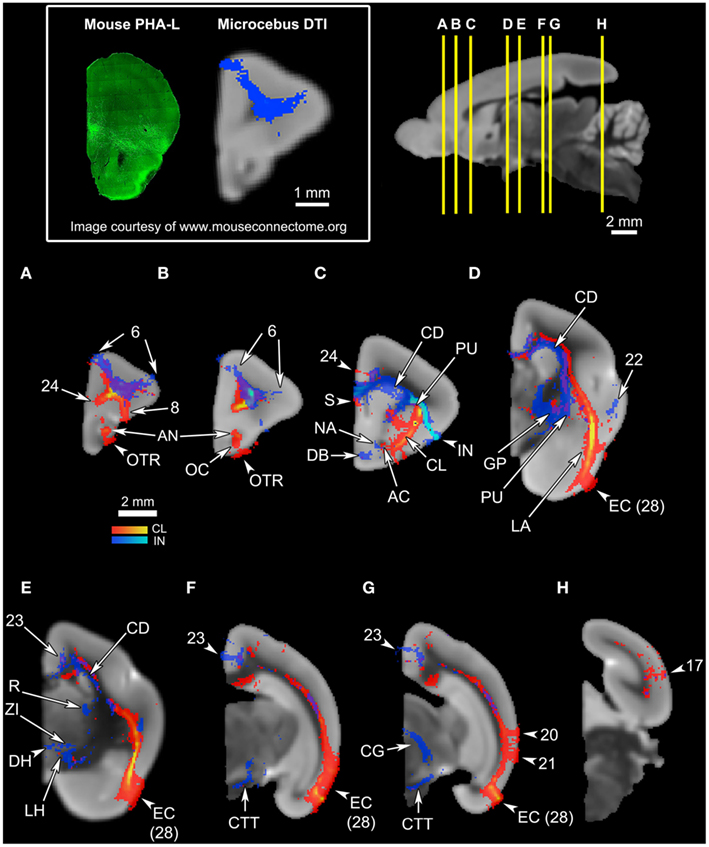
Figure 4. An overview of the connections of the claustral tracts (shown in red-yellow, with the yellow indicating connections that are more probable) and the insular tracts (shown in blue-light blue, with the light blue indicating more probable connections), in coronal planes. The top left panel compares the insular connection to the frontal cortex between the mouse and the Microcebus. The image on the left shows PHA-L injected into the anterior insula of the mouse, resulting in anterograde projections to the orbitofrontal cortex, located ventrally. Image courtesy of the Mouse Connectome Project. The image on the right depicts the probabilistic fiber tractography results showing that the Microcebus insula connects mainly with the dorsomedial and dorsolateral frontal cortex. The top right panel describes the locations of the coronal cross-sections (A) through (H). In (A–H), since the blue tracts have been rendered transparent, the areas with overlapping claustral and insular tracts appear purple. The cortical area numbers are based on Le Gros Clark’s (1931) map of Microcebus cortex. (A,B) The clautrum connects to the dorsal and ventral frontal cortex, cingulate cortex, olfactory cortex (OC), anterior olfactory nucleus (AN), and the olfactory tract (OTR), whereas the insula connects with the dorsomedial and dorsolateral frontal cortex. (C) The seed level. The claustral tracts travel from the claustrum (CL) to the nearby caudate (CD) and the putamen (PU), as well as the septum (S), anterior commissure (AC), and the ventral anterior cingulate cortex. The insular (IN) tracts appear in the caudate (CD), putamen (PU), septum (S), ventral cingulate cortex, nucleus accumbens (NA), and the diagonal band (DB). (D) The claustrum associates with the entorhinal cortex (EC, Area 28 in Le Gros Clark’s, 1931 cortical map) at a high probability, and with the lateral amygdala (LA). The insula connects with the temporal cortex, globus pallidus (GP), caudate (CD), and putamen (PU). (E) The claustrum connects at a high probability to the entorhinal cortex (EC, Area 28 in Le Gros Clark’s, 1931 cortical map). The insula connects to the caudate (CD), cingulate cortex, reticular thalamic nucleus (R), zona incerta (ZI), and dorsal lateral hypothalamus (DH, LH). (F) The claustrum continues to connect at a high probability with the entorhinal cortex (EC, Area 28 in Le Gros Clark’s, 1931 cortical map), whereas the insular tracts appear in the cingulate cortex and along the central tegmental tract (CTT). (G) While the claustrum connects to the entorhinal cortex (EC, Area 28 in Le Gros Clark’s, 1931 cortical map) and the more dorsal cortical areas 20 and 21, the insula continues to associate with the cingulate and central tegmental tract (CTT), and connects with the midbrain central gray (CG). (H) Both claustrum and insula connect with the visual cortex, although the insula does to a significantly lesser degree than does the claustrum.
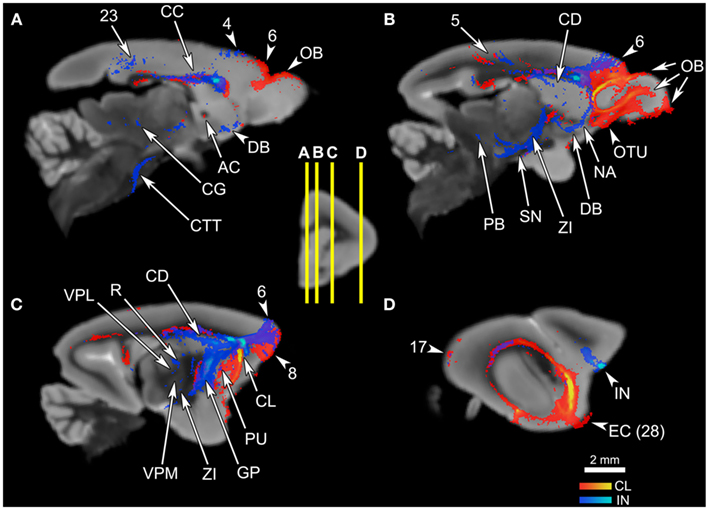
Figure 5. The connections of the claustrum and insula, in parasagittal planes. The middle panel shows the levels of cross-section for (A–D). The cortical area numbers are based on Le Gros Clark’s (1931) map of Microcebus cortex. (A) The claustrum connects to the olfactory bulb (OB) and the dorsal frontal cortex, and achieves cross-hemispheric connections via the anterior commissure (AC) and the corpus callosum (CC). The insula connects to the dorsal frontal cortex, posterior cingulate cortex, corpus callosum (CC), diagonal band (DB), midbrain central gray (CG), and central tegmental tract (CTT). (B) The claustrum is connected with a large portion of the prefrontal cortex, olfactory bulb (OB), olfactory tubercle (OTU), as well as the parietal cortex. The insular tracts appear in the frontal cortex, parietal cortex, caudate (CD), nucleus accumbens (NA), diagonal band (DB), zona incerta (ZI), substantia nigra (SN), and parabrachial nucleus (PB). (C) The claustrum connects to the frontal cortex and the putamen (PU), while the insula connects to the dorsal frontal cortex, globus pallidus (GP), reticular thalamic nucleus (R), ventral posterolateral thalamic nucleus (VPL), ventral posteromedial thalamic nucleus (VPM), and zona incerta (ZI). (D) The claustrum is highly probably connected to the entorhinal cortex (EC, Area 28 in Le Gros Clark’s 1931 cortical map). Both claustrum and insula are connected to the cortical area 17, although the insula seems connected to a lesser degree.
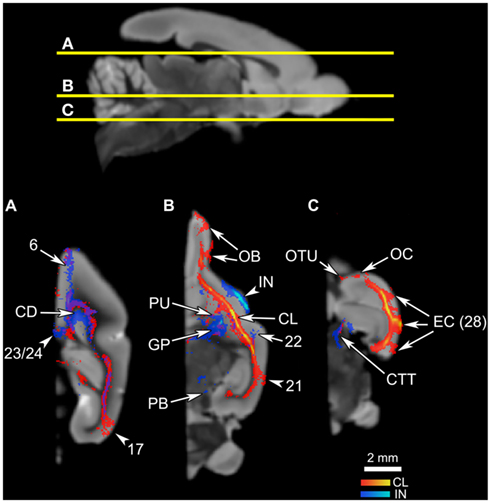
Figure 6. The connections of the claustrum and insula in horizontal planes. The top panel shows the levels of cross-section for (A–C). The cortical area numbers are based on Le Gros Clark’s (1931) map of Microcebus cortex. (A) Both claustral and insular tracts appear in the frontal and cingulate cortices, caudate (CD), and the visual cortex. (B) The claustrum connects to the olfactory bulb (OB), putamen (PU), and the cortical area 21. Also note that the claustral tract is adjacent to the frontal, temporal, and occipital cortices, suggesting that the claustrum is connected to deep layers of these areas although the tract does not penetrate into upper cortical layers. The insular tract appears in the putamen (PU), globus pallidus (GP) and the parabrachial nucleus (PB). (C) The claustrum is connected to the olfactory tubercle (OTU), olfactory cortex (OC) and, at a high probability, to the entorhinal cortex (EC, Area 28 in Le Gros Clark’s 1931 cortical map). Meanwhile the insula connects to the central tegmental tract.
By contrast, the mid-insular seed appears connected to more subcortical areas and does not show strong signals in the olfactory structures: the seed exhibits associations with the dorsal and lateral parts of the hypothalamus (Figure 4E), substantia nigra (Figure 5B), zona incerta (Figures 5B,C), thalamic areas such as the reticular nucleus (Figure 5C), ventral posterolateral nucleus (Figure 5C), and the parvocellular division of the ventral posteromedial nucleus (VPMpc; Figure 5C), and with brainstem structures including the central tegmental tract (Figures 4E,F, 5A, and 6C), parabrachial nucleus (Figures 5B and 6B), and midbrain central gray (Figures 4F and 5A). Additional subcortical regions such as the nucleus accumbens (Figures 4C and 5B), substantia innominata (data not shown), and diagonal band (Figures 4C and 5A,B) are also connected with the insula. We were unable to precisely identify which hypothalamic nuclei are associated with the insula, due to the limited image resolution. Overall, there appears to be a coherent system involving the central tegmental tract, parabrachial nucleus, lateral hypothalamus, zona incerta, VPMpc, midbrain central gray, and insular cortex. In contrast to the claustrum, we found no connections to the olfactory bulb or the entorhinal cortex arising from the mid-insular seed voxel, although it does have some connections with the temporal lobe outside the entorhinal cortex (Figure 4D). The insular seed revealed a robust trans-cortical association between the cingulate cortex and the insula (Figure 4C). This connection and the rest of the insular connections with the frontal cortex (Figures 4A,B) mainly occupy the dorsal and lateral aspects of the frontal lobe. On the other hand, the claustrum does not show such preference (Figure 4A). The insula’s connection to the dorsolateral frontal cortex in the Microcebus contrasts with the mouse insula, which is mainly associated with the ventral frontal lobe (Figure 4, top left panel).
Some similarities between the two connectivity patterns are also observed. First, both seed regions maintain connections throughout almost the entire length of the cingulate cortex (Figures 4C–F, 5A and 6A), including the part of the ventral ACC that may be the primate homolog of the rodent infralimbic and prelimbic cortices (Figure 4C). Second, both regions appear robustly connected to the septum: the claustral tract is seen in a large part of it while the insular tract is present in the dorsal septum (Figure 4C). Also, a single-voxel seed mask placed in the dorsal septum yielded a tract that reaches both the claustrum and the insula (Figure 7, top row). Third, both the insula and the claustrum seem associated with the parietal and occipital cortices, although the insular connections are much weaker than are the claustral ones (Figures 4E–G, 5B,D, and 6A). Finally, both structures exhibit connections to the caudate and the putamen (Figures 4C,D, 5B,C and 6A,B).
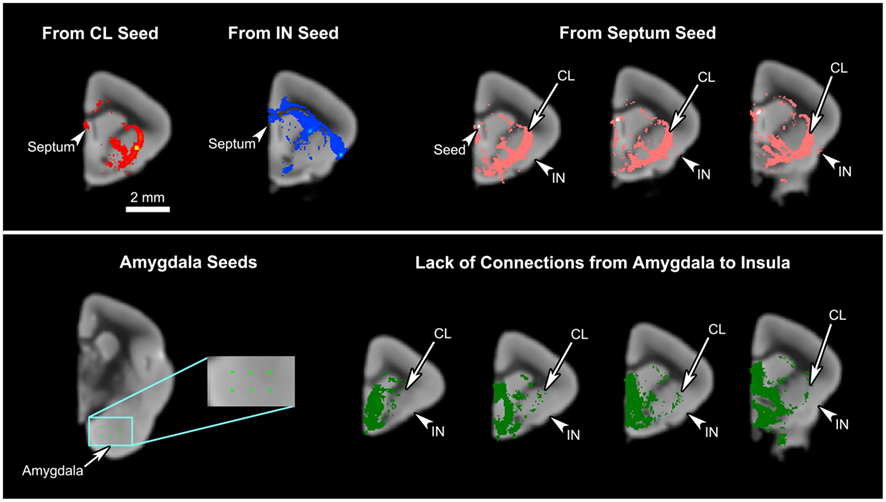
Figure 7. The connections of the septum and amygdala to the claustrum and insula. Upper panel: The mid-claustral and mid-insular seeds both yield connections to the septum. A single-voxel seed placed in the septum results in tracts connecting to the claustrum (CL) and insula (IN). Lower panel: Six single-voxel seeds were placed in the basal part of the amygdala. The resulting tracts were pooled together and inspected for any connections to the insula. While some connections are observed in the claustrum, our data do not show any amygdalal tracts reaching the insula.
To investigate topographical fiber organizations in the claustrum and the insula, we placed additional single-voxel seeds along the approximate anteroposterior, mediolateral, and dorsoventral axes of each region. The mediolateral axis was not tested in the claustrum, due to the thinness of the structure. The claustrum does not exhibit significant differences in connectivity results among the anterior, middle, and posterior seeds (Figures 8A–D), whereas there seems to be some spatial organization along the dorsoventral axis: the ventral claustral seed, while connecting to the same set of regions as the dorsal seed, also connects to larger areas of the olfactory bulb and the olfactory cortex compared to the dorsal seed (Figures 8E–H). Whereas the insula does not seem to have any significant topographic organizations along the anteroposterior or the mediolateral axes (data not shown), some differences are observed along the approximately dorsoventral axis: a seed placed in the agranular region, ventral to the mid-insular seed discussed above, exhibits connections to the olfactory bulb, olfactory cortex, and the entorhinal cortex in addition to the insular connectivity profile discussed above (Figure 9).
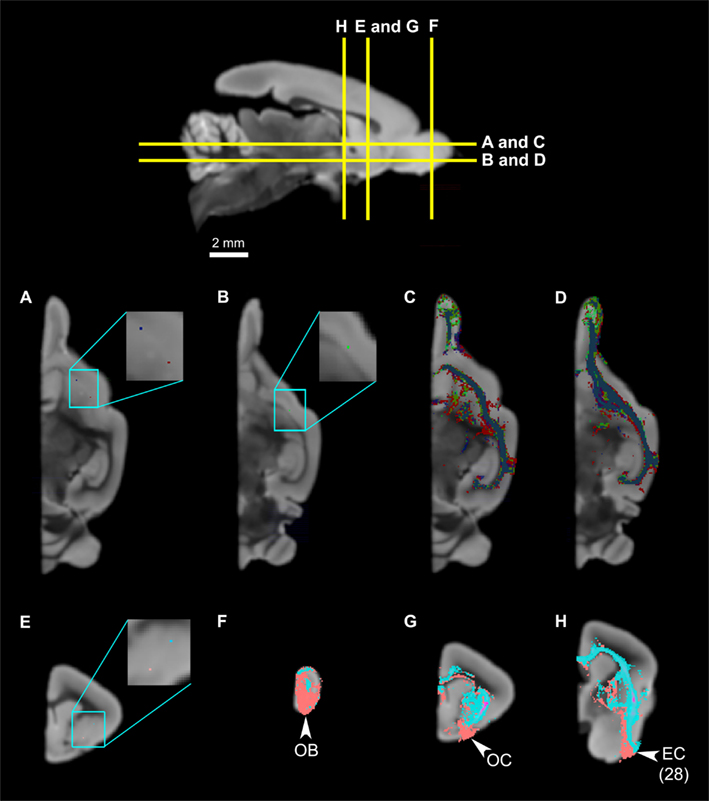
Figure 8. The slight spatial organization within the claustrum. Top panel: The levels of cross-section for (A) through (H). (A) The locations of two claustrum seeds, with the blue seed in the anterior claustrum, and the red seed in the mid-claustrum. (B) The placement of the third seed, in the posterior claustrum, which is ventral compared to the anterior and middle claustrum. (C,D) illustrate the tractography results of the three seeds, demonstrating that the tracts mostly overlap with one another and there are no significant differences. (E) The locations of two claustrum seeds, with the light blue seed in the dorsal claustrum, and the pink seed in the ventral claustrum. (F,G) Claustrual connections to the olfactory bulb, olfactory cortex, and entorhinal cortex. Note that the tracts from the ventral seed (pink) occupy larger and more ventral portions of the three structures compared to those from the dorsal seed (light blue). Abbreviations: AC, anterior commissure; AN, anterior olfactory nucleus; CL, claustrum; EC, entorhinal cortex, Area 28 in Le Gros Clark’s (1931) cortical map; GP, globus pallidus; OB, olfactory bulb; OC, olfactory cortex; OTR, olfactory tract; OTU, olfactory tubercle; PU, putamen.
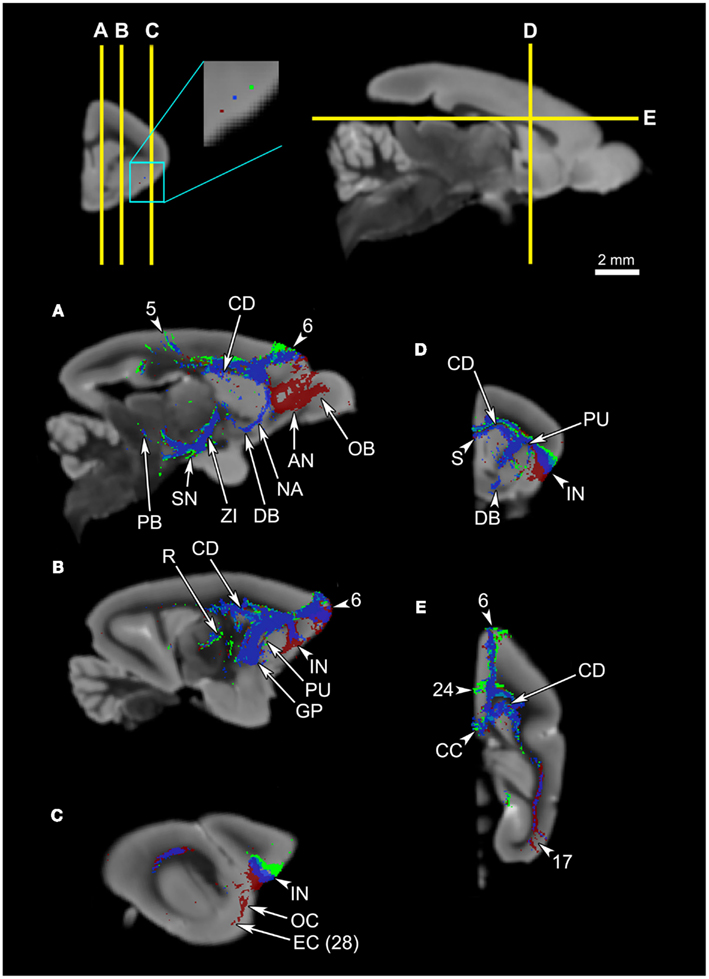
Figure 9. Probabilistic fiber tractography results from three seeds in the insula. The top left panel shows the placement of the seeds: While the blue seed is in the mid-insula, the green seed is in the dorsal insula, closer to the granular insula, and the red seed is located ventrally, closer to the agranular insula. The top two panels show the levels of cross-section for (A) through (E). All panels show that the three seeds all share common tracts, and that the only significant difference is that the ventral seed connects to the olfactory bulb (A), anterior olfactory nucleus (A), olfactory cortex (C), and the entorhinal cortex (C). Note that the ventral insular seed’s connection to the olfactory cortex in (C) is minimal, suggesting that the connections to other olfactory structures likely arose from the agranular insula, rather than from the adjacent olfactory cortex. (D) shows the similarities between the middle insular tracts and the ventral insular tracts. Abbreviations: AN, anterior olfactory nucleus; CC, corpus callosum; CD, caudate; DB, diagonal band; EC, entorhinal cortex, Area 28 in Le Gros Clark’s (1931) cortical map; GP, globus pallidus; IN, insula; NA, nucleus accumbens; OB, olfactory bulb; OC, olfactory cortex; PB, parabrachial nucleus; PU, putamen; R, reticular thalamic nucleus; S, septum; SN, substantia nigra; ZI, zona incerta. The cortical area numbers are based on Le Gros Clark’s (1931) map of Microcebus cortex.
To ensure that our results from the central claustral and insular seeds mostly represent the connectivity of claustrum and insula only, and not of the surrounding regions, we placed single-voxel seeds in some of these surrounding structures and compared the resulting fiber tracts with the claustral and insular ones. A seed was placed in the putamen, the structure immediately medial to the claustrum. The most striking differences shown in the probabilistic tractography results are that: (a) the putamen, unlike the claustrum, does not connect with olfactory structures such as the olfactory bulb, olfactory cortex, olfactory tubercle, and entorhinal cortex; and (b) the putamen connects extensively to the caudate. Some similarities are found: like the claustrum, the putamen shows connections with many cortical areas, including the frontal, entorhinal, and visual (Figure 10, upper panel).
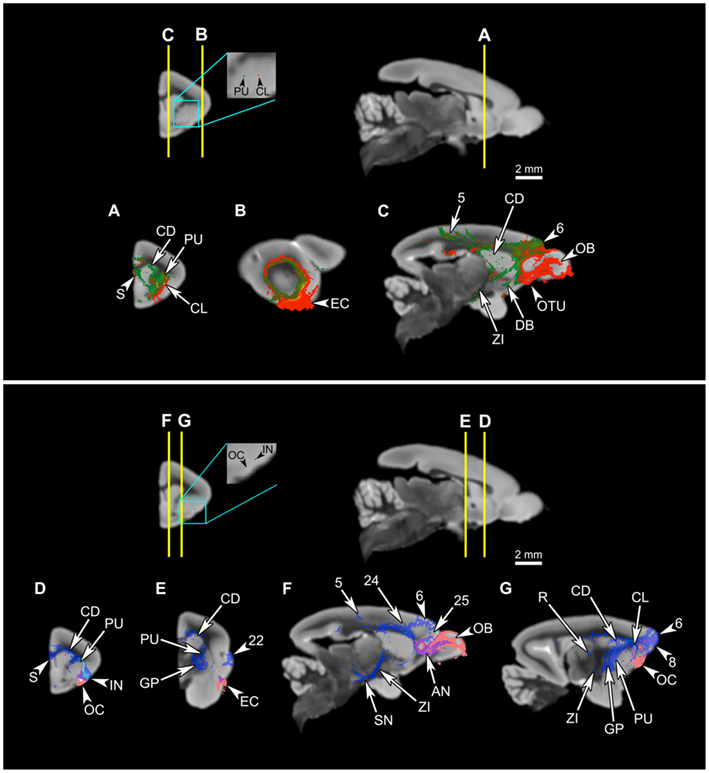
Figure 10. Comparison of connectivity patterns between the putamen and the claustrum, and olfactory cortex and the ventral insula. Upper panel: Comparison of the claustral connectivity pattern with that of the putamen. The first row shows the levels of cross-section for (A–C), and the locations of the seeds in the putamen (green) and the claustrum (red). (A–C) The putamen tract shows more extensive connections to the striatum than does the claustral tract (A,C), and unlike the claustrum, the putamen does not associate with the olfactory areas, such as the olfactory bulb, olfactory tubercle, and olfactory cortex, and associates only with a small part of the entorhinal cortex (A–C). However, the two tracts share many of the cortical connections (C). Lower panel: Comparison of the insular connectivity with that of the olfactory cortex. The first row shows the levels of cross-section for (D–G), and the locations of the seeds in the olfactory cortex and the insula. (D–G) Despite the proximity of the two seeds, the tract originating from the olfactory cortex is significantly different from the insular tract, connecting to the olfactory bulb (F), anterior olfactory nucleus (F), and the entorhinal cortex (E), while avoiding most of the regions connected to the insula. Abbreviations: AN, anterior olfactory nucleus; CD, caudate; CL, claustrum; DB, diagonal band; EC, entorhinal cortex; GP, globus pallidus; IN, insula; OB, olfactory bulb; OC, olfactory cortex; OTU, olfactory tubercle; PU, putamen; R, reticular thalamic nucleus; S, septum; SN, substantia nigra; ZI, zona incerta. The cortical area numbers are based on Le Gros Clark’s (1931) map of Microcebus cortex.
We placed another seed in the olfactory cortex, the region directly ventral to both the claustrum and the insula, and compared the resulting tracts with those of the agranular insular seed. As expected, the results indicate that the olfactory cortex’s connectivity profile does not significantly overlap with the connectivity patterns of the agranular insula and the claustrum, in that the olfactory cortex only connects to the olfactory bulb, olfactory tubercle, and the entorhinal cortex (Figure 10, lower panel).
The probabilistic connectivity results for the claustral and insular seeds mentioned above are summarized in Tables 1– 5. The tables also include the comparison of our fiber tractography results with those of previous tracer injection studies in rodents and monkeys: since there are virtually no tracer studies done in the Microcebus, comparing our data to those from other species is currently the best available method of validating our data.
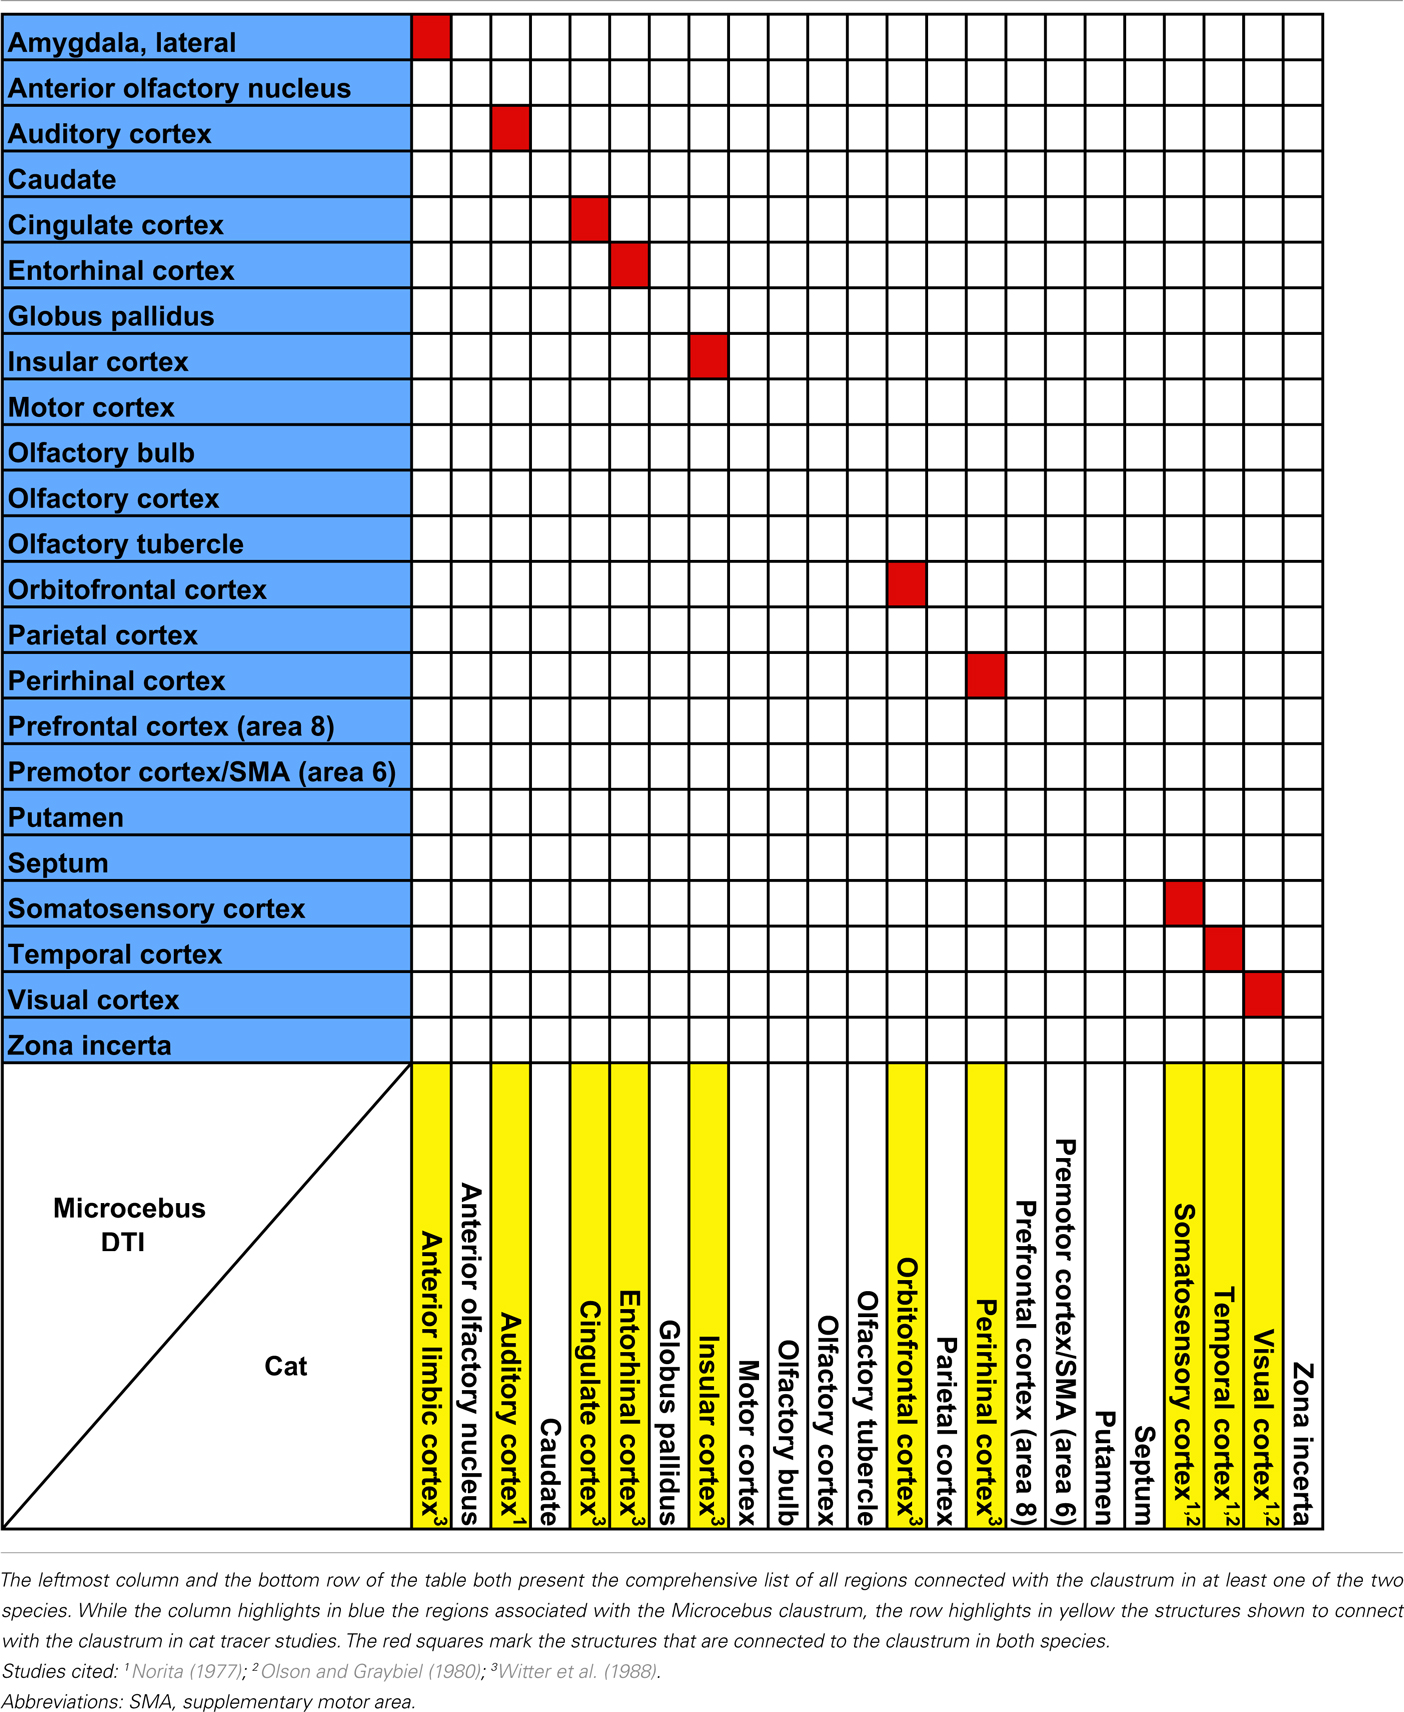
Table 1. Comparison of claustral connectivity in the cat and the Microcebus.
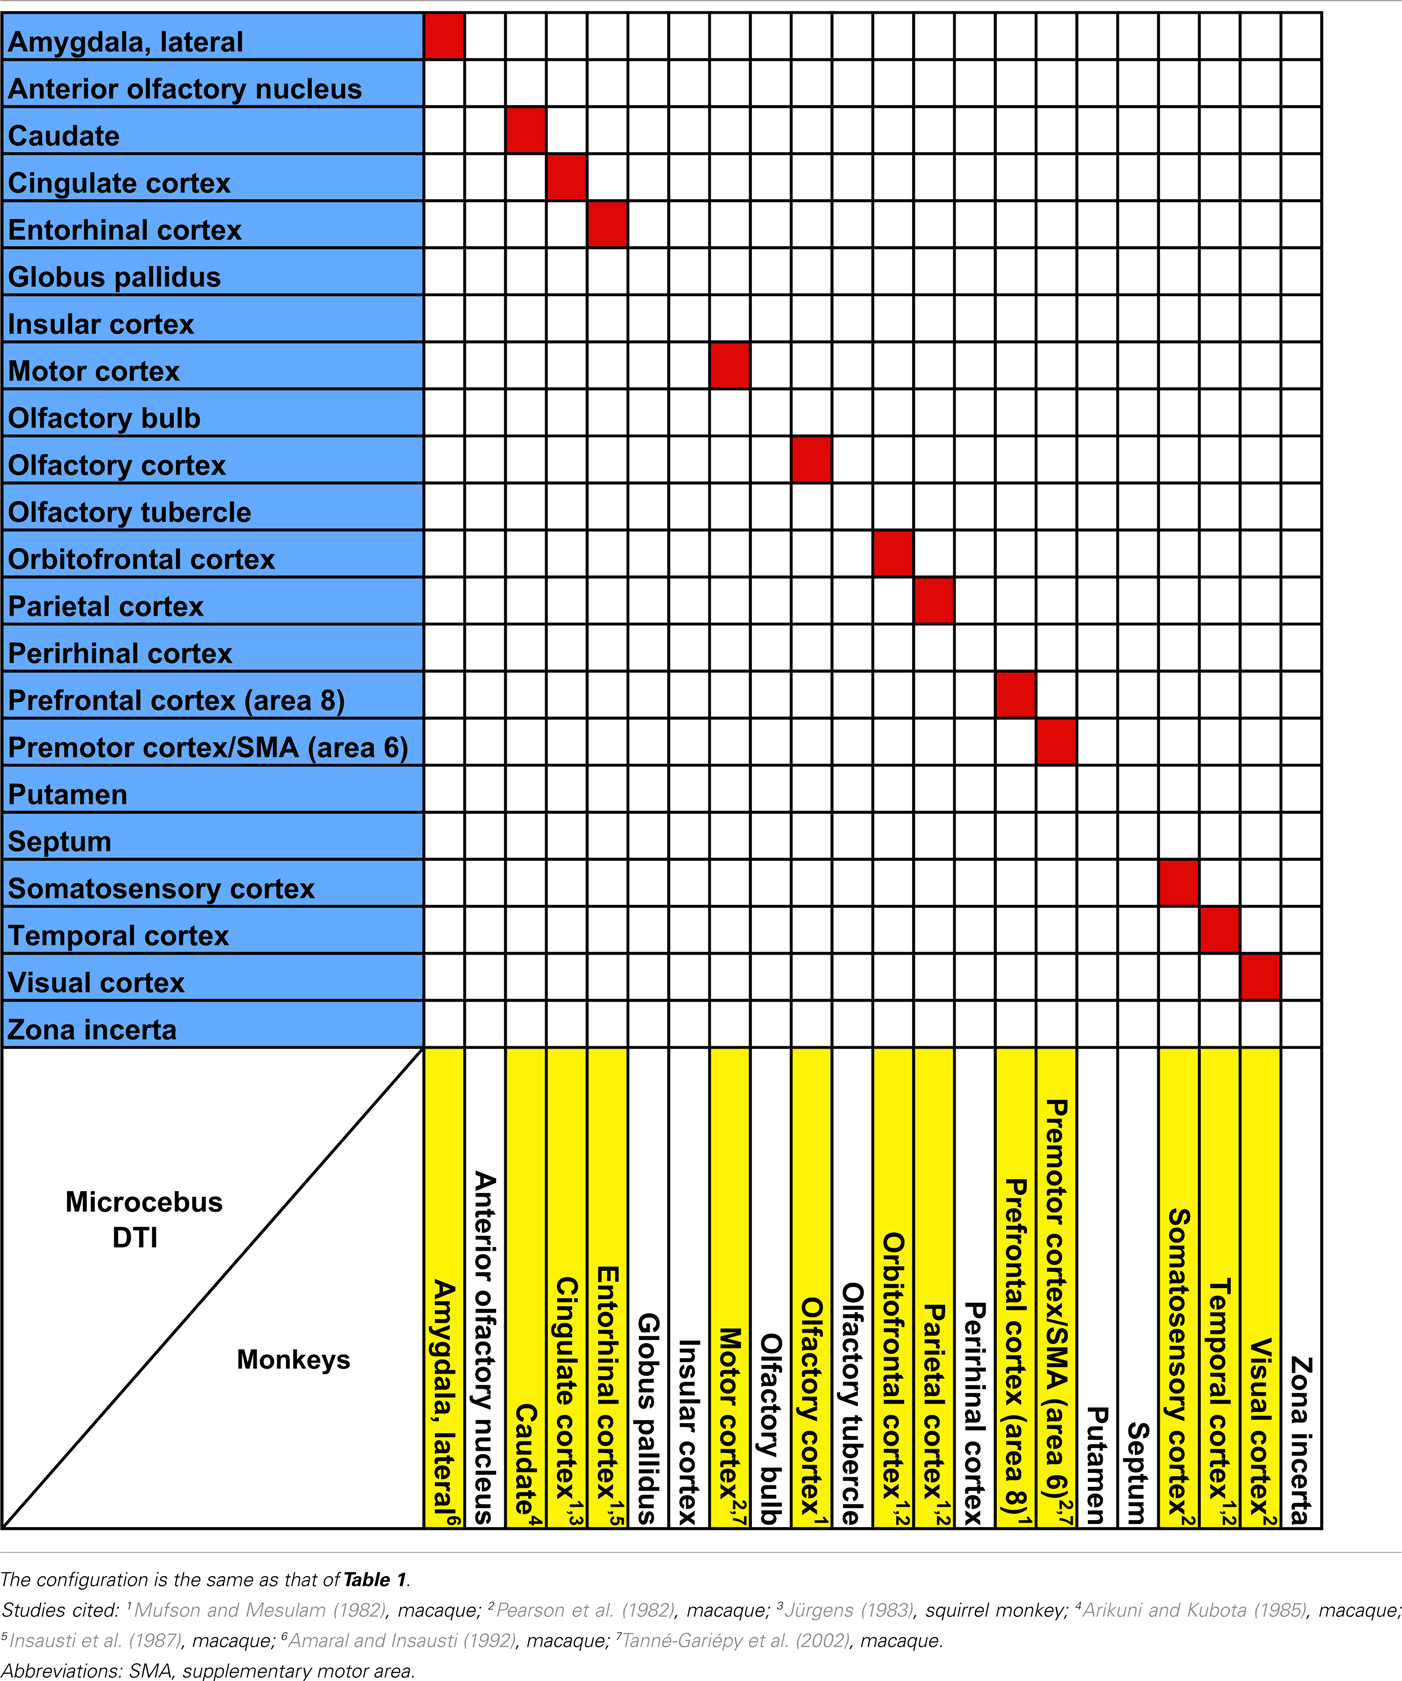
Table 2. Comparison of claustral connectivity in the rhesus macaque (Macaca mulatt a), the common squirrel monkey (Saimiri sciureu s), and the Microcebus.
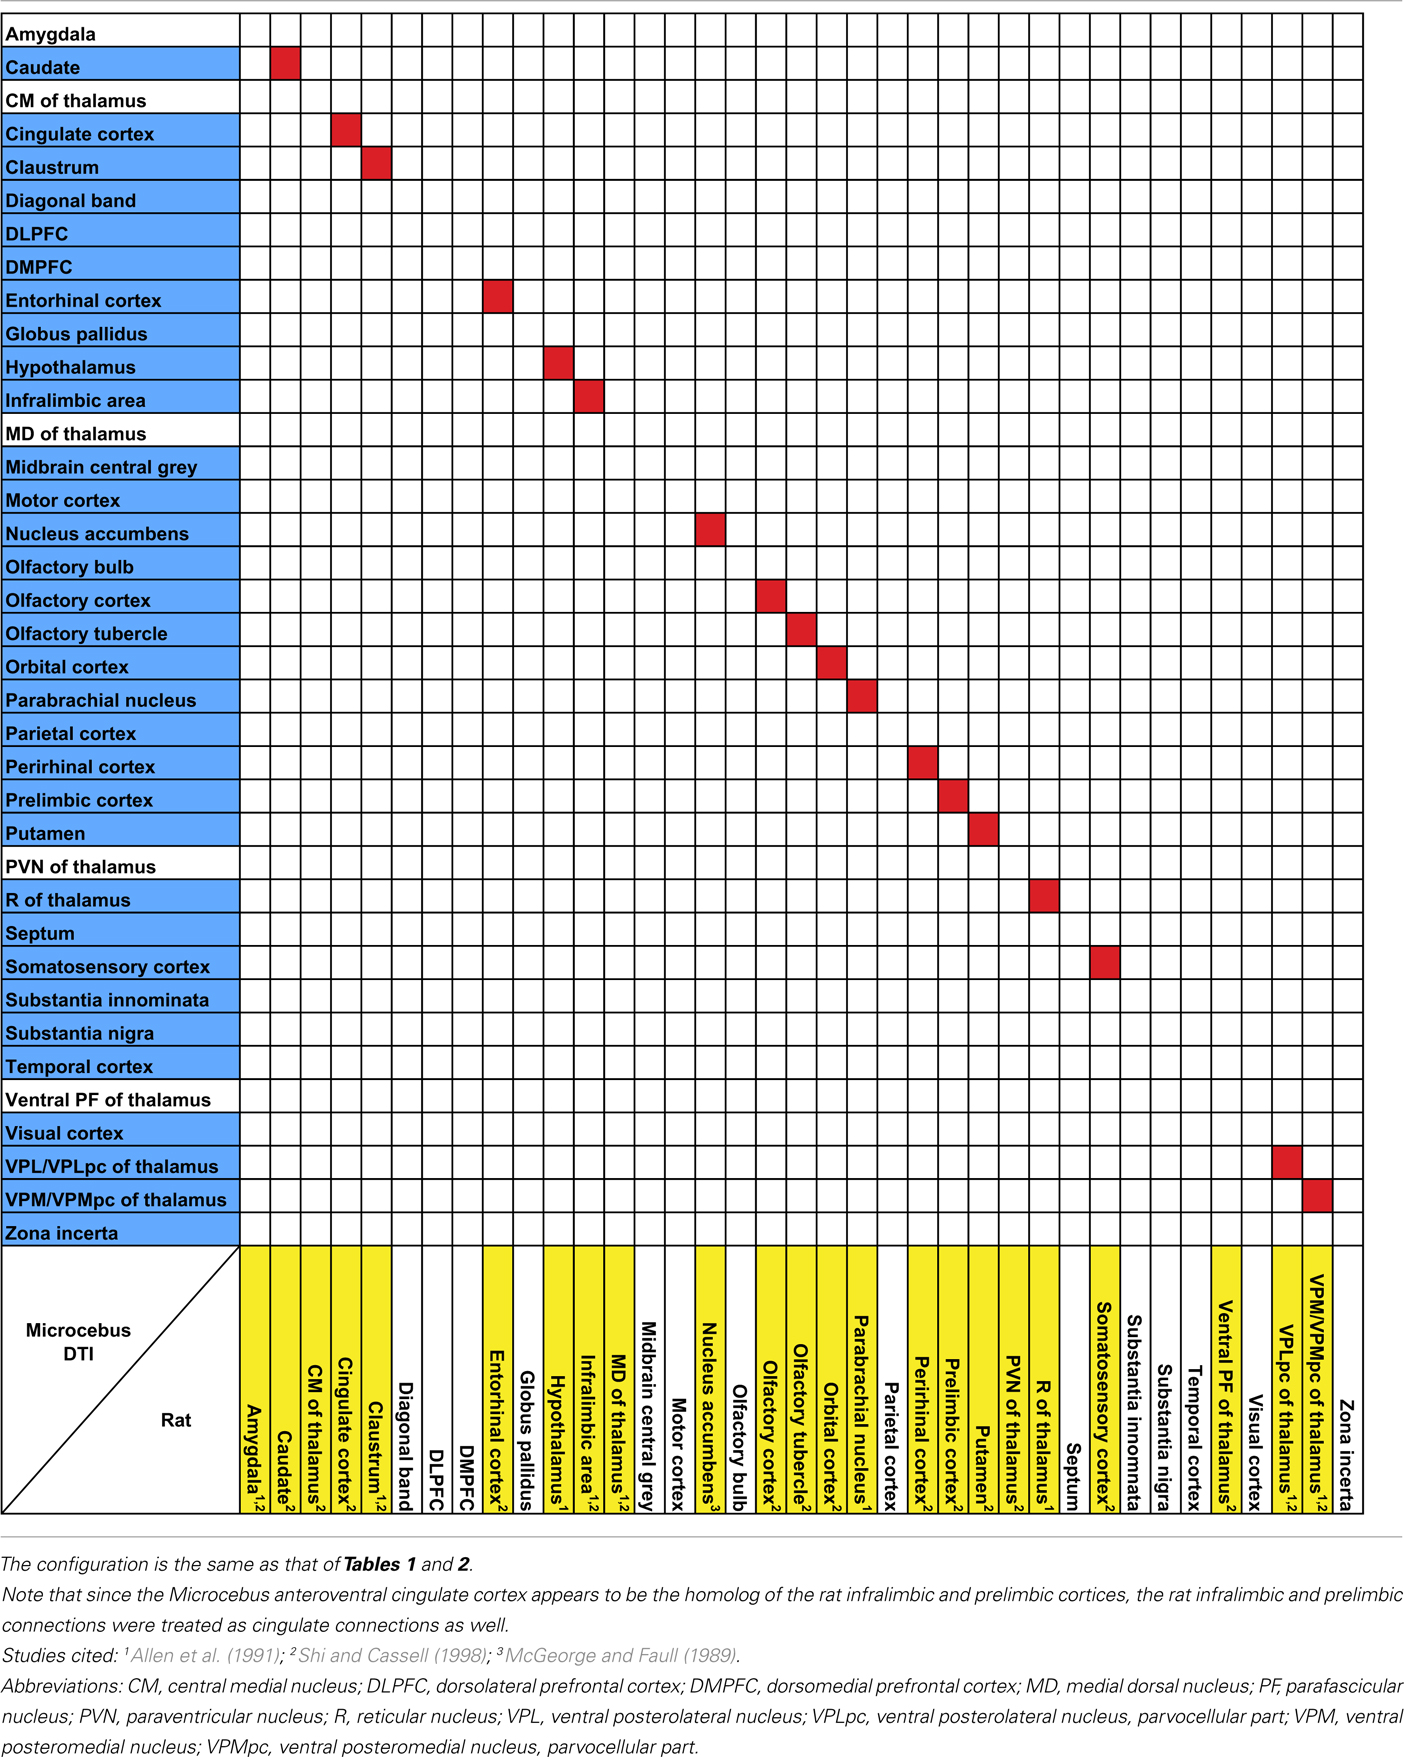
Table 3. Comparison of insular connectivity in the rat and the Microcebus.
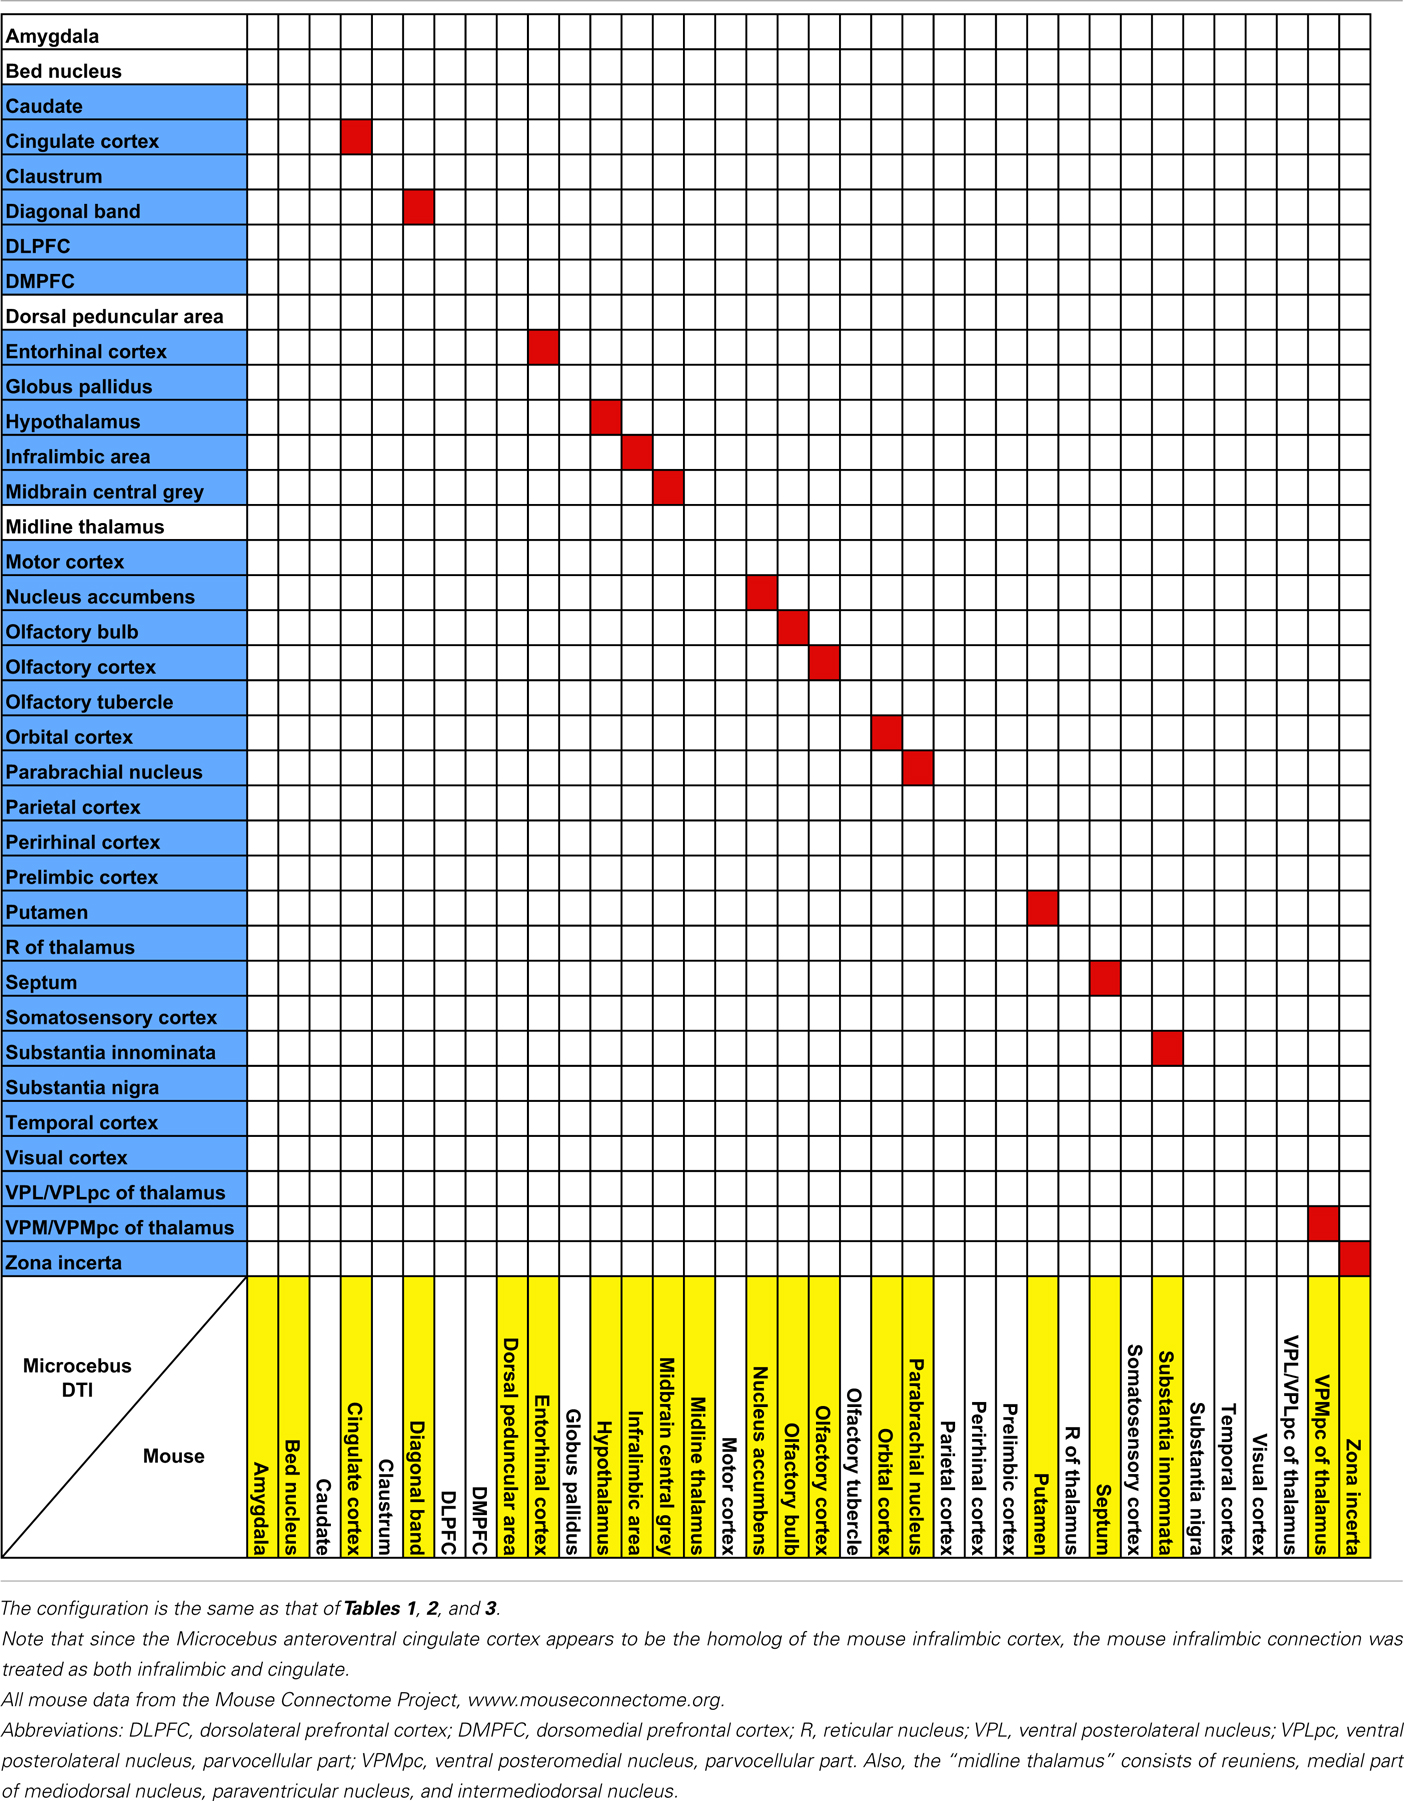
Table 4. Comparison of insular connectivity in the mouse and the Microcebus.
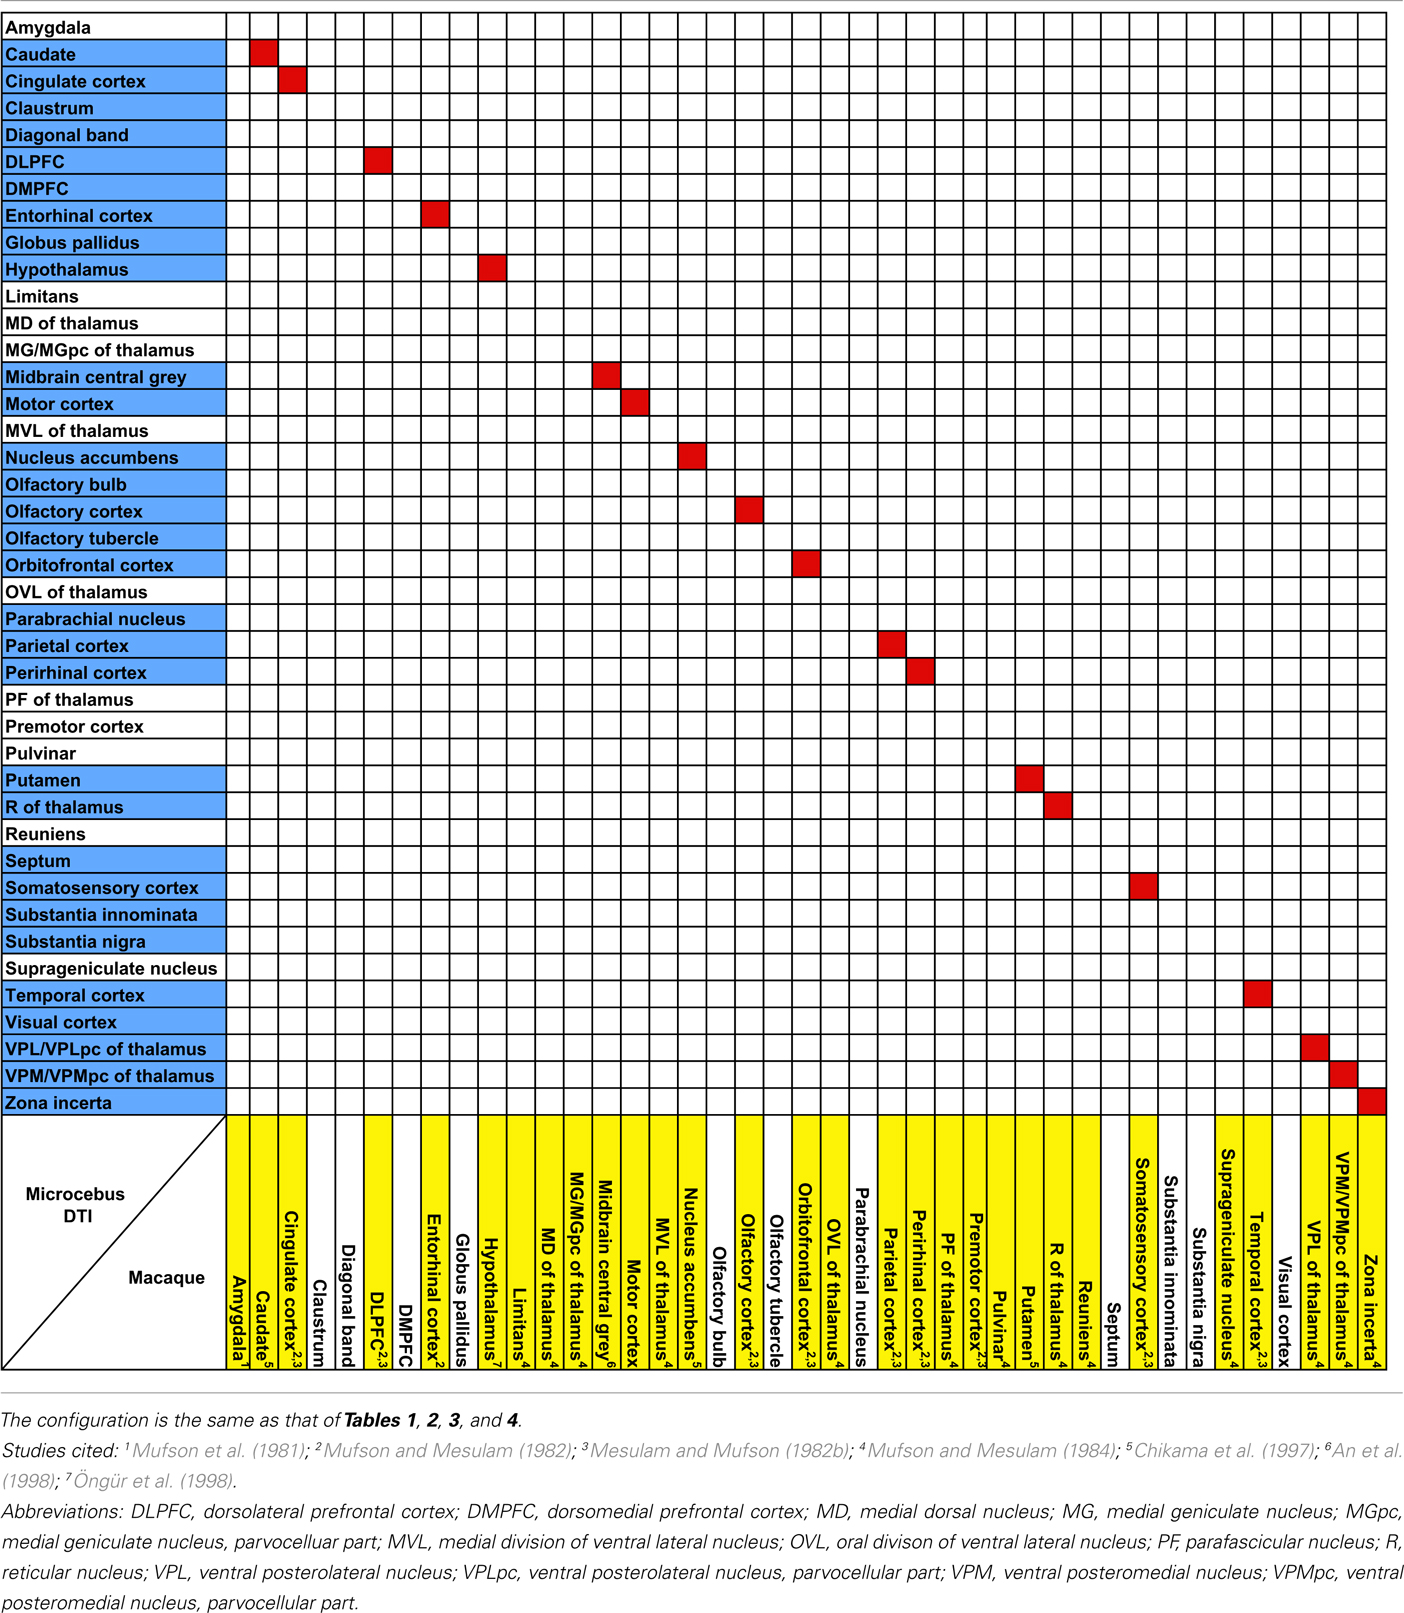
Table 5. Comparison of insular connectivity in the rhesus macaque (Macaca mulatt a) and the Microcebus.
Discussion
Our data show that the claustrum and insula have very different connections in Microcebus despite their close structural, developmental, phylogenetic, and genetic affinities. Our Microcebus connectivity data, as shown in the Tables 1– 5, are by and large consistent with the previously known connections of the claustrum and insula from tracer and imaging studies in other species. Our claustral connectivity pattern is comparable with the cat (Norita, 1977; Olson and Graybiel, 1980; Witter et al., 1988), macaque (Mufson and Mesulam, 1982; Pearson et al., 1982; Arikuni and Kubota, 1985; Insausti et al., 1987; Amaral and Insausti, 1992; Tanné-Gariépy et al., 2002), and squirrel monkey (Jürgens, 1983), demonstrating associations with most cortical areas. There are additional supporting data from the rat (Carey and Neal, 1985; Kowianski et al., 1998; Behan and Haberly, 1999; Lipowska et al., 2000), hedgehog (Dinopoulos et al., 1992), rabbit (Lipowska et al., 2000), mouse (Mouse Connectome Project, 2011), Galago (Carey et al., 1979), and Tupaia (Carey et al., 1979). In the cases of the rabbit and the rat, the injections were made in the endopiriform nucleus, which we consider equivalent to the ventral claustrum in primates. Although our results suggest that the Microcebus claustrum is connected with the putamen, globus pallidus, olfactory bulb, and olfactory tubercle, to the best of our knowledge no past tracing studies in other species have reported this. We suspect that these regions might not be directly connected with the claustrum, but rather indirectly via the cortical and subcortical areas that are associated with it.
Our results from the mid-insular seed also show a trend similar to those of the previous studies in the mouse (Mouse Connectome Project, 2011), rat (McGeorge and Faull, 1989; Allen et al., 1991; Shi and Cassell, 1998), and macaque (Mufson et al., 1981; Mesulam and Mufson, 1982b; Mufson and Mesulam, 1982, 1984; Chikama et al., 1997; An et al., 1998; Öngür et al., 1998), connecting to various subcortical structures that are also associated to the insula in other species. Also, a seed placed in approximately the agranular portion of the insula connects to olfactory structures, such as the olfactory bulb, olfactory cortex, and the entorhinal cortex, which is consistent with the past literature (Mesulam and Mufson, 1982b; Shi and Cassell, 1998; Mouse Connectome Project, 2011).
Our data show some similarities to the claustral and insular connectivity patterns in the human brain as well. A human DTI study, in which selection of the seed regions were guided by microsurgical dissection of the claustrum and its surrounding fibers, suggests that the human claustrum is associated with a wide variety of cortical regions, including the prefrontal cortex, orbitofrontal cortex, temporal pole, parietal cortex, and occipital cortex (Fernández-Miranda et al., 2008). The human insula’s structural connections with the entorhinal cortex, prefrontal cortex, premotor cortex, and parietal cortex, and the functional associations with the frontal cortex, cingulate cortex, supplementary motor area, parietal cortex, and visual cortex, are consistent with our findings (Taylor et al., 2009; Menon and Uddin, 2010; Uddin et al., 2010; Cerliani et al., 2011; Deen et al., 2011). However, these studies report the structure’s connections with multiple regions not included in our results. This disagreement might be mostly due to the increased complexity of the human brain that may have enlarged the claustral and insular connections.
The results from the insular seed appear to contain a coherent system including the central tegmental tract, parabrachial nucleus, midbrain central gray, and the VPMpc of the thalamus. A tracer injection study in the macaque nucleus of the solitary tract (NST) revealed that the rostral NST projects to the VPMpc via the central tegmental tract, the caudal NTS connects to the parabrachial nucleus, midbrain central gray, and ultimately the VPMpc, and the intermediate portion of the nucleus is associated with the VPMpc and the parabrachial nucleus (Beckstead et al., 1980). The connection to the NST seems to have been lost in our results, but the insular connections are present for all of the other structures in the system, and its association with the central tegmental tract is especially strong. In macaque monkeys, tracer injections have demonstrated that the aganular insula is reciprocally connected with the same part of the midbrain central gray that is associated with the insula in our study (An et al., 1998).
The tracer data from the mouse show that the insula is connected to the frontal cortex ventrally, while our tractography results suggest that insula and the prefrontal cortex are associated more dorsally in the Microcebus. This divergence may be due to the expansion of the dorsal and lateral frontal cortex in the primate brain, relative to non-primate mammalian brains (Khokhryakova, 1978; Fuster, 2008). Since the dorsal and lateral frontal cortices are relatively larger in the Microcebus than in rodents, it seems plausible that the insula might be more strongly connected to the dorsolateral frontal cortex in the Microcebus than in the mouse. A tracer injection study in the macaque, showing that connections exist between the insula and the dorsolateral frontal cortex in addition to the orbitofrontal cortex (Mesulam and Mufson, 1982b), supports this conclusion.
In addition, our data reflect differences in connectivity pattern between the granular and agranular insula, with the latter, unlike the former, connecting to olfactory structures. This is consistent with past tracer studies in the primate insula in which the agranular portion of the structure has been implicated in olfactory processing (Mesulam and Mufson, 1982b). While this could conceivably result from the seed’s proximity to the olfactory cortex, the ventral insular seed does not connect to the portion of the anterior olfactory cortex directly adjacent to the insula (Figure 10, lower panel), hence supporting the interpretation that these tracts indeed represent the connectivity pattern of the agranular insula, rather than that of the olfactory cortex.
In our results, the region that was most probabilistically connected to the claustral seeds was the entorhinal cortex. This cortical region has been of interest to those studying the neural mechanism of navigation and spatial memory, because it contains special classes of neurons that appear to process one’s perceived location and direction of movement. For example, “border cells” encode the animal’s location relative to local boundaries (Solstad et al., 2008), while “grid cells” represent one’s position and, in some cases, direction within a field map composed of equilateral triangular grids anchored to external landmarks (Hafting et al., 2005; Doeller et al., 2010). In addition, “path cells” in the human entorhinal cortex encode whether one is headed clockwise or counterclockwise (Jacobs et al., 2010), whereas similar “path equivalent cells” found in rodents react to locations in different but similar – “equivalent” – trajectories (Frank et al., 2000). The frequent loss of visuo-spatial orientation in the early stages of Alzheimer’s disease (AD) has been attributed to the degeneration of entorhinal cortex and hippocampus (Iachini et al., 2009). The portion of the human claustrum that is connected with the entorhinal cortex has been reported to show more severe AD pathology than the rest of the structure (Morys et al., 1996). This suggests that the claustrum contributes to the spatial function of the entorhinal cortex, and that the loss of spatial memory in AD may be due not only to degeneration of the entorhinal cortex and the hippocampus, but also to destruction of the integrating function of the claustrum. This is plausible, considering the claustrum’s extensive connections with cortical areas and its implications in perception and consciousness.
Our data suggest that, despite the close juxtaposition between the claustrum and insula, the two structures have completely different connections. This is confirmed by the conventional tract tracer results in other species. In addition, tractography experiments in the adjacent putamen and olfactory cortex show that our insular and claustral results are more or less region-specific. The seeds in the putamen and the claustrum do seem to share some of their tracts, and although it is possible that this is due to the proximity of the two structures and the limited resolution of our image, we believe that the more likely cause may be the claustrum’s robust connection to the putamen, making the tract originating from the putamen seed a natural part of the claustral tract.
It is not yet clear if the claustrum and the insula are directly connected with each other. Associations between the two structures have been observed in the rat (Allen et al., 1991; Shi and Cassell, 1998; Behan and Haberly, 1999), mouse (Mouse Connectome Project, 2011), and the cat (Witter et al., 1988), via tracer injections into the insula. However, considering the close proximity between these regions, it is uncertain whether the labeling in the claustrum reflects a true connection between the two regions or merely the spread of the injections. A similar labeling was observed in the macaque, but was attributed to the spread of the tracer injected into the insula (Mufson and Mesulam, 1982). Meanwhile, direct injection into the claustrum has been avoided due to the sheet-like morphology of the structure, hence limiting the amount of available data. Although in our data the claustrum and the insula do appear connected to each other, the connection is quite weak and hence unable to offer a conclusive view.
Some aspects of our results are not consistent with the tracer studies. First, we find no connection between the insula and the amygdala, whereas previous studies indicate otherwise (Mufson et al., 1981; Allen et al., 1991; Shi and Cassell, 1998; Mouse Connectome Project, 2011). The lack of connection between the insula and amygdala in our results was confirmed by additional fiber tractography with six single-voxel seeds placed in the various nuclei at the basal portion of the amygdala (Figure 7, lower panel). The resulting tracts suggest that while these seeds do connect to the claustrum, they are not at all associated with the insula. In fact, the tracts entering the claustrum seem very selective, cleanly avoiding the insula. This difference might be anatomically valid, demonstrating the mouse lemur’s inherent biological difference from the rodents and higher-level primates. It is also possible that this lack of connection is unique to the particular individual that was studied. Although it might also reveal a technical limitation of HARDI in this instance, it is worth noting that we did previously find a robust connection between the frontoinsular cortex and amygdala in the gorilla using HARDI and probabilistic fiber tractography (Allman et al., 2010).
Second, our results, while showing connections to many of the regions known to be associated with the claustrum and the insula in other species, including small structures such as the parabrachial nucleus and zona incerta, in some parts fail to provide as much detail as the tracer studies can. For instance, whereas injecting tracers in the macaque insula demonstrated miniscule connections to many small thalamic nuclei (Mufson and Mesulam, 1984), our results are able to clearly show tracts to only three thalamic nuclei.
Third, as discussed in the Results section, while our data suggest the differences between the connectivity patterns of the granular and agranular insula, the results do not show much topographical fiber organizations within the claustrum. Many tracer studies have found the claustrum to be topographically organized (Norita, 1977; Olson and Graybiel, 1980; Pearson et al., 1982; Dinopoulos et al., 1992; Kowianski et al., 1998; Tanné-Gariépy et al., 2002; Fernández-Miranda et al., 2008), hence indicating that our results do not reflect the differential fiber organization that is likely to exist. While the limited resolution of our image might have caused this, strong connections within the claustrum – like the long-range connection found within the rat claustrum (Behan and Haberly, 1999; Smith and Alloway, 2010) – might also have influenced our results. Considering the integrative nature of the claustral function, intra-claustral associations are indeed plausible, and it seems possible that such connections, by unifying the claustrum into one unit, prevented our results from properly reflecting the topographical organization of the claustrum. However, our data do suggest that the ventral claustrum may be affiliated to a greater extent than does the dorsal claustrum with the olfactory blub, olfactory cortex, and the entorhinal cortex. This is consistent with Striedter’s argument that the ventral claustrum originates from the olfactory cortex (Striedter, 1997).
Despite these inconsistencies, our experimental approach has demonstrated that, at a very high resolution, HARDI and probabilistic fiber tractography can achieve results that are comparable with those from tracer injection studies. Besides the high spatial and angular resolutions of our image, the most significant aspect of the present study is that, thanks to the high quality of the image, we were able to obtain detailed results using single-voxel seeds, placed in the gray matter. This emulates the conventional tract tracing method, and is in stark contrast to most previous studies using diffusion imaging and fiber tractography, in which all voxels in a region must be used as seeds, or seeds had to be placed in the white matter, in order to acquire viable results. Our method may raise concerns, though, as only one or two voxels were used to represent the entire claustrum and insula. We have dealt with these concerns by repeating tractography in other parts of the structures and verifying that, in our specific dataset, the seeds that we have used yield the tracts that sufficiently represent the regions. The fact that our results are largely consistent with the results of tracer injection studies also suggests that our single-voxel seeding method is viable.
High angular resolution diffusion imaging and probabilistic fiber tractography has the advantages that they are non-destructive; require no surgical interventions; and the connection of each and every voxel can be mapped with full knowledge of the anatomical context, whereas in conventional tractography only a few specific tracer injection sites can be assayed. Also, the brain can be sectioned computationally into any desired plane for analysis. Although the diffusion fiber tractography results are bidirectional and cannot determine whether a connection is afferent or efferent, and currently available diffusion images obviously do not have the fine resolution of conventional tract tracing, this method will still be helpful in extending the study of axonal fiber connectivity to the animals that are rare, cannot be investigated through injections of tract tracers, and can only be accessed post-mortem. The method also has potential applications to high resolution studies of connectivity in fixed human brain tissue.
Conflict of Interest Statement
The authors declare that the research was conducted in the absence of any commercial or financial relationships that could be construed as a potential conflict of interest.
Acknowledgments
We wish to thank Dr. Russell Jacobs of the Beckman Institute at California Institute of Technology for providing the Microcebus brains, and Dr. Jason Kaufman for processing some of the imaging data. This study was supported by the James S. McDonnell Foundation.
References
Allen, G. V., Saper, C. B., Hurley, K. M., and Cechetto, D. F. (1991). Organization of visceral and limbic connections in the insular cortex of the rat. J. Comp. Neurol. 311, 1–16.
Allen Mouse Brain Atlas. (2004). Allen Institute for Brain Science. Available at: http://www.brain-map.org
Allman, J. M. (1977). “Evolution of the visual system in the early primates,” in Progress in Psychobiology and Physiological Psychology, Vol. 7, eds J. M. Sprague and A. N. Epstein (New York, NY: Academic Press), 1–53.
Allman, J. M., Tetreault, N. A., Hakeem, A. Y., Manaye, K. F., Semendeferi, K., Erwin, J. M., Park, S., Goubert, V., and Hof, P. R. (2010). The von Economo neurons in frontoinsular and anterior cingulate cortex in great apes and humans. Brain Struct. Funct. 214, 495–517.
Amaral, D. G., and Insausti, R. (1992). Retrograde transport of D-[H3]-aspartate injected into the monkey amygdaloid complex. Exp. Brain Res. 88, 375–388.
An, X., Bandler, R., Öngür, D., and Price, J. L. (1998). Prefrontal cortical projections to longitudinal columns in the midbrain periaqueductal gray in macaque monkeys. J. Comp. Neurol. 401, 455–479.
Arikuni, T., and Kubota, K. (1985). Claustral and amygdaloid afferents to the head of the caudate nucleus in macaque monkeys. Neurosci. Res. 2, 239–254.
Bayer, S. A., and Altman, J. (1991a). Development of the endopiriform nucleus and the claustrum in the rat-brain. Neuroscience 45, 391–412.
Beckstead, R. M., Morse, J. R., and Norgren, R. (1980). The nucleus of the solitary tract in the monkey – projections to the thalamus and brain-stem nuclei. J. Comp. Neurol. 190, 259–282.
Behan, M., and Haberly, L. B. (1999). Intrinsic and efferent connections of the endopiriform nucleus in rat. J. Comp. Neurol. 408, 532–548.
Behrens, T. E. J., Berg, H. J., Jbabdi, S., Rushworth, M. F. S., and Woolrich, M. W. (2007). Probabilistic diffusion tractography with multiple fibre orientations: what can we gain? Neuroimage 34, 144–155.
Behrens, T. E. J., Johansen-Berg, H., Woolrich, M. W., Smith, S. M., Wheeler-Kingshott, C. A. M., Boulby, P. A., Barker, G. J., Sillery, E. L., Sheehan, K., Ciccarelli, O., Thompson, A. J., Brady, J. M., and Matthews, P. M. (2003a). Non-invasive mapping of connections between human thalamus and cortex using diffusion imaging. Nat. Neurosci. 6, 750–757.
Behrens, T. E. J., Woolrich, M. W., Jenkinson, M., Johansen-Berg, H., Nunes, R. G., Clare, S., Matthews, P. M., Brady, J. M., and Smith, S. M. (2003b). Characterization and propagation of uncertainty in diffusion-weighted MR imaging. Magn. Reson. Med. 50, 1077–1088.
Brodmann, K. (1909). Vergleichende Lokalisationlehre der Groß hirnrinde in ihren Prinziprien dargestellt auf Grund des Zellenbaues. Leipzig: Johann Ambrosius Barth.
Carey, R. G., Fitzpatrick, D., and Diamond, I. T. (1979). Layer-I of striate cortex of Tupaia glis and Galago senegalensis – projections from thalamus and claustrum revealed by retrograde transport of horseradish peroxidase. J. Comp. Neurol. 186, 393–437.
Carey, R. G., and Neal, T. L. (1985). The rat claustrum – afferent and efferent connections with visual-cortex. Brain Res. 329, 185–193.
Cerliani, L., Thomas, R. M., Jbabdi, S., Siero, J. C. W., Nanetti, L., Crippa, A., Gazzola, V., D’Arceuil, H., and Keysers, C. (2011). Probabilistic tractography recovers a rostrocaudal trajectory of connectivity variability in the human insula cortex. Hum. Brain Mapp. doi:10.1002/hbm.21338
Chikama, M., Mcfarland, N. R., Amaral, D. G., and Haber, S. N. (1997). Insular cortical projections to functional regions of the striatum correlate with cortical cytoarchitectonic organization in the primate. J. Neurosci. 17, 9686–9705.
Craig, A. D. (2002). How do you feel? Interoception: the sense of the physiological condition of the body. Nat. Rev. Neurosci. 3, 655–666.
D’Arceuil, H., and De Crespigny, A. (2007). The effects of brain tissue decomposition on diffusion tensor imaging and tractography. Neuroimage 36, 64–68.
D’Arceuil, H., Liu, C., Levitt, P., Thompson, B., Kosofsky, B., and De Crespigny, A. (2008). Three-dimensional high-resolution diffusion tensor imaging and tractography of the developing rabbit brain. Dev. Neurosci. 30, 262–275.
D’Arceuil, H. E., Westmoreland, S., and De Crespigny, A. J. (2007). An approach to high resolution diffusion tensor imaging in fixed primate brain. Neuroimage 35, 553–565.
Deen, B., Pitskel, N. B., and Pelphrey, K. A. (2011). Three systems of insular functional connectivity identified with cluster analysis. Cereb. Cortex 21, 1498–1506.
Dinopoulos, A., Papadopoulos, G. C., Michaloudi, H., Parnavelas, J. G., Uylings, H. B. M., and Karamanlidis, A. N. (1992). Claustrum in the hedgehog (Erinaceus europaeus) brain – cytoarchitecture and connections with cortical and subcortical structures. J. Comp. Neurol. 316, 187–205.
Doeller, C. F., Barry, C., and Burgess, N. (2010). Evidence for grid cells in a human memory network. Nature 463, U657–U687.
Dyrby, T. B., Baaré, W. F. C., Alexander, D. C., Jelsing, J., Garde, E., and Søgaard, L. V. (2011). An ex vivo imaging pipeline for producing high-quality and high-resolution diffusion-weighted imaging datasets. Hum. Brain Mapp. 32, 544–563.
Dyrby, T. B., Søgaard, L. V., Parker, G. J., Alexander, D. C., Lind, N. M., Baaré, W. F. C., Hay-Schmidt, A., Eriksen, N., Pakkenberg, B., Paulson, O. B., and Jelsing, J. (2007). Validation of in vitro probabilistic tractography. Neuroimage 37, 1267–1277.
Edelstein, L. R., and Denaro, F. J. (2004). The claustrum: a historical review of its anatomy, physiology, cytochemistry and functional significance. Cell. Mol. Biol. 50, 675–702.
Fernández-Miranda, J. C., Rhoton, A. L. Jr., Kakizawa, Y., Choi, C., and Alvarez-Linera, J. (2008). The claustrum and its projection system in the human brain: a microsurgical and tractographic anatomical study. J. Neurosurg. 108, 764–774.
Frank, L. M., Brown, E. N., and Wilson, M. (2000). Trajectory encoding in the hippocampus and entorhinal cortex. Neuron 27, 169–178.
Gallyas, F. (1979). Silver staining of myelin by means of physical development. Neurol. Res. 1, 203–209.
Guilfoyle, D. N., Helpern, J. A., and Lim, K. O. (2003). Diffusion tensor imaging in fixed brain tissue at 7.0 T. NMR Biomed. 16, 77–81.
Hafting, T., Fyhn, M., Molden, S., Moser, M. B., and Moser, E. I. (2005). Microstructure of a spatial map in the entorhinal cortex. Nature 436, 801–806.
Iachini, I., Iavarone, A., Senese, V. P., Ruotolo, F., and Ruggiero, G. (2009). Visuospatial memory in healthy elderly, AD and MCI: a review. Curr. Aging Sci. 2, 43–59.
Insausti, R., Amaral, D. G., and Cowan, W. M. (1987). The entorhinal cortex of the monkey: 3. Subcortical afferents. J. Comp. Neurol. 264, 396–408.
Jacobs, J., Kahana, M. J., Ekstrom, A. D., Mollison, M. V., and Fried, I. (2010). A sense of direction in human entorhinal cortex. Proc. Natl. Acad. Sci. U.S.A. 107, 6487–6492.
Jiménez-Castellanos, J., and Reinoso-Suárez, F. (1985). Topographical organization of the afferent connections of the principal ventromedial thalamic nucleus in the cat. J. Comp. Neurol. 236, 297–314.
Jürgens, U. (1983). Afferent fibers to the cingular vocalization region in the squirrel monkey. Exp. Neurol. 80, 395–409.
Khokhryakova, I. M. (1978). Structural organization of the prefrontal cortex in cats and its differences from that in monkeys. Neurosci. Behav. Physiol. 9, 103–109.
Kowianski, P., Dziewiatkowski, J., Berdel, B., Lipowska, M., and Morys, J. (1998). The corticoclaustral connections in the rat studied by means of the fluorescent retrograde axonal transport method. Folia Morphol. (Warsz) 57, 85–92.
Kroenke, C. D., Bretthorst, G. L., Inder, T. E., and Neil, J. J. (2005). Diffusion MR imaging characteristics of the developing primate brain. Neuroimage 25, 1205–1213.
Landau, E. (1919). The comparative anatomy of the nucleus amygdalae, the claustrum and the insular cortex. J. Anat. 53, 351–360.
LeVay, S., and Sherk, H. (1981). The visual claustrum of the cat: 1. Structure and connections. J. Neurosci. 1, 956–980.
Lipowska, M., Kowianski, P., Majak, K., Jagalska-Majewska, H., and Morys, J. (2000). The connections of the endopiriform nucleus with the insular claustrum in the rat and rabbit. Folia Morphol. (Warsz) 59, 77–83.
Mathur, B. N., Caprioli, R. M., and Deutch, A. Y. (2009). Proteomic analysis illuminates a novel structural definition of the claustrum and insula. Cereb. Cortex 19, 2372–2379.
McGeorge, A. J., and Faull, R. L. M. (1989). The organization of the projection from the cerebral-cortex to the striatum in the rat. Neuroscience 29, 503–537.
Menon, V., and Uddin, L. Q. (2010). Saliency, switching, attention and control: a network model of insula function. Brain Struct. Funct. 214, 655–667.
Mesulam, M. M., and Mufson, E. J. (1982a). Insula of the old-world monkey: 1. Architectonics in the insulo-orbito-temporal component of the paralimbic brain. J. Comp. Neurol. 212, 1–22.
Mesulam, M. M., and Mufson, E. J. (1982b). Insula of the old-world monkey: 3. Efferent cortical output and comments on function. J. Comp. Neurol. 212, 38–52.
Meynert, T. (1868). Neue Untersuchungen über den Bau der Grosshirnrinde und ihre örtliche Verschiedenheiten. Alleg. Wien. Medizin. Ztg. 13, 419–428.
Miller, K. L., Stagg, C. J., Douaud, G., Jbabdi, S., Smith, S. M., Behrens, T. E. J., Jenkinson, M., Chance, S. A., Esiri, M. M., Voets, N. L., Jenkinson, N., Aziz, T. Z., Turner, M. R., Johansen-Berg, H., and McNab, J. A. (2011). Diffusion imaging of whole, post-mortem human brains on a clinical MRI scanner. Neuroimage 57, 167–181.
Mori, S., Itoh, R., Zhang, J. Y., Kaufmann, W. E., Van Zijl, P. C. M., Solaiyappan, M., and Yarowsky, P. (2001). Diffusion tensor imaging of the developing mouse brain. Magn. Reson. Med. 46, 18–23.
Morys, J., Bobinski, M., Wegiel, J., Wisniewski, H. M., and Narkiewicz, O. (1996). Alzheimer’s disease severely affects areas of the claustrum connected with the entorhinal cortex. J. Brain Res. 37, 173–180.
Mouse Connectome Project. (2011). Laboratory of Neuro Imaging. Available at: http://www.mouseconnectome.org/
Mufson, E. J., and Mesulam, M. M. (1982). Insula of the old-world monkey: 2. Afferent cortical input and comments on the claustrum. J. Comp. Neurol. 212, 23–37.
Mufson, E. J., and Mesulam, M. M. (1984). Thalamic connections of the insula in the rhesus monkey and comments on the paralimbic connectivity of the medial pulvinar nucleus. J. Comp. Neurol. 227, 109–120.
Mufson, E. J., Mesulam, M. M., and Pandya, D. N. (1981). Insular interconnections with the amygdala in the rhesus monkey. Neuroscience 6, 1231–1248.
Ng, L., Bernard, A., Lau, C., Overly, C. C., Dong, H.-W., Kuan, C., Pathak, S., Sunkin, S. M., Dang, C., Bohland, J. W., Bokil, H., Mitra, P. P., Puelles, L., Hohmann, J., Anderson, D. J., Lein, E. S., Jones, A. R., and Hawrylycz, M. (2009). An anatomic gene expression atlas of the adult mouse brain. Nat. Neurosci. 12, 356–362.
Norita, M. (1977). Demonstration of bilateral claustro-cortical connections in cat with method of retrograde axonal transport of horseradish-peroxidase. Arch. Histol. Jpn. 40, 1–10.
Olson, C. R., and Graybiel, A. M. (1980). Sensory maps in the claustrum of the cat. Nature 288, 479–481.
Öngür, D., An, X., and Price, J. L. (1998). Prefrontal cortical projections to the hypothalamus in macaque monkeys. J. Comp. Neurol. 401, 480–505.
Pearson, R. C. A., Brodal, P., Gatter, K. C., and Powell, T. P. S. (1982). The organization of the connections between the cortex and the claustrum in the monkey. Brain Res. 234, 435–441.
Puelles, L., Kuwana, E., Puelles, E., Bulfone, A., Shimamura, K., Keleher, J., Smiga, S., and Rubenstein, J. L. R. (2000). Pallial and subpallial derivatives in the embryonic chick and mouse telencephalon, traced by the expression of the genes Dlx-2, Emx-1, Nkx-2.1, Pax-6, and Tbr-1. J. Comp. Neurol. 424, 409–438.
Ramón Y Cajal, S. (1900). Studien üie Hirnrinde des Menschen. Leipzig: Verlag von Johann Ambrosius Barth.
Roebroeck, A., Galuske, R., Formisano, E., Chiry, O., Bratzke, H., Ronen, I., Kim, D.-S., and Goebel, R. (2008). High-resolution diffusion tensor imaging and tractography of the human optic chiasm at 9.4 T. Neuroimage 39, 157–168.
Rose, M. (1928). The ontogenesis of the insular lobe – a contribution to the histogenetic cortex arrangement. J. Psychol. Neurol. 36, 182–209.
Shi, C. J., and Cassell, M. D. (1998). Cortical, thalamic, and amygdaloid connections of the anterior and posterior insular cortices. J. Comp. Neurol. 399, 440–468.
Smith, J. B., and Alloway, K. D. (2010). Functional specificity of claustrum connections in the rat: interhemispheric communication between specific parts of motor cortex. J. Neurosci. 30, 16832–16844.
Smith, S. M., Jenkinson, M., Woolrich, M. W., Beckmann, C. F., Behrens, T. E. J., Johansen-Berg, H., Bannister, P. R., De Luca, M., Drobnjak, I., Flitney, D. E., Niazy, R. K., Saunders, J., Vickers, J., Zhang, Y. Y., De Stefano, N., Brady, J. M., and Matthews, P. M. (2004). Advances in functional and structural MR image analysis and implementation as FSL. Neuroimage 23, S208–S219.
Solstad, T., Boccara, C. N., Kropff, E., Moser, M.-B., and Moser, E. I. (2008). Representation of geometric borders in the entorhinal cortex. Science 322, 1865–1868.
Striedter, G. F. (1997). The telencephalon of tetrapods in evolution. Brain Behav. Evol. 49, 179–213.
Sun, S. W., Neil, J. J., and Song, S. K. (2003). Relative indices of water diffusion anisotropy are equivalent in live and formalin-fixed mouse brains. Magn. Reson. Med. 50, 743–748.
Takahashi, E., Dai, G., Rosen, G. D., Wang, R., Ohki, K., Folkerth, R. D., Galaburda, A. M., Wedeen, V. J., and Grant, P. E. (2011). Developing neocortex organization and connectivity in cats revealed by direct correlation of diffusion tractography and histology. Cereb. Cortex 21, 200–211.
Takahashi, E., Dai, G., Wang, R., Ohki, K., Rosen, G. D., Galaburda, A. M., Grant, P. E., and Wedeen, V. J. (2010). Development of cerebral fiber pathways in cats revealed by diffusion spectrum imaging. Neuroimage 49, 1231–1240.
Takahashi, E., Folkerth, R. D., Galaburda, A. M., and Grant, P. E. (2012). Emerging cerebral connectivity in the human fetal brain: an MR Tractography Study. Cereb. Cortex 22, 455–464.
Tanné-Gariépy, J., Boussaoud, D., and Rouiller, E. M. (2002). Projections of the claustrum to the primary motor, premotor, and prefrontal cortices in the macaque monkey. J. Comp. Neurol. 454, 140–157.
Taylor, K. S., Seminowicz, D. A., and Davis, K. D. (2009). Two systems of resting state connectivity between the insula and cingulate cortex. Hum. Brain Mapp. 30, 2731–2745.
Uddin, L. Q., Supekar, K., Amin, H., Rykhlevskaia, E., Nguyen, D. A., Greicius, M. D., and Menon, V. (2010). Dissociable connectivity within human angular gyrus and intraparietal sulcus: evidence from functional and structural connectivity. Cereb. Cortex 20, 2636–2646.
Van De Werd, H. J. J. M., Rajkowska, G., Evers, P., and Uylings, H. B. M. (2010). Cytoarchitectonic and chemoarchitectonic characterization of the prefrontal cortical areas in the mouse. Brain Struct. Funct. 214, 339–353.
Witter, M. P., Room, P., Groenewegen, H. J., and Lohman, A. H. M. (1988). Reciprocal connections of the insular and piriform claustrum with limbic cortex – an anatomical study in the cat. Neuroscience 24, 519–539.
Woolrich, M. W., Jbabdi, S., Patenaude, B., Chappell, M., Makni, S., Behrens, T., Beckmann, C., Jenkinson, M., and Smith, S. M. (2009). Bayesian analysis of neuroimaging data in FSL. Neuroimage 45, S173–S186.
Zhang, J. Y., Miller, M. I., Plachez, C., Richards, L. J., Yarowsky, P., Van Zijl, P., and Mori, S. (2005). Mapping postnatal mouse brain development with diffusion tensor microimaging. Neuroimage 26, 1042–1051.
Keywords: Microcebus murinus, gray mouse lemur, claustrum, insula, HARDI, probabilistic fiber tractography
Citation: Park S, Tyszka JM and Allman JM (2012) The claustrum and insula in Microcebus murinus: a high resolution diffusion imaging study. Front. Neuroanat. 6:21. doi: 10.3389/fnana.2012.00021
Received: 27 February 2012; Accepted: 22 May 2012;
Published online: 13 June 2012.
Edited by:
Patrick R. Hof, Mount Sinai School of Medicine, USAReviewed by:
Chet C. Sherwood, George Washington University, USAEmi Takahashi, Harvard Medical School, USA
Copyright: © 2012 Park, Tyszka and Allman. This is an open-access article distributed under the terms of the Creative Commons Attribution Non Commercial License, which permits non-commercial use, distribution, and reproduction in other forums, provided the original authors and source are credited.
*Correspondence: Soyoung Park, Computation and Neural Systems, California Institute of Technology, M/C 136-93 Caltech, Pasadena, CA 91125, USA. e-mail: spark@caltech.edu