Dominant Lyapunov exponent and approximate entropy in heart rate variability during emotional visual elicitation
- 1Department of Information Engineering and Interdepartmental Research Center “E. Piaggio”, University of Pisa, Pisa, Italy
- 2Centre Extreme, Scuola Superiore Sant'Anna, Institute of Clinical Physiology (IFC-CNR), Pisa, Italy
In this work we characterized the non-linear complexity of Heart Rate Variability (HRV) in short time series. The complexity of HRV signal was evaluated during emotional visual elicitation by using Dominant Lyapunov Exponents (DLEs) and Approximate Entropy (ApEn). We adopted a simplified model of emotion derived from the Circumplex Model of Affects (CMAs), in which emotional mechanisms are conceptualized in two dimensions by the terms of valence and arousal. Following CMA model, a set of standardized visual stimuli in terms of arousal and valence gathered from the International Affective Picture System (IAPS) was administered to a group of 35 healthy volunteers. Experimental session consisted of eight sessions alternating neutral images with high arousal content images. Several works can be found in the literature showing a chaotic dynamics of HRV during rest or relax conditions. The outcomes of this work showed a clear switching mechanism between regular and chaotic dynamics when switching from neutral to arousal elicitation. Accordingly, the mean ApEn decreased with statistical significance during arousal elicitation and the DLE became negative. Results showed a clear distinction between the neutral and the arousal elicitation and could be profitably exploited to improve the accuracy of emotion recognition systems based on HRV time series analysis.
1. Introduction
Heart rate variability (HRV) refers to the variations in the beat-to-beat intervals or correspondingly in the instantaneous heart rate (HR). HRV reflects the regulation mechanism of the cardiac activity by the Autonomic Nervous System (ANS) (Saul, 1990). Over the last 20 years, several studies have demonstrated the significant relationship between ANS and HRV, especially by means of frequency domain indexes, e.g., LF/HF ratio (Rajendra Acharya et al., 2006). Since the human cardiovascular system is intrinsically non-linear, methods for studying dynamic systems have been adopted to quantify HRV and find non-linear fluctuations in the HR, that are otherwise not apparent. Although a detailed physiological explanation behind these complex dynamics has not been completely clarified, several non-linearity measures of HRV have been used as important quantifiers of the complexity of cardiovascular control in healthy and impaired subjects (Poon and Merrill, 1997; Glass, 2001; Atyabi et al., 2006). Some non-linear methods used for studying the HRV include Lyapunov exponents (LEs) (Rosenstein et al., 1993), 1/f slope (Kobayashi and Musha, 2007), approximate entropy (ApEn) (Pincus, 1991), Detrended Fluctuation Analysis (DFA) (Peng et al., 1995), recurrence plot (Eckmann et al., 1987; Marwan et al., 2002), and entropy analysis (Richman and Moorman, 2000). As reported in (Hagerman et al., 1996), HRV of sinus rhythm is characterizing by being a chaos-like determinism, with at least a positive dominant Lyapunov exponent (DLE) and l/f-like broad-band spectrum with an exponent of approximately −1. Moreover, HRV chaos-like determinism is modulated but not eliminated by the inhibition of the autonomic tone or by exercise. The aim of this work is to study how the complexity HRV evolves during affective stimulation by means of features extracted from non-linear methodologies. Specifically, we characterized the complexity of the HRV signal by means of ApEn and LE during emotional visual elicitation. In the last few years, much effort has been made by researchers to establish a reliable methodology for an automatic recognition of affective states (e.g., see Picard et al., 2001; Kim and André, 2008; Katsis et al., 2010). The most cited works implemented data mining algorithms based on classification methods, e.g., Linear Discriminant Analysis (LDA), Marquardt Backpropagation Algorithm (MBA), Artificial Neural Network (ANN), Support Vector Machine (SVM), etc. In all of them the dataset was comprised of a set of features extracted from peripheral signals, such as surface ElectroCardioGram (ECG), ElectroMyoGram (EMG), Blood Volume Pulse (BVP), ElectroDermal Response (EDR), ReSPiration Activity (RSP), Skin Temperature (ST), etc. According to the literature, the choice of an emotional model remains a crucial issue to be carefully addressed. As a matter of fact, several approaches to model emotions can be found, and most influential studies can be listed as discrete, dimensional, appraisal, neurobiological, and dynamical models (Russell, 1980; Ortony et al., 1990; Ekman, 1999; Breazeal, 2003; Egges et al., 2003). We have chosen an approach which uses multiple dimensions to categorize emotions, i.e., Circumplex Model of Affects (CMAs) (Posner et al., 2005). Actually, in many cases, it is possible to use a more simplified bi-dimensional model. This simplified model interprets underlying affects emotional mechanisms as a continuum of highly interrelated and often ambiguous states. They are distributed over a Cartesian system of axes with each axis representing a neurophysiological pathway by which emotion is being processed. In particular, in the CMA used in our experiments, the two dimensions were conceptualized by the terms of valence and arousal (Russell, 1980), which can be intended as the two independent, predominantly subcortical, systems that underlie emotions (see Figure 1). This model addresses most of the methodological issues raised by experimental studies on emotions and provides a reliable means for comparing outcomes. In this simplified model, arousal and valence can be considered adequate parameters to identify specific emotions. Arousal indicates the intensity of affective load, while valence is associated to pleasant or unpleasant perception. Since this work reports on the complexity modulation due to arousal changes, in our experiment the valence is kept constant and negative while arousal varied from the minimum to the maximum. The area related to our elicitation is restricted to no more than the left half of Figure 1. In our experiments, a set of images was chosen from the International Affective Picture System (IAPS), which will be described in detail later, has been chosen. During the slideshow, ECG signal was recorded in order to extract the HRV signal. In this paper, after describing the experimental protocol, the methodologies of signal processing and non-linear methods for feature extraction are reported. Finally, experimental results are shown and discussed.
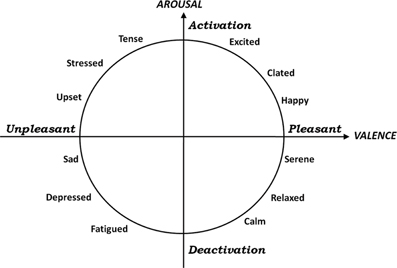
Figure 1. A graphical representation of the circumplex model of affect from our previous work [Valenza et al. (2011)]. The horizontal axis representing the valence dimension and the vertical axis representing the arousal or activation dimension.
2. Experimental Protocol
Here, in order to guarantee reliability and reproducibility of the experiments an accurate experimental protocol was implemented. A hardware integrated-system able to acquire and elaborate physiological signals along with a suitable visual stimulus elicitation system was realized. In addition, each subject filled out an informed consent, which explained the emotional load and risks of the experimental phase. As participant observations were involved, the protocol was designed following the Research Ethics Board (REB) guidelines. We received the protocol approval by the Ethics Committee of the Pisa Hospital.
2.1. Recruitment of Eligible Subjects
A group of 35 healthy subjects, i.e., not suffering from evident mental pathologies, was recruited to participate in the experiment. In addition, the involved subjects did not present cardiovascular (or ANS) diseases (known to alter the HRV). Their mean age was 22 (SD=2), and they were naive to the purpose of the experiment. Moreover, they were asked to fill out the Patient Health Questionnaire™ (PHQ), which is one of the most frequently used, self-administered tests of personality in mental health (Kroenke et al., 2003). Although this test is usually employed to identify personality structures and psycho-pathologies, here it was used to discard subjects affected by high personality disorders. The test uses an empirical keying approach, where scales of personality were derived from items endorsed by patients. It consists of 16 items, and usually took about 20 min to complete depending on the reading level. More specifically, the exclusion criteria used to discard subjects from the experimental section were mainly based on the results of the PHQ, which were evaluated by a clinical psycho-physiologist team. In detail, the exclusion threshold was fixed at scores >8 (Duffy et al., 2008).
2.2. Stimulus Elicitation
The affective elicitation was performed by projecting a set of images onto a PC monitor. The most famous and used image set is the IAPS (Lang et al., 1993, 2005) which consists of hundreds of images with associated a specific emotional rating in terms of valence and arousal. Valence represents the perception of an emotions as being either positive or negative. Arousal indicates the degree of intensity of an emotion. The emotional ratings are based on several studies previously conducted where subjects were requested to rank these images using the Self Assessment Manikin (Lang, 1980). In addition, the elicitation by IAPS activates segregated neural representation of the different emotion dimensions in different prefrontal cortical regions (Hariri et al., 2003; Grimm et al., 2006). Five classes of arousal and five valence levels were selected and presented to 35 healthy subjects in a controlled environment in the form of a slideshow. It was projected in a room properly equipped with a dedicated monitor and headset to acoustically insulate from external noise. The slideshow was comprised of eight sessions of images N, A1, N, A2, N, A3, N, A4, where N was a session of six neutral images and Ai were sets of images at increasing levels of arousal, from i = 1 to i = 4. We characterized each session by means of the valence/arousal rating, i.e., a 66% Confidence Interval (CI) expressed in terms of (Mean ± Standard Deviation) of the image scores. Since even a single outlier (i.e., image with score out of the CI boundaries) could strongly biases the session, we also taken into account the valence/arousal range information (i.e. from minimum to maximum score separated by the division symbol). Detailed values are reported in Table 1. The generic session Ai was comprised, in turn, of six images having the lowest level of valence (i.e., all images were unpleasant). The overall protocol utilized 48 images. Each image was presented for 10 s for a total experiment duration of 5 min, approximately. During the visual elicitation, ECG signal was acquired.
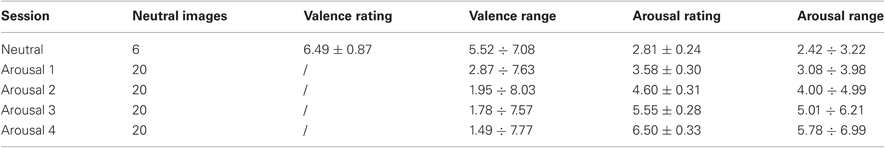
Table 1. Rating of IAPS images used in this work.
2.3. Physiological Signal and Instrumentation
The ECG signal was acquired simultaneously with the image slideshow by using the BIOPAC MP150. The sampling rate was fs = 250 Hz for all signals. ECG was acquired only to extract the HRV signal.
2.3.1. ECG
We used the ECG100C ECG Amplifier from BIOPAC Inc., with a noise voltage of 0.1 μ V (rms) in the bandwidth 0.05–35 Hz, a CMRR of 110 dB, a 16-bit ADC, and an amplitude resolution of ±0.4 mV to record the D2 lead ECG signal. Pregelled Ag/AgCl electrodes were placed following the Einthoven triangle configuration. ECG signal was used to extract the HRV (Rajendra Acharya et al., 2006), which reflects the sympathetic-parasympathetic balance. HRV refers to the variation of the time interval between consecutive heartbeats.
3. Methodology
After IAPS elicitation, ECG signal was preprocessed, i.e., segmented and filtered. Segmentation was applied according to the arousal classes. Moreover, the ECG was pre-filtered through a moving average filter in order to extract and subtract the baseline. The frequency response of an M point moving average filter is expressed as follows:
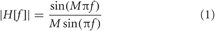
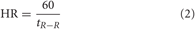
Accordingly, we have chosen M = 500, which corresponds to a duration of 2 s, in order to obtain a cut-off frequency of 0.5 Hz, approximately. Since HRV refers to the change of the HR over time, a QRS complex detection algorithm was used. Automatic QRS detection can be addressed using several methods, depending on the characteristics of the specific ECG signal (Kohler et al., 2002), e.g., signal-to-noise-ratio (SNR), signal power, and ECG leads. We adopted the automatic algorithm developed by Pan–Tompkins (Pan and Tompkins, 1985). This algorithm allowed us to extract each QRS complex and to detect the corresponding R-peak. Hence, the RR interval (tR−R) is defined as the interval between two successive QRS complexes. Nevertheless, not all of the RR intervals obtained by the automatic QRS detection algorithm were correct. Any technical artifact (i.e., errors due to the R-peak detection algorithm) in the RR interval time series may interfere with the analysis of these signals. Therefore, an artifact correction was needed. In this work we adopted a proper piecewise cubic spline interpolation method (Lippman et al., 1993, 1994). Besides the mentioned technical one, physiological artifacts could be also present in the analyzed RR series. They include ectopic beats and arrhythmic events. We manually checked for physiological artifacts and only artifact-free sections have been included in the analysis. Another common feature that can significantly alter the analysis is the slow trend within the analyzed RR series. In fact, slow non-stationarities can be present in HRV signals and should be considered before the analysis (Berntson et al., 1997). In this work, the detrending procedure was implemented by means of an advanced method originally presented in (Tarvainen et al., 2002). This approach was based on smoothness priors regularization. Since the RR interval (tR−R) is defined as the interval between two successive QRS complexes, i.e., between two consecutive R-peaks, the HR (beats per minute) is given as:
As HR is a time series sequence of non-uniform RR intervals, this signal was further re-sampled at 100 Hz according to the algorithm of Berger et al. This resampling value allowed us to calculate reliable values of DLE and ApEn as reported in Section 3.1. This algorithm is based on using an arbitrary frequency at which the HR samples will be evenly spaced in time, and using a local time window defined at each HR sample point as the time interval extending from the previous sample to the next. Successively, the number of RR intervals (including fractions of them) that occur within this local window were counted. The value ri of the HR at each sample point was taken to be ri = fr − ni/2 where fr was the sampling frequency of the resulting HR signal and ni was the number of RR intervals falling into the local window centered at the ith sample point (Berger et al., 1986).
Before performing the statistical analysis, we implemented the Lilliefors test to check whether the data were normally distributed. As they did not have a normal distribution, the results are expressed in terms of median and median absolute deviation. Accordingly, the Kruskal–Wallis method (McKight and Najab), i.e., non-parametric One-Way analysis of variance, was used to test the null hypothesis that no difference exists among different sessions as well as the Wilcoxon signed-rank test, i.e., a non-parametric statistical hypothesis test used when comparing samples from two sessions, to assess whether their population medians differ. Since, in the computation of the ApEn, the threshold is proportional to the standard deviation of the RR intervals (see Section 3.1.2 below), the changes in ApEn could be related to changes in the standard deviation of the RR time series (SDNN) and not to the complexity of the signal (Garcia-Gonzalez et al., 2009). Therefore, a statistical analysis on the changes in SDNN through the sessions is provided as well.
3.1. Non-Linear Dynamic Methods for Feature Extraction
The evolution of a non-linear system can be represented by a trajectory through a multidimensional space, often referred to as the phase space or state space. If the multidimensional evolution converges to a subspace within the phase space, this subspace is called the attractor of the system (Kantz et al., 1997). Measures that are commonly used to describe the attractor in the phase space are dimension, entropy, and LEs. However, in the literature, many measures are implemented for chaotic behavior investigation. In this paper only ApEn and LEs have been used to characterize the complexity of HRV. More specifically, ApEn was chosen because it can distinguish between wide variety of systems, and ApEn estimation can be achieved with relatively few points, as reported by Pincus et al. (Pincus, 1991). The LE index has been already used in the literature, e.g., (Hagerman et al., 1996), to characterize HRV in terms of low-dimensional chaos-like determinism. Because of the time resolution, we have used the resampled HRV as an input of the DLE and ApEn algorithms.
3.1.1. Lyapunov exponents
Deterministic chaos exhibits a number of features that distinguishs it from periodic and random behavior, more specifically by its sensitive dependence on initial conditions, which means that small changes in the state variables at one point will create large differences in the behavior of the system at some future point. This manifests itself graphically as adjacent trajectories that diverge widely from their initial close positions. The Lyapunov exponent is a quantitative measure of the average rate of this separation. A positive Lyapunov exponent indicates sensitive dependence on initial conditions and thus loss of predictability, indicative of deterministic chaos (Ruelle, 1979). The Lyapunov exponent describes the speed of attraction (convergence), if negative, or divergence, if positive, of trajectories in each dimension of the attractor. In three dimensions, for instance, three Lyapunov exponents describe the evolution of the volume of a cube, and, in general, the sum of all Lyapunov exponents indicates how the measure of a hypercube evolves in a multidimensional attractor. The sum of positive exponents indicate the spreading rate of the hypercube, hence the increase of unpredictability per unit time. This dynamic is practically dominated by the largest positive (or Dominant) Lyapunov exponent. It describes the expansion along the principal axis (pi) of the hypercube over a given time interval t. Formally, the exponents (λi) are calculated as:
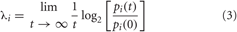
where λi are ordered from largest to smallest. The calculation of the DLE is a crucial point in this work because we did not have a long-term acquisition of HRV. For experimental applications, a number of researchers have proposed algorithms that estimate the DLE (Wolf et al., 1985; Farmer and Sidorowich, 1987; Sato et al., 1987; Casdagli, 1989; Ellner et al., 1991), or the positive Lyapunov spectrum, i.e., only positive exponents (Wolf et al., 1985). We implemented the approach proposed by Rosenstein et al. (Rosenstein et al., 1993) which ensures reliable values of DLE even in short data sets. In fact, this method is easy to implement and fast because it uses a simple measure of exponential divergence that circumvents the need to approximate the tangent map. In addition, the algorithm does not require large data sets. More in detail, we reconstructed the attractor dynamics from a single HRV series by means of the method of delays (Takens, 1981). Formally, given a time series xt : xt = (x1, x2,…, xN) we calculated a set of vectors Xi such that

where Δ is the time delay in a number of samples and m is the embedding dimension of the vector. The embedding dimension is usually estimated in accordance with Takens's theorem (Takens, 1981). A common choice for the time delay estimation by means of the correlation sum was addressed by Liebert and Schuster (Liebert and Schuster, 1989). After reconstructing the dynamics, the algorithm locates the nearest neighbor of each point on the trajectory. The nearest neighbor, Xĵ, is found by searching for the point that minimizes the distance to the particular reference point, identified by the vector Xj. This is expressed as
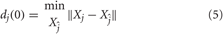
where dj(0) is the initial distance from the jth point to its nearest neighbor, and ||.|| denotes the Euclidean norm. The largest Lyapunov exponent is then estimated as the mean rate of separation of the nearest neighbors. In this work, the time delay Δ was held constant to 1 beat in order to ensure that we are looking at the same dynamics among the neutral and the arousal sessions.
3.1.2. Approximate entropy
ApEn measures the complexity or irregularity of the signal (Fusheng et al., 2000; Richman and Moorman, 2000). Large values of ApEn indicate high irregularity and smaller values of ApEn indicate a more regular signal. The ApEn is computed as follows: first, a set of length m vectors uj is formed:

where j = 1,2,…, N − m + 1, m is the embedding dimension, and N is the number of measured RR intervals. The distance between these vectors is defined as the maximum absolute difference between the corresponding elements, i.e.:

Next, for each uj the relative number of vectors uk for which d(uj, uk) ≤ r is calculated, where r is the tolerance value. The index is denoted with Cmj (r) and can be written in the form:
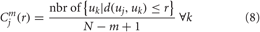
Due to the normalization, the value of Cmj (r) is always lesser than or equal to 1. Note that the value is, however, at least 1/(N − m + 1) since uj is also included in the count. Then, take the natural logarithm of each Cmj (r) and average over j to yield:
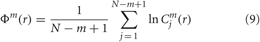
Finally, the ApEn is obtained as:

The value of the estimate ApEn depends on three parameters: the length m of the vectors uj, the tolerance r, and the data length N. In this work we have chosen m = 2. The length N of the data also affects ApEn. As N increases the ApEn approaches its asymptotic value. The tolerance r has a strong effect on ApEn and should be selected as a fraction of the Standard Deviation of all Normal-to-Normal (SDNN) intervals, i.e., the standard deviation of the intervals between successive normal QRS complexes. A common selection for r is r = 0.2 · SDNN, which is also used in this work.
4. Experimental Results
In Tables 2 and 3 the results from ApEn, DLE (i.e., λ) and SDNN calculation are shown in terms of median and median absolute deviation relative to each session. The SDNN statistics were evaluated in order to verify that the ApEn findings depend only on the change in the complexity behavior and not on the SDNN value used for the calculation of the ApEn (i.e., thresholding). Firstly, we applied the Kruskal–Wallis test among all the neutral classes together and among all the arousal classes. In both cases, for all the considered features, we cannot reject the null hypothesis implying that all the neutral classes belong to the same population as well as for the arousal classes (p − value > 0.05). Considering all the sessions, we obtained no statistical difference among all the sessions for the SDNN, while the null hypothesis for both ApEn and λ can be rejected with (p − value < 0.05). This means that the SDNN values are undistinguishable through all the sessions (ensuring the reliability of the ApEn findings) while at least one session is statistically different from the other ones in both ApEn and λ population. Finally we tested the null hypothesis between the two groups including all the neutral and arousal classes, respectively. We used in this case the Wilcoxon signed-rank test, which is also a nonparametric t-test. Even in this case, we rejected the null hypothesis both ApEn and λ (p − value < 0.01). According to DLE findings, the median ApEn values tended to reduce in arousal sessions. Moreover, we reported in Table 4 the percentage of subjects in which chaos and non-chaos was found. The ApEn and DLE calculations were performed for each subject for the whole duration of each session.
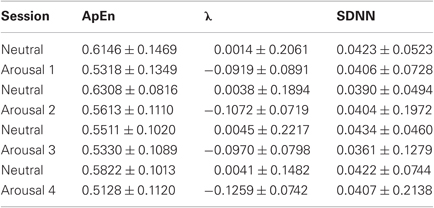
Table 2. Median and absolute median deviation of ApEn and DLE and SDNN across all the sessions.
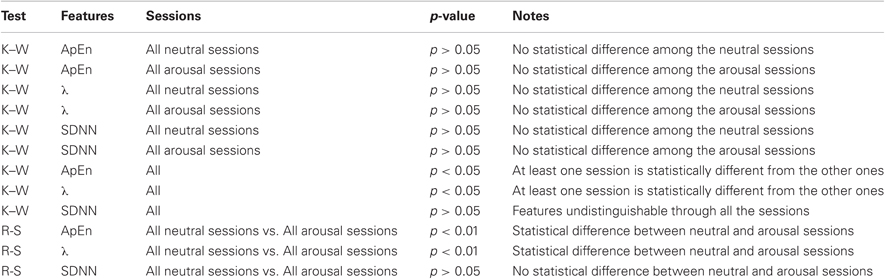
Table 3. Results from the statistical analysis applying Kruskal–Wallis (K–W) and Rank-Sum (R-S) tests.
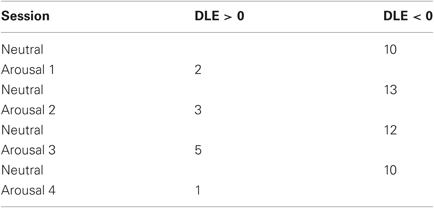
Table 4. Number of subjects characterized by DLE.
5. Discussion and Conclusion
This work aimed at characterizing HRV dynamics by using non-linear methods during five levels of arousal (including one neutral level) in 35 healthy volunteers presented with images gathered from the IAPS dataset according to a specific protocol. Techniques derived from non-linear dynamics and chaos theory may be of complementary value in identifying patterns and mechanisms that are not detectable with traditional statistics based on linear models. It is already documented in the literature that HRV exhibits chaotic behavior dynamics in a rest condition. Our experimental findings showed different behaviors of HRV during the presentation of neutral images against images with high arousal. As shown in Table 2, ApEn decreases when switching from neutral to arousal sessions, and DLE is positive for all the neutral sessions and negative during arousal sessions. A statistical analysis has been performed in order to study the statistical significance of the changes in ApEn and DLE across all sessions and within similar sessions. Moreover, Table 4 shows that the percentage of subjects exhibiting a more complex behavior in the HRV is significantly higher during all the neutral sessions. Statistical results showed that all the samples of the neutral sessions, as well as of the arousal sessions, can be considered originating from the same distribution, but all neutral sessions considered as a whole and the arousal sessions considered as a whole differ significantly. These results deserve to be discussed. First of all, several physiological adaptation phenomena are involved during the affective elicitation, so the system could reacts in a similar way during the switching between a neutral and an elicitation with low arousal or high arousal. We previously demonstrated how it is necessary to consider the HRV along with both the RSP and the EDR in order to well characterize different (and similar) affective elicitation [see (Valenza et al., 2011)]. Concerning the SDNN, no statistical difference (p > 0.05) was found, meaning that ApEn findings depend only on the change in the complexity behavior and not on the SDNN value used for the calculation of the ApEn itself.
In conclusion, we found that the use of a non-linear approach to evaluate the regularity and predicability of ANS is important as it may open new directions to modeling the HRV. We moved from the assumption that physiological systems must be considered as complex as any other natural system. The inheritance of scale-free behavior in coupled complex systems have been recently studied and some rigorous results have been reported (West et al., 2008). In addition, our findings may link the theory of Scherer (Grandjean et al., 2008), which argues that synchronization of periodic systems is fundamental in the emotion area. During the last two decades, numerous studies based on engineering approaches to automatically recognize emotions have been published (Picard, 2000, 2010; Kim and André, 2008; Paleari et al., 2010). This work is intended to provide an important contribution to improving the emotion recognition systems based on HRV time series analysis.
Conflict of Interest Statement
The authors declare that the research was conducted in the absence of any commercial or financial relationships that could be construed as a potential conflict of interest.
6. Acknowledgments
This research is partially supported by the EU Commission under contract FP7-ICT-247777 Psyche.
References
Atyabi, F., Livari, M., Kaviani, K., and Tabar, M. (2006). Two statistical methods for resolving healthy individuals and those with congestive heart failure based on extended self-similarity and a recursive method. J. Biol. Phys. 32, 489–495.
Berger, R., Akselrod, S., Gordon, D., and Cohen, R. (1986). An efficient algorithm for spectral analysis of heart rate variability. IEEE Trans. Biomed. Eng. 33, 900–904.
Berntson, G. G., Bigger, J. T. Jr, Eckberg, D. L., Grossman, P., Kaufmann, P. G., Malik, M., Nagaraja, H. N., Porges, S. W., Saul, J. P., Stone, P. H., and van der Molen, M. W. (1997). Heart rate variability: origins, methods, and interpretive caveats. Psychophysiology 34, 623–648.
Duffy, F., Chung, H., Trivedi, M., Rae, D., Regier, D., and Katzelnick, D. (2008). Systematic use of patient-rated depression severity monitoring: is it helpful and feasible in clinical psychiatry? Psychiatr. Serv. 59, 1148–1154.
Eckmann, J., Kamphorst, S., and Ruelle, D. (1987). Recurrence plots of dynamical systems. Europhys. Lett. 4, 973.
Egges, A., Kshirsagar, S., and Magnenat-Thalmann, N. (2003). “A model for personality and emotion simulation,” in Knowledge-Based Intelligent Information and Engineering Systems, eds V. Palade, R. J. Howlett, and L. C. Jain (Springer), 453–461.
Ekman, P. (1999). “Basic emotions,” in Handbook of Cognition and Emotion, eds T. Dalgleish, and M. Power (Sussex, UK: John Wiley & Sons), 45–60.
Ellner, S., Gallant, A. R., McCaffrey, D., and Nychka, D. (1991). Convergence rates and data requirements for Jacobian-based estimates of Lyapunov exponents from data. Phys. Lett. A 153, 357–363.
Farmer, J., and Sidorowich, J. (1987). Predicting chaotic time series. Phys. Rev. Lett. 59, 845–848.
Fusheng, Y., Bo, H., and Qingyu, T. (2000). Approximate Entropy and its application in biosignal analysis. Nonlin. Biomed. Signal Process. 2, 72.
Garcia-Gonzalez, M., Fernández-Chimeno, M., and Ramos-Castro, J. (2009). Errors in the estimation of approximate entropy and other recurrence-plot-derived indices due to the finite resolution of RR time series. IEEE Trans. Biomed. Eng. 56, 345–351.
Grandjean, D., Sander, D., and Scherer, K. (2008). Conscious emotional experience emerges as a function of multilevel, appraisal-driven response synchronization. Conscious. Cogn. 17, 484–495.
Grimm, S., Schmidt, C., Bermpohl, F., Heinzel, A., Dahlem, Y., Wyss, M., Hell, D., Boesiger, P., Boeker, H., and Northoff, G. (2006). Segregated neural representation of distinct emotion dimensions in the prefrontal cortex-an fMRI study. Neuroimage 30, 325–340.
Hagerman, I., Berglund, M., Lorin, M., Nowak, J., and Sylvén, C. (1996). Chaos-related deterministic regulation of heart rate variability in time-and frequency domains: effects of autonomic blockade and exercise. Cardiovasc. Res. 31, 410.
Hariri, A., Mattay, V., Tessitore, A., Fera, F., and Weinberger, D. (2003). Neocortical modulation of the amygdala response to fearful stimuli. Biol. Psychiatry 53, 494–501.
Kantz, H., Schreiber, T., and Mackay, R. (1997). Nonlinear Time Series Analysis, Vol. 2000. Cambridge, MA: Cambridge University Press.
Katsis, C., Katertsidis, N., and Fotiadis, D. (2010). An integrated system based on physiological signals for the assessment of affective states in patients with anxiety disorders. Biomed. Signal Process. Control 6, 261–268.
Kim, J., and André, E. (2008). Emotion recognition based on physiological changes in music listening. IEEE Trans. Pattern Anal. Mach. Intell. 30, 2067–2083.
Kobayashi, M., and Musha, T. (2007). 1/f fluctuation of heartbeat period. IEEE Trans. Biomed. Eng. 29, 456–457.
Kohler, B., Hennig, C., and Orglmeister, R. (2002). The principal of Software QRS Detection. IEEE Eng. Med. Biol. 6, 42–57.
Kroenke, K., Spitzer, R., and Williams, J. (2003). The patient health questionnaire-2: validity of a two-item depression screener. Med. Care 41, 1284.
Kruskal, W. H., and Wallis, W. A. (1952). Use of ranks in one-criterion variance analysis. J. Am. Stat. Assoc. 583–621.
Lang, P. J. (1980). “Behavioral treatment and bio-behavioral assessment: computer applications,” in Technology in Mental Health Care Delivery Systems, eds J. B. Sidowski, J. H. Johnson, and T. A. Williams (Norwood, NJ: Ablex), 119–137.
Lang, P., Bradley, M., and Cuthbert, B. (2005). International affective picture system (IAPS): Digitized photographs, instruction manual and affective ratings. Technical report A-6. University of Florida.
Lang, P., Greenwald, M., Bradley, M., and Hamm, A. (1993). Looking at pictures: affective, facial, visceral, and behavioral reactions. Psychophysiology 30, 261–273.
Lippman, N., Stein, K., and Lerman, B. (1993). Nonlinear predictive interpolation. A new method for the correction of ectopic beats for heart rate variability analysis. J. Electrocardiol. 26, 14.
Lippman, N., Stein, K., and Lerman, B. (1994). Comparison of methods for removal of ectopy in measurement of heart rate variability. Am. J. Physiol. Heart Circ. Physiol. 267, H411.
Marwan, N., Wessel, N., Meyerfeldt, U., Schirdewan, A., and Kurths, J. (2002). Recurrence-plot-based measures of complexity and their application to heart-rate-variability data. Phys. Rev. EStat. Nonlin. Soft Matter Phys. 66, 26702.
Ortony, A., Clore, G., and Collins, A. (1990). The Cognitive Structure of Emotions. Cambridge: Cambridge University Press.
Paleari, M., Chellali, R., and Huet, B. (2010). “Features for multimodal emotion recognition: an extensive study,” in Cybernetics and Intelligent Systems (CIS), 2010 IEEE Conference On. (Singapore: IEEE), 90–95.
Pan, J., and Tompkins, W. (1985). A real-time QRS detection algorithm. IEEE Trans. Biomed. Eng. 32, 230–236.
Peng, C., Havlin, S., Hausdorff, J., Mietus, J., Stanley, H., and Goldberger, A. (1995). Fractal mechanisms and heart rate dynamics. Long-range correlations and their breakdown with disease. J. Electrocardiol. 28, 59–65.
Picard, R., Vyzas, E., and Healey, J. (2001). Toward machine emotional intelligence: analysis of affective physiological state. IEEE Trans. Pattern Anal. Mach. Intell. 23, 1175–1191.
Pincus, S. (1991). Approximate entropy as a measure of system complexity. Proc. Natl. Acad. Sci. U.S.A. 88, 2297.
Poon, C., and Merrill, C. (1997). Decrease of cardiac chaos in congestive heart failure. Nature 389, 492–495.
Posner, J., Russell, J., and Peterson, B. (2005). The circumplex model of affect: an integrative approach to affective neuroscience, cognitive development, and psychopathology. Dev. Psychopathol. 17, 715–734.
Rajendra Acharya, U., Paul Joseph, K., Kannathal, N., Lim, C., and Suri, J. (2006). Heart rate variability: a review. Med. Biol. Eng. Comput. 44, 1031–1051.
Richman, J., and Moorman, J. (2000). Physiological time-series analysis using approximate entropy and sample entropy. Am. J. Physiol. Heart Circ. Physiol. 278, H2039.
Rosenstein, M., Collins, J., and De Luca, C. (1993). A practical method for calculating largest Lyapunov exponents from small data sets. Physica D 65, 117–134.
Ruelle, D. (1979). Sensitive dependence on initial condition and turbulent behavior of dynamical systems. Ann. N.Y. Acad. Sci. 316, 408–416.
Sato, S., Sano, M., and Sawada, Y. (1987). Practical methods of measuring the generalized dimension and the largest Lyapunov exponent in high dimensional chaotic systems. Prog. Theor. Phys. 77, 1–5.
Saul, J. (1990). Beat-to-beat variations of heart rate reflect modulation of cardiac autonomic outflow. Physiology 5, 32.
Takens, F. (1981). “Detecting strange attractors in turbulence,” in Dynamical Systems and Turbulence (Warwick 1980), 898, 366–381.
Tarvainen, M., Ranta-Aho, P., and Karjalainen, P. (2002). An advanced detrending method with application to hrv analysis. IEEE Trans. Biomed. Eng. 49, 172–175.
Valenza, G., Lanata, A., and Scilingo, E. (2011). “The role of nonlinear dynamics in affective valence and arousal recognition,” Affective Computing, IEEE Transactions On, 1–1.
Keywords: heart rate variability, non-linear analysis, emotion recognition, affective computing, dominant Lyapunov exponent, approximate entropy
Citation: Valenza G, Allegrini P, Lanatà A and Scilingo EP (2012) Dominant Lyapunov exponent and approximate entropy in heart rate variability during emotional visual elicitation. Front. Neuroeng. 5:3. doi: 10.3389/fneng.2012.00003
Received: 25 July 2011; Accepted: 11 February 2012;
Published online: 29 February 2012.
Edited by:
Mattia Bertschi, CSEM SA - Centre Suisse d'Electronique et Microtechnique, SwitzerlandReviewed by:
Mathieu Lemay, CSEM SA - Centre Suisse d'Electronique et Microtechnique, SwitzerlandJosep Sola, CSEM SA - Centre Suisse d'Electronique et Microtechnique, Switzerland
Copyright: © 2012 Valenza, Allegrini, Lanatà and Scilingo. This is an open-access article distributed under the terms of the Creative Commons Attribution Non Commercial License, which permits non-commercial use, distribution, and reproduction in other forums, provided the original authors and source are credited.
*Correspondence: Gaetano Valenza, Department of Information Engineering and Interdepartmental Research Center “E. Piaggio”, University of Pisa, Via G. Caruso 16 - 56122, Pisa, Italy. e-mail: g.valenza@ieee.org