Visual systems for interactive exploration and mining of large-scale neuroimaging data archives
- Laboratory of Neuro Imaging, Department of Neurology, David Geffen School of Medicine, University of California, Los Angeles, CA, USA
While technological advancements in neuroimaging scanner engineering have improved the efficiency of data acquisition, electronic data capture methods will likewise significantly expedite the populating of large-scale neuroimaging databases. As they do and these archives grow in size, a particular challenge lies in examining and interacting with the information that these resources contain through the development of compelling, user-driven approaches for data exploration and mining. In this article, we introduce the informatics visualization for neuroimaging (INVIZIAN) framework for the graphical rendering of, and dynamic interaction with the contents of large-scale neuroimaging data sets. We describe the rationale behind INVIZIAN, detail its development, and demonstrate its usage in examining a collection of over 900 T1-anatomical magnetic resonance imaging (MRI) image volumes from across a diverse set of clinical neuroimaging studies drawn from a leading neuroimaging database. Using a collection of cortical surface metrics and means for examining brain similarity, INVIZIAN graphically displays brain surfaces as points in a coordinate space and enables classification of clusters of neuroanatomically similar MRI images and data mining. As an initial step toward addressing the need for such user-friendly tools, INVIZIAN provides a highly unique means to interact with large quantities of electronic brain imaging archives in ways suitable for hypothesis generation and data mining.
Introduction
After more than a decade of intense interest and effort (Van Horn et al., 2001, 2005; Van Horn and Gazzaniga, 2002; Van Horn and Ishai, 2007), neuroimaging data repositories are becoming commonplace as are the means for populating them using methods of electronic data capture (Van Horn and Toga, 2009a,b). Along with raw image volumes from structural and functional MR and accompanying modalities, these databases frequently contain detailed subject and study-specific meta-data attributes providing the contextual components for data collection, study conditions, assessment, and outcome measures. Archives may contain the brain imaging data obtained as part of a multi-site study or may represent a range of study types gathered from published research studies. Once placed into the database architecture, qualified users may download the imaging and meta-data from individual or groups of subjects matching search criterion for further processing and image analysis, for instance, using workflow environments (Dinov et al., 2009, 2010). In most cases, however, database search criterion are based explicitly and solely on text- or numerically based meta-data descriptive characteristics such as age (e.g., subjects older then 50), gender (“male” vs. “female”), handedness (“right” vs. “left”), scanning parameters (“1.5 T” vs. “3 T” scanners), etc., with no particular bearing upon derived neuroanatomical attributes from the imaging data themselves. Often, one might want to explore the patterns of cortical geometry and identify subjects who not only satisfy the required meta-data-based criterion but also possess certain characteristics concerning cortical shape, curvature, thickness, etc. Moreover, the instances of these attributes taken across the image volumes in the database itself may tend to form groupings or clusters based upon neuroanatomical similarity which may directly relate to meta-data classifiers (e.g., patient diagnosis, allelic variant, duration of illness, etc.). The examination of such patterns and the exploration of which factors might be worthy of more detailed analysis and hypothesis generation are not typically a feature of commonly available neuroimaging data archives.
Traditional vs. Exploratory Data Analysis
To look across datasets contained in a neuroimaging archive requires a different way of thinking than might be normally approached in a typical “within study” analyses. In the majority of magnetic resonance imaging (MRI) brain imaging studies, for instance, the data is gathered across subjects using well-defined clinical or research study protocols with commonly applied data acquisition protocols. The principle investigator analyses the acquired data to test specific driving hypotheses asked before the data was collected. Such analyses often involve within and between groups comparisons of brain anatomy or function, or correlations of specific brain morphometry or time course of activity with clinical or outcome metrics. These often employ the use of traditional inferential statistical tests (e.g., the general linear model, Student’s t-tests, ANOVA, etc.) to reach conclusions about their probabilistic significance. Unfortunately these require investigators to spend considerable time assessing data sets, even if they are only of modest size.
However, the exploration and mining of data from across multiple, non-related studies contained in a large-scale database requires a different approach. Rather than focus on one particular measure of interest, one often computes a family of useful descriptive feature metrics and examines relationships among these metrics taken individually or collectively to identify interesting trends, clusters, or gradients across the collections of multiple subjects. These may be as simple as examining histograms for every measurement, plotting variables against one another, or performing more sophisticated dimension reduction operations to find combinations of useful metrics. In so doing, an investigator seeks to explore the data and get a sense of the underlying relationships present to guide and inform subsequent formal statistical analysis. Termed “exploratory data analysis,” these approaches were championed by Tukey (1977) and seek to help a researcher better understand his own data in addition to being insightful for understanding the data of others (see also Velleman and Hoaglin, 1981).
Exploratory methods have been widely applied in all aspects of science, most notably in genetics (Teo, 2010), high-dimensional molecular biological data (Wu, 2010), and electrophysiological data (Harner, 2009). In contrast to the immediate application of a rigorous and detailed statistical model to the data, one employs exploratory approaches to allow the data to “explain itself” by using a collection of relatively easy to understand metrics and to look for patterns across study data sets which would not have been obvious when any data set was considered in isolation.
Importantly, exploratory approaches are conducted not to arrive at some level of statistical significance of some specific within- or between-group difference, but to provide a picture of trends, clusters, and other factors contained in the data, which, in many instances, may not be approachable through full inferential modeling. Put another way, exploratory approaches are not meant for the generation of significant p-values but, rather, the generation of hypotheses worthy of future significance testing. With the growth and storage of increasing amounts of data anticipated from manual and automated data capture approaches, exploratory approaches for data mining take on a particular importance for users of large-scale archives to quickly survey database contents, identify interesting avenues for further examination, and, moreover, do so in an interesting and compelling way.
Visual Interaction with Large-Scale Data
The graphical placement of spatially based data to illustrate, represent, and highlight relationships in desktop computer and mobile device applications is now so pervasive that it is hard to imagine the time before these tools became part of our everyday lives. Google Maps1 and Google Earth2 integrate road, terrain, and satellite mapping data into easy to use navigation tools upon which layers of additional, contextual information can be superimposed. Other freely available tools such as Microsoft’s Worldwide Telescope3 seamlessly stitch together images obtained from ground- and space-based telescopes and present them in a graphical framework enabling fluid inspection of individual stars, nebulae, and constellations by expert as well as armchair astronomers. In each of these examples, users need only know how to use a computer mouse (or their finger tip!) in order to interact with the software.
Despite the growing richness of neuroimaging databases, similar graphical tools for rendering and representing database contents in a user-friendly manner do not widely exist. In many instances, graphical systems for plotting measures derived from neuroimaging data are simply the creation of 2D scatterplots in Microsoft Excel4 or Matlab (Mathworks, Inc.) or, perhaps, as advanced as the identification of normalized Talairach/Montreal Neurological Institute (MNI) coordinates and representing the metric of interest as a color mapped point at relevant brain loci and accumulating a distribution of such points across subjects. Yet, while plotting hundreds of brains as individual points in a scatter plot helps tell a story, there is an inherent appeal for the examination of brain surfaces and the mapping of metric intensities on the cortical surface – much in the same sense as the rendering of satellite imagery on a synthetic globe. Moreover, ease of interactivity is also appealing. Simple user inputs result in dynamic and fluid control of the entire collection of data. Several prominent and useful surface modeling tools do exist which compute and display cortical surface models and allow the user to interact with them individually (e.g., FreeSurfer; BrainSuite; Brain Voyager; Brain Browser). However, these tools are not specifically designed to display more than one subject’s surface models at a time, nor do they allow one to represent the similarity between 3D brain surfaces in any sort of derived data space. In such a multi-dimensional spatial arrangement, for instance, similar data might be clustered based upon cortical metric attributes thereby allowing for at least a gross description of subject-to-subject similarity and meta-data-based dissimilarity between clusters. Moreover, any spatial configuration of brain surface information could be done arbitrarily into any framework one might imagine to emphasize trends in the data (e.g., as positions on a plane, on a sphere, a torus, or any other non-Cartesian coordinate system). From these arrangements, basic data mining and additional graphing tools can help users generate new hypotheses about the uniqueness of sub-clusters of similar brains, or that some continuum exists across disease classifications relative to some particular sub-set of morphometric measurements. Better still, if the interaction with potentially thousands of brain surfaces simultaneously requires only a click and a drag of the mouse, the user’s experience will be heightened and ideas can flow more easily.
A Graphical Interface for Exploration of Neuroimaging Data Archives
Therefore, as neuroimaging archives become richer through the use of automated data capture techniques, an important challenge exists for creating new tools that enable database users to inspect, explore, and interact with their contents. Automated computation of basic metrics is possible, but how those neuroimaging metrics can be used to inform a novel and innovative platform for user interaction and data mining has yet to be investigated in earnest.
This is the essence of the informatics visualization for neuroimaging (INVIZIAN) project based at the Laboratory of Neuro Imaging (LONI), UCLA. Our project is specifically geared toward the creation of a user-based framework for the dynamic and interactive exploration, examination, and mining of data contained in large-scale neuroimaging repositories. The repositories might represent data collected from multi-site collaborations, or individual laboratories.
In this paper we present the details of the INVIZIAN program. At its heart, INVIZIAN is an interactive graphically driven framework for dynamic grouping and classification. We illustrate the example in which each individual dataset is positioned in 3D with placement that describes feature similarity – a so-called feature similarity space (FSS). Through query result interaction, the user can create groups of data that maximize feature-attribute relatedness according to their proximity and meta-data characteristics and display the findings in real-time. By conducting feature- and meta-data driven mining of assigned groups using data brushing, parallel coordinates, and other exploratory approaches, the user is able to easily and rapidly visualize underlying relationships within groups and how these factors contribute to group differences. With this knowledge and insight, the user might then access the database and download the relevant raw data to perform a more rigorous analysis using widely available neuroimaging data analysis toolsets (e.g., FSL, AFNI, FreeSurfer, etc.). As schematic of the guiding principles underlying our INVIZIAN framework are depicted in Figure 1.
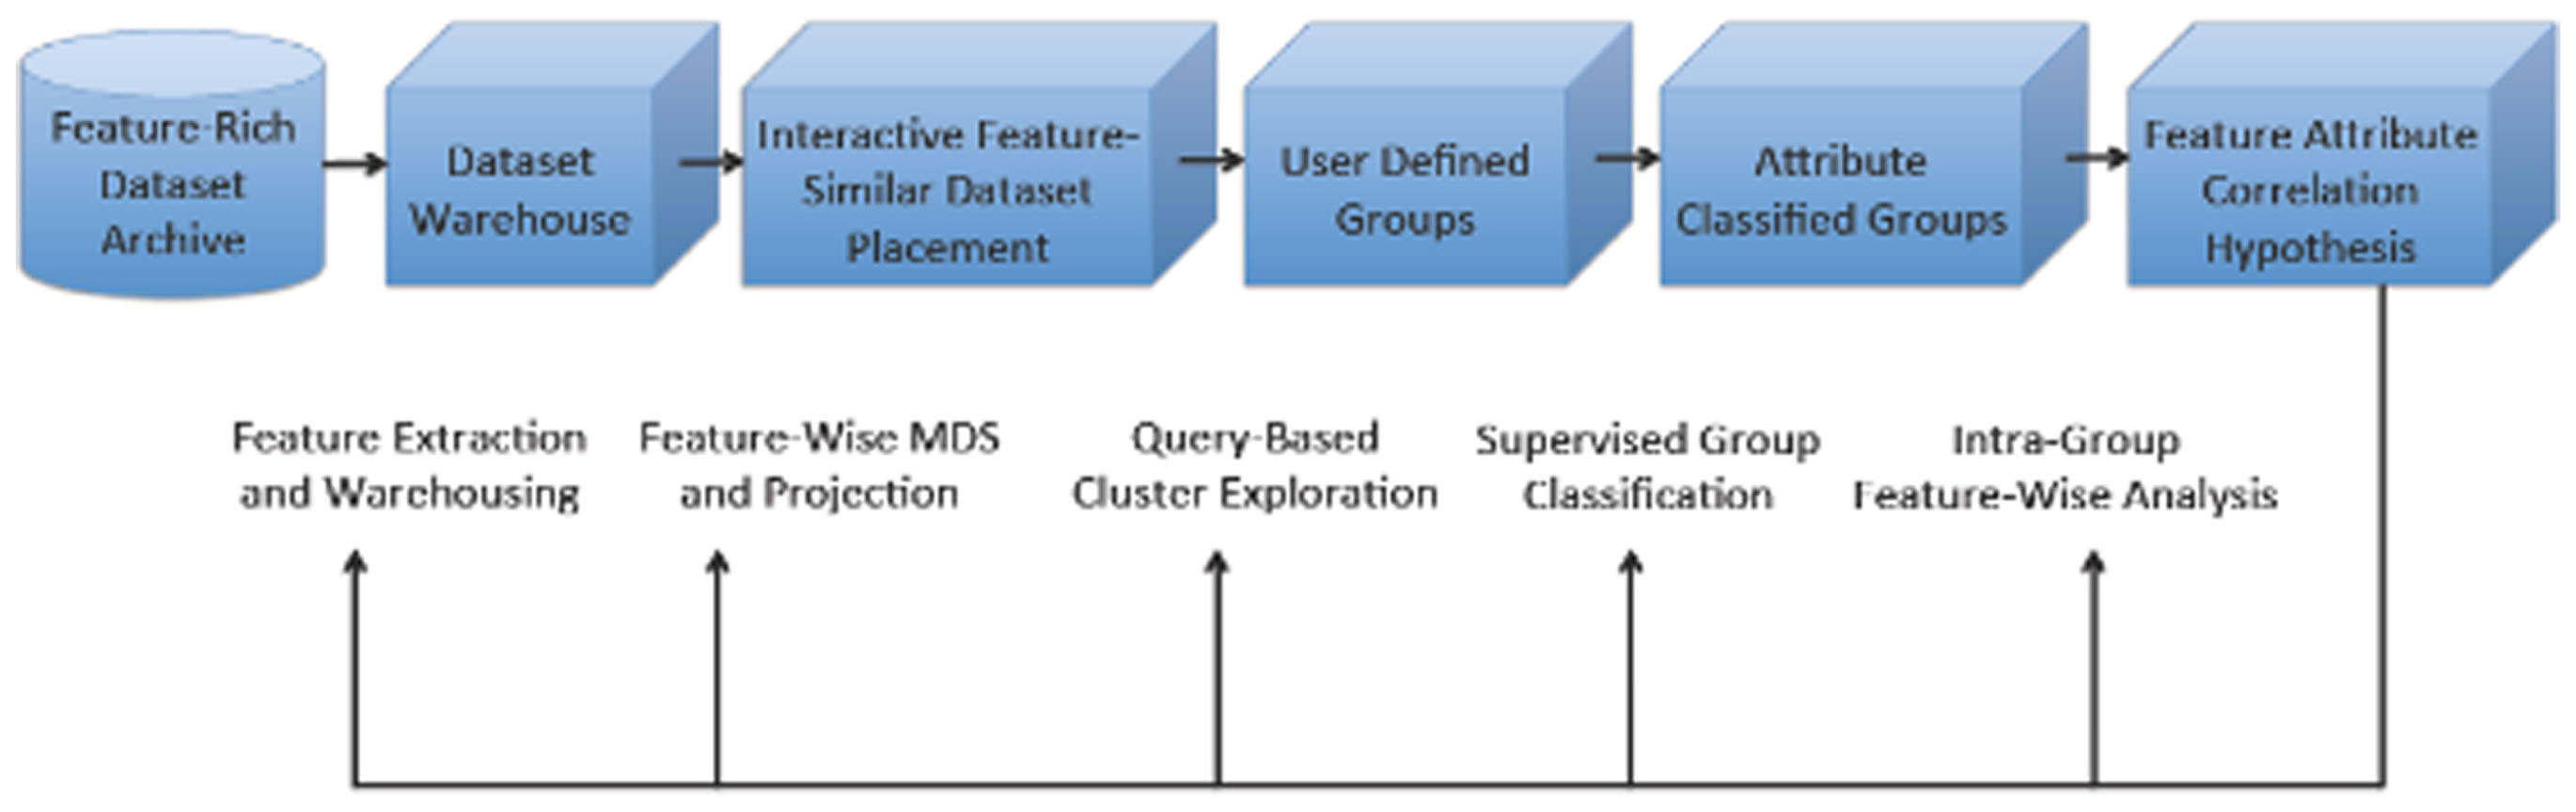
Figure 1. Overview of the INVIZIAN system framework and data workflow. Given the contents of an anatomical neuroimaging database, multi-dimensional scaling (or other data reduction method) determines the placement of extracted brain surfaces in the INVIZIAN 3D environment. The user can dynamically interact with the elements in this space, search over meta-data features, select one or more brain surfaces, and add them to groups which may be assessed with respect to one another to generate hypotheses worthy of new experimentation. This process enables the user to rapidly explore and mine large collections of neuroimaging data for identifying interesting trends across features and attributes.
The relevance of this work in the context of neuroimaging data capture and its applications are as follows: (i) we review the rationale and techniques for exploratory analysis and data mining and a means for maximally extractive processing of the gathered neuroimaging data to prepare it for visual analysis; (ii) we showcase the interactive INVIZIAN visualization system which provides expert and novice neuroscientists with the means to easily explore the feature and structure of neuroimaging data; (iii) we demonstrate the application of the INVIZIAN environment toward visual analysis of individual MRI images from healthy as well as non-healthy patients to illustrate exploration of structural relatedness between a large cohort of subjects; and (iv) we present interactive visual data mining techniques for discovering the trends between neuroanatomical features and subject meta-data attributes. The final section concludes the paper with proposals of future work serving to support neuroimaging data sharing, mining, and graphically driven exploration as a precursor to more formal data processing.
Exploratory Analysis and Data Mining of Image-Based Data
Data mining and knowledge discovery within a collection of multi-dimensional heterogeneous neuroimaging archives is a process that encompasses work from many techniques. Traditionally for non-MRI data, such as photograph repositories, several approaches have used basis functions such as wavelets (Unser and Albroubi, 1996; Daubechies, 2004) to represent images. These wavelet bases can be truncated for a compact representation that preserves scale, frequency, and spatial information. A different approach is followed by Lowe (2004), where instead of using image intensities directly, a scale invariant feature transform is computed on the gradient of the image and used to construct a list of pertinent features for image characterization. These features are dependent upon the edges or maximum intensity changes in an image, and can be subsequently used for either segmentation of regions of interest (Fussenegger et al., 2004) or registration (Ke and Sukthankar, 2004) across datasets. We term the above methods as subject-specific approaches. Where feature extraction and representation is unique and wholly dependent upon a single image belonging to each subject. Alternately, population-level approaches exist that seek to find underlying discriminative patterns between two or more groups of subjects. For example, Turk and Pentland (1990) attempt to compact available image features using a maximum variance separation criterion. The work by Martinez and Kak (2001) minimizes a discriminant function on the set of all image observations, and finds a linear basis for projecting the observations in a discriminative space. For 3D anatomical images, we can use wavelet-based approaches (Unser and Albroubi, 1996) for feature extraction. However 3D data is more complex, and the definition of edges is cumbersome. Thus even if we can compute bases and image transforms on 3D intensities, they are not straightforward to interpret. Moreover, the data is high-dimensional and we need efficient tools for image processing. Therefore researchers have defined methods for extracting geometrical objects from images in the form of surfaces. For example, Thompson et al. (2001) extract gray matter pial regions from 3D brain images, and construct cortical surface representations for analysis. Cortical surfaces are compact representations of outer gray matter anatomy, enabling calculation of feature-rich data values.
Dimension reduction is an important component of data mining. It consists of a class of techniques that attempt to minimize information loss while reducing structural complexity. While non-linear approaches are available (e.g., ISOMAP; Tenenbaum et al., 2000), many depend upon linear models. Multi-dimensional scaling (MDS; Beals et al., 1968; Kruskal and Wish, 1978) is a strategy that aims to replicate the similarity between data in its native configuration using a lower dimensional representation (Chen et al., 2008). It minimizes the variance of the pairwise dissimilarities, such that the projected data in the lower dimensional space conserves the distances in the original higher dimensional space. Principal Component Analysis PCA (Martinez and Kak, 2001; Xu and King, 2001) transforms the data to a reduced principle component representation using a set of orthogonal vectors that retain most of the variance in the original data. Kohonen’s (1998) Self Organizing Maps represents a type of artificial neural network that produces a topology preserving 2D representation of the input data. Support vector machines (Abe, 2010) also provide a convenient means for identifying basic dimensions that separate two or more groups.
The dimension reduction process can be made more intuitive by including an interactive component with the calculations. For example, an MDS approach proposed by Williams and Munzner (2004) enables a user to iteratively reduce the dimensionality of data, while targeting reduction computation toward regions of interest. Visual hierarchical dimension reduction (Yang et al., 2003a) constructs and arranges dimensions into a hierarchy, presented as a radial interface facilitating user exploration of dimensional configuration. Interactive Hierarchical Dimension Ordering, Spacing, and Filtering (Yang et al., 2003b) extends the idea by adding automated components that attempt to identify lower dimensional sub-space structure. Johansson and Johansson (2009) propose an interactive dimension reduction system driven by user-defined quality metrics. Dimension reduction can lead to information loss, but in Johansson’s interactive system the user controls what dimensions are important by appropriately weighting correlation, clustering, and outlier significance. Once the user assigns weights and a dimensionality threshold, the framework provides a graph illustrating information loss per variable reduced. This framework can be further enhanced by a query-based visualization, as the one that facilitates dynamic and guided visualization toward data deemed compelling by user query–result interaction. Previously, a query-based approach has been presented in VisDB (Keim and Kriegel, 1994). In their article, the authors build a multi-dimensional view of a relational database repository. They define type-specific distance metrics which are employed against all data to rank relevance to each user query. Feedback is presented as a pixel map, with a carefully chosen color scheme depicting distance of query result from significant near matches. For instance, Scout (McCormick et al., 2004) is a data-parallel programming language for graphics processors which hides the nuances of both the underlying hardware and supporting graphics software layers. In addition to general-purpose programming constructs, the language provides extensions for scientific visualization operations that support the exploration of existing or computed data sets. Scout takes advantage of GPU hardware acceleration to enable the guidance of visualization processing via mathematical evaluation. This system is interfaced through a custom programmable API that manipulates pixel parameters during visualization of the data. Finally, a more recent query-driven system was proposed by Gosink et al. (2011) which employs multivariate analysis to visually describe areas of importance to the user while performing visualization on a single large scientific dataset. Users interact with the query solution space to identify statistically interesting combined parameter values. However, this approach is limited to the consideration of only a single dataset at a time (multimodal images of gas combustion in their example) and is not likely suitable for collections of 3D anatomical neuroimaging volumes or cortical surface representations.
Therefore, data mining and dimension reduction approaches are particularly compelling frameworks for the representation and examination of large-scale data archives. Coupled with accelerated computer graphics and an interactive display, they provide a novel way to rapidly identify patterns in brain imaging archives which may lead to new ideas for formal data processing and even the collection of additional empirical data. We sought to leverage these concepts toward a novel graphical “environment” for exploratory neuroimaging informatics.
The Informatics Visualization in Neuroimaging System
Informatics visualization for neuroimaging was specifically designed for graphical data exploration and mining applied to large-scale neuroimaging data repositories. An easy to use graphical user interface, mouse-driven interactivity, a compelling visual display, and a satisfying overall experience for the user were considered essential features.
The simplicity of the INVIZIAN interface is in noticeable contrast to the complexity of the data it seeks to present. Moreover, mouse-based user inputs and minimal need for typing were also important consideration. Google Earth and similar programs rely on the display of rich graphical information yet user interaction revolves around the most basic of modern computer inputs: single/double clicking, dragging, scrolling, etc. Typing is minimized and, often unneeded. Excessive sets of controls, dials, sliders, and input boxes are not present or, for those that do exist, they may be easily hidden. A user-configurable skybox background (see, for example, the back ground of Figures 5 and 6) aids with the perception of depth, distance, and relative motion of brain surfaces as the user dynamically moves around in the INVIZIAN environment – a visual effect which is particularly impressive when viewed in a large-format video display. This basic philosophy was the guiding principle for developing all aspects of INVIZIAN’s design and implementation.
Developed in C++, INVIZIAN utilizes the Qt™ application and UI framework5. Qt’s numerous UI libraries enable quick prototyping of new widgets and other visual interfaces. Qt’s OpenGL support is extensive, encapsulating much version specific API usage, such as off-screen rendering. Qt’s cross-platform support encapsulates all of the operating system specific calls within INVIZIAN, such as obtaining the user’s home directory or window environment configuration. Additionally, Qt contains generalized APIs for direct interaction with a database, which is useful for supporting queries of subject meta-data under INVIZIAN. The implementation of the meta-data search interface is simplified significantly through the use of SQLite6. First, INVIZIAN parses all subject meta-data (itself stored as a set of subject-specific xml files under its current implementation) into an internal SQLite table. During runtime, INVIZIAN can retrieve user-specified Boolean queries and check them against the meta-data SQL tables for matches. The results of the matching list then drive the graphical highlighting of matching surfaces as displayed to the user using Qt in the INVIZIAN interface.
Viewing surface mesh objects represents the majority of the interaction within the INVIZIAN application. Managing such large amounts of shared memory is a complex undertaking however, and for this purpose we take advantage of the Boost C++ Libraries. Specifically INVIZIAN uses the Boost smart pointer library7 to manage surface mesh reference counts and perform shared object instantiation and deletion.
Lastly, the backend data mining analytics and plotting within INVIZIAN are carried out using R (R Development Core Team, 2011) and GGobi (Cook and Swayne, 2007). Custom R scripts draw from and populate data frames from the meta-data SQL table thereby making them available for examination using any relevant inferential statistical test and, should the user require, the determination of p-values of observed group differences, etc. Using other R implementations facilitated by the RGGobi package (Wickham et al., 2008) it is possible to launch the GGobi interface with values from the data frame. GGobi then presents summaries of the derived metric data to the user via a series of plots that build upon the coordinated view provided through INVIZIAN navigation. Indeed, any statistical test or probability value generated by R can be captured and, in principle, displayed back to the user via GGobi through the INVIZIAN interface. What is more, user inputs from within INVIZIAN are immediately updated on the GGobi plots and vice versa to provide interactive data brushing.
To illustrate what cannot be properly appreciated in the format of a printed journal article, we provide a movie featuring the use, functionality, and interactivity of INVIZIAN as part of our Supplementary Material. A beta Linux package of INVIZIAN is currently available8 under the LONI software license9. The official INVIZIAN release date is set for the second half of 2012, at which point we will provide installable packages for the Linux, Windows, and Macintosh platforms. More information is available on our NITRC project site10.
Example Neuroimaging Data Sets and Pre-Processing Steps
To illustrate its use for dynamic interaction with large neuroimaging data, we demonstrate the application of INVIZIAN for rendering an archive of T1-anatomical MRI image volumes, collected from diverse clinical neuroimaging studies contained in the image and data archive (IDA)11 based at the LONI at UCLA. Our collection of image volumes was comprised of a sample of N = 874 subjects from the Alzheimer’s Disease Neuroimaging Initiative (ADNI; Jack et al., 2008), Australian Imaging Biomarkers and Lifestyle (AIBL) project (Ellis et al., 2009), and the Cognitive Neurophenomics Project (CNP; Bilder et al., 2009) datasets. Broadly, they consisted of 384 ADNI, 236 AIBL, and 118 CNP subjects. The ADNI study consisted of 91 Alzheimer’s (AD) patients, 194 subjects showing mild cognitive impairment (MCI), and 99 healthy controls (NC), 158 M/226 F having mean ± SD age of 74.99 ± 7.07 years. The choice of data sets which contain AD subjects was chosen specifically to illustrate an example where clusters and differences in brain morphometry would be readily apparent. We could have easily selected alternative data sets or included additional datasets where these differences were less prominent. However, as detailed below, all data were processed similarly and, thus, not explicitly according to the study, experimental group, or other particular meta-data feature. Finally, we note that as the amount of data loaded into the system is increased, INVIZIAN maintains interactivity by utilizing multiple resolution surface meshes, limited only by the memory capacity of the user’s system.
For all data processing steps, we utilized LONI Pipeline (Dinov et al., 2009, 2010) for segmentation and registration of the input MRI image volume data. This grid-based solution provides validation and distribution of new computational tools, and an intuitive graphical interface for developing and executing parallel volumetric processing software. Specifically, our processing employed the brain extraction tool (BET; Smith, 2002) tool for skull stripping MRI images in our workflow. All image volumes in the database were registered (Woods et al., 1998) to a standard MNI atlas image. The resulting gray/white matter images were then processed in parallel using FreeSurfer (Dale et al., 1999) to extract (i) the cortical (gray/CSF boundary) surface, and (ii) 34 sub-cortical features such as the major gyri, hippocampus, and the putamen. Freesurfer is a highly useful and widely available tool for cortical surface generation and partitioning which has recently been shown to perform very well in the consideration of ADNI data sets (Desikan et al., 2010). This process resulted in a geometrical representation stored in the form of a triangular mesh file format. While other partitioning schemes and methods exist (Tu et al., 2008, for instance), the choice of which may affect results, FreeSurfer provides a well-defined brain segmentation upon which region-specific morphometry can be performed.
Several volumetric measurements such as gray matter thickness, volume, and surface area were computed on the processed data. Gray matter thickness was computed as the mean distance from the gray matter/cerebrospinal fluid interface to the gray/white matter surface, and vice versa. Gray matter volume was calculated as the product of the thickness and the area of the surface layer midway between the gray/CSF and white/gray matter boundaries. Additionally, a mean area measure was calculated at each point on the cortical surface by averaging the areas of triangles including that point. Along with the gray matter features calculated over the whole pial surface, we also obtain 34 regional cortical parcelations according to the Desikan–Killiany atlas (Desikan et al., 2010). Lastly, each subject image within the archive was accompanied by a file containing subject attribute data. The image processing, segmentation, and extraction utilities were exported through the LONI Pipeline. The surfaces, their parcelations, and the calculated feature values along with the subject meta-data are stored as described above.
For examination of brain-to-brain similarity, we use the approach introduced by Joshi et al. (2009, 2011) which calculates distribution functions of feature values taken over the cortex. Briefly, a kernel density estimation technique (Botev et al., 2010) is used to construct a non-parametric functional representation of feature functions and is implemented as follows:
For a total of N parcelated regions, let each parcelation be denoted by Xi:u ⊂ ℝ2 → ℝ3, i = 1,… N. A given cortical feature is then represented by a mapping . For example, if represents the projected cortical thickness for region i, it assumes all permissible values from roughly 0.5 to 4.5 mm. Next, we calculate the relative frequencies of the observed feature and reduce the 2D variation of the cortical attribute to a univariate quantity. From this frequency distribution, we then estimate a probability density function in a non-parametric manner using kernel density estimation. Thus for a single individual cortex, the set pi:[a, b] → ℝ, i = 1,… N represents the univariate cortical patterns of the feature distribution. Here the interval [a, b] is the range of allowable values associated with the attribute. So, rather than recording exact regional values, the representations describe region-specific structural patterns. For each feature, the nominal values are reduced to a univariate representation by calculating the value frequencies. Finally, a non-parametric probability distribution for the feature is derived for each region. They serve as compact representations of feature values over the whole-brain.
Pairwise Cortical Similarity Measured Using Jensen–Shannon Divergence
The first step in MDS is the creation of a pairwise distance matrix between the feature values of each subject image. Distance measurements can be Euclidean, angular, multivariate, etc. In our case, following Joshi et al. (2011) we employ the Jensen–Shannon divergence (Lin, 1991) as a choice of distance metric between distribution functions. The following subsection provides the details of this metric. The Jensen–Shannon divergence is a symmetric formulation of the Kullback–Leibler divergence, and is defined as
Here the quantity KL is the Kullback–Leibler divergence, and is given by
The term is simply the average of pk, and pm. The JS divergence however is not a true metric since it does not satisfy the triangle inequality. The distance between two cortical patterns is then defined as follows. Given two pairs of feature functions, the distance between patterns i, and j is given by, Here wk are the weights assigned to each divergence, and can be either optimized or adjusted according to prior information. It is not unusual to assume all weights are equal to unity.
Multi-dimensional scaling decomposition of the distance matrix results in a set of orthogonal coordinate sets, which help to reduce or explain the original dimensionality of the matrix in a smaller sub-space. The number of non-zero eigenvalues of the matrix will be at most N−1, whereas the minimum number will be a function of the relative distances and clustering of the entries. MDS is particularly useful in this case since brains which are most similar will lay close to each other in the derived spatial configuration, whereas brains which are most dissimilar will be positioned far apart. This has a natural and intuitive quality, which users can immediately appreciate and understand in the context of the INVIZIAN interface.
In the example presented here, we employ MDS to generate a feature descriptive view of MRI datasets in an interactive 3D environment. We stress that we could have chosen any other approach to creating a coordinate system (PCA, ICA, etc.) and point out that INVIZIAN is, in fact, coordinate system agnostic in so far as being able to contain any spatial configuration of brain surfaces within its 3D environment. Of note, we have experimented with planar, helical, spherical, and toroidal arrangements of brain surfaces as well as examined support vector machines (SVM; see Filipovych and Davatzikos, 2011 for recent applications in brain image classification) wherein each has its own unique ability for depicting univariate or multivariate cortical similarity. Indeed, users may easily switch between these configurations in the INVIZIAN program interface as well as import their own spatial coordinate systems.
Example Large-Scale Data Exploration with Invizian
After the MDS (or other suitable coordinate generation process), the cortical surfaces for each subject are positioned at their respective locations in the interactive 3D INVIZIAN space (Figure 2, top). Using their computer’s mouse, the user may click and drag, therefore rotating the entire “cloud” of brain surfaces; zoom in on a particular brain surface or cluster of them (Figure 2, middle); click and select individual or multiple brain surfaces and rotate them independently of their neighbors. Employing a multi-resolution strategy, when an individual brain is selected, INVIZIAN seamlessly replaces the lower-resolution surface mesh with a high-resolution version (Figure 2, bottom). This automated swapping ensures that the navigable display of surface geometry is presented at interactive frame rates, while providing a high level of anatomical detail on demand. Currently we employ meshes with approximately 25,000 triangles for the low-resolution representations and 250,000 triangles for high-resolution models.
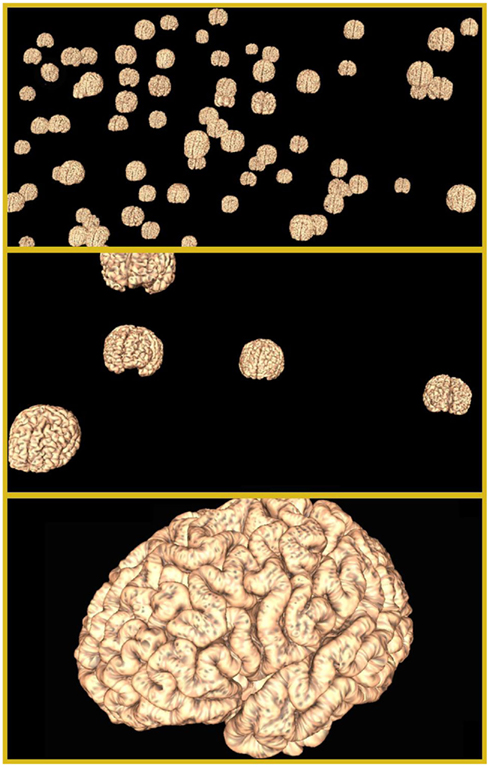
Figure 2. Informatics visualization for neuroimaging navigable graphical environment. INVIZIAN supports the loading of hundreds of MRI surfaces into its interactive graphical environment (top). The user is able to pan, rotate, and zoom in on the data collection (middle). For each surface, as the user zooms closer, higher resolution versions of the surface are seamlessly swapped in (bottom) to allow the viewing of finer detail while maintain smooth interactivity.
Interactive Grouping
The goal of INVIZIAN is to provide the user with a means for discovering relationships between neuroanatomical feature and meta-data attribute values. A major component of INVIZIAN for user interaction is the process by which users may perform query-based cluster identification. Users can create groups in multiple ways for subsequent summary and comparison against other groups (Figure 3).
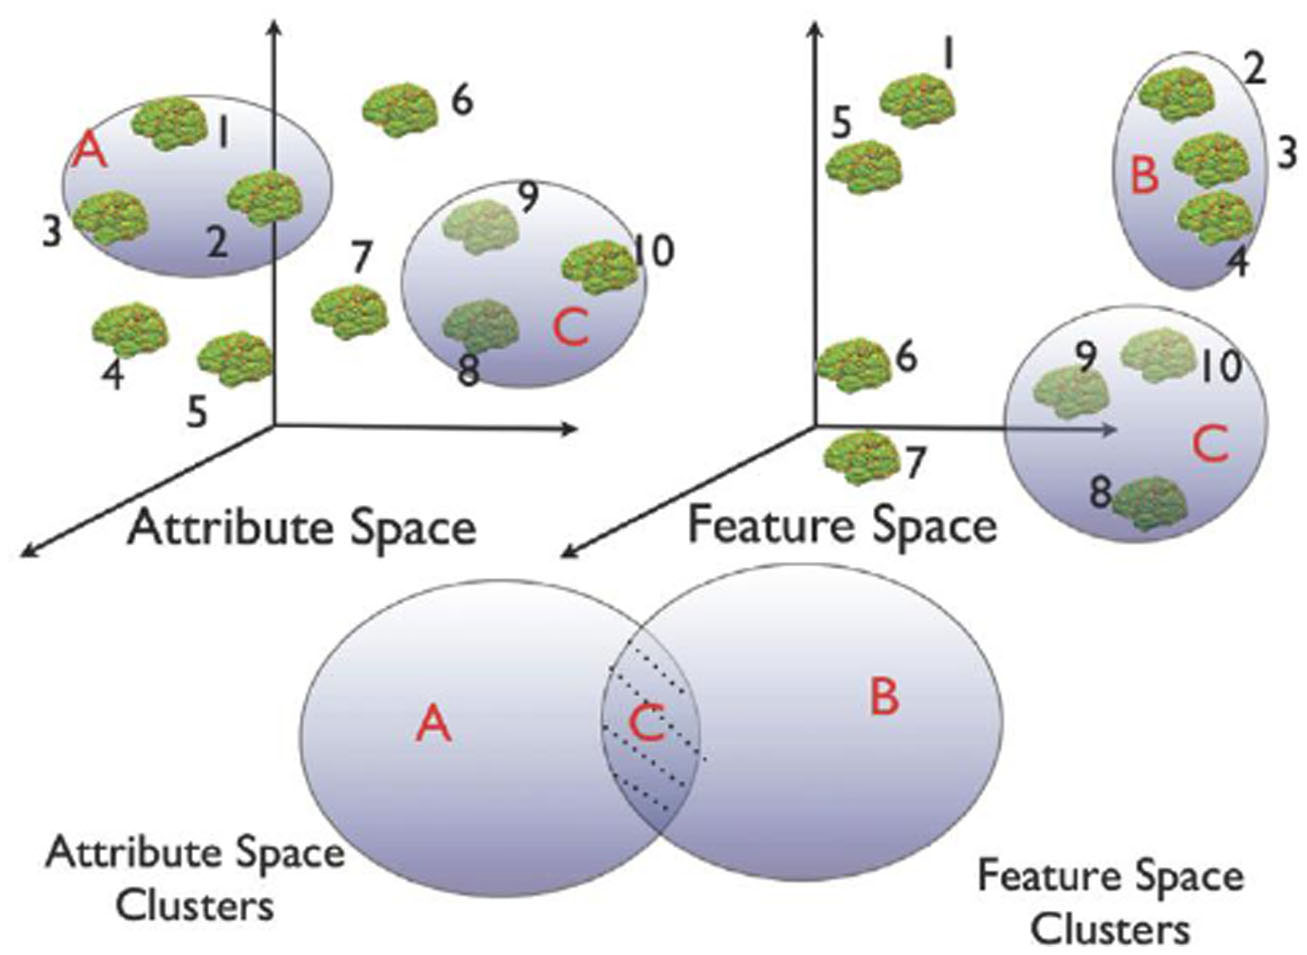
Figure 3. Schematic of the heterogeneous cluster discovery process. Discovering similarity relationships across heterogeneous data sets is similar to identifying clusters that occupy the shaded region of the Venn diagram. For instance, in this schematic example, only group C is clustered in both feature and attribute space.
As one method of group identification, the user provides a text-based meta-data attribute search via a query textbox. The immediate result is a set of brains highlighted with white “bubbles” around them illustrating the distribution of brains satisfying the query. INVIZIAN also supports refinement of the query for identifying data clusters that span both feature and attribute value types. The user may then assign a name and description to this group of brains and can select an arbitrary color to visually annotate the grouping. For instance, performing an initial query for subjects with a body weight heavier than 80 kg (Figure 4 Top) shows no obvious clusters suggesting that there is an association between brain morphometry and body weight. In contrast, by searching for “study identifier = CNP” (that is data obtained from the CNP based at UCLA), we note a distinct clustering within the upper-left-most grouping of data. Coloring by study reveals a partition of data in INVIZIAN according to which particularly study in the IDA database the data came from (Figure 4 Bottom). In this manner, users can explore the relationships between brain data sets, grouping them based on naturally occurring separations in the spatial coordinate system, meta-data values, or both. Other methods of group creation involve the multiple-selection of brain surfaces by simply clicking on them or clicking somewhere in the INVIZIAN environment and dragging a selection box around a cluster of brain surfaces. Indeed, all of these methods can be used interchangeably to create and modify groups of subjects that the user finds interesting.
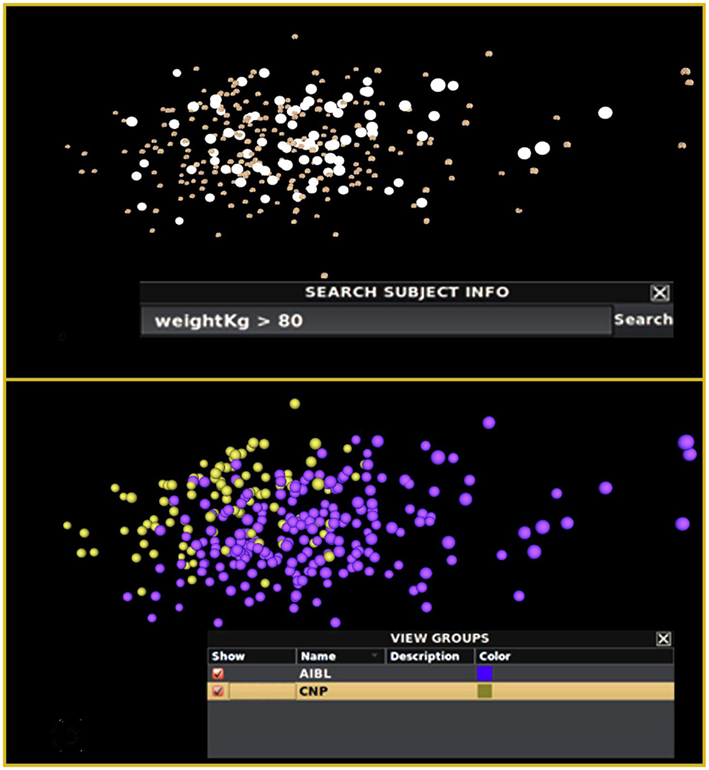
Figure 4. Query-driven heterogeneous cluster discovery. (Top) Conducting a search by subject weight does not reveal any particularly interesting clustering of the brain surfaces within INVIZIAN. Alternatively, querying by the imaging study identifier code from the meta-data reveals two slightly overlapping clusters (Bottom). The data can then be grouped and colored according to the result of the query, thereby storing this result for further inspection and comparison.
Application to Individual Brain Sub-Regions
When specifically investigating the AIBL and CNP study data, one might be primarily interested in identifying how hippocampal volume alone correlates with subject meta-data attribute values. The Jensen–Shannon divergence approach is employed using only the volume of the hippocampus as the lone input to populate the pairwise distance matrix. The MDS result obtained of this distance matrix is depicted in Figure 5 (top) where any particular clustering of the data is not immediately obvious. However, a slight rotation and zoom reveals that two distinct clusters exist (Figure 5, middle). After applying a query to the meta-data wherein we ask to highlight those subjects who are greater than 80 years old, we identify an apparent relationship between hippocampal volume and age (Figure 5, bottom).
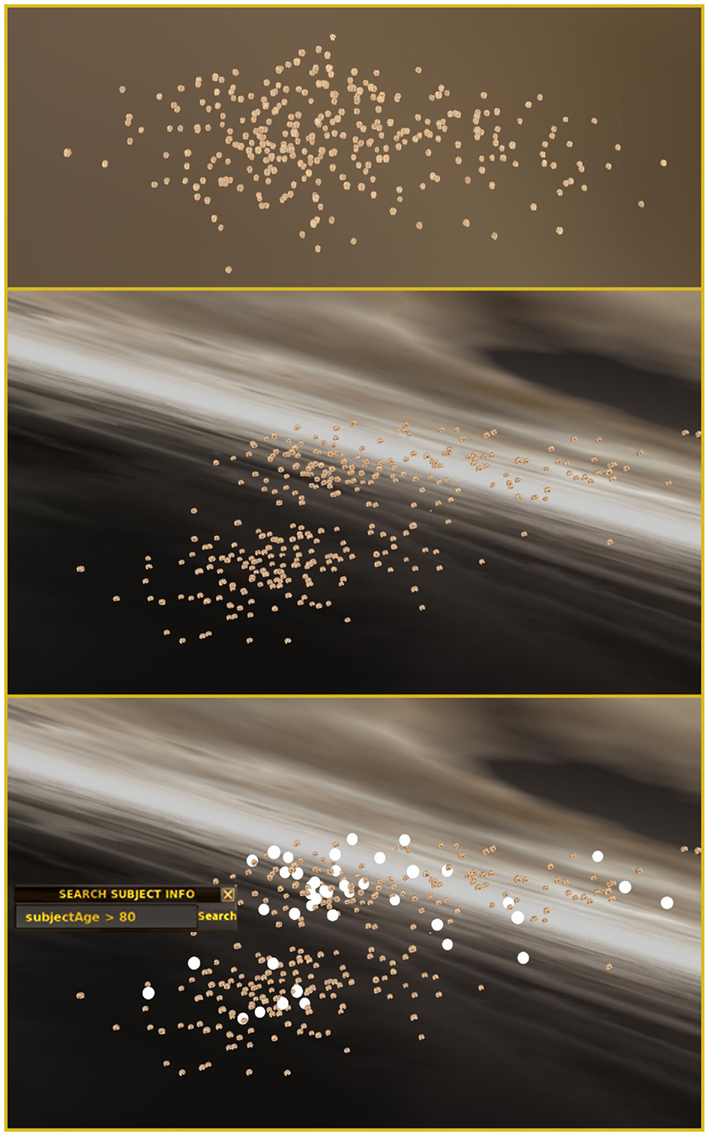
Figure 5. Query-based navigation across multiple studies contained in an archive. (Top) Certain views of the cloud of brain surfaces in INVIZIAN might not reveal any particular pattern. However, after rotating the data two distinct clusters of brain surfaces become visible (Middle). Additionally, executing a meta-data query, e.g., “Subject Age > 80,” reveals that there appears to be an age related component to the clustering (Bottom). A user-selectable skybox background aids with the perception of the 3D space, relative distance, depth, and motion as the user navigates in the INVIZIAN environment.
Interactive Graphing of Meta-data by Group and by Metric
While grouping feature-similar clusters of brain surfaces can be informative on its own, a more detailed examination of relationships between neuroanatomical feature values and meta-data attributes may still be warranted. For instance, as there appears to be a relationship between hippocampal volume and age, we can use feature-wise selection to create exclusive feature-similar groups out of the top and bottom clusters. This assignment is shown in Figure 6. To graph these relationships in other ways, INVIZIAN employs a number of graphical means for the plotting of cortical surface metrics by grouping. The Figure also displays a linked scatter plot (Figure 6, left insert) parallel coordinates plot (Figure 6, top insert), the data values painted by user assigned group color. Having additional graphical representations from within INVIZIAN helps to further illustrate that age does, at least partially, classify the two distinct groups of data by hippocampal volume. This helps to showcase the idea that INVIZIAN can be used for hypothesis generation, where it is easy to see how one can arrive at the testable statement that “The volume of the hippocampus varies inversely with age.” With this hypothesis in hand, the user can obtain the data directly from the IDA and perform their own individual data analysis.
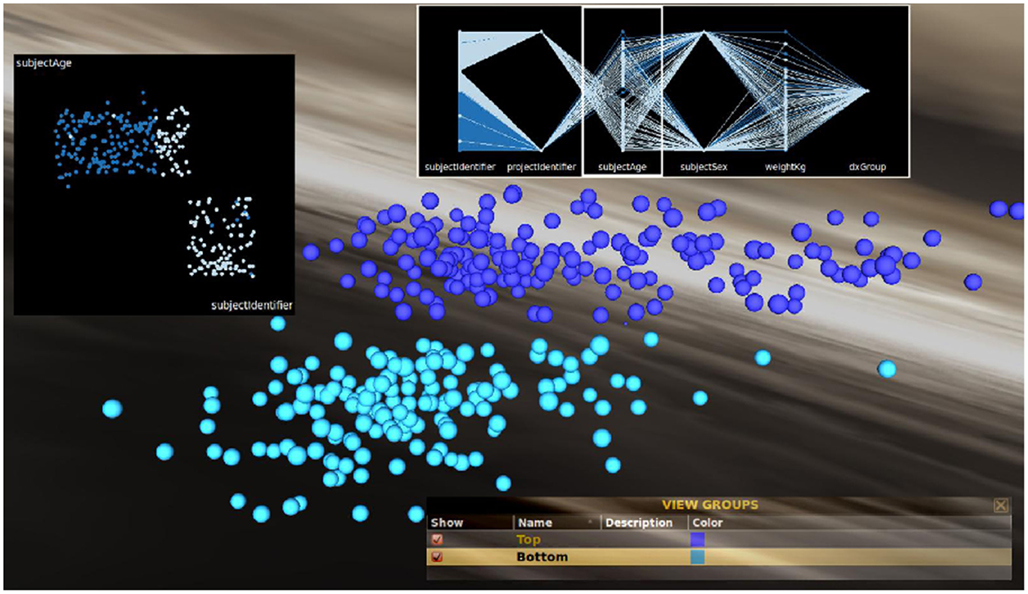
Figure 6. Grouping and classification of clusters based on feature similarity. Groups can be created based on feature similarity and then linked scatter (left inset) and parallel coordinates plots (upper insert) can be created within INVIZIAN to help to illustrate that, in this instance, there is a relationship of correspondence between hippocampal volume and age. The top cluster is made up almost exclusively of older subjects. The user-selectable skybox background provides helpful visual contrast for when groups of brain surfaces have been created and a color chosen for representing them.
Application to Reveal Whole-Brain Similarity Clustering
Instead of focusing on a specific region when investigating the ADNI data, we focus our exploration on the relationship between global gray matter thickness and meta-data values. Upon examination using both mouse-driven and query-driven interactions we identify a potential trend in these data involving subject diagnosis (Figure 7). Subjects diagnosed as “normal” tend to be clustered toward the bottom left of the collection of brain surfaces. Additionally, AD patients appear clustered toward the upper right. A Ggobi bar chart colored by group (Figure 7 inset) illustrates that groups appear to vary by diagnosis. Finally, isolating the superior frontal regions of each data set, a histogram plot of cortical thickness (Figure 8, left) shows that the group comprised of mostly healthy normal subjects exhibits greater thickness whereas the other group, comprised of AD subjects, has reduced cortical thickness.
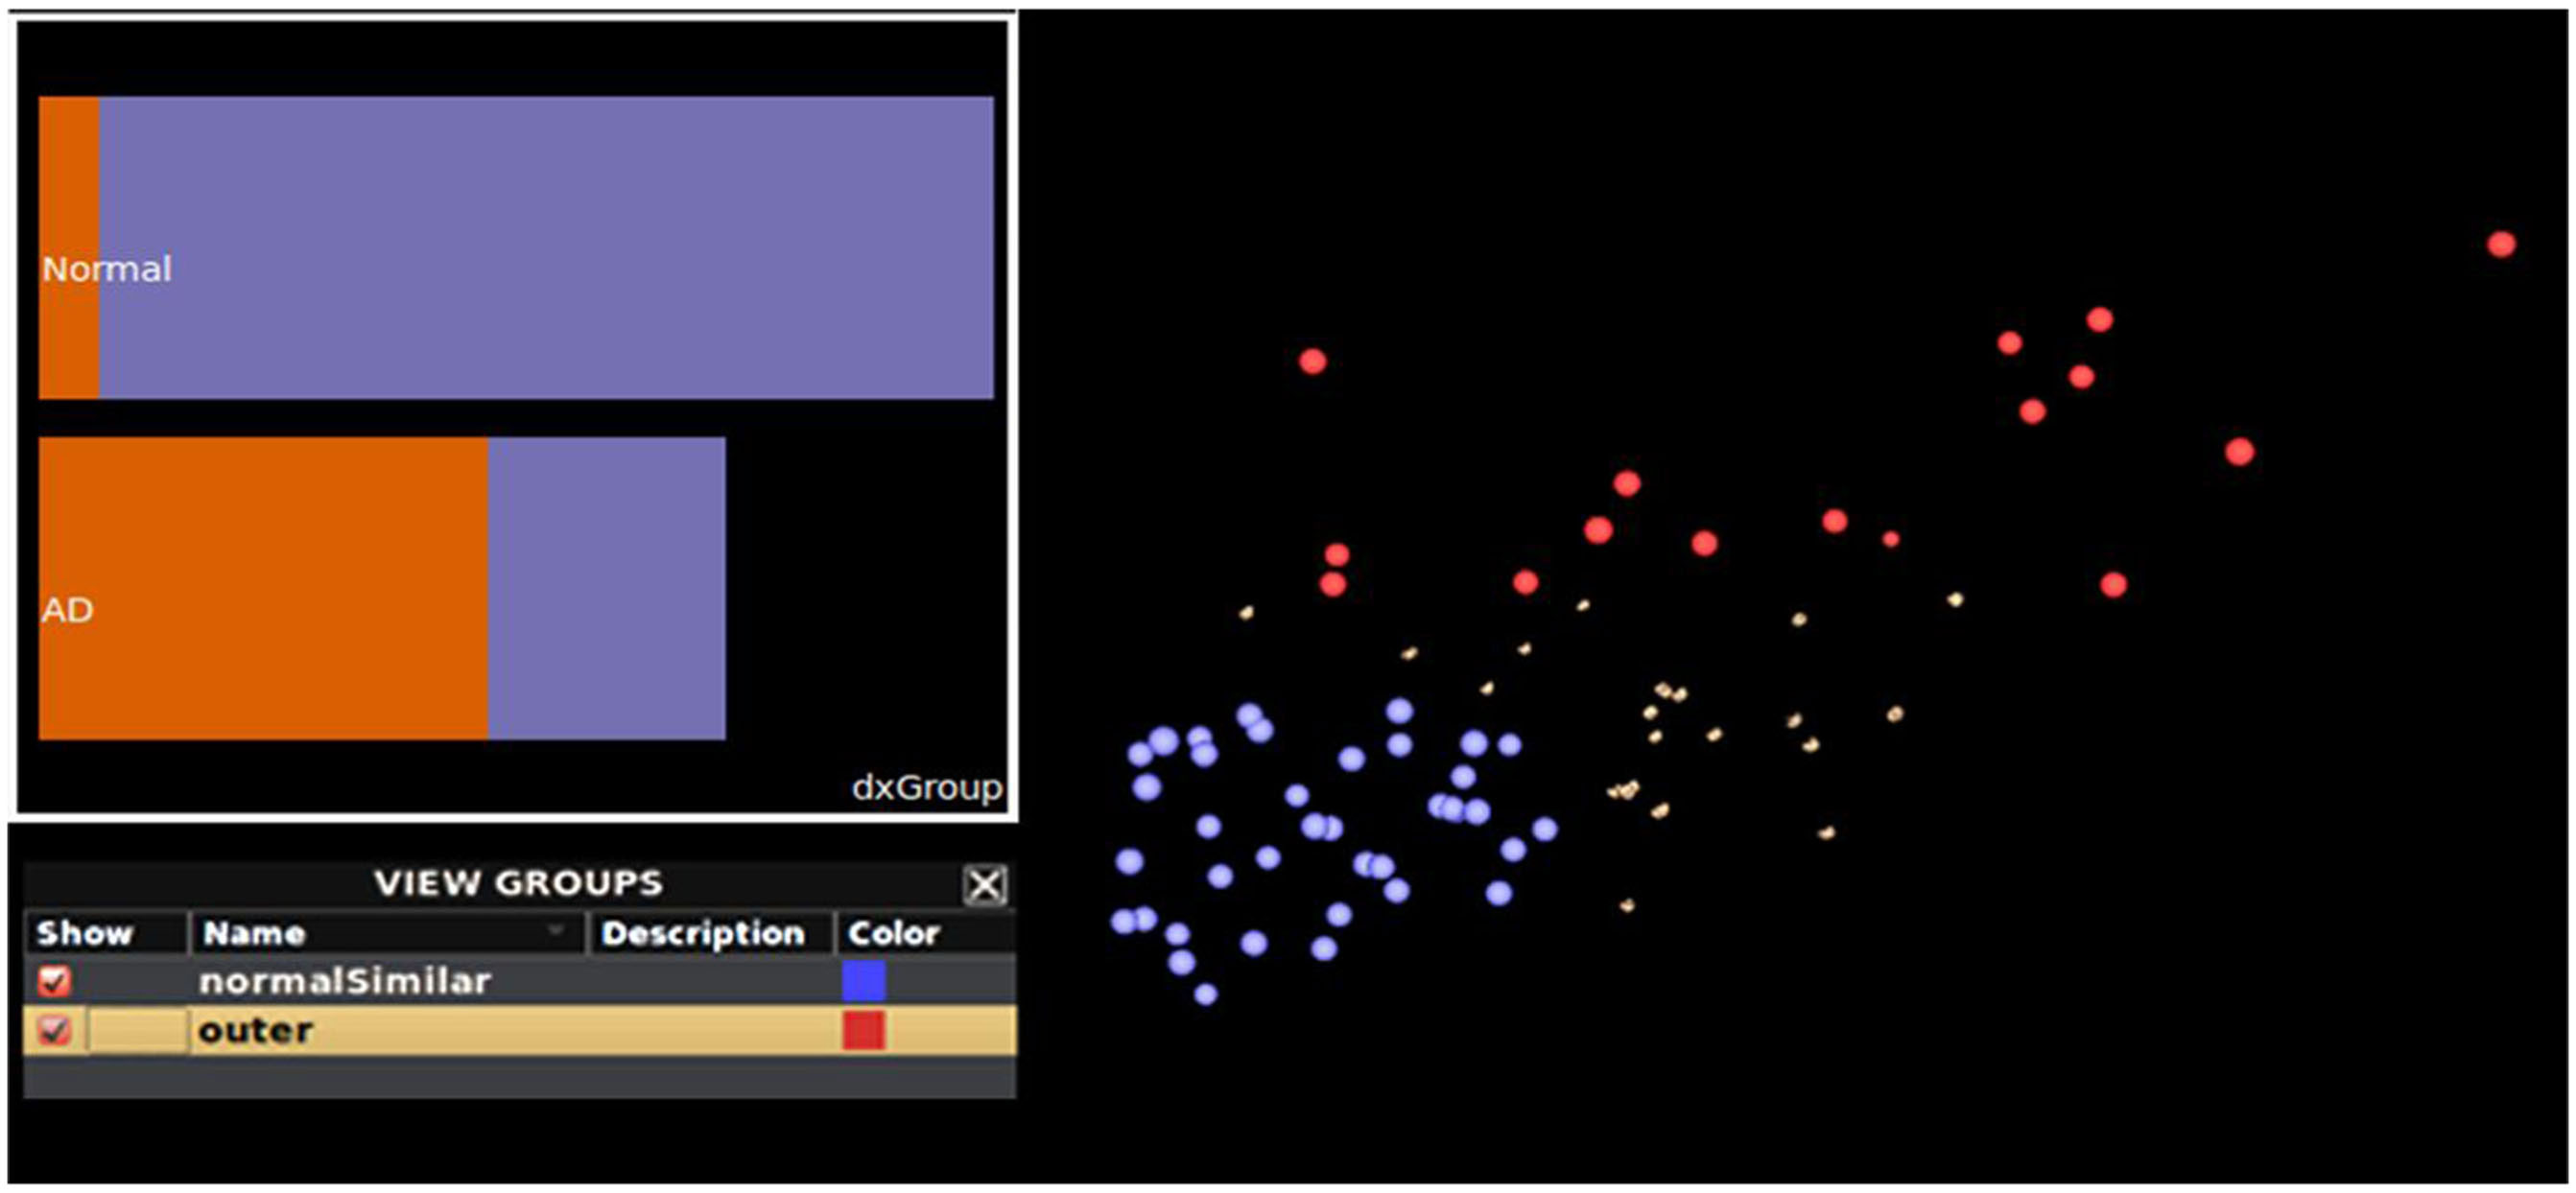
Figure 7. Additional interactive plotting functionality. A plot of the brain surfaces from subjects having similarly sized hippocampi and classified by their meta-data as being “normal” (blue) and subjects with Alzheimer’s disease (red). With these groups selected, a bar chart (inset) plots subject meta-data diagnosis value by feature value. Normal subjects are plotted as the top-most bar and the Alzheimer’s disease (“AD”) group is presented as the bottom-most bar. The length of each bar represents the total number of subjects per subject meta-data category. This helps to illustrate that the most of the normal subjects are members of the blue feature-similar cluster, and vice versa. This can be particularly helpful when examining and performing grouping operations on large collections of subject data.
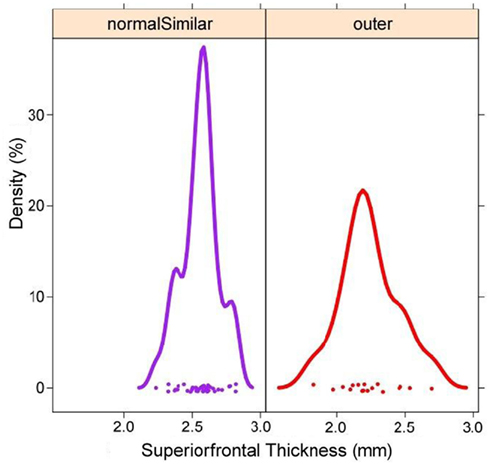
Figure 8. Brain region-specific exploration of the data using linked plots painted by user-defined group. Corresponding to the data represented in Figure 7, but focusing only on the superior frontal gyrus sub-volumes, histograms for the group consisting of mostly healthy subjects is given (left), while a red group is largely comprised of patients with Alzheimer’s Disease. Thus, from the examination of how brain morphometry clusters in a derived feature space explored using INVIZIAN, a user can quickly and interactively discover that normal subjects exhibits a larger mean thickness in frontal cortices than do patients. Such a hypothesis can be examined more closely by downloading the original data from the database or tested more precisely through the collection of new empirical brain imaging data.
This set of results is simply a convenient illustration of a well known neurological finding. Alzheimer’s Disease is characterized by cortical atrophy and thinning due to increases in beta-amyloid plaques and the build-up of tau proteins resulting in neuronal cell death (Cutler, 1988). The results shown in Figure 8 illustrates that cortical thickness is reduced in AD patients as compared to normal control subjects. While this is a frequent finding in AD (Thompson et al., 2004; Thompson and Apostolova, 2007; Dickerson et al., 2009; Querbes et al., 2009; Westlye et al., 2009) and, therefore, not entirely surprising nor a unique result under INVIZIAN. However, we highlight it here to illustrate the ability of INVIZIAN to identify this effect as an outcome of an uninformed exploratory vs. inferential statistical consideration. Further examination of cluster patterns may reveal even more subtle relationships worthy of more rigorous analysis or even new hypothesis-driven data collection. We also emphasize that while the presented example focuses on Alzheimer’s subjects, the proposed visual analysis can be applied to other types of neuroscientific clinical data as well.
In summary, by using INVIZIAN users can quickly and easily explore and interact with hundreds and even thousands of representations of brain imaging data from large-scale archives such as the LONI IDA and other resources. The example of healthy, AD, and MCI subjects used here, taken from across multiple neuroimaging project contained in the same large-scale archive, demonstrates the functionality of INVIZIAN. While the results depicted are not new or novel, they provide confirmation of well-reported effects and validation that INVIZIAN is able to illustrate these relationships using only an MDS-based approach. Using other methods for generating spatial coordinates, additional relationships might be revealed or accentuated.
Conclusion and Future Work
In this paper we describe the INVIZIAN system for the interactive exploration of data contained within large-scale neuroimaging repositories. In the example we present, INVIZIAN takes a derived coordinate system based on pairwise discrimination of dataset feature values and provides a powerful and efficient visualization environment, which emphasizes an interactive, dynamic, and compelling user-experience. Indeed, as electronic data capture methods become more mature and widely used to populate neuroimaging archives, we contend that it is user-friendly informatics tools such as INVIZIAN that will help make the case for the greater sharing of neuroimaging data, encourage greater data mining of information contained in neuroimaging data archives, and will broaden the audience of researchers and their students into the examination of brain data.
As we develop INVIZIAN further, we intend to investigate other effective coordinate systems in which to project brain to emphasize inherent patterns that are informative. For instance, we are examining methods for assigning initial groups using automated k-means clustering algorithms. We also plan on providing data mining analysis as part of the query–feedback. As an example, during Boolean attribute searches INVIZIAN will display a metric illustrating the degree of clustering for the queried data. Non-Cartesian coordinate systems will also be explored (e.g., planar, spherical, helical, toroidal, etc.). The use of GGobi will be depreciated and we will directly embed plots of meta-data and morphometric data relationships. Finally, we intend to expand the collaboration and multi-site project opportunities which may be facilitated by INVIZIAN. In all cases, our goal for INVIZIAN is to present data based on similarity so that the user may perceive relational patterns visually and interactively in much the same way that people now use programs such as Google Earth.
In conclusion, a wide variety of data capture methodologies are under development to aid the populating of large-scale biological and medical data archives, increasing the amount of data users must sift through. As these methods take hold, novel methods for exploratory visualization and interaction with neuroimaging database contents are necessary and important. These tools must be developed with the user kept firmly in mind. We believe that INVIZIAN is a compelling first step toward the creation of useful exploratory neuroimaging tools possessing such capabilities. All in all, dynamic user interaction frameworks like INVIZIAN, for use with large-scale archives and populated using automated data capture methods, will facilitate acquisition of new knowledge, and promote scientific discovery in the brain sciences.
Conflict of Interest Statement
The authors declare that the research was conducted in the absence of any commercial or financial relationships that could be construed as a potential conflict of interest.
Acknowledgments
This work is supported in part by NIH grants RC1 MH088194 and P41 RR013642.
Supplementary Material
The Movie S1 for this article can be found online at http://www.frontiersin.org/Neuroinformatics/10.3389/fninf.2012.00011/abstract
Footnotes
- ^http://www.google.com/maps
- ^http://earth.google.com
- ^http://www.worldwidetelescope.org
- ^http://www.microsoft.com
- ^http://qt.nokia.com
- ^http://www.sqlite.org/about.html
- ^http://www.boost.org
- ^http://invizian.loni.ucla.edu
- ^http://www.loni.ucla.edu/Software/license.php
- ^http://www.nitrc.org/invizian
- ^http://ida.loni.ucla.edu
References
Beals, R., Krantz, D. H., and Tversky, A. (1968). Foundations of multidimensional scaling. Psychol. Rev. 75, 127–142.
Bilder, R. M., Sabb, F. W., Cannon, T. D., London, E. D., Jentsch, J. D., Parker, D. S., Poldrack, R. A., Evans, C., and Freimer, N. B. (2009). Phenomics: the systematic study of phenotypes on a genome-wide scale. Neuroscience 164, 30–42.
Botev, Z. I., Grotowski, J. F., and Kroese, D. P. (2010). Kernel density estimation via diffusion. Ann. Stat. 38, 2916–2957.
Chen, C.-H., Härdle, W., Unwin, A., Cox, M. A. A., and Cox, T. F. (2008). Multidimensional Scaling. Handbook of Data Visualization. Berlin: Springer, 315–347.
Cook, D., and Swayne, D. F. (2007). Interactive and Dynamic Graphics for Data Analysis: With R and GGobi. New York: Springer.
Cutler, N. R. (1988). Cognitive and brain imaging measures of Alzheimer’s disease. Neurobiol. Aging 9, 90–92.
Dale, A. M., Fischl, B., and Sereno, M. I. (1999). Cortical surface-based analysis. I. Segmentation and surface reconstruction. Neuroimage 9, 179–194.
Daubechies, I. (2004). Ten Lectures on Wavelets. Philadelphia: Society for Industrial and Applied Mathematics.
Desikan, R. S., Cabral, H. J., Settecase, F., Hess, C. P., Dillon, W. P., Glastonbury, C. M., Weiner, M. W., Schmansky, N. J., Salat, D. H., and Fischl, B. (2010). Automated MRI measures predict progression to Alzheimer’s disease. Neurobiol. Aging 31, 1364–1374.
Dickerson, B. C., Feczko, E., Augustinack, J. C., Pacheco, J., Morris, J. C., Fischl, B., and Buckner, R. L. (2009). Differential effects of aging and Alzheimer’s disease on medial temporal lobe cortical thickness and surface area. Neurobiol. Aging 30, 432–440.
Dinov, I., Lozev, K., Petrosyan, P., Liu, Z., Eggert, P., Pierce, J., Zamanyan, A., Chakrapani, S., Van Horn, J., Parker, D., Magsipoc, R., Leung, K., Gutman, B., Woods, R., and Toga, A. (2010). Neuroimaging study designs, computational analyses and data provenance using the LONI pipeline. PLoS ONE 5, e13070.
Dinov, I., Van Horn, J., Lozev, K., Magsipoc, R., Petrosyan, P., Liu, Z., MacKenzie-Graha, A., Eggert, P., Parker, D., and Toga, A. (2009). Efficient, distributed and interactive neuroimaging data analysis using the LONI pipeline. Front. Neuroinformatics 3, 1–10.
Ellis, K. A., Bush, A. I., Darby, D., De Fazio, D., Foster, J., Hudson, P., Lautenschlager, N. T., Lenzo, N., Martins, R. N., Maruff, P., Masters, C., Milner, A., Pike, K., Rowe, C., Savage, G., Szoeke, C., Taddei, K., Villemagne, V., Woodward, M., and Ames, D. (2009). The Australian imaging, biomarkers and lifestyle (AIBL) study of aging: methodology and baseline characteristics of 1112 individuals recruited for a longitudinal study of Alzheimer’s disease. Int. Psychogeriatr. 21, 672–687.
Filipovych, R., and Davatzikos, C. (2011). Semi-supervised pattern classification of medical images: application to mild cognitive impairment (MCI). Neuroimage 55, 1109–1119.
Fussenegger, M., Opelt, A., Pinz, A., and Auer, P. (2004). Object recognition using segmentation feature detection. Pattern Recognit. 3, 41–44.
Gosink, L. J., Garth, C., Anderson, J. C., Bethel, E. W., and Joy, K. I. (2011). An application of multivariate statistical analysis for query-driven visualization. IEEE Trans. Vis. Comput. Graph. 17, 264–275.
Jack, C., Bernstein, M., Fox, N., Thompson, P., Alexander, G., Harvey, D., Borowski, B., Britson, P., Whitwell, J., Ward, C., Dale, A., Felmlee, J., Gunter, J., Hill, D., Killiany, R., Schuff, N., Fox-Bosetti, S., Lin, C., Studholme, C., DeCarli, C., Krueger, G., Ward, H., Metzger, G., Scott, K., Mallozzi, R., Blezek, D., Levy, J., Debbins, J., Fleisher, A., Albert, M., Green, R., Bartzokis, G., Glover, G., Mugler, J., and Weiner, M. (2008). The Alzheimer’s disease neuroimaging initiative (ADNI): MRI methods. J. Magn. Reson. Imaging 27, 685–691.
Johansson, S., and Johansson, J. (2009). Interactive dimensionality reduction through user-defined combinations of quality metrics. IEEE Trans. Vis. Comput. Graph. 15, 993–1000.
Joshi, S. H., Bowman, I., Toga, A. W., and Van Horn, J. D. (2011). “Brain pattern analysis of cortical valued distributions,” in Proceedings of IEEE International Symposium Biomedical Imaging, Chicago, 1117–1120.
Joshi, S. H., Van Horn, J. D., and Toga, A. W. (2009). Interactive exploration of neuroanatomical meta-spaces. Front. Neuroinformatics 3:38.
Ke, Y., and Sukthankar, R. (2004). “Pca-sift: a more distinctive representation for local image descriptors,” in IEEE Conference on Computer Vision and Pattern Recognition, Washington: IEEE.
Keim, D. A., and Kriegel, H. P. (1994). VisDB: database exploration using multi-dimensional visualization. IEEE Trans. Comput. Graph. Appl. 14, 40–49.
Lowe, D. (2004). Distinctive image features from scale-invariant keypoints. Int. J. Comput. Vis. 60, 91–110.
Martinez, A., and Kak, A. C. (2001). PCA versus LDA. IEEE Trans. Pattern Anal. Mach. Intell. 23, 228–233.
McCormick, P. S., Inman, J. M., Ahrens, J. P., Hansen, C., and Roth, G. (2004). “Scout: a hardware-accelerated system for quantitatively driven visualization and analysis,” in Visualization ’04 (VIS ’04) (Washington, DC: IEEE Computer Society).
Querbes, O., Aubry, F., Pariente, J., Lotterie, J. A., Demonet, J. F., Duret, V., Puel, M., Berry, I., Fort, J. C., and Celsis, P. (2009). Early diagnosis of Alzheimer’s disease using cortical thickness: impact of cognitive reserve. Brain 132(Pt 8), 2036–2047.
R Development Core Team. (2011). R: A Language and Environment for Statistical Computing. Vienna: R Foundation for Statistical Computing.
Tenenbaum, J. B., Silva, V. D., and Langford, J. C. (2000). A global geometric framework for nonlinear dimensionality reduction. Science 290, 2319–2323.
Teo, Y. Y. (2010). Exploratory data analysis in large-scale genetic studies. Biostatistics 11, 70–81.
Thompson, P. M., and Apostolova, L. G. (2007). Computational anatomical methods as applied to ageing and dementia. Br. J. Radiol. 80, S78–S91.
Thompson, P. M., Hayashi, K. M., Sowell, E. R., Gogtay, N., Giedd, J. N., Rapoport, J. L., de Zubicaray, G. I., Janke, A. L., Rose, S. E., Semple, J., Doddrell, D. M., Wang, Y., van Erp, T. G., Cannon, T. D., and Toga, A. W. (2004). Mapping cortical change in Alzheimer’s disease, brain development, and schizophrenia. Neuroimage 23(Suppl. 1), S2–S18.
Thompson, P. M., Mega, M. S., Woods, R. P., Zoumalan, C. I., Lindshield, C. J., Blanton, R. E., Moussai, J., Holmes, C. J., Cummings, J. L., and Toga, A. W. (2001). Cortical change in Alzheimer’s disease detected with a disease-specific population-based brain atlas. Cereb. Cortex 11, 1–16.
Tu, Z., Narr, K. L., Dinov, I., Dollar, P., Thompson, P. M., and Toga, A. W. (2008). Brain anatomical structure segmentation by hybrid discriminative/generative models. IEEE Trans. Med. Imaging 27, 495–508.
Unser, M., and Albroubi, A. (1996). A review of wavelets in biomedical applications. Proc. IEEE 84, 626–638.
Van Horn, J. D., and Gazzaniga, M. S. (2002). Opinion: databasing fMRI studies towards a ‘discovery science’ of brain function. Nat. Rev. Neurosci. 3, 314–318.
Van Horn, J. D., Grethe, J. S., Kostelec, P., Woodward, J. B., Aslam, J. A., Rus, D., Rockmore, D., and Gazzaniga, M. S. (2001). The Functional Magnetic Resonance Imaging Data Center (fMRIDC): the challenges and rewards of large-scale databasing of neuroimaging studies. Philos. Trans. R. Soc. Lond. B Biol. Sci. 356, 1323–1339.
Van Horn, J. D., and Ishai, A. (2007). Mapping the human brain: new insights from FMRI data sharing. Neuroinformatics 5, 146–153.
Van Horn, J. D., and Toga, A. W. (2009a). Is it time to re-prioritize neuroimaging databases and digital repositories? Neuroimage 47, 1720–1734.
Van Horn, J. D., and Toga, A. W. (2009b). Multisite neuroimaging trials. Curr. Opin. Neurol. 22, 370–378.
Van Horn, J. D., Wolfe, J., Agnoli, A., Woodward, J., Schmitt, M., Dobson, J., Schumacher, S., and Vance, B. (2005). Neuroimaging databases as a resource for scientific discovery. Int. Rev. Neurobiol. 66, 55–87.
Velleman, P., and Hoaglin, D. (1981). The ABC’s of EDA: Applications, Basics, and Computing of Exploratory Data Analysis. North Scituate: Duxbury.
Westlye, L. T., Walhovd, K. B., Dale, A. M., Espeseth, T., Reinvang, I., Raz, N., Agartz, I., Greve, D. N., Fischl, B., and Fjell, A. M. (2009). Increased sensitivity to effects of normal aging and Alzheimer’s disease on cortical thickness by adjustment for local variability in gray/white contrast: a multi-sample MRI study. Neuroimage 47, 1545–1557.
Wickham, H., Lawrence, M., Lang, D. T., and Swayne, D. F. (2008). An introduction to rggobi. R News 8, 3–7.
Williams, M., and Munzner, T. (2004). “Steerable, progressive multidimensional scaling,” in IEEE Symposium on Information Visualization (Washington, DC: IEEE).
Woods, R. P., Grafton, S. T., Holmes, C. J., Cherry, S. R., and Mazziotta, J. C. (1998). Automated image registration: I. General methods and intrasubject, intramodality validation. J. Comput. Assist. Tomogr. 22, 139–152.
Wu, Z. (2010). Exploration, visualization, and preprocessing of high-dimensional data. Methods Mol. Biol. 620, 267–284.
Xu, L., and King, I. (2001). A PCA approach for fast retrieval of structural patterns in attributed graphs. IEEE Trans. Syst. Man Cybern. B Cybern. 31, 812–817.
Yang, J., Peng, W., Ward, M. O., and Rundensteiner, E. A. (2003a). “Interactive hierarchical dimension ordering, spacing, and filtering for exploration of high dimensional datasets,” in Ninth Annual IEEE Conference on Information Visualization (INFOVIZ’03) (Washington, DC: IEEE Computer Society), 105–112.
Keywords: neuroinformatics, informatics, data mining, visualization, data representation, applications
Citation: Bowman I, Joshi SH and Van Horn JD (2012) Visual systems for interactive exploration and mining of large-scale neuroimaging data archives. Front. Neuroinform. 6:11. doi: 10.3389/fninf.2012.00011
Received: 16 September 2011; Accepted: 19 March 2012;
Published online: 23 April 2012.
Edited by:
Ulla Ruotsalainen, Tampere University of Technology, FinlandReviewed by:
Stephen C. Strother, University of Toronto, CanadaChung-Chuan Lo, National Tsing Hua University, Taiwan
Copyright: © 2012 Bowman, Joshi and Van Horn. This is an open-access article distributed under the terms of the Creative Commons Attribution Non Commercial License, which permits non-commercial use, distribution, and reproduction in other forums, provided the original authors and source are credited.
*Correspondence: John D. Van Horn, Laboratory of Neuro Imaging, Department of Neurology, David Geffen School of Medicine, University of California Los Angeles, 635 Charles E. Young Drive SW, Suite 225 Los Angeles, CA 90095-7334, USA. e-mail: jvanhorn@loni.ucla.edu