 Chao Shi
 Jian Yin
 Zhe Liu†
 Qi Zhao
 Jian Ren
 Nan Yao
- State Key Laboratory of Biocontrol, Guangdong Key Laboratory of Plant Resources, Department of Biological Science and Technology, School of Life Sciences, Sun Yat-sen University, Guangzhou, China
The phytohormone salicylic acid (SA) affects plant development and defense responses. Recent studies revealed that SA also participates in the regulation of sphingolipid metabolism, but the details of this regulation remain to beexplored. Here, we use in silico Flux Balance Analysis (FBA) with published microarray data to construct a whole-cell simulation model, including 23 pathways, 259 reactions, and 172 metabolites, to predict the alterations in flux of major sphingolipid species after treatment with exogenous SA. This model predicts significant changes in fluxes of certain sphingolipid species after SA treatment, changes that likely trigger downstream physiological and phenotypic effects. To validate the simulation, we used 15N-labeled metabolic turnover analysis to measure sphingolipid contents and turnover rate in Arabidopsis thaliana seedlings treated with SA or the SA analog benzothiadiazole (BTH). The results show that both SA and BTH affect sphingolipid metabolism, altering the concentrations of certain species and also changing the optimal flux distribution and turnover rate of sphingolipids. Our strategy allows us to estimate sphingolipid fluxes on a short time scale and gives us a systemic view of the effect of SA on sphingolipid homeostasis.
Introduction
Salicylic acid (SA), an important phenolic phytohormone, has well-known roles in pathogen-triggered defense responses including microbe-associated molecular pattern-triggered immunity, effector-triggered immunity, and systemic acquired resistance (Jones and Dangl, 2006; Spoel and Dong, 2012; Yan and Dong, 2014). SA also participates in abiotic stress responses (Vlot et al., 2009; Miura and Tada, 2014) and in plant development, including vegetative and reproductive growth (Vicente and Plasencia, 2011). SA also has indispensible functions in the maintenance of redox homeostasis (Durner and Klessig, 1995, 1996; Slaymaker et al., 2002) and respiratory pathways (Moore et al., 2002). The SA analog benzothiadiazole (BTH) activates the SA signaling pathway, triggers expression of defense genes (Shimono et al., 2007), and produces physiological effects similar to those produced by SA (Lawton et al., 1996).
As a key mediator of defense responses, the SA pathway affects many metabolic pathways. Sphingolipids are a family of complex lipids that have a serine-based head, a fatty acyl chain, and a long-chain base (LCB). Covalent modifications and variability in the length of the fatty acyl chain increase sphingolipid diversity. Sphingolipids are important structural and functional components of the plasma membrane (Hannun and Obeid, 2008) and have important functions in the plant immune response, abiotic stress responses,and developmental regulation (Chen et al., 2009; Pata et al., 2009; Markham et al., 2013; Bi et al., 2014). In Arabidopsis, ceramides, a group of sphingolipids, affect SA-mediated defense responses and programmed cell death (PCD). Some mutants in the sphingolipid metabolic pathway show high levels of expression of defense-related genes, accumulate SA, and undergo PCD. The ceramide kinase-deficient mutant accelerated cell death 5 (acd5) accumulates SA and ceramides late in development, but shows increased susceptibility to pathogens (Greenberg et al., 2000; Liang et al., 2003; Bi et al., 2014). Wang et al. (2008) reported that the insertion knock-out mutant of Arabidopsis inositolphosphorylceramide synthase 2 (erh1) also spontaneously accumulates SA. Similar increases in SA levels have also been observed in the sphingosine transfer protein mutant acd11 (Brodersen et al., 2002), the Arabidopsis sphingolipid fatty acid hydroxylase mutants fah1 fah2 (König et al., 2012), and mips1 (D-myo-inositol 3-phosphate synthase 1) mutants (Meng et al., 2009). Moreover, SA accumulation and PCD signaling mediated by MAPK affect the levels of free LCB (Saucedo-García et al., 2011). However, fah1 fah2 mutants accumulate SA and have moderate levels of LCB (König et al., 2012). Thus, the SA and sphingolipid pathways have significant but complex crosstalk, particularly in defense and cell death.
Metabolic modeling performs well in prediction of physiological changes and metabolic outcomes resulting from genetic manipulation, where changes in metabolite levels have a strong effect on cellular behavior (Smith and Stitt, 2007; Stitt et al., 2010). The genome of Arabidopsis thaliana has been sequenced, making whole-genome metabolic reconstruction feasible (Thiele and Palsson, 2010; Seaver et al., 2012). Much of the early modeling work used steady-state Metabolic Flux Analysis (MFA), based on a steady-state model of the plant metabolic network, and on experiments using isotope labeling to trace metabolites of interest (Libourel and Shachar-Hill, 2008; Allen et al., 2009; Kruger et al., 2012). This method provided insights on metabolic organization and modes, but has difficulty in labeling heterotrophic tissues (Sweetlove and Ratcliffe, 2011), over-relies on manual curation of metabolic pathways (Masakapalli et al., 2010; Sweetlove and Ratcliffe, 2011; Kruger et al., 2012), and uses low-throughput detection, making systematic analysis difficult (Lonien and Schwender, 2009; Sweetlove and Ratcliffe, 2011).
By contrast, Flux Balance Analysis (FBA) overcomes many of the drawbacks of MFA. FBA establishes a model based on a group of ordinary differential equations that formulate a transient quasi-steady state of the metabolic fluxome of target pathways. The transient flux balance calculated by the FBA model has an almost-negligible duration compared to the long-term, fundamental metabolic changes that occur during development or in environmental responses (Varma and Palsson, 1994). In addition, FBA does not require isotopic labeling, suits a variety of trophic modes, and is more flexible than steady-state MFA in handling groups of flux distributions by linear programming and other methods for optimization under constraints (Edwards and Palsson, 2000; Reed and Palsson, 2003). Several Arabidopsis metabolic models based on FBA are available online (Poolman et al., 2009; Dal'Molin et al., 2010; Radrich et al., 2010).
Apart from FBA simulation, fluxomic changes can also be measured experimentally. To examine the response of sphingolipids to SA and BTH, we needed to determine and compare the turnover rates of sphingolipids. One of the major methods to measure turnover uses a time-course of stable isotopic incorporation into target metabolites, which are detected by mass spectrometry or nuclear magnetic resonance (Schwender, 2008; Hasunuma et al., 2010). The isotopic accumulation curve indicates the turnover of target metabolites.
Since metabolic changes substantially affect the crosstalk between SA and sphingolipids, in this study we constructed a metabolic model to simulate SA-related changes in the sphingolipid pathway. We constructed an Arabidopsis whole-cell FBA model including 23 pathways, 259 reactions, and 172 metabolites. Based on their relative enrichment and responsiveness to SA stimulation, our model includes 40 sphingolipid species, including LCBs, ceramides, hydroxyceramide, and glucosylceramides. Due to the lack of flux data on plant sphingolipid metabolism, we used 15N-labeled metabolic turnover analysis to measure sphingolipid flux in untreated plants and calibrate the FBA model. After the calibration, we also supplied the model with additional expression profiles from plants treated with SA and BTH. The FBA model was calculated in silico for prediction and comparison of the optimal flux distribution and flux variability in SA- and BTH-treated and untreated conditions. We then used metabolic turnover analysis with 15N-labeled samples to measure the flux changes directly. Both the computational model and the experiments showed consistent and significant changes in the sphingolipid pathway in response to SA and BTH. Our data gives us a systemic view of the effect of SA on sphingolipidhomeostasis.
Materials and Methods
Plant Materials
Wild type Arabidopsis thaliana ecotype Columbia seedlings were grown vertically on 1/2x Murashige and Skoog (MS) medium for 10 days after 2-day vernalization. The culture dishes were incubated at 22°C under a 16 h light/8 h dark cycle. For labeling the plant seedlings in liquid medium, the culture dishes were incubated at 22°C with 24 h light.
Labeling and Treatments
The different sphingolipids have many carbon atoms in different positions; therefore, labeling the only nitrogen in the serine-based head group provides an easier approach for LC-MS/MS measurements. We used 15N serine (Cambridge Isotope Laboratories, Inc. MA, USA) in the labeling experiment. Ten-day-old seedlings were transferred to N-deficient 1/2x MS liquid medium (Yoshimoto et al., 2004) in 12-well culture plates. 5 mM 15N-labeled serine was supplied to compensate for the shortage of nitrogen (Hirner et al., 2006) and used as the only source of isotope. For SA and BTH treatments, 100 μ M SA or 100 μ M BTH was supplied in the labeling medium. The seedlings were treated or not treated for 0, 1, 3, 5, 7, 9, and 24 h for 15N-labeled metabolic turnover analysis before sphingolipid extraction.
Experimental Measurement of Turnover Rate
Since serine has only one nitrogen atom and each sphingolipid has only one serine, the fraction of each labeled sphingolipid species can be measured as:
where 15N is the concentration of 15N-labeled molecules of a specific sphingolipid species, and N is the total concentration of that sphingolipid species, whether labeled or not.
The turnover rate of a sphingolipid species is calculated from the slope of the curve of the time-course of 15N incorporation from the initial time that the fraction begins to increase to the time that the fraction stabilizes. Also, the isotopic incorporation rate r can be calculated as:
In the measurement, the natural enrichment of 15N remains relatively constant between samples and treatments.
Sphingolipid Measurements
The plants cultured in labeling medium for the times described above were weighed and metabolically quenched by freezing in liquid nitrogen. Sphingolipid species were then extracted and measured by LC-MS/MS as described by Bi et al. (2014), with a slight modification to cope with isotopic-labeled sphingolipid species. Major sphingolipid species were subsequently analyzed with a Shimadzu 20A HPLC tandem AB SCIEX TripleTOF 5600+ mass spectrometer. The sphingolipid species were analyzed using the software Multiquant (AB SCIEX).
Metabolic Model Construction
The Arabidopsis whole-cell metabolic model was constructed with 23 pathways, 259 reactions, and 172 metabolites. Primary metabolic pathways refer to the KEGG (Kyoto Encyclopedia of Genes and Genomes http://www.genome.jp/kegg/ Kanehisa et al., 2008), the AraCyc database (Mueller et al., 2003), and the AraGEM model (Dal'Molin et al., 2010), with manual curation for sphingolipid metabolism, including major ceramide, hydroxyceramide, and glucosylceramide species (Table S1). We used biomass as the objective function and the stoichiometries of major components were assigned to their biomass fraction, which comprises major carbohydrates, amino acids, and lipids, according to experiments or data provided in the literature (Fiehn et al., 2000; Welti et al., 2002; Dal'Molin et al., 2010). For sphingolipid species, the objective function stoichiometries were set to the adjusted isotopic incorporation rate in labeling experiments.
Flux Balance Analysis (FBA)
Flux balance modeling uses a group of ordinary differential equations. The analysis requires a stoichiometric matrix (S) and a vector (v) built for each reaction, where sij in the S matrix is the stoichiometric number of the ith metabolite in the jth reaction and vj is the rate of the jth reaction, which is subjected to upper and lower boundary constraints. To reach the in silico “quasi-steady state,” the following condition must be fulfilled:
After solving the FBA equation with the constraints above (Edwards and Palsson, 2000; Edwards et al., 2001), a linear-programming optimization method (Edwards and Palsson, 2000) was applied to pick the most plausible (groups of) flux distributions among the solution space according to the objective setting.
We applied isotopic incorporation rate as the reference for stoichiometry in the objective function. Considering that the stoichiometries of other components are biomass-derived (from AraGEM, Dal'Molin et al., 2010), we used optimization to find the proper fold-change of all isotopic incorporation rates simultaneously (Table 2, the column showing untreated isotopic incorporation rate) of sphingolipids, as their stoichiometries, to make a new model that deviated the least from the optimized steady-state flux distribution from the AraGEM model. Then, we optimized the individual stoichiometry of every sphingolipid species from the results of the first step to get a set of final stoichiometries (Table 1).
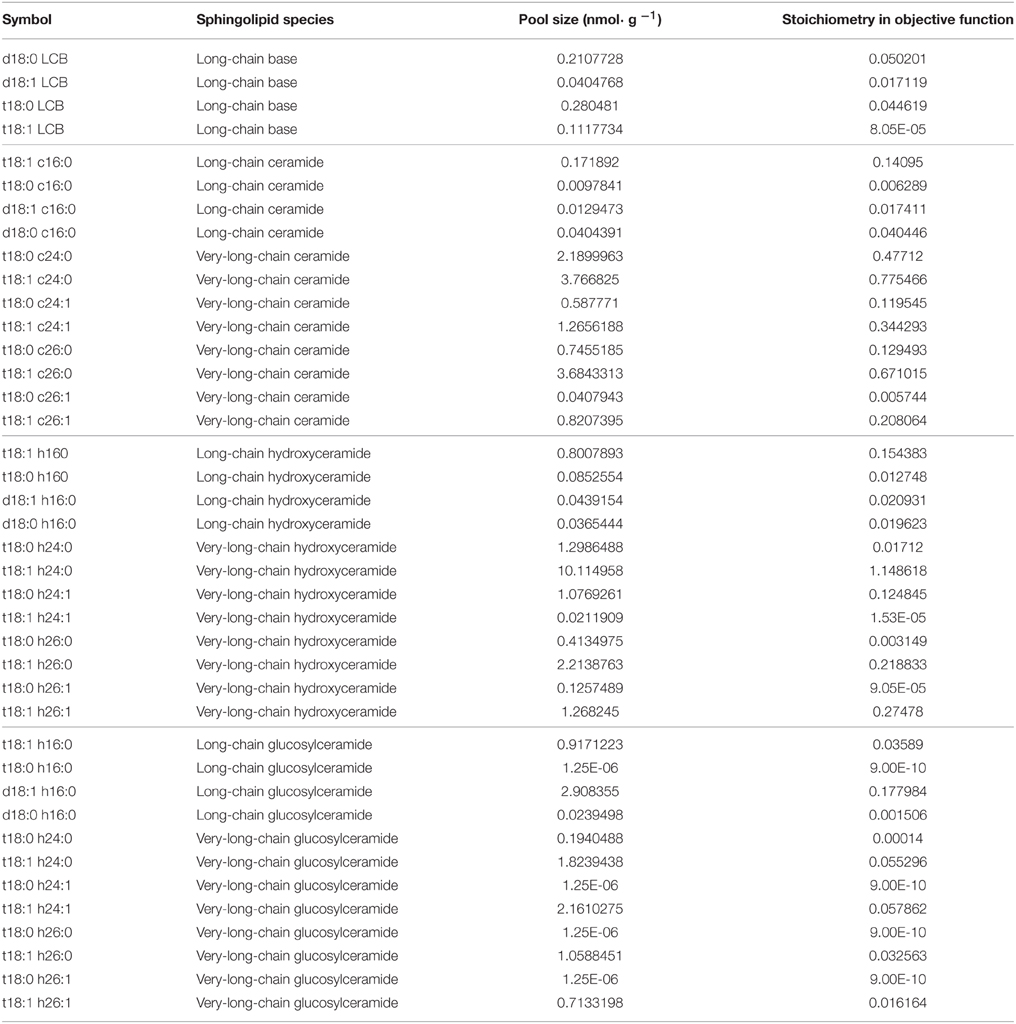
Table 1. Overview of sphingolipid species in the FBA model.
In Silico SA and BTH Treatments
To incorporate the effect of exogenous SA and BTH on the wild-type plant into the model, we used published microarray data for SA- and BTH-treated Arabidopsis (for SA, van Leeuwen et al., 2007; for BTH, Wang et al., 2006). We assumed that the metabolic flux change followed the same trend as the respective gene expression levels. Therefore, we picked genes that changed more than 1.5-fold in SA-treated plants and more than 2-fold in BTH-treated plants (Table S2). Then, the adjusted model was recalculated for optimal flux distribution.
Flux Variability Analysis (FVA)
The stoichiometry model is a self-balancing model in that any flux distributions that fulfill the constraints are involved in its solution space. Through the sampling of the solution space or sensitivity analysis, each reaction is tested for its possible upper flux limit and lower flux limit under constraints (Mahadevan and Schilling, 2003). The calculated range of each flux is an important indicator of the role of the corresponding reaction in the robustness of the whole network. To make a physiologically relevant estimation, we sampled the flux space that achieved at least 80% of the optimal objective rate (in our model, the biomass production) in untreated or treated conditions.
Simulation Environment
The model of Arabidopsis was built in SBML (Systems Biology Makeup Language) (Hucka et al., 2003) in XML format. SBML Toolbox 2.0.2 (Keating et al., 2006; Schmidt and Jirstrand, 2006) and COBRA Toolbox 2.0.5 (Schellenberger et al., 2011) in MATLAB 2012a (Mathworks Inc.; Natick, MA) were used for model construction and calculation. Linear programming was performed with GLPK (GNU Linear Programming Kit, http://www.gnu.org/software/glpk/). The rank-test and multiple covariance analysis were performed using IBM SPSS Statistics 19 (IBM Corp. Released 2010. IBM SPSS Statistics for Windows, Version 19.0. Armonk, NY: IBM Corp.).
Results
Model Construction for Plant Sphingolipid Metabolism
We used computational modeling and experiments to explore the changes in plant sphingolipid metabolism in response to SA. Although sphingolipids function as important components in plant development and stress responses, their metabolism remains obscure, with only a few network parameters that have been measured. FBA is well-suited to the simulation of a metabolic fluxome with poorly understood dynamics (Varma and Palsson, 1994), as optimization by FBA requires only the stoichiometric relationship in each reaction and the objective function. In our model, we obtained the numbers of molecules of reactants and products of known reactions from public databases (see Materials and Methods). For sphingolipid pathways (Table S1), we inferred the reactions that have not been determined from their atomic composition or similar reactions. Considering that metabolic balances are mainly affected by a few metabolites that are either in a hub of the network or have high turnover, we picked the sphingolipid species that are relatively abundant or central to the known network (Table 1). Since inositolphosphorylceramide and its derivatives are difficult to measure in plants, we excluded those species from our model.
15N-Labeled Metabolic Turnover Analysis of Sphingolipids
To inform the objective function and to validate the model's prediction, we used the in vivo fluxomic method of 15N-labeled metabolic turnover analysis to directly measure the turnover rate of plant sphingolipids. In previous work, 13C was mostly used to examine the fluxome of central pathways such as glucose metabolism or photosynthesis (Hasunuma et al., 2010; Noack et al., 2010; Nöh and Wiechert, 2011), where limited numbers of labeled fragments are detected by mass spectrometry. However, the simplest sphingolipid has at least 18 carbon atoms, and their combined transitions, modifications, and fragmentation would generate large numbers of labeled fragments; therefore mass spectrometry quantification of 13C-labeled sphingolipid would be extremely difficult. To circumvent this difficulty, we used 15N, which will label only the single nitrogen atom in the head of each sphingolipid. To distinguish between artificial and natural 15N, we measured the composition of natural 15N sphingolipid in unlabeled samples, finding different levels of natural 15N in each sphingolipid species. This fraction is constant between measurements and treatments in each species, and thus cannot affect the comparison of isotopic incorporation rates between experiments.
We transiently labeled 10-day-old seedlings in a time course. The isotopic incorporation curves (see representative species shown in Figure 1) reveal that the labeled serine is absorbed and incorporated into sphingolipid in the first hour of labeling, and the sphingolipid then undergoes turnover at a uniform rate. For LCB (Figure 1D), ceramide (Figure 1A), and hydroxyceramide species (Figure 1B), the isotopic incorporation curves gradually flatten and finally reach a plateau of the isotopic fraction between 9 and 24 h. A noticeable, small drop occurs around the 5th hour of incorporation in LCB (Figure 1D). The incorporation of 15N in these simple sphingolipids is fast, and the final balanced isotopic fraction can reach 40–65% (Figures 1A,B,D). By contrast, for the glucosylceramides the labeled fraction rose constantly between 9 and 24 h (Figure 1C), and the glucosylceramides had a lower rate of incorporation than the ceramides or hydroxyceramides. Combined with the concentration of sphingolipids, we calculated the isotopic incorporation rate as shown in Table 2.
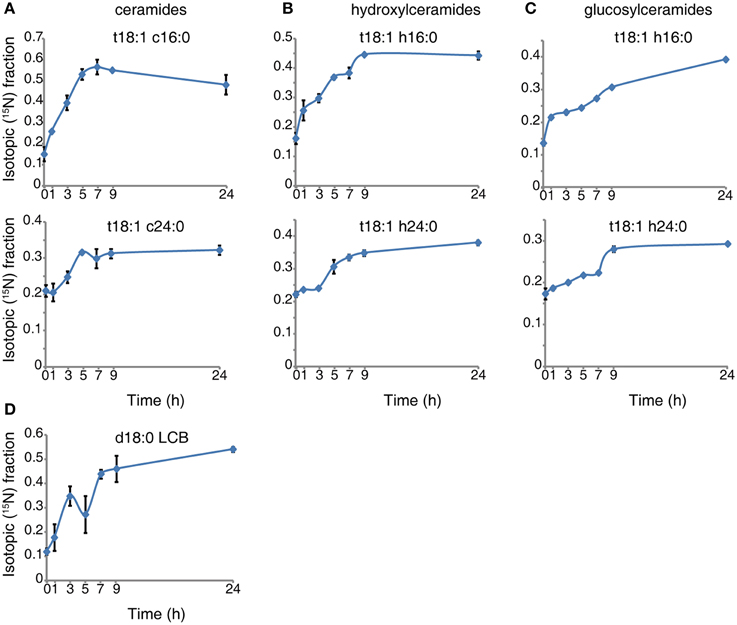
Figure 1. 15N incorporation curves for sphingolipid species. Ten-day-old wild-type seedlings were transferred to 5 mM 15N- serine labeled N-deficient 1/2x MS liquid medium for the indicated times. Sphingolipids were then extracted and measured as described in Methods. The 15N fraction incorporation curve was calculated based on the formula shown in Methods. Error bars represent the means ± SE from triplicate biological repeats. The measured sphingolipid species were: ceramide (A), hydroxyceramide (B), gluocosylceramide (C) and LCB (D). LCB and fatty acid in ceramide species represent, LCB; d/t (di/trihydroxy) 18 (18 carbon chain), 1 (one desaturation) followed by fatty acid; c/h/g (non-hydroxyl/hydroxyl/glucosy and hydroxyl) 24 (24 carbon chain), 0 (no desaturations).
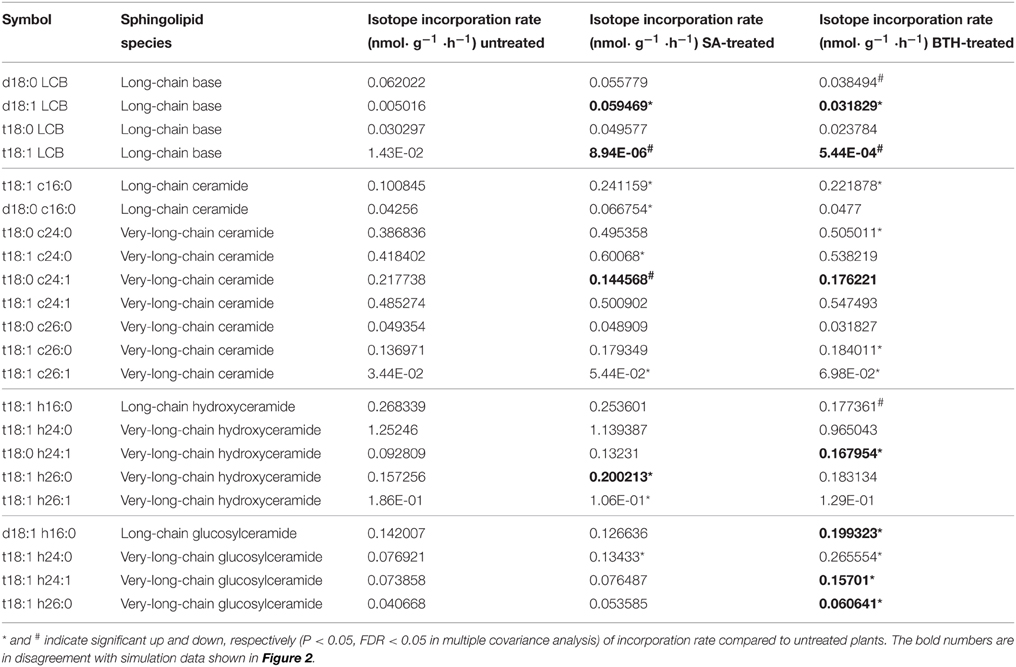
Table 2. Isotopic incorporation rate for major sphingolipids, with or without 100 μ M SA or 100 μ M BTH treatments.
Flux Balance Analysis (FBA) of the Flux Distribution in Untreated Plants
The objective function in the FBA model guides the flux determination by simulating a transient flux distribution. However, at each time point, biomass is the complex result of development throughout the organism's life, and hence cannot provide relevant information for setting the objective function in our model of the Arabidopsis seedling. Instead, we built and adjusted the objective function stoichiometries of the sphingolipid pathway from the isotopic incorporation rates in the labeling experiments (Table 1). Then, we performed flux balance optimization. Figure 2 shows the simulated flux distributions of sphingolipid species in untreated plants.
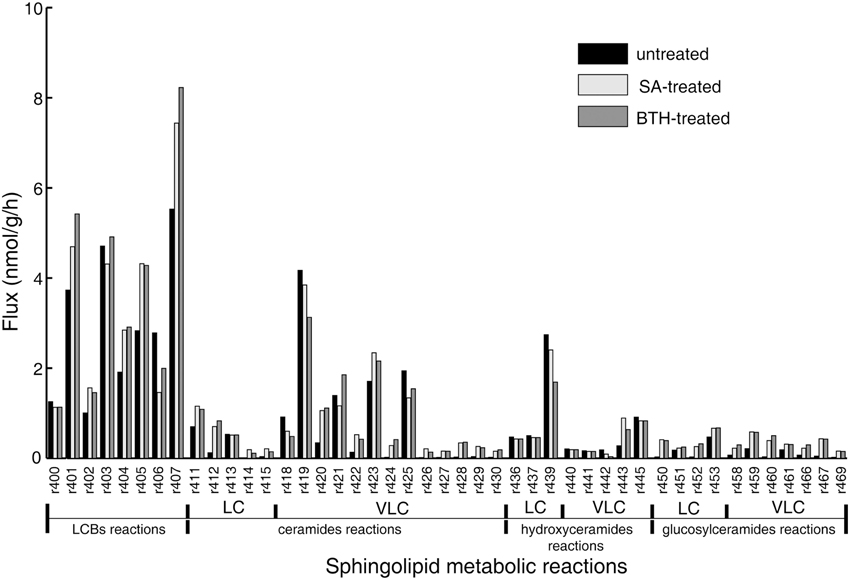
Figure 2. Simulated flux distribution of selected sphingolipid species. The untreated plants (black) and in silico SA (light gray) and BTH-treated plants (gray) were taken from the flux balance model. The effects of exogenous SA and BTH were simulated by changing the target flux bound proportional to its related gene expression alteration identified by published microarray data (Wang et al., 2006; van Leeuwen et al., 2007). LC, long-chain (≤C18); VLC: very-long-chain (>C18).
The simulation data in Figure 2 show that LCBs, very-long-chain ceramides, and hydroxyceramides compose the highest fraction of total flux. Combined with the rapid isotopic incorporation and high fraction of stabilized isotopic final levels of LCB, ceramides, and hydroxyceramides (Figure 1), the results demonstrate that LCBs, the sphingolipids that have the smallest pool size, also have the highest turnover among plant sphingolipids. Very-long-chain ceramides and hydroxyceramides are important not only for their hub position connecting glucosylceramides and sphingosine, but also because they carry a huge flux throughput in sphingolipid turnover and thus help maintain sphingolipid homeostasis. Both the simulation and experimental results indicate that these sphingolipid species are probably more responsive to disturbance, and thus are frequently used by pathogens to manipulate or interfere with host sphingolipid metabolism (Markham et al., 2011; Bi et al., 2014).
Although the glucosylceramides have much larger pool sizes (Table 1) than the ceramides, hydroxyceramides, or LCBs, they have smaller metabolic fluxes than their precursors (Figure 2). These results are validated by the slow but lasting incorporation of isotope into glucosylceramide pools (Figure 1C). The relatively slow turnover is in accordance with the function of glucosylceramides as membrane structural components, indicating a slow but continuous accumulation in the cell membrane during plant development. The accordance of simulation and experimental results also supports our choice of objective function stoichiometry setting, as the scale of simulated and measured sphingolipid metabolic flux distribution (Figure 2 and Table 2) is nearly unrelated to the distribution of sphingolipid biomass (Table 1).
In Silico SA and BTH Treatments
The FBA model hypothesizes the quasi-steady state condition of the target network, and we assume that the sphingolipid pathway will reach at least a transient metabolic balance after SA treatment. Thus, we employed the previous model simulating the resting state to predict the effects of SA treatment. We first used data from microarray analysis of SA- and BTH-treated plants to simulate the effect of these treatments on sphingolipid flux. Sphingolipid-related genes were selected (see Method) from two microarrays (Table S2). LAG 1 HOMOLOG 2 (LOH2), which encodes a ceramide synthase (Brandwagt et al., 2000; Ternes et al., 2011), showed the highest up-regulation after both SA and BTH treatments, and other genes SPHINGOID BASE HYDROXYLASE 2 (SBH2), FATTY ACID/SPHINGOLIPID DESATURASE (SLD), FATTY ACID HYDROXYLASE 2 (FAH2), SPHINGOSINE-1-PHOSPHATE LYASE (AtDPL1) also had different expression levels in the two treatments. The reactions regulated by the genes with altered transcript levels were then picked for incorporation into the model. The flux boundaries of these reactions were altered based on the gene expression, and the adjusted model was recalculated for flux balance analysis.
Compared with the model simulating the resting state, in silico SA and BTH treatments resulted in a nearly three-fold increase of predicted flux in long-chain ceramide species (Figure 2), as expected from the up-regulation of LOH2 in the microarray data. In particular, simulated SA and BTH treatment both produced a significant rise in predicted metabolism of trihydroxy glucosylceramides. This increase was not specific to fatty acid species, which showed an increase in both trihydroxy long-chain and very-long-chain glucosylceramides (Figure 2). These results are consistent with the data from 15N-labeled metabolic turnover analysis (Table 2). Interestingly, the microarray data showed no significant changes in genes that directly catalyze the pathways in glucosylceramide metabolism, nor any related to glucosylceramide, in response to SA or BTH treatment (Table S2). Considering the down-regulation of SBH2 under BTH treatment, we believe that the increase of glucosylceramide metabolism may mainly be induced by the upstream up-regulation of LOH2. Since the increase of the turnover rate was not linked to metabolite concentration, the predicted changes of glucosylceramides are almost negligible by typical quantitative LC-MS/MS measurement, but the increase in lipid renewal may have indispensible functions in the sensitivity of membrane-based cell signaling.
In this simulation, although some genes change differently in response to SA and BTH treatment (Table S2), SA and BTH have similar effects on sphingolipid metabolism. Our model also proposes a possible mechanism by which BTH affects the network under flux balance constraint without mimicking all the gene expression changes of its counterpart.
15N-Labeled Metabolic Turnover Measurement of the Effect of SA and BTH
To confirm the predictions of the model, we directly measured the in vivo flux change in response to SA and BTH treatments. For SA and BTH treatments, the isotope incorporation rate significantly increased for certain sphingolipid species such as C16 and C26 ceramides (Table 2). These results are consistent with our FBA model (Figure 2). After SA and BTH treatments, turnover increased for seven out of twenty-two and ten out of twenty-two major sphingolipids, respectively. Also, turnover decreased for two out of twenty-two and three out of twenty-two major sphingolipids after SA and BTH treatments, respectively. We found that the few inconsistencies between in silico predictions (Figure 2) and experimental data (Table 2) mainly came from LCB and glucosylceramides. Given the low in vivo level of LCB and the high variability of LCB measurement, the inconsistency of LCB turnover could result from experimental error. Interestingly, we found discrepancies between the effect of BTH and SA on glucosylceramide turnover. For example, the isotope incorporation rate significantly increased for glucosylceramides after BTH treatments (Table 2), indicating that it may underlie different mechanisms in the responses to BTH and SA.
Flux Variability Analysis
To examine the change in network rigidity in response to SA and BTH treatments, we estimated the accessible flux ranges of sphingolipid species in silico. To make a physiologically relevant estimation, we sampled the flux space that achieved at least 80% of the optimal objective rate (in our model, the biomass production) under untreated or treated conditions. We sorted the flux range into three types (Oberhardt et al., 2010): rigid flux (flux range near zero but with non-zero flux value), bounded flexible flux, and infinitely flexible flux (boundary spans from 0 or -1000 to 1000 in the model). In the fluxome of treated and untreated plants, LCB fluxes were infinitely flexible (showing a high capacity to tolerate disturbance), ceramide and glycosylceramide fluxes showed bounded flexibility, and hydroxyceramide fluxes were rigid (Table 3). The limited flux variability of most sphingolipids is consistent with stoichiometric modeling result in S. cerevisiae (Ozbayraktar and Ulgen, 2011). Similar to the isotopic incorporation experiments, we found disturbances of flux variability in ceramide and glucosylceramide metabolic fluxes after SA and BTH treatments, indicating that plant cells have the freedom to adjust their sphingolipid flux homeostasis during defense processes.
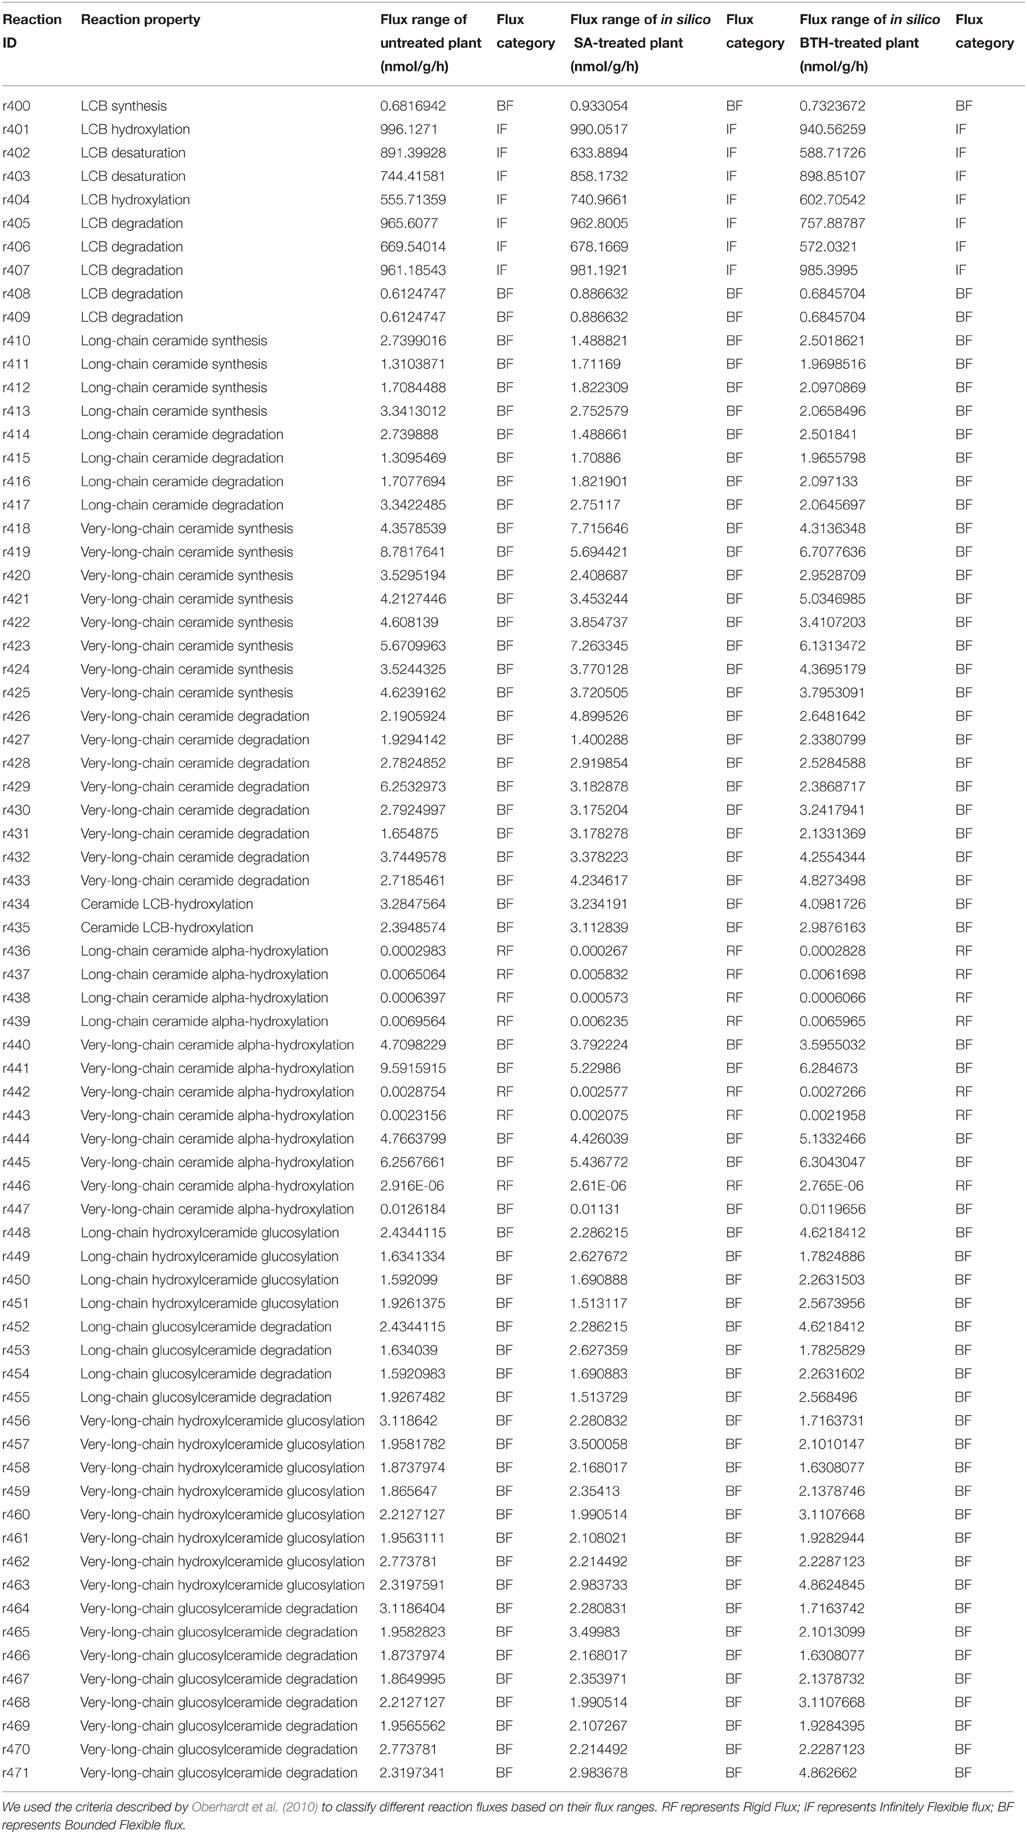
Table 3. Simulated flux variability of sphingolipid-related reactions in untreated and SA-treated plants.
Discussion
Our FBA model and isotope labeling experiments systematically explored the alterations in the sphingolipid pathway that occur in response to SA and BTH. Traditional metabolic responses can cause significant changes in the concentrations of certain metabolites. However, the systematic responses caused by plant activators and phytohormones cannot be achieved by only doubling the concentration of certain nodes; these responses also affect the dynamic properties of the whole network. To detect the underlying changes of network parameters caused by the modulation, both up and down, of certain nodes, one of the most direct measurements is the fluxome. FBA analysis has been applied in microbial metabolic engineering and modeling of other systems. However, construction of the model for sphingolipid metabolism presented difficulties related to the unique features of sphingolipid pathways. Although sphingolipid species are among the most reactive components in plant development and stress responses, they reside in the periphery of the network of plant metabolism, having loose metabolic connections with other subnetworks. Their lack of connection and remote position make the flux in the self-balanced function more susceptible to the objective settings, rather than being affected by artificial constraints and neighboring subnetworks.
Indeed, studies of sphingolipids in S. cerevisiae (Ozbayraktar and Ulgen, 2011) found that the sphingolipid pathways are also remote from central metabolism, but these models are backed by experimental data on enzyme kinetic parameters or known fluxes. Experimental exploration of plant sphingolipid pathways has been hindered by the vast diversity, low abundance, and lack of sensitive and replicable measurements of sphingolipids. In addition, the enzymes linking metabolites often are embedded in the layers of membranes, making the isolation and estimation of their kinetic properties difficult. Until now, a limited set of experiments has revealed only a rough sketch of plant sphingolipid metabolism. Considering that, we used the experimentally measured isotopic incorporation rate to set the stoichiometry of each sphingolipid species in the objective function, and we found that the resulting flux distribution of each species was in accordance with the isotopic incorporation pattern, demonstrating that isotopic incorporation data produce a better fit than biomass fraction in objective stoichiometry determination, as the maximization of biomass is often considered as the aim of plant metabolism regardless of any inconsistency between biomass contents and the generation rate of each component.
In our experiments, isotopic transient labeling provided a direct measurement of in vivo flux. We note that none of the sphingolipid species reached 100% labeled. Similar phenomena were also observed in other experiments (Delwiche and Sharkey, 1993; Hasunuma et al., 2010). Considering the internal serine sources and anaplerotic reactions of complex existing sphingolipids, the pattern indicates a balance of labeled and unlabeled sphingolipids in the metabolic pool. Since the only exogenous source of nitrogen is labeled, we can also speculate that sphingolipid synthesis uses external and internal sources of nitrogen, based on the isotopic incorporation curve.
There are various models linking plant sphingolipid pathways with hormones and their synergistic roles in plant development and stress responses. In these models, the possible sphingolipid inducers of defense responses include LCBs (Saucedo-García et al., 2011) and ceramides (Markham et al., 2011; Bi et al., 2014), with SA both up- and downstream of sphingolipid-mediated PCD (Saucedo-García et al., 2011; Bi et al., 2014). As mutants affecting sphingolipids often accumulate SA, the effect of SA on ceramide species may include positive feedback on the imbalance of sphingolipids. Our results are in accordance with the observed frequent variation in the concentration of LCB and sometimes ceramide, and the reduced variation in the concentrations of hydroxyceramide and glucosylceramide in wild-type Arabidopsis. Functionally speaking, since LCB and ceramides are fundamental to sphingolipid metabolism and show high flexibility in their flux, they can be more responsive to stimuli such as SA or BTH without disrupting the total fluxomic balance of sphingolipid metabolism.
In a living cell, the synthesis and degradation of all substances occurs through metabolism. However, current research tends to separate metabolites and functional molecules. The most exciting aspect of plant sphingolipids is that they are metabolites and functional molecules. Our current model only deals with their metabolic properties in a self-balanced manner. It will be interesting to incorporate the signaling network that involves sphingolipids to build an integrated model that can consider the direct effect of metabolism on cellsignaling.
Conclusion
In this study, we established a sphingolipid FBA model and used 15N-labeled isotopic transient labeling to systematically explore the effects of SA and BTH on sphingolipid metabolic pathways. The results show that increases in ceramide and glucosylceramide flux occur in response to exogenous SA and BTH and that alteration of their flux variability also occurs. Our results also give us insights that help explain the mechanism of crosstalk between SA and sphingolipids, and their roles in the plant defense response.
Conflict of Interest Statement
The authors declare that the research was conducted in the absence of any commercial or financial relationships that could be construed as a potential conflict of interest.
Acknowledgments
We thank members in the Yao and Ren laboratories for assistance with this work. This work was supported by the National Key Basic Science 973 Program (2012CB114006), National Natural Science Foundation of China (31170247), and the National Basic Scientific Training Funds (J1310025).
Supplementary Material
The Supplementary Material for this article can be found online at: http://www.frontiersin.org/journal/10.3389/fpls.2015.00186/abstract
References
Allen, D. K., Libourel, I. G. L., and Shachar-Hill, Y. (2009). Metabolic flux analysis in plants: coping with complexity. Plant Cell Environ. 32, 1241–1257. doi: 10.1111/j.1365-3040.2009.01992.x
PubMed Abstract | Full Text | CrossRef Full Text | Google Scholar
Bi, F.-C., Liu, Z., Wu, J.-X., Liang, H., Xi, X.-L., Fang, C., et al. (2014). Loss of ceramide kinase in Arabidopsis impairs defenses and promotes ceramide accumulation and mitochondrial H2O2 bursts. Plant Cell 26, 3449–3467. doi: 10.1105/tpc.114.127050
PubMed Abstract | Full Text | CrossRef Full Text | Google Scholar
Brandwagt, B. F., Mesbah, L. A., Takken, F. L., Laurent, P. L., Kneppers, T. J., Hille, J., et al. (2000). A longevity assurance gene homolog of tomato mediates resistance to Alternaria alternata f. sp. lycopersici toxins and fumonisin B1. Proc. Natl. Acad. Sci. U.S.A. 97, 4961–4966. doi: 10.1073/pnas.97.9.4961
PubMed Abstract | Full Text | CrossRef Full Text | Google Scholar
Brodersen, P., Petersen, M., Pike, H. M., Olszak, B., Skov, S., Oedum, N., et al. (2002). Knockout of Arabidopsis ACCELERATED CELL-DEATH11 encoding a sphingosine transfer protein causes activation of programmed cell death and defense. Genes Dev. 16, 490–502. doi: 10.1101/gad.218202
PubMed Abstract | Full Text | CrossRef Full Text | Google Scholar
Chen, M., Cahoon, E. B., Saucedo-García, M., Plasencia, J., and Gavilanes-Ruíz, M. (2009). “Plant sphingolipids: structure, synthesis and function,” in Lipids in Photosynthesis: Essential and Regulatory Functions, eds H. Wada and N. Murata (Dordrecht: Springer), 77–115.
Dal'Molin, C. G. D., Quek, L., Palfreyman, R. W., Brumbley, S. M., and Nielsen, L. K. (2010). AraGEM, a genome-scale reconstruction of the primary metabolic network in Arabidopsis. Plant Physiol. 152, 579–589. doi: 10.1104/pp.109.148817
PubMed Abstract | Full Text | CrossRef Full Text | Google Scholar
Delwiche, C. F., and Sharkey, T. D. (1993). Rapid appearance of 13C in biogenic isoprene when 13CO2 is fed to intact leaves. Plant Cell Environ. 16, 587–591. doi: 10.1111/j.1365-3040.1993.tb00907.x
Durner, J., and Klessig, D. F. (1995). Inhibition of ascorbate peroxidase by salicylic acid and 2,6-dichloroisonicotinic acid, two inducers of plant defense responses. Proc. Natl. Acad. Sci. U.S.A. 92, 11312–11316. doi: 10.1073/pnas.92.24.11312
PubMed Abstract | Full Text | CrossRef Full Text | Google Scholar
Durner, J., and Klessig, D. F. (1996). Salicylic acid is a modulator of tobacco and mammalian catalases. J. Biol. Chem. 271, 28492–28501. doi: 10.1074/jbc.271.45.28492
PubMed Abstract | Full Text | CrossRef Full Text | Google Scholar
Edwards, J. S., Ibarra, R. U., and Palsson, B. O. (2001). In silico predictions of Escherichia coli metabolic capabilities are consistent with experimental data. Nat. Biotechnol. 19, 125–130. doi: 10.1038/84379
PubMed Abstract | Full Text | CrossRef Full Text | Google Scholar
Edwards, J. S., and Palsson, B. O. (2000). The Escherichia coli MG1655 in silico metabolic genotype: its definition, characteristics, and capabilities. Proc. Natl. Acad. Sci. U.S.A. 97, 5528–5533. doi: 10.1073/pnas.97.10.5528
PubMed Abstract | Full Text | CrossRef Full Text | Google Scholar
Fiehn, O., Kopka, J., Dörmann, P., Altmann, T., Trethewey, R. N., and Willmitzer, L. (2000). Metabolite profiling for plant functional genomics. Nat. Biotechnol. 18, 1157–1161. doi: 10.1038/81137
PubMed Abstract | Full Text | CrossRef Full Text | Google Scholar
Greenberg, J. T., Silverman, F. P., and Liang, H. (2000). Uncoupling salicylic acid dependent cell death and defense-related responses from disease resistance in the Arabidopsis mutant acd5. Genetics 156, 341–350.
Hannun, Y. A., and Obeid, L. M. (2008). Principles of bioactive lipid signalling: lessons from sphingolipids. Nat. Rev. 9, 139–150. doi: 10.1038/nrm2329
PubMed Abstract | Full Text | CrossRef Full Text | Google Scholar
Hasunuma, T., Harada, K., Miyazawa, S., Kondo, A., Fukusaki, E., and Miyake, C. (2010). Metabolic turnover analysis by a combination of in vivo 13C-labelling from 13CO2 and metabolic profiling with CE-MS/MS reveals rate-limiting steps of the C3 photosynthetic pathway in Nicotiana tabacum leaves. J. Exp. Bot. 61, 1041–1051. doi: 10.1093/jxb/erp374
Hirner, A., Ladwig, F., Stransky, H., Okumoto, S., Keinath, M., Harms, A., et al. (2006). Arabidopsis LHT1 is a high-affinity transporter for cellular amino acid uptake in both root epidermis and leaf mesophyll. Plant Cell 18, 1931–1946. doi: 10.1105/tpc.106.041012
PubMed Abstract | Full Text | CrossRef Full Text | Google Scholar
Hucka, M., Finney, A., Sauro, H. M., Bolouri, H., Doyle, J. C., Kitano, H., et al. (2003). The systems biology markup language (SBML): a medium for representation and exchange of biochemical network models. Bioinformatics 19, 524–531. doi: 10.1093/bioinformatics/btg015
PubMed Abstract | Full Text | CrossRef Full Text | Google Scholar
Jones, J. D. G., and Dangl, J. L. (2006). The plant immune system. Nature 444, 323–329. doi: 10.1038/nature05286
PubMed Abstract | Full Text | CrossRef Full Text | Google Scholar
Kanehisa, M., Araki, M., Goto, S., Hattori, M., Hirakawa, M., Itoh, M., et al. (2008). KEGG for linking genomes to life and the environment. Nucleic Acids Res. 36, D480–D484. doi: 10.1093/nar/gkm882
PubMed Abstract | Full Text | CrossRef Full Text | Google Scholar
Keating, S. M., Bornstein, B. J., Finney, A., and Hucka, M. (2006). SBMLToolbox: an SBML toolbox for MATLAB users. Bioinformatics 22, 1275–1277. doi: 10.1093/bioinformatics/btl111
PubMed Abstract | Full Text | CrossRef Full Text | Google Scholar
König, S., Feussner, K., Schwarz, M., Kaever, A., Iven, T., Landesfeind, M., et al. (2012). Arabidopsis mutants of sphingolipid fatty acid a-hydroxylases accumulate ceramides and salicylates. New Phytol. 196, 1086–1097. doi: 10.1111/j.1469-8137.2012.04351.x
PubMed Abstract | Full Text | CrossRef Full Text | Google Scholar
Kruger, N. J., Masakapalli, S. K., and Ratcliffe, R. G. (2012). Strategies for investigating the plant metabolic network with steady-state metabolic flux analysis: lessons from an Arabidopsis cell culture and other systems. J. Exp. Bot. 63, 2309–2323. doi: 10.1093/jxb/err382
PubMed Abstract | Full Text | CrossRef Full Text | Google Scholar
Lawton, K. A., Friedrich, L., Hunt, M., Weymann, K., Delaney, T., Kessmann, H., et al. (1996). Benzothiadiazole induces disease resistance in Arabidopsis by activation of systemic acquired resistance signal transduction pathway. Plant J. 10, 71–82. doi: 10.1046/j.1365-313X.1996.10010071.x
PubMed Abstract | Full Text | CrossRef Full Text | Google Scholar
Liang, H., Yao, N., Song, J. T., Luo, S., Lu, H., and Greenberg, J. T. (2003). Ceramides modulate programmed cell death in plants. Genes Dev. 17, 2636–2641. doi: 10.1101/gad.1140503
PubMed Abstract | Full Text | CrossRef Full Text | Google Scholar
Libourel, I. G. L., and Shachar-Hill, Y. (2008). Metabolic flux analysis in plants: from intelligent design to rational engineering. Annu. Rev. Plant Biol. 59, 625–650. doi: 10.1146/annurev.arplant.58.032806.103822
PubMed Abstract | Full Text | CrossRef Full Text | Google Scholar
Lonien, J., and Schwender, J. (2009). Analysis of metabolic flux phenotypes for two Arabidopsis mutants with severe impairment in seed storage lipid synthesis. Plant Physiol. 151, 1617–1634. doi: 10.1104/pp.109.144121
PubMed Abstract | Full Text | CrossRef Full Text | Google Scholar
Mahadevan, R., and Schilling, C. H. (2003). The effects of alternate optimal solutions in constraint-based genome-scale metabolic models. Metab. Eng. 5, 264–276. doi: 10.1016/j.ymben.2003.09.002
PubMed Abstract | Full Text | CrossRef Full Text | Google Scholar
Markham, J. E., Lynch, D. V., Napier, J. A., Dunn, T. M., and Cahoon, E. B. (2013). Plant sphingolipids: function follows form. Curr. Opin. Plant Biol. 16, 350–357. doi: 10.1016/j.pbi.2013.02.009
PubMed Abstract | Full Text | CrossRef Full Text | Google Scholar
Markham, J. E., Molino, D., Gissot, L., Bellec, Y., Hématy, K., Marion, J., et al. (2011). Sphingolipids containing very-long-chain fatty acids define a secretory pathway for specific polar plasma membrane protein targeting in Arabidopsis. Plant Cell 23, 2362–2378. doi: 10.1105/tpc.110.080473
Masakapalli, S. K., Le Lay, P., Huddleston, J. E., Pollock, N. L., Kruger, N. J., and Ratcliffe, R. G. (2010). Subcellular flux analysis of central metabolism in a heterotrophic Arabidopsis cell suspension using steady-state stable isotope labeling. Plant Physiol. 152, 602–619. doi: 10.1104/pp.109.151316
Meng, P. H., Raynaud, C., Tcherkez, G., Blanchet, S., Massoud, K., Domenichini, S., et al. (2009). Crosstalks between Myo-Inositol Metabolism, Programmed Cell Death and Basal Immunity in Arabidopsis. PLoS ONE 4:e7364. doi: 10.1371/journal.pone.0007364
PubMed Abstract | Full Text | CrossRef Full Text | Google Scholar
Miura, K., and Tada, Y. (2014). Regulation of water, salinity, and cold stress responses by salicylic acid. Front. Plant Sci. 5:4. doi: 10.3389/fpls.2014.00004
PubMed Abstract | Full Text | CrossRef Full Text | Google Scholar
Moore, A. L., Albury, M. S., Crichton, P. G., and Affourtit, C. (2002). Function of the alternative oxidase: is it still a scavenger? Trends Plant Sci. 7, 478–481. doi: 10.1016/S1360-1385(02)02366-X
PubMed Abstract | Full Text | CrossRef Full Text | Google Scholar
Mueller, L. A., Zhang, P., and Rhee, S. Y. (2003). AraCyc: a biochemical pathway database for Arabidopsis. Plant Physiol. 132, 453–460. doi: 10.1104/pp.102.017236
PubMed Abstract | Full Text | CrossRef Full Text | Google Scholar
Noack, S., Nöh, K., Moch, M., Oldiges, M., and Wiechert, W. (2010). Stationary versus non-stationary 13C-MFA: a comparison using a consistent dataset. J. Biotechnol. 154, 179–190. doi: 10.1016/j.jbiotec.2010.07.008
Nöh, K., and Wiechert, W. (2011). The benefits of being transient: isotope-based metabolic flux analysis at the short time scale. Appl. Microbiol. Biotechnol. 91, 1247–1265. doi: 10.1007/s00253-011-3390-4
PubMed Abstract | Full Text | CrossRef Full Text | Google Scholar
Oberhardt, M. A., Goldberg, J. B., Hogardt, M., and Papin, J. A. (2010). Metabolic network analysis of Pseudomonas aeruginosa during chronic cystic fibrosis lung infection. J. Bacteriol. 192, 5534–5548. doi: 10.1128/JB.00900-10
PubMed Abstract | Full Text | CrossRef Full Text | Google Scholar
Ozbayraktar, F. B. K., and Ulgen, K. O. (2011). Stoichiometric network reconstruction and analysis of yeast sphingolipid metabolism incorporating different states of hydroxylation. Biosystems 104, 63–75. doi: 10.1016/j.biosystems.2011.01.001
PubMed Abstract | Full Text | CrossRef Full Text | Google Scholar
Pata, M. O., Hannun, Y. A., and Ng, C. K. (2009). Plant sphingolipids: decoding the enigma of the Sphinx. New Phytol. 185, 611–630. doi: 10.1111/j.1469-8137.2009.03123.x
PubMed Abstract | Full Text | CrossRef Full Text | Google Scholar
Poolman, M. G., Miguet, L., Sweetlove, L. J., and Fell, D. A. (2009). A genome-scale metabolic model of Arabidopsis and some of its properties. Plant Physiol. 151, 1570–1581. doi: 10.1104/pp.109.141267
PubMed Abstract | Full Text | CrossRef Full Text | Google Scholar
Radrich, K., Tsuruoka, Y., Dobson, P., Gevorgyan, A., Swainston, N., Baart, G., et al. (2010). Integration of metabolic databases for the reconstruction of genome-scale metabolic networks. BMC Syst. Biol. 4:114. doi: 10.1186/1752-0509-4-114
PubMed Abstract | Full Text | CrossRef Full Text | Google Scholar
Reed, J. L., and Palsson, B. O. (2003). Thirteen years of building constraint based in silico models of Escherichia coli. J. Bacteriol. 185, 2692–2699. doi: 10.1128/JB.185.9.2692-2699.2003
PubMed Abstract | Full Text | CrossRef Full Text | Google Scholar
Saucedo-García, M., Guevara-García, A., Gonzalez-Solís, A., Cruz-García, F., Vazquez-Santana, S., Markham, J. E., et al. (2011). MPK6, sphinganine and the LCB2a gene from serine palmitoyltransferase are required in the signaling pathway that mediates cell death induced by long chain bases in Arabidopsis. New Phytol. 191, 943–957. doi: 10.1111/j.1469-8137.2011.03727.x
PubMed Abstract | Full Text | CrossRef Full Text | Google Scholar
Schellenberger, J., Que, R., Fleming, R. M., Thiele, I., Orth, J. D., Feist, A. M., et al. (2011). Quantitative prediction of cellular metabolism with constraint-based models: the COBRA Toolbox v2.0. Nat. Protoc. 6, 1290–1307. doi: 10.1038/nprot.2011.308
PubMed Abstract | Full Text | CrossRef Full Text | Google Scholar
Schmidt, H., and Jirstrand, M. (2006). Systems Biology Toolbox for MATLAB: a computational platform for research in systems biology. Bioinformatics 22, 514–515. doi: 10.1093/bioinformatics/bti799
PubMed Abstract | Full Text | CrossRef Full Text | Google Scholar
Schwender, J. (2008). Metabolic flux analysis as a tool in metabolic engineering of plants. Curr. Opin. Biotechnol. 19, 131–137. doi: 10.1016/j.copbio.2008.02.006
PubMed Abstract | Full Text | CrossRef Full Text | Google Scholar
Seaver, S. M. D., Henry, C. S., and Hanson, A. D. (2012). Frontiers in metabolic reconstruction and modeling of plant genomes. J. Exp. Bot. 63, 2247–2258. doi: 10.1093/jxb/err371
PubMed Abstract | Full Text | CrossRef Full Text | Google Scholar
Shimono, M., Sugano, S., Nakayama, A., Jiang, C. J., Ono, K., Toki, S., et al. (2007). Rice WRKY45 plays a crucial role in benzothiadiazole-inducible blast resistance. Plant Cell 19, 2064–2076. doi: 10.1105/tpc.106.046250
PubMed Abstract | Full Text | CrossRef Full Text | Google Scholar
Slaymaker, D. H., Navarre, D. A., Clark, D., del Pozo, O., Martin, G. B., and Klessig, D. F. (2002). The tobacco salicylic acid-binding protein 3 (SABP3) is the chloroplast carbonic anhydrase, which exhibits antioxidant capacity and plays a role in the hypersensitive response. Proc. Natl. Acad. Sci. U.S.A. 99, 11640–11645. doi: 10.1073/pnas.182427699
Smith, A. M., and Stitt, M. (2007). Coordination of carbon supply and plant growth. Plant Cell Environ. 30, 1126–1149. doi: 10.1111/j.1365-3040.2007.01708.x
PubMed Abstract | Full Text | CrossRef Full Text | Google Scholar
Spoel, S. H., and Dong, X. N. (2012). How do plants achieve immunity? Defence without specialized immune cells. Nat. Rev. Immunol. 12, 89–100. doi: 10.1038/nri3141
PubMed Abstract | Full Text | CrossRef Full Text | Google Scholar
Stitt, M., Sulpice, R., and Keurentjes, J. (2010). Metabolic networks: how to identify key components in the regulation of metabolism and growth. Plant Physiol. 152, 428–444. doi: 10.1104/pp.109.150821
PubMed Abstract | Full Text | CrossRef Full Text | Google Scholar
Sweetlove, L. J., and Ratcliffe, R. G. (2011). Flux-balance modeling of plant metabolism. Front. Plant Sci. 2:38. doi: 10.3389/fpls.2011.00038
PubMed Abstract | Full Text | CrossRef Full Text | Google Scholar
Ternes, P., Feussner, K., Werner, S., Lerche, J., Iven, T., Heilmann, I., et al. (2011). Disruption of the ceramide synthase LOH1 causes spontaneous cell death in Arabidopsis thaliana. New Phytol. 192, 841–854. doi: 10.1111/j.1469-8137.2011.03852.x
PubMed Abstract | Full Text | CrossRef Full Text | Google Scholar
Thiele, I., and Palsson, B. O. (2010). A protocol for generating a high-quality genome-scale metabolic reconstruction. Nat. Protoc. 5, 93–121. doi: 10.1038/nprot.2009.203
PubMed Abstract | Full Text | CrossRef Full Text | Google Scholar
van Leeuwen, H., Kliebenstein, D. J., West, M. A., Kim, K., van Poecke, R., Katagiri, F., et al. (2007). Natural variation among Arabidopsis thaliana accessions for transcriptome response to exogenous salicylic acid. Plant Cell 19, 2099–2110. doi: 10.1105/tpc.107.050641
PubMed Abstract | Full Text | CrossRef Full Text | Google Scholar
Varma, A., and Palsson, B. O. (1994). Metabolic flux balancing: basic concepts, scientific and practical use. Nat. Biotechnol. 12, 994–998. doi: 10.1038/nbt1094-994
Vicente, M. R., and Plasencia, J. (2011). Salicylic acid beyond defence: its role in plant growth and development. J. Exp. Bot. 62, 3321–3338. doi: 10.1093/jxb/err031
PubMed Abstract | Full Text | CrossRef Full Text | Google Scholar
Vlot, A. C., Dempsey, D. A., and Klessig, D. F. (2009). Salicylic acid, a multifaceted hormone to combat disease. Annu. Rev. Phytopathol. 47, 177–206. doi: 10.1146/annurev.phyto.050908.135202
PubMed Abstract | Full Text | CrossRef Full Text | Google Scholar
Wang, D., Amornsiripanitch, N., and Dong, X. N. (2006). A genomic approach to identify regulatory nodes in the transcriptional network of systemic acquired resistance in plants. PLoS Pathog. 2, 1042–1050. doi: 10.1371/journal.ppat.0020123
PubMed Abstract | Full Text | CrossRef Full Text | Google Scholar
Wang, W. M., Yang, X. H., Tangchaiburana, S., Ndeh, R., Markham, J. E., Tsegaye, Y., et al. (2008). An inositolphosphorylceramide synthase is involved in regulation of plant programmed cell death associated with defense in Arabidopsis. Plant Cell. 20, 3163–3179. doi: 10.1105/tpc.108.060053
PubMed Abstract | Full Text | CrossRef Full Text | Google Scholar
Welti, R., Li, W., Li, M., Sang, Y., Biesiada, H., Zhou, H., et al. (2002). Profiling membrane lipids in plant stress responses. J. Bio. Chem. 277, 31194–32002. doi: 10.1074/jbc.M205375200
PubMed Abstract | Full Text | CrossRef Full Text | Google Scholar
Yan, S. P., and Dong, X. N. (2014). Perception of the plant immune signal salicylic acid. Curr. Opin. Plant Biol. 20, 64–68. doi: 10.1016/j.pbi.2014.04.006
PubMed Abstract | Full Text | CrossRef Full Text | Google Scholar
Yoshimoto, K., Hanaoka, H., Sato, S., Kato, T., Tabata, S., Noda, T., et al. (2004). Processing of ATG8s, ubiquitin-like proteins, and their deconjugation by ATG4s are essential for plant autophagy. Plant Cell 16, 2967–2983. doi: 10.1105/tpc.104.025395
PubMed Abstract | Full Text | CrossRef Full Text | Google Scholar
Keywords: ceramides, salicylic acid, sphingolipid
Citation: Shi C, Yin J, Liu Z, Wu J-X, Zhao Q, Ren J and Yao N (2015) A systematic simulation of the effect of salicylic acid on sphingolipid metabolism. Front. Plant Sci. 6:186. doi: 10.3389/fpls.2015.00186
Received: 20 November 2014; Accepted: 08 March 2015;
Published: 25 March 2015.
Edited by:
Loreto Holuigue, Pontificia Universidad Católica de Chile, ChileReviewed by:
Shunyuan Xiao, University of Maryland, USARichard Bostock, University of California, Davis, USA
Lee Sweetlove, University of Oxford, UK
Copyright © 2015 Shi, Yin, Liu, Wu, Zhao, Ren and Yao. This is an open-access article distributed under the terms of the Creative Commons Attribution License (CC BY). The use, distribution or reproduction in other forums is permitted, provided the original author(s) or licensor are credited and that the original publication in this journal is cited, in accordance with accepted academic practice. No use, distribution or reproduction is permitted which does not comply with these terms.
*Correspondence: Nan Yao, State Key Laboratory of Biocontrol, Guangdong Key Laboratory of Plant Resources, Department of Biological Science and Technology, School of Life Sciences, Sun Yat-sen University, Guangzhou 510275, China yaonan@mail.sysu.edu.cn
†Present Address: Zhe Liu, Guangdong Provincial Center for Disease Control and Prevention, Guangzhou, China