
- 1Department of Computer Science and Artificial Intelligence, Universidad de Sevilla, Sevilla, Spain
- 2Molecular Plant Development and Metabolism, Instituto de Bioquímica Vegetal y Fotosíntesis, Consejo Superior de Investigaciones Científicas y Universidad de Sevilla, Sevilla, Spain
Phototrophic eukaryotes are among the most successful organisms on Earth due to their unparalleled efficiency at capturing light energy and fixing carbon dioxide to produce organic molecules. A conserved and efficient network of light-dependent regulatory modules could be at the bases of this success. This regulatory system conferred early advantages to phototrophic eukaryotes that allowed for specialization, complex developmental processes and modern plant characteristics. We have studied light-dependent gene regulatory modules from algae to plants employing integrative-omics approaches based on gene co-expression networks. Our study reveals some remarkably conserved ways in which eukaryotic phototrophs deal with day length and light signaling. Here we describe how a family of Arabidopsis transcription factors involved in photoperiod response has evolved from a single algal gene according to the innovation, amplification and divergence theory of gene evolution by duplication. These modifications of the gene co-expression networks from the ancient unicellular green algae Chlamydomonas reinhardtii to the modern brassica Arabidopsis thaliana may hint on the evolution and specialization of plants and other organisms.
Introduction
Day length, or photoperiod, regulates strategic developmental processes in plants. It constitutes a key external signal to feed the circadian rhythms with the needed information to maintain the set of the day (Imaizumi, 2010) and is also critical to discern seasons (Jackson, 2009). Thus, photoperiodic signals regulate crucial developmental responses such as dormancy; germination; senescence or the transition from vegetative to reproductive stages (Valverde, 2011). The floral transition is one of the most conserved evolutionary processes in angiosperms (Romero and Valverde, 2009; Serrano et al., 2009) due to its central role in producing new plant generations and in the transmission of acquired characteristics. Many of the key genes involved in the floral transition are conserved in an inter-species dependent manner as well as many of the external cues that trigger the reproductive response (Amasino, 2010). According to this, the response to the three most important external agents that control reproduction, namely temperature, nutrients and day length, are regulated by a set of inter-species gene regulatory networks with conserved functions (Ausín et al., 2005).
The photoperiodic flowering pathway involves a series of genes that are influenced by light and circadian signals to orchestrate a response that ensures the best moment of the year to flower. Thus, long-day (LD) plants flower as the day lengthens and short-day (SD) plants flower when days start to shorten. In the model species Arabidopsis, a facultative LD plant, a detailed knowledge of the gene pathways involved in the photoperiod floral transition has been accumulated and solid mechanisms have been proposed to explain its flowering behavior (Fornara et al., 2010). In this pathway, the role of the gene CONSTANS (CO) is crucial because its fine control at several regulatory levels (Valverde et al., 2004) assure that the plant triggers the flowering response exactly at the precise moment of the year. It modulates the expression of the florigen FLOWERING LOCUS T (FT) gene in the leaf vasculature, whose protein, reaching the meristem, triggers the reproductive developmental program, eventually producing flowers (Corbesier et al., 2007). While many genes have been discovered in this regulatory module, dealing with protein stability (Jang et al., 2008; Lázaro et al., 2012), modulating the light response of the proteins (Yu et al., 2008) or their function (Kim et al., 2007), the integration of the pathway within other flowering routes or the output genes that trigger the flowering transition are less known. Due to the characteristic attached-to-the-soil behavior of plants, a complex network of regulatory processes is in the base of their physiological responses. These complex systems can be better analysed employing holistic and integrative approaches (Usadel et al., 2009; Tohge and Fernie, 2012).
The last years have seen a bloom of massive data acquisition techniques to approach plant biology in a holistic and integrative way, particularly in transcriptional information (Metzker, 2010). Microarrays first and Next-Generation Sequencing (NGS) later have provided enormous amount of gene expression data for a multitude of plant species in different physiological/genotypic conditions and developmental stages (Schliesky et al., 2012). These data can also be enriched by further experimental approaches and include this information into the gene co-expression networks generated. Therefore, when trying to analyze the developmental response of a plant to an external condition we can combine data from gene co-expression analyses generated using microarray and/or NGS approaches with physiological data such as the time to flower, the weight of the plant or the chlorophyll content. This helps to associate a particular plant behavior to a particular gene expression pattern. Thus, the levels of complexity poised by the enormous amounts of data generated at different regulatory levels, such as transcriptomics, proteomics and metabolomics can be approached with an integrative and holistic perspective employing network tools to reduce noise and find novel patterns of organization. When an evolutionary approach covering the history of gene networks within the phylogeny of organisms is employed, an interesting relation between function and diverse processes, such as developmental processes, starts to be unveiled. This could help to explain many of the intriguing intertwines between evolution and development observed in different organisms (Müller, 2007).
Sequence similarity constitutes the classical approach to assign potential functions to genes and to study their evolutionary history (Lajoie et al., 2010). This methodology focuses on the comparison between individual genes and do not take into account that genes perform their function in coordination with many other genes. In this respect, sequence similarity has been shown to be incomplete when predicting phenotypic differences between species. For example, the genes involved in the human and chimpanzee brains share very high sequence similarities that do not correspond with the marked phenotypic differences between them (Oldham et al., 2006). Holistic and integrative approaches such as gene co-expression networks that take into account the orchestration among genes are emerging as powerful tools to predict gene function and to infer their evolutionary history. This methodology assumes that if a group of genes are co-expressed they should have similar functions and a common evolutionary history. In these networks, genes are represented as nodes and an edge is established between two nodes if the expression profiles of the corresponding genes exhibit a correlation value high enough to provide evidence of co-expression. The topological analysis of these networks such as the distribution of the number of neighbors of each gene, the number of co-expressed genes for a given gene, can provide information about their function and evolutionary history (Aoki et al., 2007; Usadel et al., 2009).
In this paper, we have studied the evolution of the co-expression sub-networks or modules around the photoperiod central family of CO-Like genes, CONSTANS (CO) homologs, in three model species whose genome is available: the green unicellular alga Chlamydomonas reinhardtii (CrCO gene), the moss Physcomitrella patens (PpCOL genes) and the higher plant Arabidopsis thaliana (AtCOL genes). These species are landmarks of the evolutionary lineage of plants. Microarrays or RNA-seq database experiments have been used to construct gene co-expression networks. Phylogenetic analyses have been combined together with functional enrichment analyses in order to better understand the evolution of the CO-Like (COLs) family between the species and their functional specialization. This combination of gene expression data analysis, gene ontology (GO) term enrichment and phylogenetic studies constitutes a novel methodology to study gene function and evolution. The approach is not restricted to our case study and can be applied to the study of sub-networks or modules of other transcription factors. Through the analysis of the evolution of gene networks we can study gene duplication and diversification and how this has affected the networks. Additionally, our methodology could be a useful tool to identify homologous genes related to the same specific process and therefore predict true gene orthology. Finally, our analysis can also be used to explain why and to what extent different signaling pathways are linked in an organism and, therefore, constitute a valuable tool to understand plant plasticity.
Materials and Methods
Plant, Algal Material, and Growth Conditions
Arabidopsis thaliana 35S:CO-GR (Simon et al., 1996) transgenic lines were grown in MS plates. Seeds were previously incubated 4 days at 4°C in the dark before sowing under 16 h light/8 h dark cycle (long-day, LD) with temperature ranging from 22°C (day) to 18°C (night) at 75 μE/m2 light intensity. In the experiment employing dexamethasone (DEX) 1 μg/mL and cycloheximide (CHX) 1mM chemicals were added 10 days after sowing at ZT0 and leaf samples harvested 4 h after the drug treatment, considering Zeitgeber Time 0 (ZT0) the moment at which the lights are switched on.
Chlamydomonas reinhardtii cell-wall deficient mutant CW15 (Davies and Plaskitt, 1971) and pNIA:CrCO (Serrano et al., 2009) transgenic line were grown in stirred conical cylindrical flasks containing Sueoka NO−3 (Sueoka et al., 1967) under LD conditions in control rooms at 22°C and 50 μE/m2. Algal cells were harvested at 4 days at ZT4, 4 h after the lights went on. Plants and algae were grown in a model SG-1400 phytotron (Radiber SA, Spain).
RNA Isolation and Q-PCR
RNA was isolated from Arabidopsis seedlings (0.1 g leaf tissue) and Chlamydomonas (20 ml of an exponential phase culture) employing, in both cases, the TRIZOL (Invitrogen) protocol as described by the manufacturer. In short, the sample was mixed with 1ml of TRIZOL and 0.2 ml of chloroform, the mixture was then centrifuged at 16,000 g for 10 min at 4°C. The supernatant was treated with 1 volume of 2-propanol, incubated 15 min at room temperature and centrifuged at 16,000 g for 10 min at 4°C. 0.75 ml 3 M LiCl was added to the pellet and incubated for t >10 min at room temperature and centrifuged at 16,000 g for 10 min at 4°C. The pellet was washed with 80% (v/v) ethanol and centrifuged at 16,000 g for 10 min at 4°C. The final RNA sample was suspended in 30 μl of DEPC treated water and quantified employing a ND-1000 Spectrophotometer (Nanodrop).
1 μg of TRIZOL isolated RNA was used to synthesize cDNA employing the Quantitec® Reverse kit (Qiagen) following the instruction recommended by the manufacturer. cDNA was diluted to a final concentration of 10 ng/μL and stored at −20°C until Q-PCR was performed. Primers to amplify the 3′ translated region of AtCO, AtSSS, AtFAD, AtGS, AtZEP, AtWRKY33, AtUBQ10, CrCO, CrSSS, CrFAD, CrGS, CrZEP, CrATG8, and CrTUB (Table 1) were designed employing an Oligo analyzer program (Integrated DNA technologies, http://eu.idtdna.com/analyzer/Applications/OligoAnalyzer/). Q-PCR was performed in a Multicolor Real-Time PCR Detection System iQTM5 from Bio-Rad in a 10 μL reaction: primer concentration 0.2 μM, 10 ng cDNA and 5 μL SensiFAST TM SYBR & Fluorescein Kit (Bioline). Each sample was measured by triplicate. The Q-PCR program consisted in (1) 1 cycle (95°C, 2 min); (2) 40 cycle (95°C, 5 s; 60°C for Arabidopsis primers and 65°C to Chlamydomonas primers, 10 s and 72°C, 6 s) (iii) 1 cycle (72°C, 6 s). Fluorescence was measured at the end of each extension step and the melting curve was performed between 55 and 95°C. The initial concentration of candidate and reference gene was calculated by means of LingRegPCR software version 11.0 (Ruijter et al., 2009). Normalized data was calculated dividing the average of four replicates of each sample of the candidate and reference genes.
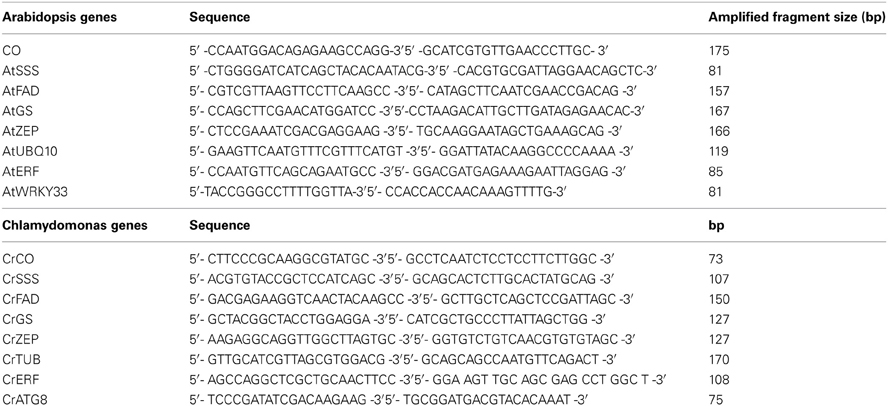
Table 1. Primers employed for Q-PCR experiments.
Phylogenetic Analysis
Evolutionary relationships among the CO-Like genes of Chlamydomonas, Physcomitrella and Arabidopsis were analyzed using predicted amino-acid sequences from Phytozome v9.0 and aligned with the program MUSCLE (Edgar, 2004). This alignment was then used to generate a phylogenetic tree applying the Neighbor-Joining algorithm (Saitou and Nei, 1987) with the JTT+G 1.53 as substitution model (Jones et al., 1992). The bootstrap consensus tree inferred from 1000 replicates is taken to represent the evolutionary history of the analyzed proteins. The tree is drawn to scale, with branch lengths in the same units as those of the evolutionary distances used to infer the phylogenetic tree. Phylogenetic analyzes were conducted with MEGA5 (Tamura et al., 2011). Accession numbers of sequences used in the alignment are shown in Table 2.
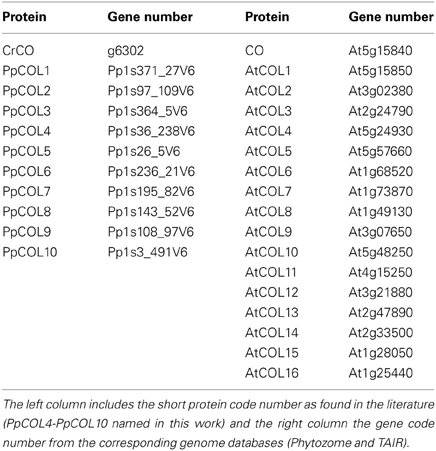
Table 2. COL protein family in Clamydomonas, Physcomitrella, and Arabidopsis employed in the phylogenetic studies of this work.
Identification of Conserved Motifs
The sequences of COL proteins from the different plants and algae were analyzed using the MEME program (http://meme.nbcr.net/meme/) as described by Bailey et al. (2009). Only the three main motifs (2 B-boxes and CCT domain) were represented. The motifs were characterized using the Conserved Domain Search Service (http://www.ncbi.nlm.nih.gov/Structure/cdd/wrpsb.cgi) (Marchler-Bauer and Bryant, 2004).
Data Compilation and Processing
This study is based on an ensemble of more than one TeraByte transcriptomic data from Chlamydomonas, Physcomitrella, and Arabidopsis obtained under related physiological and genotype conditions (Table 3). These data comprise RNA-seq experiments from the public database, the Sequence Read Archive (SRA, http://www.ncbi.nlm.nih.gov/Traces/sra/) (Wheeler et al., 2005) and microarray data from the Array Express Archive (ArrayExpress, http://www.ebi.ac.uk/arrayexpress/) (Rustici et al., 2013). For Chlamydomonas 50 RNA-seq data sets representing eight different genotypes under diverse physiological conditions (González-Ballester et al., 2010; Miller et al., 2010; Castruita et al., 2011; Kropat et al., 2011; Boyle et al., 2012; Fischer et al., 2012; Urzica et al., 2012) were analyzed. For Physcomitrella 13 RNA-seq data sets representing two different genotypes (Zemach et al., 2010; Xiao et al., 2011; Chen et al., 2012) were analyzed. Finally, in order to use comparable conditions Arabidopsis microarray data from experiments under similar conditions to those from Chlamydomonas and Physcomitrella (Gutiérrez et al., 2007; Long et al., 2010; Patterson et al., 2010; Iyer-Pascuzzi et al., 2011; Cheng et al., 2013) were analyzed. The experimental conditions analyzed in this study are diverse enough to capture the true co-expression among genes. These conditions include nutrient deficiency (nitrogen, iron, copper, and sulfur deprivation), oxidative stress, light stimuli, DNA damage and different developmental stages (Table 3).
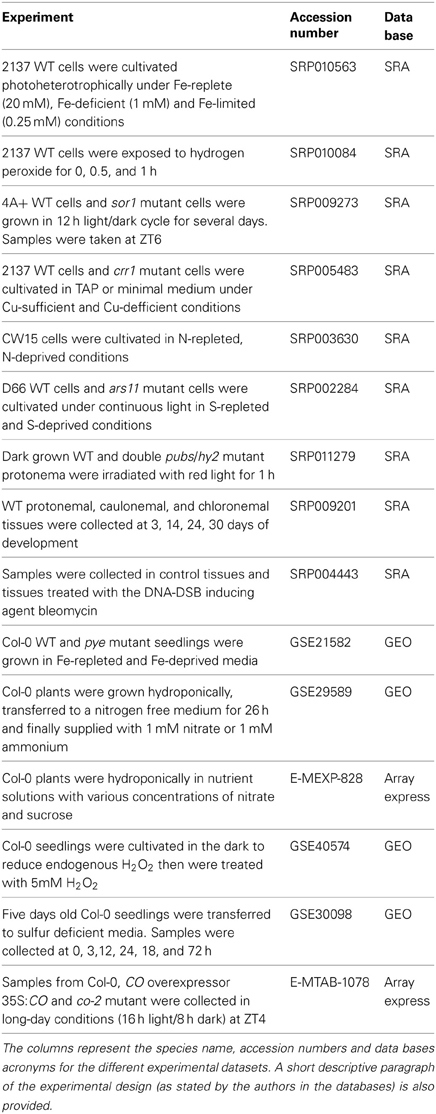
Table 3. Description of the experiments and datasets employed in this work.
An estimation of gene expression in the transcriptomes generated in the different conditions under study was obtained following the methodology described in Trapnell et al. (2012). This approach uses a reference genome for each species. The Chlamydomonas reference genome corresponds to the release v5.3 which is assembled into 17 chromosomes and 37 additional unmapped scaffolds. The Chlamydomonas genomic information is based on the Augustus update u11.6. For Physcomitrella we used the reference genome release v1.6 which is assembled into 2106 scaffolds that have not been mapped yet to the 27 chromosomes that constitute its genome. The Physcomitrella genomic information is based on the Cosmoss update v1.6. Finally, the Arabidopsis genomic information is based on the TAIR v10 resource. This annotation and genome information was downloaded from Phytozome (http://www.phytozome.net), a web-based platform for green plant comparative genomics (Goodstein et al., 2012).
The workflow followed in the RNA-seq data processing is sketched in Figure 1 and detailed in Figure S1. The first step consisted on the alignment of the short read sequences stored in fastq files to the corresponding reference genome using the software package Tophat (Trapnell et al., 2009) to produce BAM files (binary alignment maps). In the second step these files together with the gene annotation information available were used to assemble the whole transcriptomes of Chlamydomonas and Physcomitrella under the conditions studied. The assembled transcriptomes were stored in GTF files and resolved using the software package Cufflinks and its program Cuffmerge (Trapnell, 2010). Finally, gene expression levels from the different conditions integrated in our study were estimated using Cuffdiff, a program included in the Cufflinks package that takes as input the alignments files (BAM files) and the assembled whole transcriptomes (GTF files). In order to avoid biases due to the length of the different transcripts and number of reads generated in each experiment, Cufflinks estimates gene expression using as unit of measurement the Fragments Per Kb of exon per Million mapped reads (FPKM) (Mortazavi et al., 2008). For the rest of the analysis, exploration, manipulation and visualization of the data generated by Cufflinks we used the R package cummeRbund (Goff et al., 2011).
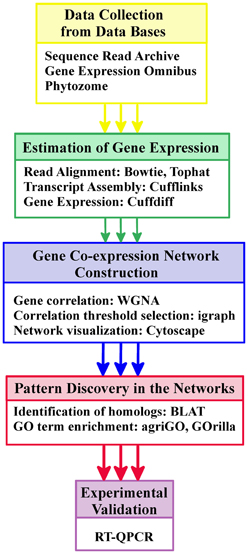
Figure 1. Schematic workflow including data collection and processing as well as gene co-expression network construction, analysis and validation. The figure simplifies the main steps followed in the workflow for the construction and analysis of the co-expression networks for Chlamydomonas, Physcomitrella, and Arabidopsis. This workflow requires a reference genome and the corresponding Gene Ontology annotation for each species. The annotation was obtained from the Phytozome database. Gene expression estimation measured in FPKM was obtained by aligning short reads to the reference genome and assembling transcripts using Tophat and Cufflinks. Gene correlation and network construction were performed with different Bioconductor R packages. Cytoscape was used for network visualization. Functional patterns in the neighborhood of the genes of interest were identified with the web tools agriGO and GOrilla. Finally, Q-PCR was used for experimental validation. A detailed representation of this workflow can be seen in Figure S1.
The analysis of the affymetrix ath1-121501 microarray data obtained for Arabidopsis was performed following the methodology described in Hahne et al. (2008). The R package affy (Gautier et al., 2004) from the Bioconductor project (Gentleman et al., 2004) was used for quality control, background correction, normalization with the RMA algorithm (Irizarry et al., 2003), and estimation of gene expression levels in the different conditions under study in this work.
Results and Discussion
Construction of Gene Co-Expression Networks for Chlamydomonas, Physcomitrella, and Arabidopsis
In this analysis, significant co-expression patterns among genes in the transcriptomes of Chlamydomonas, Physcomitrella, and Arabidopsis have been determined analysing the massive amount of gene expression data (see Materials and Methods section) that covers a wide variety of physiological conditions and genotypes (Figure 1). These co-expression patterns were represented using three different gene co-expression networks, one for each species considered in this study representing key steps in the evolution of photosynthetic organisms.
First, in order to remove noise, only those genes that exhibited significant changes in at least one comparison between a condition and its corresponding control, were selected from the studied transcriptomes. This was performed according to the standard approach used for microarray data and its adaptation to the analysis of RNA-seq data (Bullard et al., 2010). The logarithm of the gene expression level measured in FPKM was computed and, using the delta method, the variance of the log odds estimated. Differentially expressed genes were then selected combining this information with a fold-change criterion of two in the expression level with respect to the corresponding control.
Next, the expression profiles of the differentially expressed genes were extracted from the gene expression data generated according to the workflow presented in Materials and Methods section. The absolute value of the Pearson correlation coefficient between gene expression profiles was used as a measurement of the level of co-expression between the corresponding genes.
Finally, it was necessary to establish a correlation threshold above which it was assumed that two genes are significantly co-expressed. For the rational selection of a gene correlation threshold a criterion that seeks the generation of a scale-free network with a high density was used. This criterion was chosen since most biological networks characterized so far exhibit this scale-free property (Barabasi and Albert, 1999) and because a high-density network facilitates the identification of patterns in the neighborhood of genes (Aoki et al., 2007). For each species, the correlation value for which the R2 of the linear regression for the logarithmic transform of the node degree distribution presented a maximum while keeping an average of ~20 neighbors per gene was determined. For Chlamydomonas reinhardtii the correlation threshold was 0.90, producing a R2 of 0.9274 and a p-value of 3.397e-08 for the scale-free property. For Physcomitrella patens the correlation threshold was 0.94 producing a R2 of 0.9333 and a p-value of 8.242e-08 for the scale-free property. For Arabidopsis thaliana the correlation threshold was 0.90, producing a R2 of 0.7827 and a p-value of 2.964e-04 for the scale-free property.
According to the above methodology three co-expression networks in which edges between genes represent significant co-expression patterns in the analysed conditions were generated. The gene co-expression network for Chlamydomonas consisted of 8443 genes and 138,575 significant co-expression relationships. For Physcomitrella the corresponding network was constituted by 9080 genes connected by 518,209 significant co-expression relationships. Finally, the gene co-expression network for Arabidopsis represented 6204 genes and their 665,034 co-expression relationships. These networks were imported into the software package Cytoscape (Smoot et al., 2011) for their visualization using the organic layout (Figure 2). The corresponding Cytoscape files containing the specification of each network can be downloaded from the link http://ackermann.cs.us.es/web_network/chlamy_physco_arabidopsis.zip for further exploration and analysis.
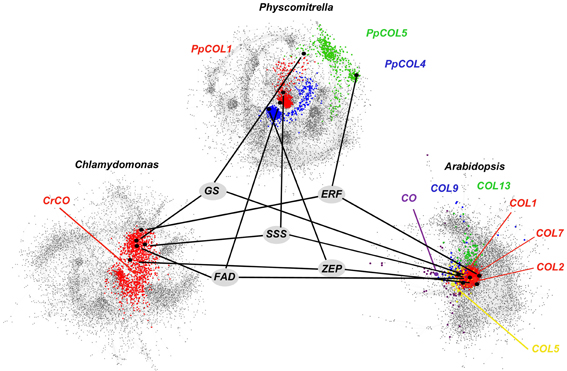
Figure 2. Gene co-expression networks for Chlamydomonas, Physcomitrella, and Arabidopsis. In the networks, nodes represent genes and edges between nodes show significant co-expression relation between them. CrCO, PpCOLs, and AtCOLs and their neighborhoods (genes three edges apart) are highlighted with different colors. In the Chlamydomonas network (bottom left) CrCO and its neighborhood (red color) occupy a central position suggesting its role as an essential regulator in the Chlamydomonas transcriptome. In the Physcomitrella network (top center) PpCOL1, PpCOL4 and their neighborhoods (red and blue colors, respectively) occupy a central position, while PpCOL5 (green color) is located in the periphery of the network. In the Arabidopsis network (bottom right) AtCOLs genes (different colors) are widely spread over the network indicating their role in multiple biological processes. Functional conservation, specialization and divergence during the evolutionary line of COLs can be observed in their neighborhood. Consistently, CrCO, PpCOLs, and AtCOLs genes are co-expressed with genes involved in light response (ZEP, Zeaxanthin epoxidase), starch metabolism (SSS, solubale starch synthase), nitrogen metabolism (GS, cytosolic glutamine synthase) and response to chemical stimulus (ERF, ethylene response factor) as it is suggested by their nearby localization in the corresponding networks.
In the Evolutionary History of the CO-like Gene Family from Chlamydomonas to Arabidopsis Both Essential and Secondary Genes can be Identified
The location of genes in co-expression networks and the size of their nearby neighborhood can be used to determine their relevance in the entire transcriptome of the corresponding organism in the conditions under study (Aoki et al., 2007). The three gene co-expression networks analysed in this work are scale-free networks. In this type of networks most nodes are connected with few others. Nevertheless, there exists a small set of nodes that are connected to a large number. These nodes are called hubs (Kleinberg, 1999) and play a key role in the functioning and information propagation in the corresponding networks (Barabasi and Albert, 1999). The hubs in each network were determined using the R package igraph (Csardi and Nepusz, 2006). Only genes with a score in the top 5% were considered hubs. The same criterion was used for the three networks. Scale-free networks are robust against random perturbations since these are most likely to hit a node with only a few neighbors and therefore to disrupt only a small portion of the network. Nevertheless, scale-free networks are fragile against perturbations affecting the hub nodes. Therefore, the mutation of a hub node affects a significant number of other nodes connected to it producing a cascade phenomenon that reaches a large part of the entire network (Wang and Chen, 2003). Employing this criterion we can identify central and essential genes as well as peripheral and secondary ones in the evolutionary line from the single gene CrCO in Chlamydomonas to the 17 AtCOL homologues in Arabidopsis (Figure 2 and Figure S2).
In the Chlamydomonas gene co-expression network, CrCO appears located near the core of the network as a hub gene with more than 50 neighbors (Figure 2). This suggests that CrCO is an essential gene in the Chlamydomonas transcriptome under the conditions studied in this work. A CrCO overexpression or mutation would predictably produce a disruption in the functioning of all these neighboring genes that would propagate quickly throughout the network affecting a large number of other genes and the biological processes they are involved in. Therefore, any major change in the expression of CrCO could result in an extensive change in the Chlamydomonas phenotype. This effect has been reported previously (Serrano et al., 2009) where silencing of CrCO using antisense RNA was shown to be detrimental for algal growth. Moreover, overexpression of CrCO was reported to produce massive changes in cellular morphology, chlorophyll content, growth rate and cell-cycle regulation.
Using sequence similarity programs from the Phytozome web portal, ten genes were identified in the Physcomitrella genome exhibiting high similarity (>40%) with the Arabidopsis CO gene (At5g15840) or the Chlamydomonas CrCO gene (g6302). These genes that contained at least one B-box and CCT domain, are identified in the current annotation version v1.6 of the Physcomitrella genome draft (Table 2). Three of these genes have been studied previously (Shimizu et al., 2004; Zobell et al., 2005) and named PpCOL1, PpCOL2, and PpCOL3 respectively. Based on the phylogeny and following the same nomenclature, the rest of the genes were named PpCOL4 to PpCOL10. Only three of these genes PpCOL1, PpCOL4, and PpCOL5 are present in the Physcomitrella gene co-expression network generated here. The rest of the genes either were not expressed in the samples considered in this study or did not exhibit significant co-expression levels with any other gene in the network. This suggests that these genes play their main role in other physiological conditions not studied in this work. PpCOL1 and PpCOL4 are found at the center of the network and although they cannot be regarded as hubs they are connected to other genes that are co-expressed with more than 300 genes. Both genes are placed close to each other suggesting that they may be involved in similar or related biological processes. This would confer redundancy and robustness to the network, so that the alteration in the expression pattern of one of these two genes could be counteracted by the normal function of the other. In this respect, the apparent multiple gene duplication of CrCO that gave rise to the ten-gene family of PpCOLs has produced redundant hub genes offering robustness to the transcriptome of Physcomitrella. The CrCO descendant gene in the Physcomitrella network, PpCOL5, appears in the periphery of the gene co-expression network acting as a hub with 122 neighboring genes. Therefore, PpCOL5 seems to be a key gene involved in secondary biological processes in this Physcomitrella transcriptome since the genes of this cluster are somehow disconnected from the rest of the network (Figure 2). This may suggest that, although a major modification of the expression of PpCOL5 would not be lethal, it could massively disrupt the biological processes in which it is involved.
Finally, in the Arabidopsis gene co-expression network, seven AtCOL genes out of a 17-member gene family (Table 2) have been identified. These are CO, COL1, COL2, COL5, COL7, COL9, and COL13. The other AtCOL genes were not significantly expressed in the conditions considered in this study possibly because they are involved in biological processes not studied here. These AtCOLs appear spread all over the network, suggesting that they are involved in a large number of biological processes covering an important part of the transcriptome. COL1, COL2, and COL7 are closely arranged at the core of the network (red cluster in Figure 2). In fact, COL1 and COL2 are directly connected. The three of them have more than 150 neighbors each and could independently be considered hubs playing a key role in the function and transmission of information in the core of the network. Since these genes are located near each other they are probably involved in related biological processes. A major disruption in the expression pattern of one of these three genes could be easily compensated by the correct functioning of the other two. In fact, single mutations in either COL1 or COL2 show no significant effect in the plant (Ledger et al., 2001). Therefore, it could be predicted that, in order to observe any appreciable change in the phenotype a multiple mutant should be generated. This seems to indicate that the new events of gene duplication that took place between Physcomitrella and Arabidopsis have increased the number of redundant hub genes and, as a consequence, the robustness against external perturbations of its transcriptome. The rest of the AtCOLs in our network are distributed toward the periphery and present fewer neighboring genes. It could be inferred then that these genes are not essential hubs and could be involved in secondary processes. For example, a mutation in CO limits its effects to the capacity of the plant to flower in response to photoperiod (Rédei, 1962) and its overexpression results mainly in an early flowering phenotype (Putterill et al., 1995). Secondary phenotypic effects not observed in the mutant could arise due to CO overexpression assuming the function of other AtCOLs. In a similar situation, COL5 and COL9 are located nearby CO and their overexpression have been reported to produce a mild early flowering and late flowering phenotypes, respectively (Cheng and Wang, 2005; Hassidim et al., 2009). For COL13 its situation in the network is analogous but the effect of its mutation or overexpression has not been studied. A similar flowering phenotype could be predicted for this gene when overexpressed.
The Gene Neighborhoods of CrCO, PpCOLs, and AtCOLs Reveal Conservation of Co-Expressed Biological Processes Across the Plant Evolutionary Lineage
In order to study the different biological processes associated to the genes that constitute the evolutionary line from the single copy CrCO in Chlamydomonas to the 17 AtCOLs in Arabidopsis (Figure S2), their neighborhood in the corresponding networks was characterized. For this reason, genes at a distance of at least three, that is, those genes that can be reached using paths with three edges from the genes of interest, were selected. Next, GO (The Gene Ontology Consortium, 2000) term enrichment over the annotation of these genes using the web-based software tools GOrilla (Eden et al., 2009) and AgriGO (Du et al., 2010) was performed, taking the entire genome as background. In the case of Arabidopsis we were able to use directly the GO annotation information available at the resource TAIR v.10. Nevertheless, for Physcomitrella and Chlamydomonas such information is not available due to the lack of previous experimental studies. Instead, for these species, GO annotation inferred from the information in Phytozome and Pfam (Punta et al., 2012) about the protein families to which each gene-encoded protein belongs was used.
First, for the GO enrichment in each one of the three networks, the union of the neighborhood of the corresponding COL genes under study, was considered. More specifically, for Chlamydomonas, Physcomitrella, and Arabidopsis the set of genes used to perform GO enrichment were the neighbors at a distance of three of CrCO, any of the PpCOLs and any of the AtCOLs, respectively. At a first glance, a high overlapping between the significantly enriched GO terms in the previous three sets of neighboring genes could be observed. This indicates that the different biological processes in which CrCO, some PpCOLs and AtCOLs are involved are largely conserved across the species evolution. Additionally, new biological processes appeared in the enrichment of the corresponding sets of genes in Physcomitrella and Arabidopsis that both species share in common (Table 3). This provides evidences of newly acquired influence over different processes in Physcomitrella that are afterwards conserved and expanded in Arabidopsis.
One of the most significantly enriched GO terms in the regions under study in the three networks from Chlamydomonas to Arabidopsis is Response to light stimulus. Genes located in the neighborhood of CrCO, PpCOLs, and AtCOLs significantly include genes involved in photoperception such as Cryptochromes (CRY) (Cre06.g295200, Pp1s488_10V6, At4g08920), in redox processes regulated by light such as Zeaxanthin epoxidase (ZEP) (Cre02.g095750, Pp1s321_9V6, At5g67030) and Cytochrome P450 (CYP) (Cre07.g325000, Pp1s281_82V6, At5g05690) and in the protection against high light intensity such as Light Harvesting Complexes (LHC) (Cre17.g740950, Pp1s628_3V6, At4g10340) of the photosystem II. This response to light has been previously reported for CrCO (Serrano et al., 2009), PpCOL1 (Zobell et al., 2005) and CO (Valverde et al., 2004). Therefore, this interspecies network analysis could successfully predict gene function using the significantly enriched GO terms observed in the corresponding modules around the genes of interest.
The next conserved GO terms are involved in metabolism such as Starch metabolic process; Lipid metabolic process and Nitrogen compound metabolic process. Consistently, in the regions of the three networks, genes involved in starch biosynthesis such as Starch Synthases (SSS) (Cre16.g665800, Pp1s234_74V6, At4g18240), in starch hydrolysis such as Beta-amylases (BAM) (Cre01.g044100, Pp1s317_42V6, At2g32290), in fatty acid synthesis such as Long Chain Acyl-CoA synthases (LACS) (Pp1s113_124V6, At2g47240) and 3-ketoacyl-CoA synthase (KCS) (Cre07.g320550, Pp1s268_29V6, At4g34250), in fatty acid modification such as Fatty Acid Desaturases (FAD) (Cre13.g590500, Pp1s98_209V6, At3g15850), Glutamine Synthetase (GS) (g13061, Pp1s19_281V6, At5g37600) and Nitrate Transporter (NTR) (g18260, Pp1s283_88V6, At4g18480) can be found. Recently, the influence of CrCO and CO over the metabolism of starch and carbohydrates has been described (Serrano et al., 2009; Ortiz et al., unpublished results). The effect of these genes over the metabolism of lipids and nitrogen compounds suggested in this work remains to be explored experimentally. This reflects the possible application of this type of analysis, employing the evolutionary line of gene co-expression networks, for gene function prediction. This way, when a gene with an unknown function is consistently co-expressed across its evolutionary lineage with the same well-characterized genes, a putative function could be assigned to it.
Finally, several GO terms defined as Response to chemical stimulus and Developmental process, were identified that significantly and specifically appeared enriched both in the Physcomitrella and Arabidopsis networks. Although these GO term did not appear significantly represented in the neighborhood of CrCO in the Chlamydomonas network we were still able to identify several algal genes that showed a similar annotation, including Ethylene Response Factors (ERF) (g15714, Pps265_50V6, At1g53910) and Auxin Transporters (AUX) (Cre16.g680200, Pp1s167_10V6, At5g43700). Other GO term such as Response to jasmonate only presented conserved genes in Physcomitrella and Arabidopsis networks such as Jasmonate Insensitive (JIN) (Pp1s11_350V6, At1g32640) and Jasmonate Responsive (JR) (Pp1s200_12V6, At3g16470) genes. In fact, it has been suggested that Chlamydomonas can respond to some hormonal stimuli and that this effect has stretched and become more complex as plants developed intricate structures and functions, reaching the complexity of the current plant hormone responses (Riaño-Pachon et al., 2008). These could be identified as the precursors of genes associated to hormone signaling and experiments could be designed to demonstrate their function. Therefore, another application of this cross species network analysis could be to predict the evolution of physiological processes and their importance in the diversification of key regulatory responses (such as hormone responses) between different species. If this is the case, when applied to a species transcriptome, implying the study of regulatory modules of many key factors in a natural population context, this analysis could be a very useful tool to understand speciation.
Gene Specialization and the Establishment of Connections Between Different Biological Processes is Reflected in the Evolutionary History from CrCO to AtCOLs
Previously it was shown that, in the multi-gene families of Physcomitrella and Arabidopsis, different genes appear at distant positions in the network showing distinct levels of importance in the organization and information transmission of the corresponding networks. In order to determine if this influences the biological functions of genes, GO term enrichment in the neighborhood of each individual gene of interest in this work, was performed.
In the Chlamydomonas genome a single CrCO copy involved in core biological processes can be identified: response to light stimulus, starch metabolic process, lipid metabolic process and nitrogen compound metabolic process. Attending to our analysis CrCO could also be marginally involved in pre-developmental processes and response to chemical stimuli (Table 4 and Figure 3).
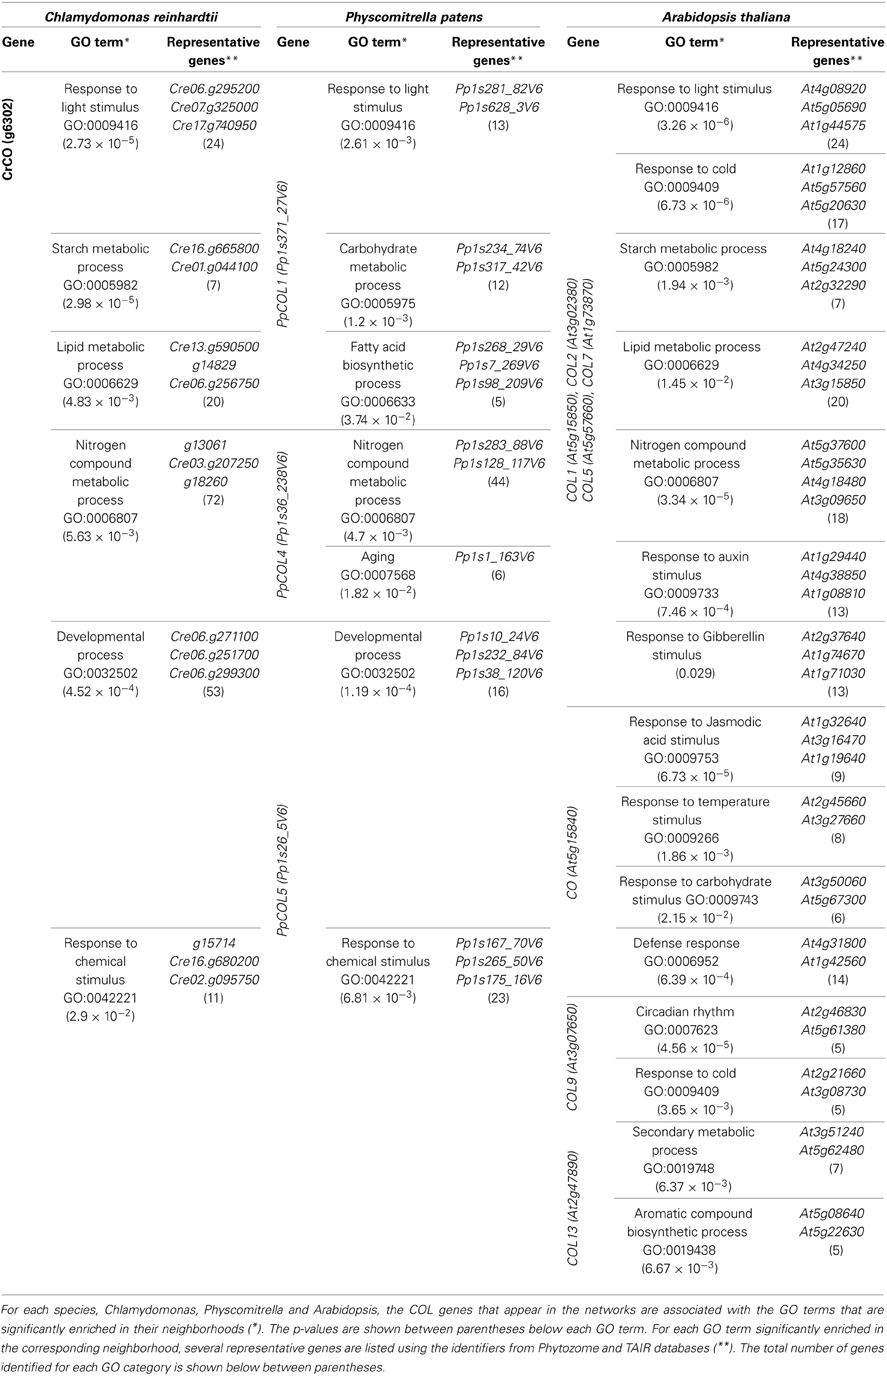
Table 4. GO terms significantly enriched in CrCO, PpCOLs, and AtCOLs neighborhood in the gene co-expression networks.
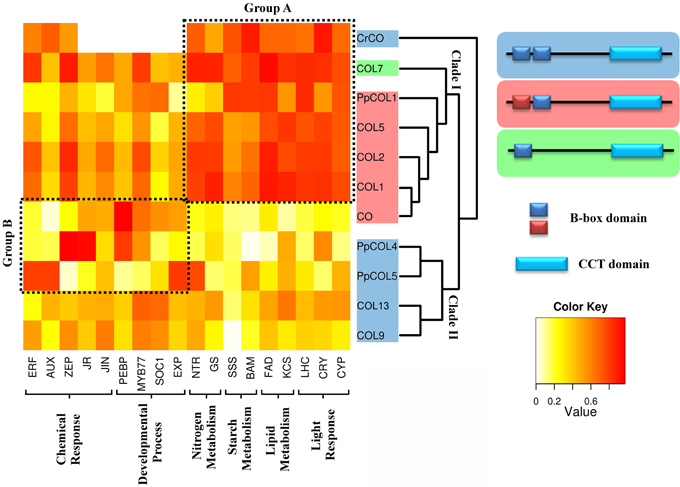
Figure 3. Comparison of the gene co-expression analysis with a phylogenetic and domain conservation study. The analyzed CrCO, PpCOLs, and AtCOLs proteins are organized in the rows of a heatmap according to their phylogeny. Two big clades descending from CrCO can be observed. Clade I includes genes with a divergent and a normal B-box (PpCOL1, COL5, COL2, COL1, and CO), highlighted in red, and COL7 with a single B-Box. Clade II is composed of proteins with two similar B-boxes (PpCOL4, PpCOL5, COL13, and COL9). Representative clustered genes in biological processes in which COLs are involved were chosen. Dark red cells indicate a high correlation between corresponding genes, while white cell indicate absence of correlation. Group A have retained CrCO ancestral functions related to light response and carbon metabolism (PpCOL1, COL7, COL5, COL2, and COL1). Group B is significantly correlated with chemical response and developmental processes (CO, PpCOL4, and PpCOL5). Some connection between groups is still observed. Functional classification coincides mostly with phylogeny with exceptions like COL1 and CO, phylogenetically very close but functionally very different. In contrast, CO, PpCOL4, and PpCOL5 are very divergent phylogenetically but seem to have functionally converged.
In the Physcomitrella network three COL genes were identified: PpCOL1, PpCOL4, and PpCOL5. GO term enrichment in each of the neighborhood of these genes show that each one has diverged to specialize in a particular biological process. PpCOL1 exhibits a high level of co-expression with LHC, SSS and fatty acid denaturizes. This suggests a specialization of this gene in response to light and carbon metabolism, consolidating a connection that was already established in Chlamydomonas. On the other hand, in the neighborhood of PpCOL4 and PpCOL5, genes associated with nitrogen metabolism, aging, development and response to chemical stimuli can be found. This suggests that these processes, that were secondary to CrCO in Chlamydomonas, became related to new COL genes and possibly more relevant during the evolution of plants into species like Physcomitrella. Duplication and diversification from CrCO produced genes such as PpCOL4 and PpCOL5 that covered the new challenges related to maintaining a multicellular organism in order to coordinate, among others, its developmental processes. Of special interest among the genes highly co-expressed with these two genes is the Physcomythrella PEBP, Phosphatidyl-Etanolamine Binding Protein (Pp1s32_140V6). This gene shows a high sequence similarity with the FT gene, the mobile florigen hormone that constitutes the main target of CO in Arabidopsis. Therefore, another possible application of our approach would be to identify true functional orthologous genes by determining whether or not their neighboring genes of known functions in the corresponding networks are evolutionarily conserved.
In the Arabidopsis network, a considerable increase in the complexity and diversification of the function of the seven AtCOL genes included in this study is apparent. A group of genes comprising COL1, COL2, COL5, and COL7 are co-expressed with genes whose function is similar to the core processes associated with CrCO, such as response to light, starch, lipid and nitrogen metabolism. Additionally, in Arabidopsis these genes show a connection with biological processes not annotated before such as response to cold, auxin and gibberellin that have been previously described as major regulators of plant development. This may suggest that the level of regulation exerted by these AtCOL genes is more complex than the one exerted by their ancestral genes CrCO and PpCOL1. This suggests that in Arabidopsis, besides a light input, the AtCOLs associated with carbon and nitrogen metabolism also receive inputs from temperature and hormone signaling. The key gene in the Arabidopsis photoperiodic response CO, is co-expressed with genes associated with responses to jasmonic acid, temperature stimuli, carbohydrate stimuli and defence to pathogens. This could provide evidence for yet unexplored effectors that trigger the floral transition in Arabidopsis associated to CO function. COL9 seems to be significantly influenced by circadian rhythms and response to cold whereas COL13 is associated with very specific processes such as aromatic compound biosynthesis. Therefore, these co-expression networks could be used to predict complex functional links within species based on their positioning and their relation to primitive functions in ancestral species.
In order to determine the degree of co-expression and specialization between the genes of interest and the different biological processes discussed above, the level of correlation between them and some representative genes for each biological process was plotted (Figure 3). This plot separates two distinct groups of genes. Group A is constituted by CrCO, PpCOL1, COL5, COL7, COL2, and COL1. It shows a high correlation with the core biological processes covering response to light (CYP, CRY, LHC), lipid (FAD, KCS), starch (SSS, BAM), and nitrogen (NTR, GS) metabolisms. These, rather than developmental processes, could then be appropriately considered as the ancestral main function of CrCO and as such these functions have been conserved across the plant evolutionary line for all COLs. Group B comprises CO, PpCOL4, and PpCOL5. These genes are highly co-expressed with previously described genes associated to developmental processes [PEBP; MYB77; Suppressor of Overexpression of CO 1, (SOC1); expansin, (EXP)] but also interestingly with the response to chemical stimuli (ERF, AUX, JR, JIN). Finally, COL9 and COL13 seem to be equally correlated with all the different biological processes discussed before.
Although, the genes from group A (Figure 3) are highly co-expressed with light response and metabolic processes they also show a considerable correlation with genes involved in development. This could hint to a role of this group of COLs in developmental regulation or that they may receive inputs from developmental processes in order to exert a tighter control on metabolism. Similarly, group B genes, for example CO, in spite of being significantly co-expressed with genes involved in developmental processes and response to hormones, also shows an appreciable degree of correlation with genes involved in metabolism. Therefore, these genes may receive inputs from metabolic processes in order to produce a more effective control over developmental processes or they may also regulate, up to some degree, carbon and nitrogen metabolism. In any case, these two groups of genes seem to effectively establish connections between development, metabolism and light response through the PpCOLs and AtCOLs that evolved from the core connections established by CrCO. To demonstrate this hypothesis, these interconnections will need to be further explored and validated experimentally. Some late results from our laboratory suggest that indeed control of sugar release during the floral transition in Arabidopsis depends on photoperiod. This control is exerted through transcriptional regulation of a starch synthase gene by CO (Ortiz et al., unpublished data). This functional connectivity between hubs and functions may be in the base of the complexity found in the response of plants (and any other organism) to stimuli. By naturally conditioning and constraining gene function within these functional modules, genes cannot evolve individually; they retain part of the regulation of their ancestors and therefore involve complexity at the same time that they promote their joint regulation. This would be explained in more detail further on.
Functional Studies Based on Sequence Similarity are not Sufficient to Explain the Evolutionary History of the COL Genes
As described above, the integration of transcriptional information and the identification of gene expression patterns in the gene co-expression networks suggest a specific classification of the CrCO, PpCOLs, and AtCOLs according to their associated biological processes. It was interesting to explore whether or not this was in agreement with more classical approaches based on sequence similarity such as phylogenetic analysis and identification of conserved protein domains.
CrCO, PpCOLs, and AtCOLs belong to the COL protein transcription factor family, which is characterized by the presence of a specific set of conserved domains. All of them contain a CCT domain in the C-terminal part that has been shown to be involved in nuclear import (Robson et al., 2001), DNA binding activity (Tiwari et al., 2010) and in protein-protein interactions such as the binding of CO to the ubiquitin ligase COP1 (Jang et al., 2008). In the N-terminal part, COLs present one or two specific Zinc-finger domains called B-boxes with protein-protein interaction function (Khanna et al., 2009). In the subfamily of AtCOLs studied here, only COL7 has one single B-box. According to these B-boxes we can classify the CrCO, PpCOLs, and AtCOLs proteins depending on the divergence degree of the second B-box. CrCO, PpCOL4, PpCOL5, COL9, and COL13 proteins have two almost identical B-boxes, whereas in PpCOL1, COL5, COL2, COL1, and CO, the amino terminal B-box has diverged (Figure 3 and Figure S2).
Phylogenetic analysis of the CrCO, PpCOLs, and AtCOLs has provided insights into their evolutionary history (Griffiths et al., 2003; Zobell et al., 2005; Valverde, 2011). In this study, the genetic distances between the different COLs found in the networks were determined and a phylogenetic tree was built (Figure 3). In this phylogenetic tree, two clades descending from the ancestral CrCO protein could be distinguished. Clade I comprises PpCOL1, COL7, COL5, COL2, COL1, and CO, whereas PpCOL4, PpCOL5, COL9, and COL13 constitute clade II. These clades are separated by an event of gene duplication that took place before the subsequent event of speciation that gave rise to Physcomitrella and Arabidopsis. Therefore, these two groups of proteins seem to have long diverged in the plant evolutionary line.
When comparing the clades in the phylogenetic tree with the classification of CrCO, PpCOLs, and AtCOLs based on the biological processes associated with them, it was observed that genes of recent descent do not necessarily show a conserved association with the same biological processes. For instance, CO and COL1 are known to be the result of a very recent event of gene duplication and the proteins share more than 80% of amino acid identity. Nevertheless, COL1 appears in group A, related to light response and metabolism whereas CO is a member of group B involved in developmental processes. This divergence in functionality, in spite of the high sequence identity, has been shown experimentally by the inability of an over-expressor of COL1 to affect flowering (Putterill et al., 1995). In contrast, although CO and CrCO are evolutionary more distant, CrCO is able to accelerate the floral transition in Arabidopsis (Serrano et al., 2009). Similarly, although PpCOL1 presents a high sequence similarity with CO and belongs to the same clade it does not affect the flowering phenotype when over-expressed in Arabidopsis (Zobell et al., 2005). According to our classification based on biological processes associated with each gene, PpCOL4 and PpCOL5 could be better candidates to affect the flowering process, since they belong to the group, as CO does, associated with developmental processes. This could mean that some genes presenting distant evolutionary origins can converge to acquire influence over the same biological processes.
This gene evolution line that combines divergence of functionality in those of recent descent and convergence to the same biological processes of evolutionary distant ones is not unique to CrCO, PpCOLs, and AtCOLs. A similar evolutionary history has been described for the family of GATA transcription factors in Arabidopsis (Manfield et al., 2007). In fact, a similar approach to study the phylogeny and function of GATA and DOFs transcription factors employing these co-expression networks gives similar results (data not shown) confirming the applicability of these approaches to other gene families.
Therefore, the analysis of gene co-expression networks presented here provides new insights into gene evolutionary lineage following duplication events. These duplications can result in function divergence from their ancestors such as the case of PpCOL1, COL1, and CO as well as convergence to the same function through different branches of the evolutionary tree, as is the case of CO, PpCOL4, and PpCOL5. Experimental demonstration of an involvement of PpCOL4 or PpCOL5 proteins in developmental processes in Physcomitrella, such as is the case of CO in Arabidopsis, would strongly support this point.
Experimental Validation Supports the Predictions Inferred Using Gene Co-Expression Networks
In order to asses if the observations about the conservation of function in the evolutionary line of COL genes under study were correct, an expression analysis was performed. Arabidopsis plants overexpressing CO from a 35S promoter and fused to the rat glucocorticoid receptor (GR) were employed to identify CO targets (Simon et al., 1996). In Chlamydomonas, an approach employing recombinant alga expressing CrCO under the conditional expression of the pnia2 promoter, which induces gene expression with a change in the nitrogen source (González-Ballester et al., 2005) was performed. In both cases, primers for characteristic genes co-expressed with CrCO or in the neighborhood of other AtCOLs were designed (Table 2) and their expression tested by Q-PCR (Figure 4).
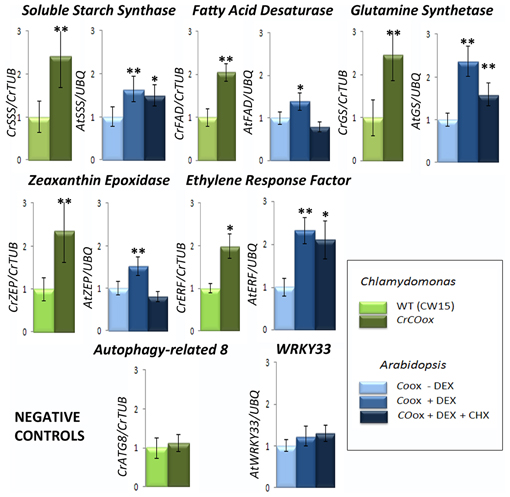
Figure 4. Genes within the COL co-expression network are influenced through evolution by COL overexpression. The bars represent Q-PCR expression levels of some representative genes within the influence of COLs in the networks of Figure 2. The results for gene homologues of Soluble Starch Synthase (SSS), Fatty Acid Desaturase (FAD), Glutamine Synthetase (GS), Zeaxanthin Epoxidase (ZEP), and Ethylene Response Factor (ERF) in Chlamydomonas (in green) and Arabidopsis (in blue) are presented. Two control genes, ATG8 from Chlamydomonas and WRKY33 from Arabidopsis that show no correlation with either CrCO or any AtCOL respectively, were chosen as negative controls. Light green bars represent relative gene expression levels in wild type (CW15) Chlamydomonas while dark green represent CrCOox algae results. Light blue bars represent relative gene expression levels in 35S:CO-GR Arabidopsis plants without chemical addition; medium blue bars represent the same in the presence of DEX and dark blue in the presence of DEX and CHX. Data are the mean of 4 independent experiments relative to control genes and include s.e.m. Two asterisks above a bar represent a fold change with 95% significance, while a single asterisk represents a fold change with 90% significance.
In Chlamydomonas CrCO expression was induced by transferring ammonia-grown cells in LD (when nia2 promoter is inactive) to nitrate growing conditions, when the nia2 promoter is activated and produces high amounts of CrCO transcript (Serrano et al., 2009). In Arabidopsis, 35S:CO-GR plants growing in plates in LD were exposed to DEX treatment for 4 h and samples taken (see Materials and Methods section). Addition of CHX (a potent translation inhibitor) in samples assured that gene expression was due to a direct CO induction (Samach et al., 2000). In both experiments, total RNA was extracted, cDNA constructed, and Q-PCR analyzes performed in control and experimental samples at least three times.
In Figure 2 we had shown that genes coding for a Soluble Starch Synthase (SSS), a FAD, a Glutamine Synthetase (GS), a ZEP and an ERF were positively co-expressed with CrCO in the Chlamydomonas gene co-expression network. In Physcomitrella and Arabidopsis this effect was conserved, but distributed among different COL clusters, so that i.e., in Physcomitrella the GS homologue was co-expressed with PpCOL4 (in blue) while in Arabidopsis was in the neighborhood of AtCOL9. In the Q-PCR experiments performed in Chlamydomonas, as expected by the results of the massive analysis, CrCOox algae presented an increase of 2–3-fold in the mRNA levels of these genes (Figure 4, dark green bars) compared to control levels (light green bars). When the mRNA expression levels for SSS, FAD, GS, ZEP and ERF Arabidopsis gene homologues in 35S:CO-GR plants after DEX treatment were tested (Figure 4, medium blue bars), we could also detect an increase in mRNA levels compared to control (light blue bars). This effect was high for ERF and GS mRNA levels and very low for ZEP and FAD. In fact, when plants were subjected to both CHX and DEX treatments (Figure 4, dark blue bars) some of this effect was reduced, particularly for FAD, ZEP and in a lower extent for GS, while mRNA levels remained constantly high for SSS and ERF. This probably indicates that both SSS and ERF are bona fide targets of CO, while the other three, in the case of Arabidopsis, are not. This effect could be due by CO activating the expression of genes that are true regulators of their expression, or because CO can, to some extent, still affect their translation, as in the case of GS, where a small increase in transcript levels can be observed after CHX addition. In any case, genes randomly chosen because they were sufficiently far from CrCO (ATG8) or AtCOLs (WRKY33) core control cluster in the network, did not show any enhanced expression level in the induction experiments neither in Chlamydomonas nor in Arabidopsis (Figure 4).
Some of the genes activated by CO in Arabidopsis may be direct targets, meaning that CO protein could bind directly to their promoters. If this was the case, the promoters of these genes would be enriched in the CO binding sites described in the literature (CORE and HAP) (Wenkel et al., 2006; Tiwari et al., 2010) when compared to a background of genes that are not co-expressed with CO. In order to corroborate this a transcription factor binding site enrichment analysis was performed using 1000 bp of the promoter region of several genes in the neighborhood of CO, including those analysed by Q-PCR, taking as background genes randomly chosen far from CO in the network. Indeed, we could observe enrichment in the promoter of co-expressed genes with CO for the CORE binding site with a p-value for the Fisher's exact test of 0.0027. 70.7% of the genes in the target exhibited at least one CORE site in their promoter whereas only 20.5% of those far from CO presented at least one CORE site (Figure S3). Therefore, when studying transcription factors in gene co-expression networks, a transcription factor binding site enrichment analysis over the promoters of genes in their neighborhood may also shed light over the binding site of the transcription factor under study and the kind of regulation exerted (direct or indirect) over them. The transcription factor binding site enrichment analysis was performed using the software package HOMER (Hypergeometric Optimization of Motif EnRichment) (Heinz et al., 2010).
This and previous gene expression analyzes were supporting two clear ideas. In the one hand, the network of genes influenced by COLs is conserved between two extremely distant organisms such as the chlorophyte Chlamydomonas and the brassica Arabidopsis. Second, it was also indicating that during evolution, some kind of diversification had occurred in the COL gene family so that different COLs had specialized in different functions (different gene co-expression clusters). In fact, when CO is overexpressed in Arabidopsis, its main target FT augments its levels of expression more than a 100-fold (Valverde et al., 2004), much more than any of the targets tested here. When, on the other hand CrCO is overexpressed in Arabidopsis, an induction of FT expression can also be observed, but never reaching the levels of CO overexpressing lines (Serrano et al., 2009). Therefore, when an experiment designed to observe the function of a transcription factor within a gene family is planned, gene co-expression networks, employing this evolutionary perspective, could provide an advantage in order to identify the correct gene targets and the functions they are involved in.
The Evolutionary History of CrCO, PpCOLs, and AtCOLs Can be Explained by the Innovation-Amplification-Divergence Model of Evolution by Gene Duplication
Gene duplication was proposed as one of the major forces driving the evolution of genes (Ohno, 1970; Kimura and Ohta, 1974) in the early 1970s. Nevertheless, the initial theory of evolution by gene duplication, Mutation During Non-functionality, presented several problems. One of the most important ones is called Ohno's dilemma. The duplication of a gene increases the metabolic load of the organism producing an evolutionary disadvantage. This will remove the new copy of the gene from the population preventing it from staying long enough to accumulate mutations that will confer it a new functionality. In order to overcome these problems several models of evolution by gene duplication has been developed in the last years (Zhang, 2003). Among these, the Innovation-Amplification-Divergence model (Bergthorsson et al., 2007) is the one that better fits the evolutionary history of the CrCO, PpCOLs, and AtCOLs genes inferred in this work using gene co-expression networks. Recently, this model of evolution by gene duplication has been proved experimentally in bacterial systems (Nasvall et al., 2012).
According to this theory, before duplication, the ancestral gene needs to be involved in a wide range of biological processes that include its primary function as well as several secondary processes that would constitute the innovation pose by the gene (Figure 5A). Under these conditions a high copy number of the proteins produced by the gene is needed. Therefore, for such a gene, a duplication that would eventually increase the number of proteins is not as detrimental as for other genes for which a low number of proteins is required (Figure 5B). In this respect, ancestral genes subject to produce a fixable duplication would appear as hubs in gene co-expression networks being involved in a wide range of biological processes through its neighboring genes (Li et al., 2006). Due to a change in the environment, one of these secondary processes may become selectively valuable and would demand an increase in the dosage of the ancestral gene actively fixing its duplication. Since initially the new gene does not efficiently cover the needs of the secondary function of the ancestral gene a series of several duplications, known as the amplification phase, are needed to completely satisfy the new evolutionary requirements (Figure 5C). After duplication the same evolutionary pressure facilitates a divergence phase where mutational improvements over the new genes make them specialize in the new biological processes that pose a selective value (Figure 5D).
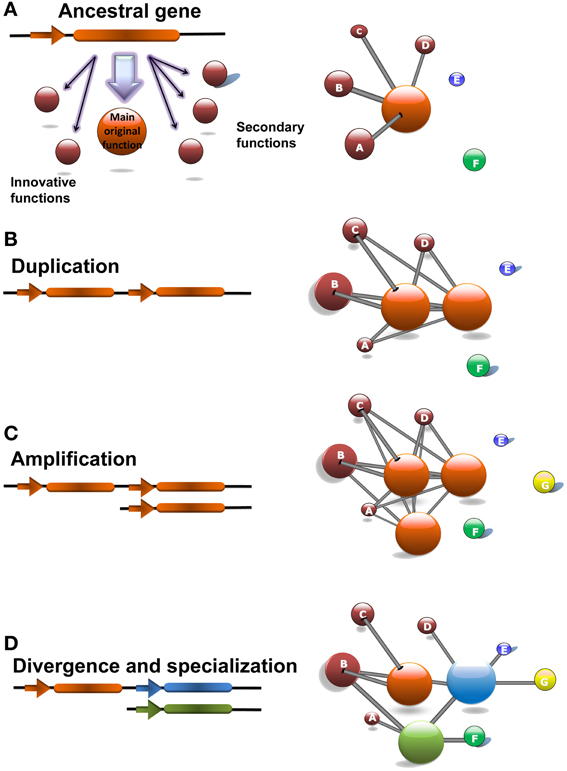
Figure 5. The Innovation-Amplification-Divergence (IAD) model of evolution by gene duplication explains the evolutionary history of the CrCO, PpCOL, and AtCOL genes. (A) The CrCO gene in Chlamydomonas is a hub gene whose main functions are light response and carbon/nitrogen metabolism. Additionally, CrCO presents links to secondary functions such as response to chemical stimulus and developmental processes that can be considered innovations developed by this gene. (B) During the evolution of multicellular land-based plants such as Physcomitrella and Arabidopsis these secondary functions became selectively valuable which facilitated the fixation of duplications of CrCO. Initially, duplicated genes are identical and conserved exactly the same links as the ancestral gene. (C) In order to fully cover the demands exerted by selection of a more complex regulation over developmental processes, an amplification consisting of multiple gene duplications took place, giving rise to the 10 gene family of PpCOLs and the 17 gene family of AtCOLs. (D) After duplication and amplification the same selectively forces facilitate the accumulation of mutations over the duplicated genes that make them diverge, specialize and acquire new functions as it can be observed in the PpCOL and AtCOL genes. This is reflected in the network by the removal of links and the establishment of new ones. Note that in spite of divergence the genes tend to keep links to the main ancestral functions.
In this network analysis, originally the CrCO gene that appeared for the first time in the chlorophytes such as Chlamydomonas constitutes a hub gene related to a wide variety of biological processes. A single gene copy of CrCO would therefore efficiently regulate light response and metabolic functions. Nevertheless, in a marginal and less efficient way it would also be involved in secondary biological functions related to response to chemical stimulus and pre-developmental processes (such as hormonal response). When multicellular photosynthetic organisms such as bryophytes like Physcomitrella required a more complex regulation of their developmental processes the secondary functions of CrCO became selectively valuable. This event facilitated the positive selection of the duplication of CrCO that was fixed in the genome by the new demands posed by complexity (multicellularity, new aerial habitats, intricate developmental processes, …). Since, initially CrCO did not efficiently regulate processes related to development, multiple duplications, as the one observed in the PpCOLS ten-gene family of the moss, were necessary during the amplification phase to completely cover the developmental needs of multicellular photosynthetic organisms. As the complexity increased during the evolutionary line leading to the flowering plants, more duplications were needed. This gave rise to the Arabidopsis 17 AtCOL gene family in order to cover all the complex stimuli governing the numerous developmental processes of an angiosperm, such as the flowering transition. After duplication, each new gene was free to diverge and specialize in one or several of the secondary functions and to acquire links to new biological processes. Nevertheless, these new genes always kept a link with the original network around their ancestral gene, thus keeping some of its ancestral functions. This has been shown recently in the case of the role of CO gene in Arabidopsis linking the photoperiodic floral transition with starch metabolism (Ortiz et al, unpublished results). As the analysis of gene co-expression network unveils, CO, although mainly involved in the flowering transition, still keeps influences over sugar and starch metabolism. This constitutes a connection between carbon metabolism and flowering (Wahl et al., 2013) that needs to be further studied.
Concluding Remarks
The family of COL genes that regulate photoperiodic responses in photosynthetic eukaryotes is a particularly suitable family of transcription factors to perform evolutionary studies. In the first hand, it is constituted by a single copy gene in chlorophytes, where it was first originated (Serrano et al., 2009). On the second hand it has become a family of CO-like genes during the evolution of complex photosynthetic organisms, with a 10-gene member family in Physcomitrella and 17 close members in Arabidopsis. This amplification and diversification have allowed for functional specialization while genes still kept links to their original ancestral biological functions.
In our evolutionary analysis, gene co-expression networks establish constrains to the evolution of genes which is particularly evident in those that constitute hubs, nodes that are linked to a large number of genes at the expression level (often, but not only, transcription factors). One can visualize a gene co-expression network as a spider web formed by nodes and edges representing genes and the co-expression relationships between them. Therefore, pulling the string of a gene will drag its co-expressed genes as well. This can be achieved by modifying its expression as drastically as in a null mutation, which will have an effect on the other genes connected to it. The more genes are connected to a particular gene, the more modifications it will create in the network, and the constrain to change will be higher.
Therefore, in our model, genes could not evolve independently but constrained by the limits exerted by the co-expression network in which they are imbibed. For example, gene duplication could not allow the acquisition of new functions randomly, but only within the possibilities already established by the parental gene. This way, genes keep links with ancestral functions while acquiring new ones, thus making the networks more complex and allowing for co-regulation of different functions. This could explain why organisms keep different levels of coordination in different organization levels (such as coordinate metabolism and growth) and acquire complexity while at the same time are able to acquire new functions in order to make more intricate and fitted their responses to external and internal stimuli.
Our results can then explain some previous natural observations on gene evolution while at the same time include a predictive analysis. By studying co-expression networks of a transcription factor throughout the evolutionary life of related organisms we can observe the natural progression of its function and the modifications in the co-expression cluster it is immersed. Observing conserved and diversified correlated networks we could make predictions on what the function of the gene would be in any other organisms and the effect it would have in the physiology of that organism. Thus, for example, employing the correct species and conditions gene co-expression analysis with an evolutionary perspective could be very helpful in agriculture to design plants a la carte to confront the challenging biotechnological problems of this century.
Conflict of Interest Statement
The authors declare that the research was conducted in the absence of any commercial or financial relationships that could be construed as a potential conflict of interest.
Acknowledgments
This work was done with funding from projects CSD2007-00057 and BIO2011-28847-C02-00 (Spanish Ministry of Economy and Competitiveness, MINECO) and Excellence project P08-AGR-03582 (Junta de Andalucía) partially supported by FEDER funding to Federico Valverde and José M. Romero. Fatima E. Said was funded by a fellowship from the Spanish Ministry of External Affairs (AECID) and Eva Lucas-Reina from a CSIC-JAE fellowship which is partly supported by structure funding from the EU (SEF). Funding from the JdC program (MINECO) and the Excellence project P08-TIC-04200 (Junta de Andalucía) to Francisco J. Romero-Campero is also acknowledged. The authors acknowledge the support of the high-performance computational resources from the Centro Informático Científico de Andalucía (CICA).
Supplementary Material
The Supplementary Material for this article can be found online at: http://www.frontiersin.org/Plant_Evolution_and_Development/
10.3389/fpls.2013.00291/abstract
References
Amasino, R. (2010). Seasonal and developmental timing of flowering. Plant J. 61, 1001–1013. doi: 10.1111/j.1365-313X.2010.04148.x
Aoki, K., Ogata, Y., and Shibata, D. (2007). approaches for extracting practical information from gene coexpression networks in plant biology. Plant Cell Physiol. 48, 381–390. doi: 10.1093/pcp/pcm013
Ausín, I., Alonso-Blanco, C., and Martínez-Zapater, J. M. (2005). Environmental regulation of flowering. Int. J. Dev. Biol. 49, 689–705. doi: 10.1387/ijdb.052022ia
Bailey, T. L., Bodén, M., Buske, F. A., Frith, M., Grant, C. E., Clementi, L., et al. (2009). MEME SUITE: tools for motif discovery and searching, Nucleic Acids Res. 37, W202–W208.
Barabasi, A., and Albert, R. (1999). Emergence of scaling in random networks. Science 286, 509–512. doi: 10.1126/science.286.5439.509
Bergthorsson, U., Andersson, D. I., and Roth, J. R. (2007). Ohno's dilemma: evolution of new genes under continuous selection. Proc. Natl. Acad. Sci. U.S.A. 104, 17004–17009. doi: 10.1073/pnas.0707158104
Boyle, N. R., Page, M. D., Liu, B., Blaby, I. K., Casero, D., Kropat, J., et al. (2012). Three acyltransferases and nitrogen-responsive regulator are implicated in nitrogen starvation-induced triacylglycerol accumulation in Chlamydomonas. J. Biol. Chem. 287, 15811–15825. doi: 10.1074/jbc.M111.334052
Bullard, J., Purdom, E., and Hansen, K. S. D. (2010). Evaluation of statistical methods for normalization and differential expression in mRNA-seq experiments. BMC Bioinformatics 11, 1–13. doi: 10.1186/1471-2105-11–94
Castruita, M., Casero, D., Karpowicz, S., Kropat, J., Vieler, A., Hsieh, S., et al. (2011). Systems biology approach in Chlamydomonas reveals connections between copper nutrition and multiple metabolic steps. Plant Cell 23, 1273–1292. doi: 10.1105/tpc.111.084400
Chen, Y. R., Su, Y. S., and Tu, S. L. (2012). Distinct phytochrome actions in nonvascular plants revealed by targeted inactivation of phytobilin biosynthesis. Proc. Natl. Acad. Sci. U.S.A. 22, 8310–8315. doi: 10.1073/pnas.1201744109
Cheng, H., Zhang, Q., and Guo, D. (2013). Genes that respond to H2O2 are also evoked under light in Arabidopsis. Mol. Plant 6, 226–228. doi: 10.1093/mp/sss108
Cheng, X., and Wang, Z. (2005). Over-expression of COL9, a CONSTANS-LIKE gene, delays flowering by reducing expression of CO and FT in Arabidopsis thaliana. Plant J. 43, 758–768. doi: 10.1111/j.1365-313X.2005.02491.x
Corbesier, L., Vincent, C., Jang, S., Fornara, F., Fan, Q., Searle, I., et al. (2007). FT protein movement contributes to long-distance signaling in floral induction of Arabidopsis. Science 316, 1030–1033. doi: 10.1126/science.1141752
Csardi, G., and Nepusz, T. (2006). The igraph software package for complex network research. Int. J. Complex Syst. 1695.
Davies, D. R., and Plaskitt, A. (1971). Genetical and structural analyzes of cell-wall formation in Chlamydomonas reinhardi. Genet. Res. 17, 33–43. doi: 10.1017/S0016672300012015
Du, Z., Zhou, X., Ling, Y., Zhang, Z., and Su, Z. (2010). agriGO, a GO analysis toolkit for the agricultural community. Nucleic Acids Res. 38, W64–W70. doi: 10.1093/nar/gkq310
Eden, E., Navon, R., Steinfeld, I., Lipson, D., and Yakhini, Z. (2009). GOrilla: a tool for discovery and visualization of enriched GO terms in ranked gene lists. BMC Bioinformatics 10:48. doi: 10.1186/1471-2105-10-48
Edgar, R. C. (2004). MUSCLE: multiple sequence alignment with high accuracy and high throughput. Nucleic Acids Res. 32, 1792–1797. doi: 10.1093/nar/gkh340
Fischer, B., Ledford, H., Wakao, S., Huang, S., Casero, D., Pellegrini, M., et al. (2012). SINGLET OXYGEN RESISTANT 1 links reactive electrophile signaling to singlet oxygen acclimation in Chlamydomonas reinhardtii. Proc. Natl. Acad. Sci. U.S.A. 109, E1301–E1311.
Fornara, F., de Montaigu, A., and Coupland, G. (2010). Snapshot: control of flowering time in Arabidopsis. Cell 141, 550. doi: 10.1016/j.cell.2010.04.024
Gautier, L., Cope, L., Bolstad, B. M., and Irizarry, R. A. (2004). affy – analysis of Affymetrix GeneChip data at the probe level. Bioinformatics 20, 307–315. doi: 10.1093/bioinformatics/btg405
Gentleman, R. C., Carey, V. J., Bates, D. M., Bolstad, B., Dettling, M., Dudoit, S., et al. (2004). Bioconductor: open software development for computational biology and bioinformatics. Genome Biol. 5, R80. doi: 10.1186/gb-2004-5-10-r80
Goff, L., Trapnell, C., and Kelley, D. (2011). cummeRbund: Analysis, Exploration, Manipulation and Visualization of Cufflinks High-Throughput Sequencing Data. [R package version 1.2.0].
González-Ballester, D., Casero, C., Cokus, S., Pellegrini, M., Merchant, S. S., and Grossman, A. (2010). RNA-Seq Analysis of Sulfur-Deprived Chlamydomonas cells reveals aspects of acclimation critical for cell survival. Plant Cell 22, 2058–2084. doi: 10.1105/tpc.109.071167
González-Ballester, D., de Montaigu, A., Higuera, J. J., Galván, A., and Fernández, E. (2005). Functional genomics of the regulation of the Nitrate Assimilation Pathway in Chlamydomonas. Plant Physiol. 137, 522–533. doi: 10.1104/pp.104.050914
Goodstein, D. M., Shu, S., Howson, R., Neupane, R., Hayes, R. D., Fazo, J., et al. (2012). Phytozome: a comparative platform for green plant genomics. Nucleic Acids Res. 40, D1178–D1186. doi: 10.1093/nar/gkr944
Griffiths, S., Dunford, R. P., Coupland, G., and Laurie, D. A. (2003). The evolution of CONSTANS-Like gene families in barley, rice and arabidopsis. Plant physiol. 131, 1855–1867. doi: 10.1104/pp.102.016188
Gutiérrez, R. A., Lejay, L. V., Dean, A., Chiaromonte, F., Shasha, D. E., and Coruzzi, G. M. (2007). Qualitative network models and genome-wide expression data define carbon/nitrogen-responsive molecular machines in Arabidopsis. Genome Biol. 8, R7.
Hahne, F., Huber, W., Gentleman, R., and Falcon, S. (2008). Bioconductor Case Studies. New York, NY: Springer. doi: 10.1007/978-0-387-77240-0
Hassidim, M., Harir, Y., Yakir, E., Kron, I., and Green, R. M. (2009). Over-expression of CONSTANS-LIKE 5 can induce flowering in short-day grown Arabidopsis. Planta 230, 481–491. doi: 10.1007/s00425-009-0958-7
Heinz, S., Benner, C., Spann, N., Bertolino, E., Lin, Y. C., Laslo, P., et al. (2010). Simple combinations of lineage-determining transcription factors prime cis-regulatory elements required for macrophage and B cell identities. Mol. Cell 38, 576–589. doi: 10.1016/j.molcel.2010.05.004
Imaizumi, T. (2010). Arabidopsis circadian clock and photoperiodism: time to think about location. Curr. Opin. Plant Biol. 13, 83–89. doi: 10.1016/j.pbi.2009.09.007
Irizarry, R. A., Hobbs, B., Collin, F., Beazer-Barclay, Y. D., Antonellis, K. J., Scherf, U., et al. (2003). Exploration, normalization, and summaries of high density oligonucleotide array probe level data. Biostatistics 4, 249–264. doi: 10.1093/biostatistics/4.2.249
Iyer-Pascuzzi, A. S., Jackson, T., Cui, H., Petricka, J. J., Busch, W., Tsukagoshi, H., et al. (2011). Cell identity regulators link development and stress responses in the Arabidopsis root. Dev. Cell 21, 770–782. doi: 10.1016/j.devcel.2011.09.009
Jackson, S. D. (2009). Plant responses to photoperiod. New Phytol. 181, 517–531. doi: 10.1111/j.1469-8137.2008.02681.x
Jang, S., Marchal, V., Panigrahi, K. C., Wenkel, S., Soppe, W., Deng, X. W., et al. (2008). Arabidopsis COP1 shapes the temporal pattern of CO accumulation conferring a photoperiodic flowering response. EMBO J. 27, 1277–1288. doi: 10.1038/emboj.2008.68
Jones, D. T., Taylor, W. R., and Thornton, J. M. (1992). The rapid generation of mutation data matrices from protein sequences. Comput. Appl. Biosci. 8, 275–282.
Khanna, R., Kronmiller, B., Maszle, D. R., Coupland, G., Holm, M., Mizuno, T., et al. (2009). The Arabidopsis B-box zinc finger family. Plant Cell 21, 3416–3420. doi: 10.1105/tpc.109.069088
Kim, W. Y., Fujiwara, S., Suh, S. S., Kim, J., Kim, Y., Han, L., et al. (2007). ZEITLUPE is a circadian photoreceptor stabilized by GIGANTEA in blue light. Nature 449, 356–360. doi: 10.1038/nature06132
Kimura, M., and Ohta, T. (1974). On some principles governing molecular evolution. Proc. Natl. Acad. Sci. U.S.A. 71, 2848–2852. doi: 10.1073/pnas.71.7.2848
Kleinberg, J. (1999). Authoritative sources in a hyperlinked environment. J. ACM 46, 604–632. doi: 10.1145/324133.324140
Kropat, J., Hong-Hermesdorf, A., Casero, D., Ent, P., Castruita, M., Pellegrini, M., et al. (2011). A revised mineral nutrient supplement increases biomass and growth rate in Chlamydomonas reinhardtii. Plant J. 66, 770–780. doi: 10.1111/j.1365-313X.2011.04537.x
Lajoie, M., Bertrand, D., and El-Mabrouk, N. (2010). Inferring the evolutionary history of gene clusters from phylogenetic and gene order data. Mol. Biol. Evol. 27, 761–772. doi: 10.1093/molbev/msp271
Lázaro, A., Valverde, F., Piñeiro, M., and Jarillo, J. A. (2012). The arabidopsis E3 Ubiquitin ligase HOS1 negatively regulates CONSTANS abundance in the photoperiodic control of flowering. Plant Cell 24, 982–999.
Ledger, S., Strayer, C., Ashton, F., Kay, S. A., and Putterill, J. (2001). Analysis of the function of two circadian-regulated CONSTANS-LIKE genes. Plant J. 26, 15–22. doi: 10.1046/j.1365-313x.2001.01003.x
Li, L., Huang, Y., Xia, X., and Sun, Z. (2006). Preferential duplication in the sparse part of a yeast protein interaction network. Mol. Biol. Evol. 23, 2467–2473. doi: 10.1093/molbev/msl121
Long, T. A., Tsukagoshi, H., Busch, W., Lahner, B., Salt, D. E., and Benfey, P. N. (2010). The bHLH transcription factor POPEYE regulates response to iron deficiency in Arabidopsis roots. Plant Cell 22, 2219–2236. doi: 10.1105/tpc.110.074096
Manfield, I. W., Devlin, P., Jen, C. H., Westhead, D. R., and Gilmartin, P. M. (2007). Conservation, convergence, and divergence of light-responsive, circadian-regulated, and tissue-specific expression patterns during evolution of the Arabidopsis GATA gene family. Plant Physiol. 143, 941–958. doi: 10.1104/pp.106.090761
Marchler-Bauer, A., and Bryant, S. H. (2004). CD-Search: protein domain annotations on the fly. Nucleic Acids Res. 1, W327–W331. doi: 10.1093/nar/gkh454
Metzker, M. L. (2010). Sequencing technologies – the next generation. Nat. Rev. Genet. 11, 31–46. doi: 10.1038/nrg2626
Miller, R., Wu, G., Deshpande, R., Vieler, A., Gartner, K., Li, X., et al. (2010). Changes in transcript abundance in Chlamydomonas reinhardtii following nitrogen deprivation predict diversion of metabolism. Plant Physiol. 154, 1737–1752. doi: 10.1104/pp.110.165159
Mortazavi, A., Williams, B., McCue, K., Schaer, L., and Wold, B. (2008). Mapping and quantifying mammalian transcriptomes by RNA-seq. Nat. Methods 5, 621–628. doi: 10.1038/nmeth.1226
Müller, G. B. (2007). Evo–devo: extending the evolutionary synthesis. Nat. Rev. Genet. 8, 943–949. doi: 10.1038/nrg2219
Nasvall, J., Sun, L., Roth, J. R., and Andersson, D. I. (2012). Real-time evolution of new genes by innovation, amplification, and divergence. Science 338, 384–387. doi: 10.1126/science.1226521
Oldham, M. C., Horvarth, S., and Geschwind, D. H. (2006). Conservation and evolution of gene coexpression networks in human and chimpanzee brains. Proc. Natl. Acad. Sci. U.S.A. 103, 17973–17978. doi: 10.1073/pnas.0605938103
Patterson, K., Cakmak, T., Cooper, A., Lager, I., Rasmusson, A. G., and Escobar, M. A. (2010). Distinct signalling pathways and transcriptome response signatures differentiate ammonium- and nitrate-supplied plants. Plant Cell Environ. 33, 1486–1501.
Punta, M., Coggil, P. C., Eberhardt, R. Y., Mistry, J., Tate, J., Bournsell, C., et al. (2012). The Pfam protein families database. Nucleic Acids Res. 40, D290–D301. doi: 10.1093/nar/gkr1065
Putterill, J., Robson, R., Lee, K., Simon, R., and Coupland, G. (1995). The CONSTANS gene of Arabidopsis promotes flowering and encodes a protein showing similarities to zinc finger transcription factors. Cell 80, 885–900. doi: 10.1016/0092-8674(95)90288-0
Riaño-Pachon, D. M., Correa, L. G. G., Trejos-Espinosa, R., and Mueller-Roeber, B. (2008). Green transcription factors: a Chlamydomonas overview. Genetics 179, 31–39.
Robson, F., Costa, M. M., Hepworth, S. R., Vizir, I., Piñeiro, M., Reeves, P. H., et al. (2001). Functional importance of conserved domains in the flowering-time gene CONSTANS demonstrated by analysis of mutant alleles and transgenic plants. Plant J. 28, 619–631.
Romero, J. M., and Valverde, F. (2009). Evolutionarily conserved photoperiod mechanisms in plants. Plant Signal. Behav. 4, 642–644. doi: 10.4161/psb.4.7.8975
Ruijter, J. M., Ramakers, C., Hoogaars, W., Bakker, O., Van Den Hoff, M. J. B., Karlen, Y., et al. (2009). Amplification efficiency: linking baseline and bias in the analysis of quantitative PCR data. Nucleic Acids Res. 37, 45. doi: 10.1093/nar/gkp045
Rustici, G., Kolesnikov, N., Brandizi, M., Burdett, T., Dylag, M., Emam, I., et al. (2013). Arrayexpress update – trends in database growth and links to data analysis tools. Nucleic Acids Res. 41, D987–D990.
Saitou, N., and Nei, M. (1987). The neighbor-joining method: a new method for reconstructing phylogenetic trees. Mol. Biol. Evol. 4, 406–425.
Samach, A., Onouchi, H., Gold, S. E., Ditta, G. S., Schwarz-Sommer, Z., Yanofsky, M. F., et al. (2000). Distinct roles of CONSTANS target genes in reproductive development of Arabidopsis. Science 288, 1613–1616. doi: 10.1126/science.288.5471.1613
Schliesky, S., Gowik, U., Weber, A. P. M., and Bräutigam, A. (2012). RNA-seq assembly – are we there yet? Front. Plant Sci. 3:220. doi: 10.3389/fpls.2012.00220
Serrano, G., Herrera-Palau, R., Romero, J. M., Serrano, A., Coupland, G., and Valverde, F. (2009). Chlamydomonas CONSTANS and the evolution of plant photoperiodic signalling. Curr. Biol. 19, 359–368. doi: 10.1016/j.cub.2009.01.044
Shimizu, M., Ichikawa, K., and Aoki, S. (2004). Photoperiod-regulated expression of the PpCOL1 gene encoding a homolog of CO/COL proteins in the moss Physcomitrella patens. Biochem. Biophys. Res. Commun. 324, 1296–1301. doi: 10.1016/j.bbrc.2004.09.194
Simon, R., Igeno, I. M., and Coupland, G. (1996). Activation of floral meristem identity genes in Arabidopsis. Nature 384, 59–62. doi: 10.1038/384059a0
Smoot, M., Ono, K., Ruscheinski, J., Peng-Liang, W., and Ideker, T. (2011). Cytoscape 2.8: new features for data integration and network visualization. Bioinformatics 27, 431–432. doi: 10.1093/bioinformatics/btq675
Sueoka, N., Chiang, K. S., and Kates, R. J. (1967). Deoxyribonucleic acid replication in meiosis of Chlamydomonas reinhardi. J. Mol. Biol. 25, 47–66. doi: 10.1016/0022-2836(67)90278-1
Tamura, K., Peterson, D., Peterson, N., Stecher, G., Nei, M., and Kumar, S. (2011). MEGA5: molecular evolutionary genetics analysis using maximum likelihood, evolutionary distance, and maximum parsimony methods. Mol. Biol. Evol. 28, 2731–2739. doi: 10.1093/molbev/msr121
The Gene Ontology Consortium. (2000). Gene ontology: tool for the unification of biology. Nat. Genet. 25, 25–29.
Tiwari, S. B., She, Y., Chang, H.-C., Hou, Y., Harris, A., Ma, S. F., et al. (2010). The flowering time regulator CONSTANS is recruited to the FLOWERING LOCUS T promoter via a unique cis-element. New Phytol. 187, 57–66. doi: 10.1111/j.1469-8137.2010.03251.x
Tohge, T., and Fernie, A. R. (2012). Co-expression and co-responses: within and beyond transcription. Front. Plant Sci. 3:248. doi: 10.3389/fpls.2012.00248
Trapnell, C. (2010). Transcript assembly and quantification by RNA-seq reveals unannotated transcripts and isoform switching during cell differentiation. Nat. Biotechnol. 28, 511–515. doi: 10.1038/nbt.1621
Trapnell, C., Patcher, L., and Salzberg, S. (2009). TopHat: discovering splice junctios with RNA-seq. Bioinformatics 25, 1105–1111. doi: 10.1093/bioinformatics/btp120
Trapnell, C., Roberts, A., Goff, L., Pertea, G., Kim, D., Kelley, D. R., et al. (2012). Differential gene and transcript expression analysis of RNA-seq experiments with TopHat and Cufflinks. Nat. Protoc. 7, 562–578. doi: 10.1038/nprot.2012.016
Urzica, E. I., Adler, L. N., Page, M. D., Linster, C. L., Arbing, M. A., Casero, D., et al. (2012). Impact of oxidative stress on ascorbate biosynthesis in Chlamydomonas via regulation of the VTC2 gene encoding a GDP-L-galactose phosphorylase. J. Biol. Chem. 287, 14234–14245. doi: 10.1074/jbc.M112.341982
Usadel, B., Obayashi, T., Mutwil, M., Giorgi, F. M., Bassel, G. W., Tanimoto, M., et al. (2009). Co-expression tools for plant biology: opportunities for hypothesis generation and caveats. Plant Cell Environ. 32, 1633–1651. doi: 10.1111/j.1365-3040.2009.02040.x
Valverde, F. (2011). CONSTANS and the evolutionary origin of photoperiodic timing of flowering. J. Exp. Bot. 62, 2453–2463. doi: 10.1093/jxb/erq449
Valverde, F., Mouradov, A., Soppe, W., Ravenscroft, D., Samach, A., and Coupland, G. (2004). Photoreceptor regulation of CONSTANS protein in photoperiodic flowering. Science 303, 1003–1006. doi: 10.1126/science.1091761
Wahl, V., Ponnu, J., Schlereth, A., Arrivault, S., Langenecker, T., Franke, A., et al. (2013). Regulation of Flowering by Trehalose-6-Phosphate Signaling in Arabidopsis thaliana. Science 339, 704–707. doi: 10.1126/science.1230406
Wang, X. F., and Chen, G. (2003). Complex networks: small-world, scale-free, and beyond. IEEE Circuits Syst. Mag. 3, 6–20. doi: 10.1109/MCAS.2003.1228503
Wenkel, S., Turck, F., Le Gourrierec, J., Samach, A., and Coupland, G. (2006). CONSTANS and the CCAAT box binding complex share a functionally important domain and interact to regulate flowering of Arabidopsis. Plant Cell 8, 2971–2984.
Wheeler, D. L., Barrett, T., Benson, D. A., Bryant, S. H., Canese, K., Church, D. M., et al. (2005). Database resources of the national center for biotechnology information. Nucleic Acids Res. 33, D39–D45.
Xiao, L., Wang, H., Wan, P., Kuang, T., and He, Y. (2011). Genome-wide transcriptome analysis of gametophyte development in Physcomitrella patens. BMC Plant Biol. 15:177. doi: 10.1186/1471-2229-11-177
Yu, J. W., Rubio, V., Lee, N. Y., Bai, S., Lee, S. Y., Kim, S. S., et al. (2008). COP1 and ELF3 control circadian function and photoperiodic flowering by regulating GI stability. Mol. Cell 32, 617–630. doi: 10.1016/j.molcel.2008.09.026
Zemach, A., McDaniel, I. E., Silva, P., and Zilberman, D. (2010). Genome-wide evolutionary analysis of eukaryotic DNA methylation. Science 14, 916–919. doi: 10.1126/science.1186366
Zhang, J. (2003). Evolution by gene duplication: an update. Trends Ecol. Evol. 6, 292–298. doi: 10.1016/S0169-5347(03)00033-8
Keywords: photoperiod, evolution, gene co-expression networks, Chlamydomonas, Physcomitrella, Arabidopsis
Citation: Romero-Campero FJ, Lucas-Reina E, Said FE, Romero JM and Valverde F (2013) A contribution to the study of plant development evolution based on gene co-expression networks. Front. Plant Sci. 4:291. doi: 10.3389/fpls.2013.00291
Received: 29 April 2013; Accepted: 13 July 2013;
Published online: 05 August 2013.
Edited by:
Madelaine E. Bartlett, Brigham Young University, USAReviewed by:
Stephan Wenkel, University of Tuebingen, GermanyEnamul Huq, The University of Texas at Austin, USA
Idan Efroni, New York University, USA
Copyright © 2013 Romero-Campero, Lucas-Reina, Said, Romero and Valverde. This is an open-access article distributed under the terms of the Creative Commons Attribution License (CC BY). The use, distribution or reproduction in other forums is permitted, provided the original author(s) or licensor are credited and that the original publication in this journal is cited, in accordance with accepted academic practice. No use, distribution or reproduction is permitted which does not comply with these terms.
*Correspondence: Federico Valverde, Molecular Plant Development and Metabolism Group, Instituto de Bioquímica Vegetal y Fotosíntesis, Consejo Superior de Investigaciones Científicasy Universidad de Sevilla, 49th, Americo Vespucio Avenue, 41092 Sevilla, Spain e-mail: federico.valverde@ibvf.csic.es