 Sara Maatta1 Brad Scheu1 Mary R. Roth1 Pamela Tamura1 Maoyin Li2,3 Todd D. Williams4 Xuemin Wang2,3 Ruth Welti1*
- 1 Division of Biology, Kansas Lipidomics Research Center, Kansas State University, Manhattan, KS, USA
- 2 Donald Danforth Plant Science Center, St. Louis, MO, USA
- 3 Department of Biology, University of Missouri-St. Louis, St. Louis, MO, USA
- 4 Mass Spectrometry Laboratory, University of Kansas, Lawrence, KS, USA
Previous work has demonstrated that plant leaf polar lipid fatty acid composition varies during the diurnal (dark–light) cycle. Fatty acid synthesis occurs primarily during the light, but fatty acid desaturation continues in the absence of light, resulting in polyunsaturated fatty acids reaching their highest levels toward the end of the dark period. In this work, Arabidopsis thaliana were grown at constant (21°C) temperature with 12-h light and 12-h dark periods. Collision induced dissociation time-of-flight mass spectrometry (MS) demonstrated that 16:3 and 18:3 fatty acid content in membrane lipids of leaves are higher at the end of the dark than at the end of the light period, while 16:1, 16:2, 18:0, and 18:1 content are higher at the end of the light period. Lipid profiling of membrane galactolipids, phospholipids, and lysophospholipids by electrospray ionization triple quadrupole MS indicated that the monogalactosyldiacylglycerol, phosphatidylglycerol, and phosphatidylcholine classes include molecular species whose levels are highest at end of the light period and others that are highest at the end of the dark period. The levels of phosphatidic acid (PA) and phosphatidylserine classes were higher at the end of the dark period, and molecular species within these classes either followed the class pattern or were not significantly changed in the diurnal cycle. Phospholipase D (PLD) is a family of enzymes that hydrolyzes phospholipids to produce PA. Analysis of several PLD mutant lines suggests that PLDζ2 and possibly PLDα1 may contribute to diurnal cycling of PA. The polar lipid compositional changes are considered in relation to recent data that demonstrate phosphatidylcholine acyl editing.
Introduction
The chloroplast is the single site of fatty acid synthesis in plants (Ohlrogge et al., 1979). Fatty acid synthesis in isolated spinach chloroplasts and in maize leaves is completely dependent on the presence of light, while in spinach leaf disks, the rate of fatty acid synthesis in the dark was reduced to 12–20% of the light rate (Browse et al., 1981). Sasaki et al. (1997) determined that the light-dependence of fatty acid synthesis was due to regulation of acetyl CoA carboxylase, the first enzyme in fatty acid synthesis, by a light-driven redox cascade; phosphorylation–dephosphorylation may also play a role in the light–dark regulation of acetyl CoA carboxylase (Savage and Ohlrogge, 1999). Expressing fatty acid composition in mole percentage of total fatty acyl chains, Browse et al. (1981) found that there was a diurnal fluctuation of fatty acid composition in spinach leaves, with oleate (18:1) increasing in the light and linolenate (18:3) increasing in the dark. Linolenate is one of the two major fatty acid chains with three double bonds (i.e., trienoates) in Arabidopsis leaves, the other being hexatrienoate (16:3). Browse et al. (1981) attributed the fatty acid compositional change mainly to the phosphatidylcholine (PC) class and interpreted their data to mean that fatty acid desaturation, particularly on PC, continues in darkness, when fatty acid synthesis is slowed or stopped, allowing existing fatty acyl chains to increase in unsaturation. An investigation of diurnal variation in Arabidopsis thaliana polar lipid composition corroborated these early results and extended them to this model plant species (Ekman et al., 2007). Ekman and coworkers, like the previous workers, separated Arabidopsis leaf lipids into head group classes and analyzed the fatty acyl composition of each class, determining that PC, phosphatidylethanolamine (PE), and phosphatidylglycerol (PG) exhibited diurnal compositional variation, with 18:1 level highest in the light period and linoleate (18:2) and 18:3 levels highest in the dark period.
Very recently, Burgos et al. (2011) used liquid chromatography (LC)–mass spectrometry (MS) to examine plant response in the first 6 h after switching light conditions. Polar lipid species were determined as apparent molecular species, with head group, total fatty acyl carbons, and total carbon–carbon double bonds specified. These authors examined the major polar lipids, but did not include lysophospholipids or the phosphatidic acid (PA) class. In the current work diurnal polar lipid fluctuations were measured in Arabidopsis leaves. In comparison to previous studies, additional lipids were determined, including PA, lysoPC (LPC), lysoPE (LPE), and lysoPG (LPG).
Plants contain acylhydrolase and acyltransferase activities that can potentially “remodel” PC, via a reversible acyl CoA:lysophosphatidylcholine acyl transferase reaction or via PC hydrolysis to LPC and a fatty acid, with reacylation of LPC after fatty acid activation (Stymne and Stobart, 1984; Bessoule et al., 1995; Kjellberg et al., 2000; Matos and Pham-Thi, 2009). Recent analyses in pea leaves and soybean embryos show that PC undergoes remodeling via “acyl editing,” in which fatty acids are removed and replaced, and the amount of incorporation of recycled fatty acids into PC in these systems is greater than de novo fatty acyl incorporation (Bates et al., 2007, 2009). These results may have implications for diurnal cycling of lipid composition. It is also possible that the activity of phospholipase D (PLD), which can convert phospholipids, such as PC, to PA may relate to diurnal compositional changes.
Materials and Methods
Plant Materials
Wild-type plants were A. thaliana (Columbia-0 accession). The knockout (KO) mutants were all in the Columbia-0 accession and were identified from Salk T-DNA lines (Alonso et al., 2003) through analysis of the SiGnAL database (www.signal.salk.edu/cgi-bin/tdnaexpress). Seeds were obtained from the Ohio State University Arabidopsis Biological Resource Center (ABRC). The genes, KO mutants, their Salk line numbers, and gene numbers are: PHOSPHOLIPASE Dα1, pldα1, SALK_053785, At3g15730; G-PROTEIN α1 SUBUNIT, gpa1, SALK_066823, At2g26300; PHOSPHOLIPASE Dζ1, pldζ1, SALK_083090, At3g16785; and PHOSPHOLIPASE Dζ2, pldζ2, SALK_094369, At3g05630. The pldα1 (KO) was confirmed as homozygous and described by Zhang et al. (2004). The PLDα1-antisense-suppressed line is also in Col-0 ecotype and was generated and described by Fan et al. (1997). The gpa1 (KO) mutant was confirmed to be homozygous (Mishra et al., 2006). The pldζ1and pldζ2 (KOs) and the double KO mutant pldζ1/pldζ2 are described by Li et al. (2006a).
Plant Growth
Seeds of A. thaliana were sown in Scotts Metromix 360 soil. The pots were kept at 4°C for 2 days and then moved to a growth chamber at 21°C (constant) with 12-h light/12-h dark periods with daytime fluorescent lighting at 120 μmol m−2 s−1, 70% relative humidity. Plants were transplanted in the same soil at 21 days of age, with two plants grown in each 10 cm × 10 cm × 15 cm pot.
Sampling and Extraction
Sampling began when the plants were 40–46 days old, and occurred at time points indicated in figure and table legends. During sampling the entrance to the growth chamber was covered with black plastic and sampling during the dark period was done under the plastic using a 3-W night light covered with a green filter. At each time point, samples were taken from five plants; the pots containing these plants were discarded after sampling. For each sample, three to five leaves were collected and immediately immersed in 75°C isopropanol with 0.01% butylated hydroxytoluene to halt any enzyme activity or lipid oxidation. Extraction was performed as described by Welti et al. (2002). The leaf tissues remaining after extraction were dried in an oven at 105°C overnight and weighed to obtain the “extracted dry masses” of the samples.
Polar Lipid Profiling by Triple Quadrupole Mass Spectrometry
Sample preparation and internal standard addition for the initial experiment and Experiment 1 were performed as described (Wanjie et al., 2005). Samples were analyzed on an electrospray ionization (ESI) “triple” quadrupole mass spectrometer (API 4000, Applied Biosystems, Foster City, CA, USA). Data collection and processing for the initial experiment and Experiment 1 were as described by Devaiah et al. (2006). For Experiments 2 and 3, separate galactolipid samples were not prepared; instead, the galactolipids were analyzed from the same samples as the phospholipids. In Experiments 2 and 3, the galactolipid internal standards, 16:0–18:0-monogalactosyldiacylglycerol (MGDG), di18:0-MGDG, 16:0–18:0-digalactosyldiacylglycerol (DGDG), and di18:0-DGDG (Devaiah et al., 2006), were added to an aliquot of the plant extract along with the phospholipid standards. Solvent was added such that the ratio of chloroform/methanol/300 mM ammonium acetate in water was 300:665:35 and the final volume was 1.4 mL. Mass spectral analysis for Experiments 2 and 3 was as described by Devaiah et al. (2006) except that, MGDG was scanned as the [M + NH4]+ ion in positive ion mode with a neutral loss (NL) scan, NL 179.1, and DGDG was scanned as [M + NH4]+ in positive ion mode with NL 341.1. In Experiments 2 and 3, for MGDG and DGDG, the declustering potential was +90 V, the entrance potential was +10 V, and the exit potential was +23 V. The collision energies, with nitrogen in the collision cell, were +21 V for MGDG, and +24 V for DGDG. Data processing was as previously described (Wanjie et al., 2005).
Previous work has shown that various phospholipid species within a class, such as the Arabidopsis phospholipids and their internal standards, produce similar, but not quite identical, amounts of mass spectral signal per mole, allowing absolute quantification of phospholipid molecular species if multiple internal standards are utilized (Koivusalo et al., 2001). On the other hand, galactolipid molecular species quantification is not absolute. This is because galactolipid molecular species vary somewhat in their propensity to ionize, and the degree of variation is dependent on which adduct is formed during ionization. Because naturally occurring galactolipid molecular species are not available as purified components, determining response factors for each molecular species is not currently feasible. In the current work, the quantity of each lipid was determined as normalized mass spectral signal (i.e., normalized to the two internal standards of that class). We have divided the normalized signal either by the extracted dry mass (to produce normalized mass spectral (MS) signal/mg extracted dry mass) or by the total normalized signal (to produce percentage of normalized MS signal). This approach allows comparison of quantities of lipid species and classes among samples.
Collision Induced Dissociation Time-of-Flight MS
Electrospray ionization–collision induced dissociation (CID)–time-of-flight (TOF) MS spectra were acquired with a Micromass Q-TOF-2 tandem mass spectrometer (Micromass, Ltd., Manchester, UK) as described previously (Esch et al., 2007). Data were processed using Micromass MassLynx software and were exported to Excel; peaks within 0.004 u of the accurate m/z of fatty acyl anions were identified and quantified as described (Esch et al., 2007). The intensities of acyl-specific signals were summed, divided by the total signal, and multiplied by 100 to obtain the percentage of the total fatty acid signal.
Principal Component Analysis
Principal component analysis was performed using Pirouette Lite software after autoscaling and log10 transformation of the data. The data set included the data from Experiments 2 and 3; compositional data from 79 samples with 141 lipid species per sample were included.
Statistical Analysis
In Experiments 1, 2, and 3, data from samples of leaves harvested 11 h into the light period were pooled and data from samples of leaves harvested 11 h into the dark period were pooled. The two sets were compared by t-test in Excel. A p value <0.05 was considered significant, and lipids significantly different between dark and light conditions in two or three of the three experiments are reported in the experimental summaries (for polar lipid molecular species and fatty acyl chains). In the mutant analysis, levels of total PA in the light were subtracted from levels of total PA in the dark; the error was propagated by taking the square root of the sum of the squares of the SD of each total PA measurement. The p values were calculated using the unpaired t-test GraphPad Software calculator at www.graphpad.com/quickcalcs.
Results
Direct infusion ESI triple quadrupole MS in precursor and neutral loss scanning modes was used to detect 141 lipid species in 8 diacyl and 3 monoacyl polar lipid classes, identified by head group, total acyl fatty acids, and total carbon: carbon double bonds. Each lipid species was quantified by comparison of its mass spectral intensity with those of two non-naturally or very rarely occurring lipid species of the same class.
The levels of various polar lipids in A. thaliana leaves of approximately 6-week-old plants grown at constant temperature (21°C) with a 12-h light/12-h dark cycle were determined. In an initial experiment, five leaf lipid samples (each sample being an extract from three to five leaves) were analyzed at time points spanning 49.5 h and two full dark–light cycles. Several apparent lipid molecular species and the PA lipid class showed clear cyclical variation in amount as a function of the dark and light cycles. The data for lipid molecular species PC 36:6 (18:3/18:3), PC 34:1 (16:0/18:1), the PA class, and PA 34:3 (primarily 16:0/18:3) are shown in Figure 1. Individual sample data for the entire initial experiment are supplied in the Table S4 in Supplementary Material in Excel format. For the lipids undergoing cycling, the changes during each period of the diurnal cycle (dark or light) were cumulative, with the greatest changes generally observed toward the end of each light or dark period; the 11-h time points, indicated in Figure 1 for light (green arrows) and dark (red arrows), were chosen for further experimentation.
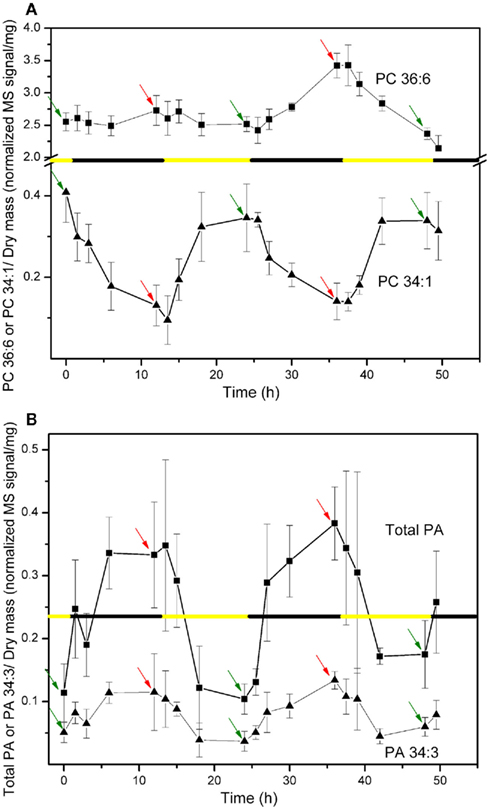
Figure 1. Changes in lipid molecular species PC 36:6 and PC 34:1 (A) and PA lipid class and molecular species PA 34:3 (B) through 12-h light/12-h dark periods. Data are reported as normalized (to internal standard amounts) MS signal per extracted dry mass (in mg). The black and yellow line indicates the timing of the 12-h dark and light periods. The time indicated as 0 h is the time of the first sampling, which occurred 11 h into a 12-h light period (or 1 h before the start of the first full dark period). In each panel, green arrows indicate the points 11 h into the 12-h light periods and red arrows indicate the points 11 h into the 12-h dark periods. These time points were chosen for later experiments.
The experiment shown in Figure 1 suggested that diurnal variation could be detected, but changes in some species and classes [e.g., phosphatidylserine (PS)] were not clearly delineated. To better define the lipid changes occurring in dark and light periods, a larger number of observations were made 11 h after the start of the light and dark periods. Twenty plants/samples per group were analyzed and the experiment was repeated three times. Experiment 1 differed from Experiments 2 and 3 in that galactolipids were determined as [M + Na]+ adducts in Experiment 1 and as [M + NH4]+ adducts in 2 and 3. Forming different adducts altered the absolute values of the intensities somewhat among experiments, but allowed comparison, within each experiment, of lipid quantities from leaves harvested in the light compared to the dark periods.
The data show the lipid mass spectral signal is 9–12% lower at the end of the light period than at the end of the dark period (Table S1 in Supplementary Material). Ekman et al. (2007) showed that starch, which was measured at 0% at the end of the dark period, rose to about 6% of the Arabidopsis dry mass at the end of the light period. The higher content of starch, and possibly other substances, in the light is likely to account for at least part of the lower lipid signal per dry mass in the light in this experiment. However, some fraction of the observed higher levels of polar lipids in the dark could be due to the incorporation of fatty acids synthesized during the light period into complex lipids or to conversion of other metabolites to polar lipids in the dark. Because the basis for the apparent decrease in the polar lipid pool in the light might be reflective of dry mass as well as lipid changes, lipid amounts are reported in relation to the dry mass and in relation to total analyzed lipid amount; the latter are independent of dry mass measurements. Table S1 in Supplementary Material indicates average normalized MS signal per mg of extracted dry mass, and Table S2 in Supplementary Material indicates average percentage of normalized MS signal; individual sample data are supplied in the Tables S5–S7 in Supplementary Material in Excel format. Here, “normalized” refers to quantification of MS signal for an apparent molecular species or lipid class in relation to the internal standard signals.
The significant changes shown in Tables S1 and S2 in Supplementary Material are summarized in Table 1, and the data from Experiment 1 are depicted in Figures 2–4. In Table 1, “light” and “dark” in the third column indicate the lipid species and classes that were significantly changed (p < 0.05) in the same direction in all three experiments, while “(light)” and “(dark)” indicate those that were significantly changed in two experiments and changed in the same direction in the third experiment. Principal component analysis of the pooled data from Experiments 2 and 3 (Figure S1 in Supplementary Material) showed that the differences in compositions in light and dark periods were clearly distinguishable. A plot of Factor 1 vs. Factor 2, which accounted for 26.2 and 10.9%, respectively, of the variance in the data, separated samples collected in the dark and light based on their lipid compositions.
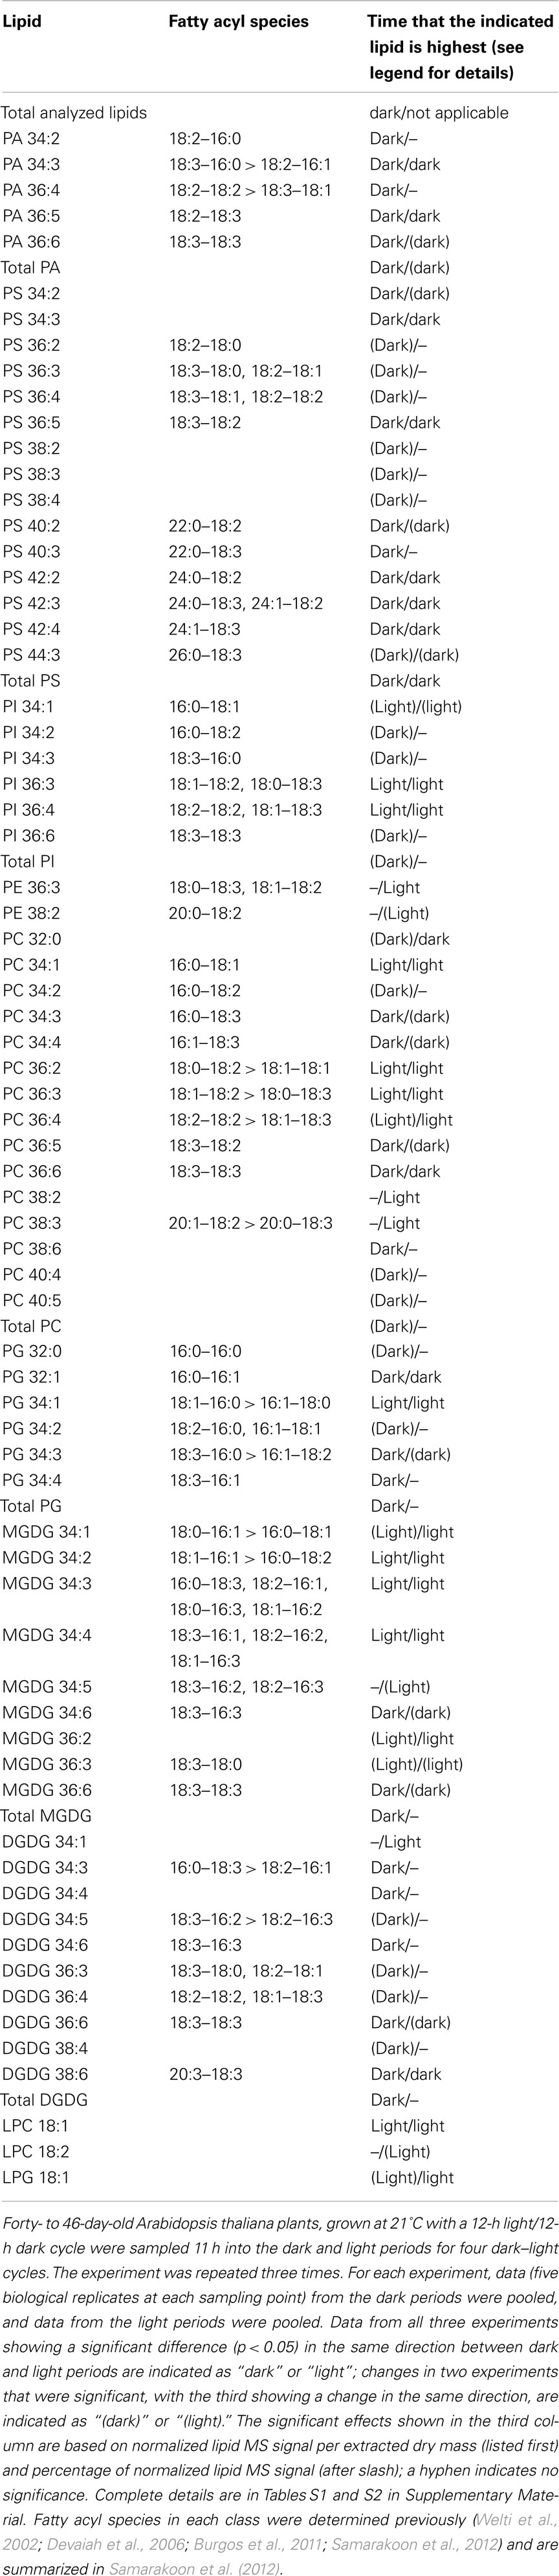
Table 1. Polar lipid molecular species significantly changed at end of dark or light period.
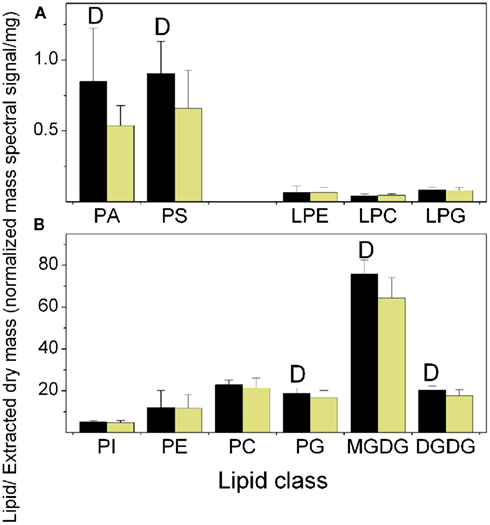
Figure 2. Total lipid in each class at the end of the dark and light periods. The data are from Experiment 1. (A) Minor diacyl polar lipids and lysophospholipids, (B) Major diacyl polar lipids. The black bars represent the levels at the end of the dark period and the light yellow bars represent the levels at the end of the light period. The “D” symbol indicates that the amount of normalized mass spectral signal per extracted dry mass was significantly higher (p < 0.05) at the end of the dark period than at the end of the light period in this experiment. n = 20 for dark; n = 19 for light.
As shown in Figure 2 and Table 1, lipid classes that were significantly higher at the end of the dark period in all three experiments, on the basis of signal per extracted dry mass, were PA, PS, PG, MGDG, and DGDG. When the data are considered on the basis of percentage of total polar lipid signal, only the PA (in 2 experiments) and PS (in all 3 experiments) classes were significantly higher in the dark. These data confirmed the result of the initial experiment in which an increase in total PA in the dark was observed (Figure 1). PA and PS were the only two classes in which all significantly changed lipid species within the classes were higher in the dark. This was true whether the data were normalized to extracted dry mass or considered as percentage of total lipid signal.
On the other hand, regardless of the way the data were normalized, the PC, PG, and MGDG classes included molecular species that were significantly increased in the light period and others that were significantly increased in the dark period (Figure 3; Table 1; Tables S1 and S2 in Supplementary Material). PC 34:1, 36:2, 36:3, and 36:4, PG 34:1, and MGDG 34:2, 34:3, 34:4, and 36:2 were consistently higher in the light than in the dark. None of these lipid species are desaturated to the fullest extent possible. Although some of the total acyl carbon: total acyl carbon–carbon double bond designations represent more than one compound, most of these apparent molecular species include a combination of fatty acyl species containing 18:1 (Table 1). In contrast, PC, PG, and MGDG molecular species that are consistently higher at 11 h into the dark period include PC 34:3, 34:4, 36:5, and 36:6, PG 34:4, 34:3, and MGDG 34:6 and 36:6. These lipids all include a fatty acyl species combination containing 18:3 (Table 1).
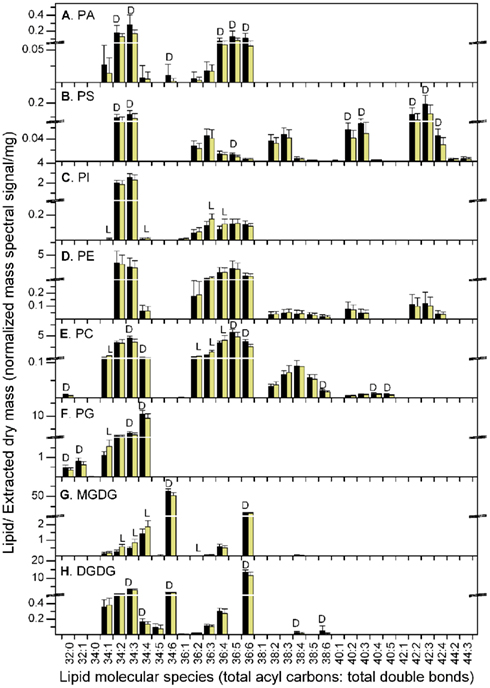
Figure 3. Lipid molecular species at the end of the dark and light periods. The data are from Experiment 1. (A) PA, (B) PS, (C) PI, (D) PE, (E) PC, (F) PG, (G) MGDG, (H) DGDG. The black bars represent the levels at the end of the dark period and the light yellow bars represent the levels at the end of the light period. The “D” symbol indicates that the amount of normalized mass spectral signal per extracted dry mass was significantly higher (p < 0.05) at the end of the dark period than at the end of the light period in this experiment, while the “L” symbol indicates that the amount of normalized mass spectral signal per extracted dry mass was significantly higher (p < 0.05) at the end of the light period than at the end of the dark period. n = 20 for dark; n = 19 for light. Note the break in the y-axis and the change in scales above and below the break.
The importance of unsaturation in distinguishing lipid composition in the light and dark periods is supported by examining the loadings values from the Principal Component Analysis (Table S3 in Supplementary Material). These values indicate the lipids most important in accounting for the variance in Factors 1 and 2. Factor 1 was related primarily to unsaturation, with positive values associated with higher unsaturation; samples collected at the end of dark period tended to have higher values of Factor 1. Factor 2 was negatively related to the abundance of PS and PA species; samples collected at the end of the dark period had higher levels of PS and PA and tended to have lower values of Factor 2.
Collision induced dissociation time-of-flight MS (CID–TOF MS) confirmed the changes in fatty acyl composition indicated by changes in polar lipid molecular species composition. After ESI of the lipid extract in negative mode, all ions were allowed to pass into the collision cell of a quadrupole TOF mass spectrometer without mass/charge (m/z) selection in the first quadrupole. The lipid ions were fragmented as a group in the collision cell and scanned by TOF MS. The negative-ion fragment spectrum provides accurate m/z data of all fatty acyl chains in the sample. Although the observed intensities may not be directly proportional to the abundance of each acyl species in the original mixture, the values allow comparison of the relative abundance of acyl species among samples (Esch et al., 2007).
In Table 2, the CID–TOF MS data are presented as percentage of total observed signal. Individual CID–TOF MS sample data are supplied in the Table S8 in Supplementary Material in Excel format. The data clearly show that 18:3 and 16:3 fatty acyl chains were higher at the end of the dark period, while 16:1, 16:2, 18:0, and 18:1 chains were higher in the light period. In particular, and consistent with the results of Ekman et al. (2007), 18:1 was increased to a large extent, here determined to be 53–70%, during the light period.
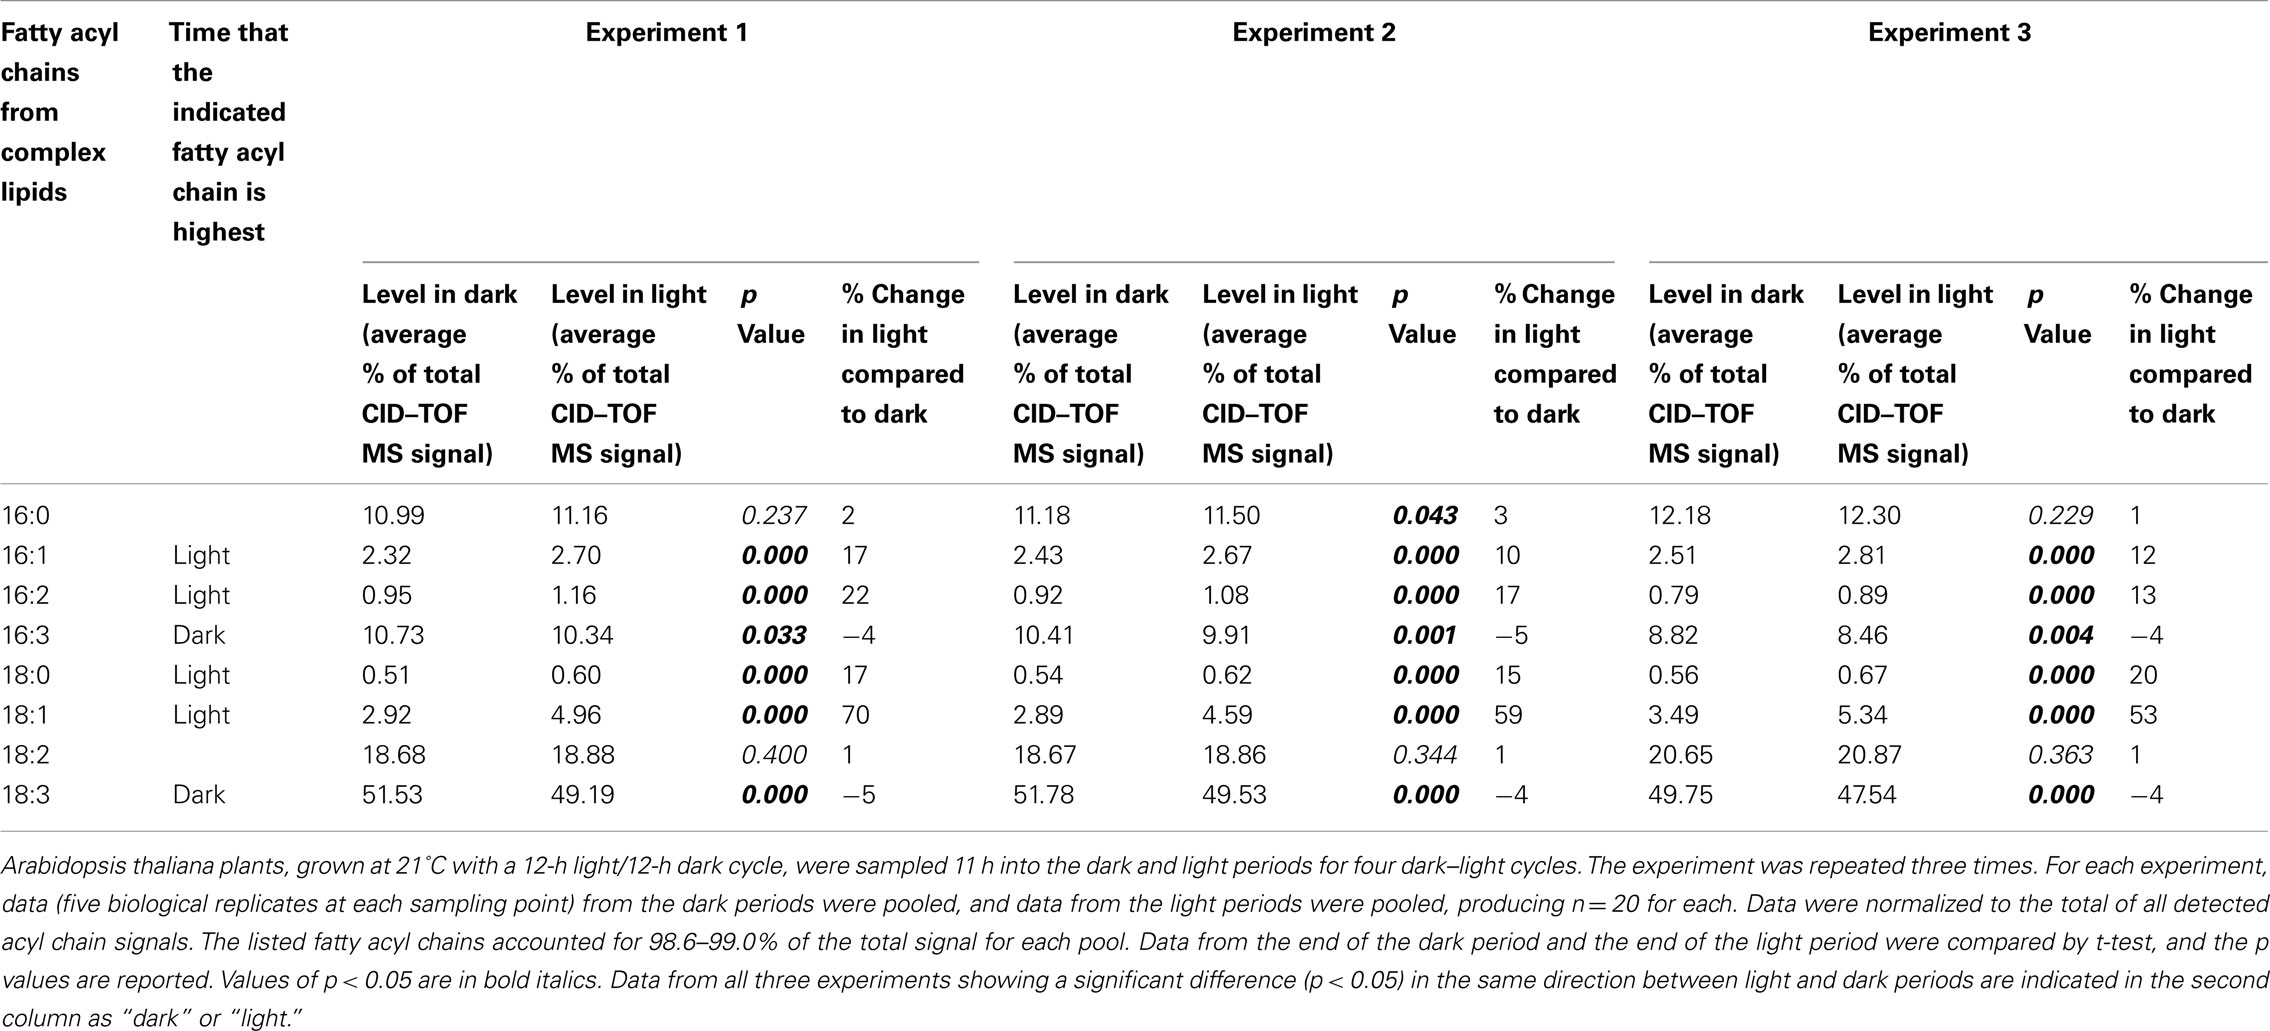
Table 2. Fatty acyl chain levels (% of signal) determined by CID–TOF mass spectrometry.
The higher levels of 18:1 during the light period were reflected in consistent increases in the lysophospholipid species LPC 18:1 and LPG 18:1 in the light period (Table 1; Figure 4). PI molecular species followed a pattern similar to PC species, with 18:1-containing species higher in the light and 18:3-containing species higher in the dark. The PE class was the least affected by consistent diurnal fluctuations.
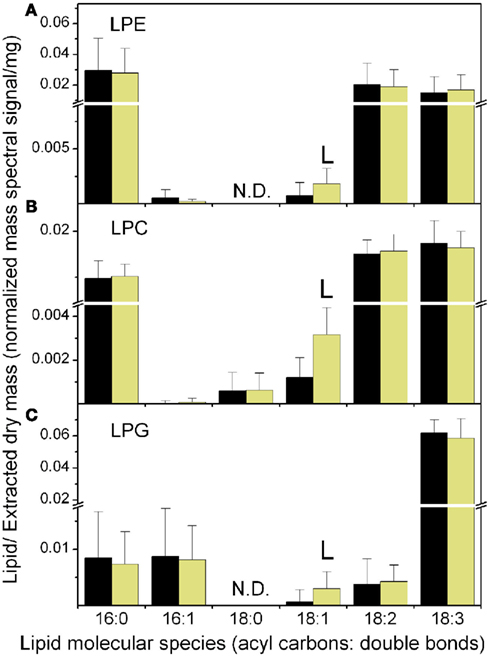
Figure 4. Lysophospholipid molecular species at the end of the dark and light periods. The data are from Experiment 1. (A) LPE, (B) LPC, (C) LPG. The black bars represent the levels at the end of the dark period and the light yellow bars represent the levels at the end of the light period. The “L” symbol indicates that the amount of normalized mass spectral signal per extracted dry mass was significantly higher (p < 0.05) at the end of the light period than at the end of the dark period. N.D. indicates that LPE 18:0 and LPG 18:0 were not determined. n = 20 for dark; n = 19 for light. Note the break in the y-axis and the change in scales above and below the break.
Phosphatidic acid functions both as a biosynthetic precursor and as a signaling molecule. As a biosynthetic precursor, PA 34:1 (16:0/18:1) or PA 36:2 (18:1/18:1) is formed de novo either within the plastid or in the endoplasmic reticulum. The PA species that were significantly higher in the dark were mainly highly unsaturated molecular species, perhaps not obviously consistent with PA’s role as a biosynthetic precursor, so the possibility that some portion of cycling PA was formed by hydrolysis of phospholipids containing polyunsaturated fatty acids was considered. It was hypothesized that temporal PA cycling might be due to the action of phospholipase D (PLD), which can hydrolyze phospholipids to form PA. If phospholipid hydrolysis were occurring in the dark to a greater extent than in the light, removal of the hydrolyzing enzyme should reduce the magnitude of the difference between PA levels in dark and light. To begin to test this hypothesis, plants deficient in three of the 12 phospholipase D gene products (Li et al., 2009) were subjected to dark–light cycles along with the wild-type plants in Experiments 1, 2, and 3, and their leaf lipids were extracted and analyzed. The analyzed mutants included a PLDα1 knockout mutant (pldα1), a PLDα1-antisense-suppressed line, an α-subunit-of-a-G-protein knockout mutant [gpa1, Gα suppresses PLDα1 (Zhao and Wang, 2004)], PLDζ1 and PLDζ2 knockouts (pldζ1 and pldζ2), and a double knockout of PLDζ1/ζ2. Table 3 shows that some of the mutants differed from wild-type plants in basal leaf levels of PA. Additionally, in most cases, the mutants, like wild-type plants, showed significantly lower levels of PA near the end of the light period than near the end of the dark period. This indicates that some PA cycling occurs in the mutants. However, when the magnitude of the difference in light and dark PA levels was compared, significantly less change was observed for total PA in leaves of PLDα1-antisense-suppressed plants than in total PA in leaves of wild-type plants in Experiment 1. However, in Experiment 2, no significant change in the magnitude of light–dark PA difference was observed in PLDα1-antisense-suppressed or in pldα1 vs. wild-type. In other words, the importance of PLDα1 in producing the increased in PA in the dark, suggested in Experiment 1, was not confirmed in Experiment 2. Still, in Experiment 2, the gpa1 mutant had significantly greater PA light–dark difference than wild-type. Since Gα suppresses PLDα1, deficiency of Gα might accentuate PLDα1 activity. Taken together, Experiments 1 and 2 provide a hint, but do not clearly indicate, that PLDα1 may be contributing to higher levels of total PA in the dark period of the diurnal cycle. In Experiment 3, the pldζ2 mutant tended to have a smaller light–dark leaf total PA difference and the pldζ1/pldζ2 did have a smaller light–dark leaf total PA difference than wild-type, implying that PLDζ2 is contributing to the higher total PA levels observed in wild-type in the dark. Analyzing larger numbers of mutant and wild-type plants will be required to more clearly delineate the role of each PLD gene product in diurnal leaf PA cycling, but taken together, the data suggest PLD involvement.
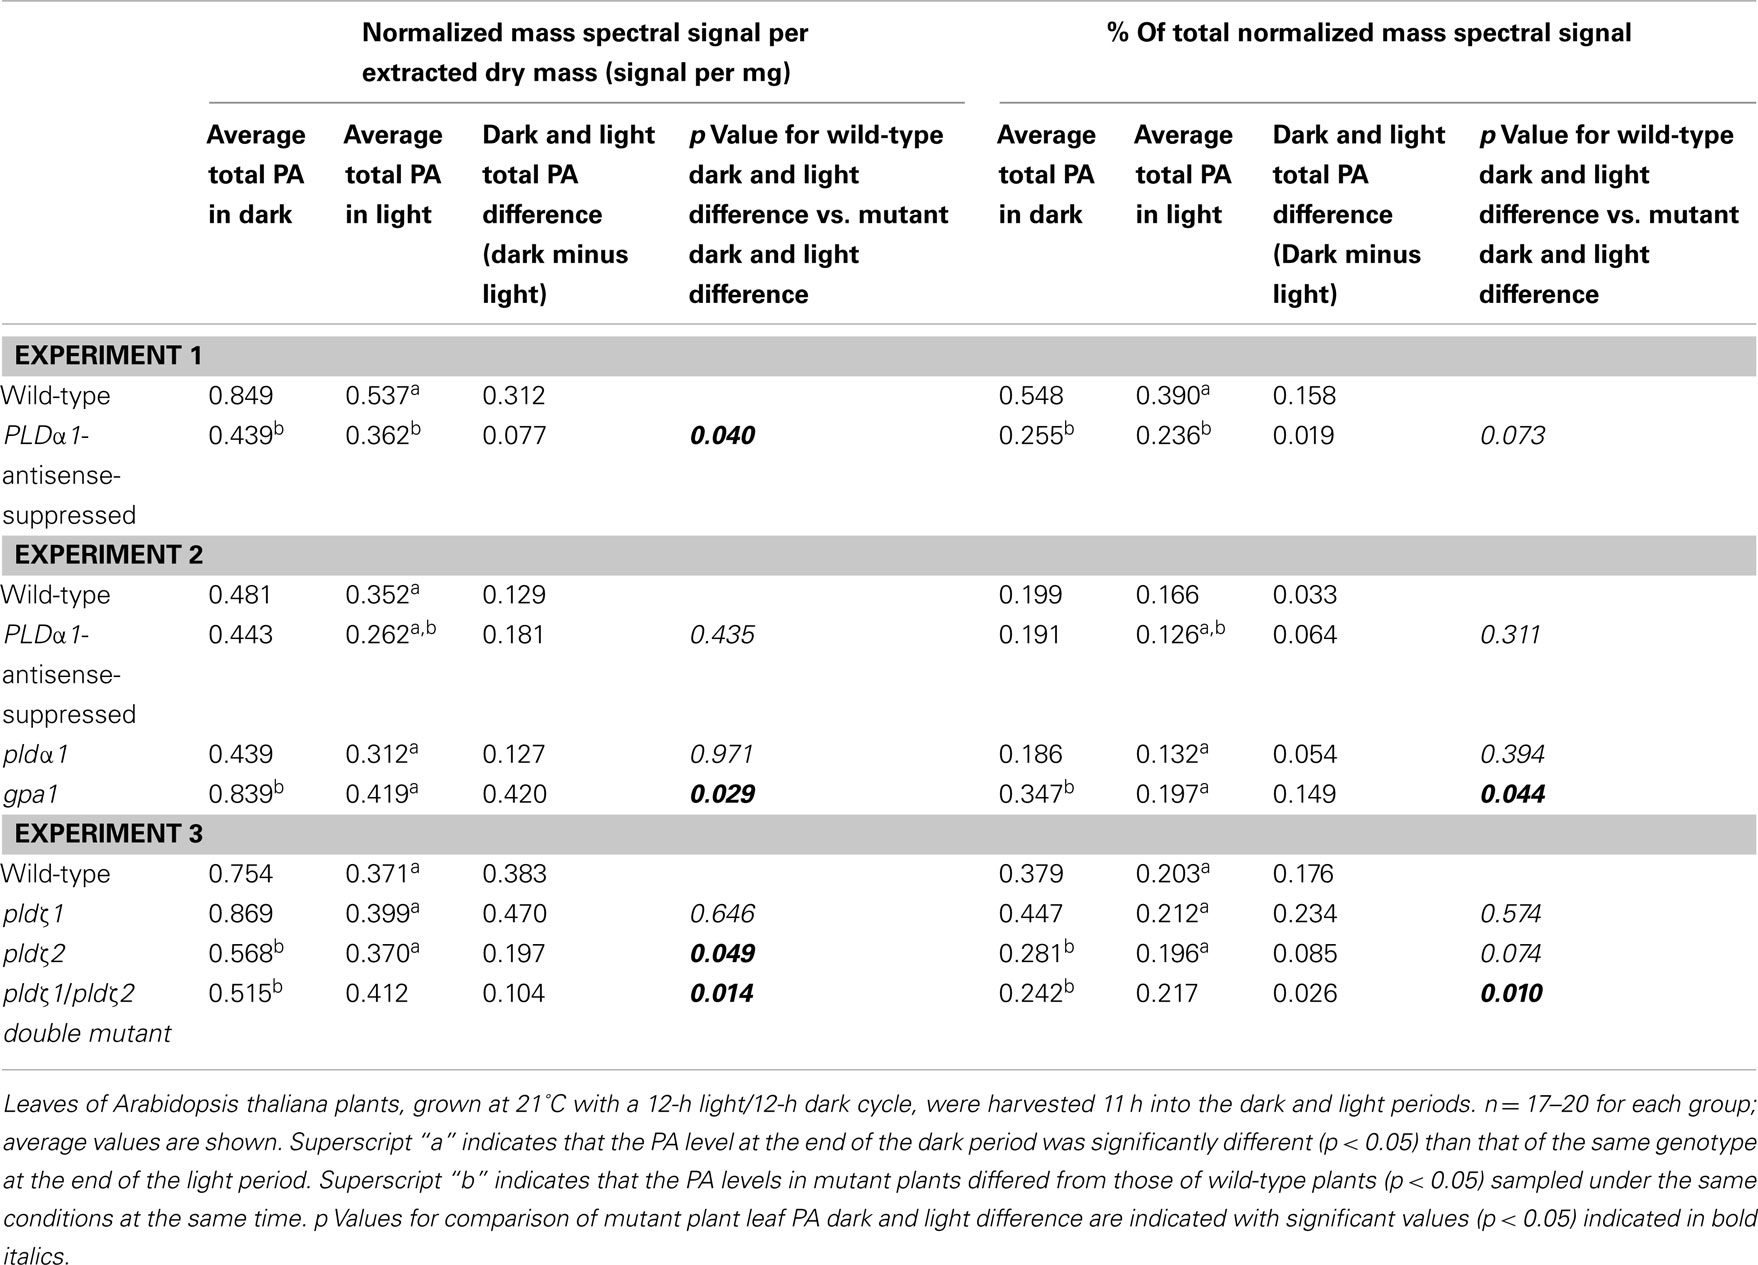
Table 3. Comparison of differences in dark and light leaf total PA levels for wild-type plants vs. plants defective in selected phospholipase Ds or their regulation.
Discussion
The data support the conclusion of Ekman et al. (2007) that light and time of day affect lipid composition in Arabidopsis leaves. The results highlight the need for considering these factors in design of lipid profiling experiments.
The CID–TOF MS data confirm previous results showing that levels of 18:1 acyl chains in plant leaves are increased during the light period of the diurnal cycle and 18:3 levels are increased in the dark period (Browse et al., 1981; Ekman et al., 2007). Additionally the data show that 18:0, 16:1, and 16:2 are higher at the end of the light period and 16:3 is highest at the end of the dark period. The CID–TOF MS data are generally in concert with data on apparent molecular species obtained by direct infusion ESI triple quadrupole MS. ESI triple quadrupole MS data, determined at the level of total acyl carbons: total carbon–carbon double bonds, are annotated with individual acyl chains (Table 1); the individual chain data were obtained through previous product ion analyses by our group and others (Welti et al., 2002; Devaiah et al., 2006; Burgos et al., 2011; Samarakoon et al., 2012). The only fatty acid chain with CID–TOF MS-observed overall levels not easily predicted from the molecular species analysis was 16:1. In Arabidopsis leaves, “16:1” is a combination of fatty acids, including 7,8-cis-16:1, a biosynthetic intermediate found in MGDG, and 3,4-trans-16:1, a biosynthetic product found in PG. The data on MGDG and PG species (Table 1) suggest that 7,8-cis-16:1 may be higher in the light (like total 16:1, Table 2), while 3,4-trans-16:1 may be higher in the dark period.
Figure 5 depicts our interpretation of current thinking about polar lipid biosynthetic pathways and indicates that the lipid profile data presented here are consistent with the interpretation that fatty acid chains continue to become more unsaturated in the dark period, when fatty acid synthesis is slowed or stopped (Browse et al., 1981). The white areas in Figure 5 show reactions that are temporally linked closely to fatty acid synthesis, which takes place within the plastid. In the plastid, fatty acids are sequentially transferred from acyl carrier protein (ACP) to glycerol-3-phosphate (G3P) to form mainly PA 34:1 (18:1/16:0; reviewed by Ohlrogge and Browse, 1995). PA 34:1 can be converted to diacylglycerol (DAG) 34:1 or used to form PG 34:1 (18:1/16:0). Fatty acid synthetic products, 16:0 and 18:1, can be transferred to the endoplasmic reticulum where the activated fatty acids are present as acyl CoAs (Ohlrogge and Browse, 1995). In the endoplasmic reticulum, 16:0 and 18:1 can be transferred sequentially to G3P to form PA, which is dephosphorylated to DAG, and PC can be synthesized from this DAG. If this occurs with 16:0 and 18:1 imported from the plastid, the PC products would be mainly 34:1 (16:0/18:1) and 36:2 (18:1/18:1). Side routes off the PA-to-PC pathway can produce PI, PE, PG, or PS with the same saturated or mono-unsaturated fatty acyl chains (Ohlrogge and Browse, 1995; Yamaoka et al., 2011).
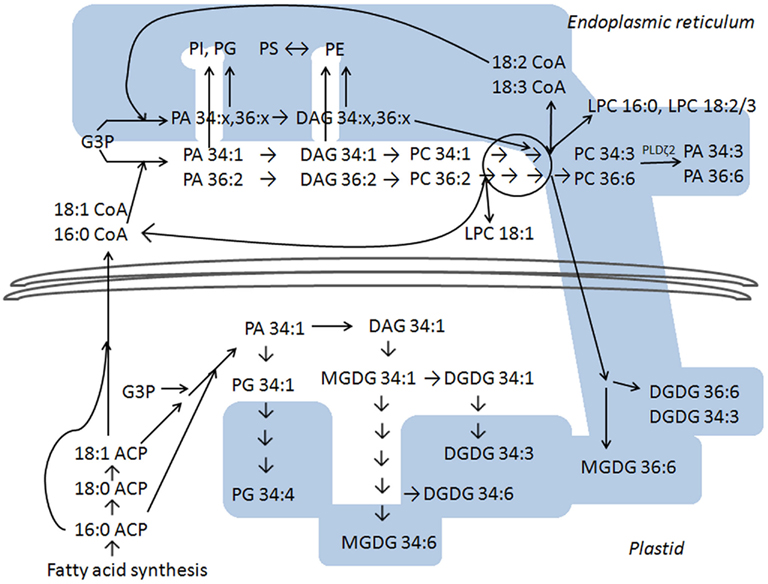
Figure 5. Metabolic pathway in plant polar glycerolipid biosynthesis, based on Ohlrogge and Browse (1995), Bates et al. (2007, 2009), and Benning (2009). The white area indicates lipid species that reach higher levels at the end of the light period than at the end of the dark period, and the blue area indicates lipids that are higher at the end of the dark period. The lower section of the diagram represents reactions that take place in the plant plastid and the upper section of the diagram represents reactions that take place outside the plastid (in the endoplasmic reticulum). PC hydrolysis by PLD is depicted on the upper right; among PLD gene products tested, PLDζ2 is most clearly implicated in formation of PA in the dark. No attempt is made to suggest specific details as to location within the plastidic or extraplastidic (endoplasmic reticulum) sites. Details are discussed in the text. Abbreviations not defined elsewhere include: ACP for acyl carrier protein, CoA for Coenzyme A, DAG for diacylglycerol, and G3P for glycerol-3-phosphate.
The initially formed plastidic PG, galactolipids, and extraplastidically produced PC can be desaturated. The data show the later metabolites in the plastidic lipid desaturation pathway (the pathways leading to PG 34:4, MGDG 34:6, DGDG 34:3, and DGDG 34:6) are at higher levels at the end of the dark period than at the end of the light period, indicating that the final steps of plastidic desaturation continue when plants are in the dark. The positions of particular DGDG and MGDG species within their respective biosynthetic pathways account for the observations that DGDG 34:3 is high in the dark, while MGDG 34:3 is high in the light. Similarly, PG 32:1 is high in the dark because, when formed by the minor pathway that converts PA 16:0/16:0 to PG 16:0/16:0 and then to PG 16:0/3,4-trans-16:1, PG 32:1 lies at the terminal position in the pathway. Outside the plastid, desaturation can occur on PC, converting PC 34:1 sequentially to PC 34:2 to PC 34:3, and PC 36:2, stepwise, to PC 36:6.
Bates et al. (2007, 2009) have shown that PC is subject to “acyl editing,” or release of a fatty acid (or fatty acyl CoA) and LPC. LPC can be acylated with a newly synthesized or released, activated acyl chain, or the released fatty acyl chain, which may be polyunsaturated, may be used to acylate G3P (or lysoPA). Rapid deacylation of less unsaturated PC species, such as PC 34:1 or PC 36:2, present at high levels in the light due to 16:0 and 18:1 synthesis, could produce LPC 18:1 and/or LPC 16:0 plus 16:0 and 18:1 or their CoA derivatives in the light (Bates et al., 2007, 2009; Tjellström et al., 2012). Indeed, LPC 18:1 was observed at a high level at the end of the light period.
The incorporation of fatty acids released from PC into PA can provide for the formation of PI, extraplastidic PG, PE, and PS with polyunsaturated acyl chains (Bates et al., 2009). The data imply that this pathway continues in the dark period; this accounts for higher levels, particularly of PS species, in the dark. PS synthesis from PE (Yamaoka et al., 2011) may take a particularly long time, as it is toward the end of the synthetic sequence. “Eukaryotic” MGDG and DGDG (MGDG 36:6 and DGDG 36:6) are formed by import into the plastid and desaturation of primarily polyunsaturated acyl components from PC (reviewed by Benning, 2009). The data show that these species continue to be formed in the dark period.
Many PA species were also found to reach high levels at the end of the dark period. As just discussed, the observed cycling of PA may be due to continued fatty acyl desaturation and the incorporation of polyunsaturated fatty acyl chains into PA in the dark, raising PA levels. Also, the PA may be utilized less readily for synthesis of some membrane lipids in the dark than in the light, potentially due to light-dependence of biosynthetic machinery, causing PA levels to rise. Indeed, Yamaryo et al. (2003) found that the action of MGDG synthase in cucumber cotyledons was dependent on the presence of light. On the other hand, the large magnitude of PA cycling in the diurnal cycle may suggest that another mechanism, such as PLD activity, could be contributing to PA production. Our data suggest that multiple mechanisms are involved in light–dark differences in total PA levels. Knockout or suppression of specific PLD genes does not remove light–dark differences completely, but knockout of PLDζ2 appeared to reduce light–dark differences in leaf total PA. PLDζs hydrolyze PC specifically (Li et al., 2006b), and the highly unsaturated acyl composition of PA in the dark is consistent with the increase in PA being in part derived from hydrolysis of unsaturated PC by PLDζ2. Analysis of mutants related to PLDα1 function did not provide conclusive results, but hinted that PLDα1 may also contribute to observed PA diurnal changes. In terms of gene expression in leaves of Columbia-0 accession grown on a 12-h light/12-h dark cycle, neither PLDα1 nor PLDζ2 is expressed at higher levels in the dark. While PLDζ2 expression does not vary with light and dark, PLDα1 expression is slightly lower in the dark than in the light (Bläsing et al., 2005); lower expression would seem to be inconsistent with a role for PLDα1 in producing the observed PA increases in the dark. However, the enzymatic activities of PLDs are regulated by calcium binding, membrane-binding, and Gα interactions (Wang, 2005); in general, these interactions are more important in controlling PLD function than changes in gene expression.
It is interesting to consider the potential functional ramifications of the diurnal lipid compositional changes. The increased unsaturation of lipids formed in the dark, even at constant temperature, may provide a functional advantage for a plant coping with the lower temperatures that typically occur at night; plants subjected to cold generally do increase the unsaturation of their membrane lipids (e.g., Welti et al., 2002). PA and PS, both increasing at night, have the potential to regulate the function of proteins and/or participate in signaling cascades (Vance and Steenbergen, 2005; Wang et al., 2006). Homozygous knockout mutants in Arabidopsis PHOSPHATIDYLSERINE SYNTHASE1 have no PS and are infertile dwarves; heterozygous plants have defects in microspore development (Yamaoka et al., 2011). In mammals, PS regulates the function of signaling proteins, including protein kinase C isoforms, cRaf1 protein kinase, and heat-shock protein Hsp70 (reviewed by Vance and Steenbergen, 2005). PA is known to bind to a variety of plant signaling proteins, including protein phosphatase 2C-like, ABI1, 3′-phosphoinositide-dependent kinase 1, AtPDK1, and Ca2+-dependent protein kinase CDPK (reviewed by Wang et al., 2006). Future analysis of lipid composition at the cellular and subcellular levels will be useful in dissecting the roles of lipid cycling.
Conflict of Interest Statement
The authors declare that the research was conducted in the absence of any commercial or financial relationships that could be construed as a potential conflict of interest.
Acknowledgments
We are grateful for interaction with Dr. Haiyan Wang and Celeste Yang, for the assistance of Steven Wynn Esch in collection of the CID–TOF MS data, and for technical assistance from Cynthia Buel. The authors are grateful to the reviewers, whose comments helped us improve the manuscript. The work was supported by NSF grants to Ruth Welti and Xuemin Wang (MCB 0920663, 0920681, and 0455318). NSF had no input into the collection, analysis, or interpretation of data, in the writing of the report, or in the decision to submit the paper for publication. Equipment acquisition at the Kansas Lipidomics Research Center was funded by the National Science Foundation (EPS 0236913 and DBI 0521587), Kansas Technology Enterprise Corporation, Kansas IDeA Networks of Biomedical Research Excellence (INBRE) of the National Institutes of Health (P20 RR16475), and Kansas State University. Contribution no. 12-238-J from the Kansas Agricultural Experiment Station.
Supplementary Material
The Supplementary Material for this article can be found online at http://www.frontiersin.org/Plant_Physiology/10.3389/fpls.2012.00049/abstract
Data Sheet 1.PDF includes Supplemental Table 1, 2, 3 and Supplementary Figure 1
Data Sheet 2.XLS includes Supplemental Table 4
Data Sheet 3.XLS includes Supplemental Table 5
Data Sheet 4.XLS includes Supplemental Table 6
Data Sheet 5.XLS includes Supplemental Table 7
Data Sheet 6.XLS includes Supplemental Table 8
References
Alonso, J. M., Stepanova, A. N., Leisse, T. J., Kim, C. J., Chen, H., Shinn, P., Stevenson, D. K., Zimmerman, J., Barajas, P., Cheuk, R., Gadrinab, C., Heller, C., Jeske, A., Koesema, E., Meyers, C. C., Parker, H., Prednis, L., Ansari, Y., Choy, N., Deen, H., Geralt, M., Hazari, N., Hom, E., Karnes, M., Mulholland, C., Ndubaku, R., Schmidt, I., Guzman, P., Aguilar-Henonin, L., Schmid, M., Weigel, D., Carter, D. E., Marchand, T., Risseeuw, E., Brogden, D., Zeko, A., Crosby, W. L., Berry, C. C., and Ecker, J. R. (2003). Genome-wide insertional mutagenesis of Arabidopsis thaliana. Science 301, 653–657.
Bates, P. D., Durrett, T. P., Ohlrogge, J. B., and Pollard, M. (2009). Analysis of acyl fluxes through multiple pathways of triacylglycerol synthesis in developing soybean embryos. Plant Physiol. 150, 55–72.
Bates, P. D., Ohlrogge, J. B., and Pollard, M. (2007). Incorporation of newly synthesized fatty acids into cytosolic glycerolipids in pea leaves occurs via acyl editing. J. Biol. Chem. 282, 31206–31216.
Benning, C. (2009). Mechanisms of lipid transport involved in organelle biogenesis in plant cells. Annu. Rev. Cell Dev. Biol. 25, 71–91.
Bessoule, J. J., Testet, E., and Cassagne, C. (1995). Synthesis of phosphatidylcholine in the chloroplast envelope after import of lysophosphatidylcholine from endoplasmic reticulum membranes. Eur. J. Biochem. 228, 490–497.
Bläsing, O. E., Gibon, Y., Günther, M., Höhne, M., Morcuende, R., Osuna, D., Thimm, O., Usadel, B., Scheible, W. R., and Stitt, M. (2005). Sugars and circadian regulation make major contributions to the global regulation of diurnal gene expression in Arabidopsis. Plant Cell 17, 3257–3281.
Browse, J., Roughan, P. G., and Slack, C. R. (1981). Light control of fatty acid synthesis and diurnal fluctuations of fatty acid composition in leaves. Biochem. J. 196, 347–354.
Burgos, A., Szymanski, J., Seiwart, B., Degenkolbe, T., Hannah, M. A., Giavalisco, P., and Willmitzer, L. (2011). Analysis of short-term changes in the Arabidopsis thaliana glycerolipidome in response to temperature and light. Plant J. 66, 656–668.
Devaiah, S. P., Roth, M. R., Baughman, E., Li, M., Tamura, P., Jeannotte, R., Welti, R., and Wang, X. (2006). Quantitative profiling of polar glycerolipid species and the role of phospholipase Dα1 in defining the lipid species in Arabidopsis tissues. Phytochemistry 67, 1907–1924.
Ekman, A., Bulow, L., and Stymne, S. (2007). Elevated atmospheric CO2 concentration and diurnal cycle induce changes in lipid composition in Arabidopsis thaliana. New Phytol. 174, 591–599.
Esch, S. W., Tamura, P., Sparks, A. A., Roth, M. R., Devaiah, S. P., Heinz, E., Wang, X., Williams, T. D., and Welti, R. (2007). Rapid characterization of the fatty acyl composition of complex lipids by collision-induced dissociation time-of-flight mass spectrometry. J. Lipid Res. 48, 235–241.
Fan, L., Zheng, S., and Wang, X. (1997). Antisense suppression of phospholipase D alpha retards abscisic acid- and ethylene-promoted senescence of postharvest Arabidopsis leaves. Plant Cell 9, 2183–2196.
Kjellberg, J. M., Trimborn, M., Andersson, M., and Sandelius, A. S. (2000). Acyl-CoA dependent acylation of phospholipids in the chloroplast envelope. Biochim. Biophys. Acta 1485, 100–110.
Koivusalo, M., Haimi, P., Heikinheimo, L., Kostiainen, R., and Somerharju, P. (2001). Quantitative determination of phospholipid compositions by ESI-MS: effects of acyl chain length, unsaturation, and lipid concentration on instrument response. J. Lipid Res. 42, 663–672.
Li, M., Hong, Y., and Wang, X. (2009). Phospholipase D- and phosphatidic acid-mediated signaling in plants. Biochim. Biophys. Acta 1791, 927–935.
Li, M., Qin, C., Welti, R., and Wang, X. (2006a). Double knockouts of phospholipases Dζ1 and Dζ2 in Arabidopsis affect root elongation during phosphate-limited growth but do not affect root hair patterning. Plant Physiol. 140, 761–770.
Li, M., Welti, R., and Wang, X. (2006b). Quantitative profiling of Arabidopsis polar glycerolipids in response to phosphorus starvation. Roles of phospholipases Dζ1 and Dζ2 in phosphatidylcholine hydrolysis and digalactosyldiacylglycerol accumulation in phosphorus-starved plants. Plant Physiol. 142, 750–761.
Matos, A. R., and Pham-Thi, A. T. (2009). Lipid deacylating enzymes in plants: old activities, new genes. Plant Physiol. Biochem. 47, 491–503.
Mishra, G., Zhang, W., Deng, F., Zhao, J., and Wang, X. (2006). A bifurcating pathway directs abscisic acid effects on stomatal closure and opening in Arabidopsis. Science 312, 264–266.
Ohlrogge, J. B., Kuhn, D. N., and Stumpf, P. K. (1979). Subcellular localization of acyl carrier protein in leaf protoplasts of Spinacia oleracea. Proc. Natl. Acad. Sci. U.S.A. 76, 1194–1198.
Samarakoon, T., Shiva, S., Lowe, K., Tamura, P., Roth, M. R., and Welti, R. (2012). “Arabidopsis thaliana membrane lipid molecular species and their mass spectral analysis,” in High Throughput Phenotyping in Plants, Methods in Molecular Biology. ed. J. Normanly (New York, NY: Humana Press). (in press).
Sasaki, Y., Kozaki, A., and Hatano, M. (1997). Link between light and fatty acid synthesis: thioredoxin-linked reductive activation of plastidic acetyl-CoA carboxylase. Proc. Natl. Acad. Sci. U.S.A. 94, 11096–11101.
Savage, L. J., and Ohlrogge, J. B. (1999). Phosphorylation of pea chloroplast acetyl-CoA carboxylase. Plant J. 18, 521–527.
Stymne, S., and Stobart, A. K. (1984). Evidence for the reversibility of the acyl-CoA:lysophosphatidylcholine acyltransferase in microsomal preparations from developing safflower (Carthamus tinctorius L.) cotyledons and rat liver. Biochem. J. 223, 305–314.
Tjellström, H., Yang, Z., Allen, D. K., and Ohlrogge, J. B. (2012). Rapid kinetic labeling of Arabidopsis cell suspension cultures: implications for models of lipid export from plastids. Plant Physiol. 158, 601–611.
Vance, J. E., and Steenbergen, R. (2005). Metabolism and function of phosphatidylserine. Prog. Lipid Res. 44, 207–234.
Wang, X. (2005). Regulatory functions of phospholipase D and phosphatidic acid in plant growth, development, and stress responses. Plant Physiol. 139, 566–573.
Wang, X., Devaiah, S. P., Zhang, W., and Welti, R. (2006). Signaling functions of phosphatidic acid. Prog. Lipid Res. 45, 250–278.
Wanjie, S. W., Welti, R., Moreau, R. A., and Chapman, K. D. (2005). Identification and quantification of glycerolipids in cotton fibers: reconciliation with metabolic pathway predictions from DNA databases. Lipids 40, 773–785.
Welti, R., Li, W., Li, M., Sang, Y., Biesiada, H., Zhou, H., Rajashekar, C. B., Williams, T. D., and Wang, X. (2002). Profiling membrane lipids in plant stress responses. Role of phospholipase Dα in freezing-induced lipid changes in Arabidopsis. J. Biol. Chem. 277, 31994–32002.
Yamaoka, Y., Yu, Y., Mizoi, J., Fujiki, Y., Saito, K., Nishijima, M., Lee, Y., and Nishida, I. (2011). Phosphatidylserine synthase1 is required for microspore development in Arabidopsis thaliana. Plant J. 67, 648–661.
Yamaryo, Y., Kanai, D., Awai, K., Shimojima, M., Masuda, T., Shimada, H., Takamiya, K., and Ohta, H. (2003). Light and cytokinin play a co-operative role in MGDG synthesis in greening cucumber cotyledons. Plant Cell Physiol. 44, 844–855.
Zhang, W., Qin, C., Zhao, J., and Wang, X. (2004). Phospholipase Dα1-derived phosphatidic acid interacts with ABI1 phosphatase 2C and regulates abscisic acid signaling. Proc. Natl. Acad. Sci. U.S.A. 101, 9508–9513.
Keywords: Arabidopsis thaliana leaves, diurnal cycle, galactolipids, lipidomics, mass spectrometry, phosphatidic acid, phospholipase D, phospholipids
Citation: Maatta S, Scheu B, Roth MR, Tamura P, Li M, Williams TD, Wang X and Welti R (2012) Levels of Arabidopsis thaliana leaf phosphatidic acids, phosphatidylserines, and most trienoate-containing polar lipid molecular species increase during the dark period of the diurnal cycle. Front. Plant Sci. 3:49. doi: 10.3389/fpls.2012.00049
Received: 17 December 2011; Accepted: 27 February 2012;
Published online: 14 March 2012.
Edited by:
Kent D. Chapman, University of North Texas, USAReviewed by:
Changcheng Xu, Brookhaven National Laboratory, USALionel Faure, University of North Texas, USA
Copyright: © 2012 Maatta, Scheu, Roth, Tamura, Li, Williams, Wang and Welti. This is an open-access article distributed under the terms of the Creative Commons Attribution Non Commercial License, which permits non-commercial use, distribution, and reproduction in other forums, provided the original authors and source are credited.
*Correspondence: Ruth Welti, Division of Biology, Kansas Lipidomics Research Center, Kansas State University, Manhattan, KS 66506-4901, USA. e-mail: welti@ksu.edu