Viral vector-based reversible neuronal inactivation and behavioral manipulation in the macaque monkey
- 1Systems Neurobiology Laboratory, Salk Institute for Biological Studies, La Jolla, CA, USA
- 2National Eye Institute, National Institutes of Health, Bethesda, MD, USA
Viral vectors are promising tools for the dissection of neural circuits. In principle, they can manipulate neurons at a level of specificity not otherwise achievable. While many studies have used viral vector-based approaches in the rodent brain, only a few have employed this technique in the non-human primate, despite the importance of this animal model for neuroscience research. Here, we report evidence that a viral vector-based approach can be used to manipulate a monkey's behavior in a task. For this purpose, we used the allatostatin receptor/allatostatin (AlstR/AL) system, which has previously been shown to allow inactivation of neurons in vivo. The AlstR was expressed in neurons in monkey V1 by injection of an adeno-associated virus 1 (AAV1) vector. Two monkeys were trained in a detection task, in which they had to make a saccade to a faint peripheral target. Injection of AL caused a retinotopic deficit in the detection task in one monkey. Specifically, the monkey showed marked impairment for detection targets placed at the visual field location represented at the virus injection site, but not for targets shown elsewhere. We confirmed that these deficits indeed were due to the interaction of AlstR and AL by injecting saline, or AL at a V1 location without AlstR expression. Post-mortem histology confirmed AlstR expression in this monkey. We failed to replicate the behavioral results in a second monkey, as AL injection did not impair the second monkey's performance in the detection task. However, post-mortem histology revealed a very low level of AlstR expression in this monkey. Our results demonstrate that viral vector-based approaches can produce effects strong enough to influence a monkey's performance in a behavioral task, supporting the further development of this approach for studying how neuronal circuits control complex behaviors in non-human primates.
Introduction
Over the last several years, neuroscience has seen the development of a set of exciting new tools for probing brain function with a high degree of specificity (Luo et al., 2008). These tools are based on introducing novel channels or receptors into neurons through the use of viral vectors. The channels or receptors are designed such that they can be used to control the activity of the infected neurons. By limiting which neurons express the novel channels or receptors, manipulations can be restricted to selected populations of neurons.
Viral vector-based approaches are now widely used in a number of animal models, with most experiments focusing on the rodent (see Fenno et al., 2011 for an overview of studies using optogenetic approaches). Only a few experiments have used these tools in the non-human primate, despite the importance of this animal model for neuroscience. Non-human primates, such as the Rhesus macaque, are highly intelligent and can be trained to perform the complex tasks needed to study higher cognitive functions. A wealth of research has identified the functional specializations across different areas of the macaque brain, and the connections within and between these brain areas have been identified anatomically (Felleman and Van Essen, 1991), but functional roles have yet to be assigned to these circuits because of a lack of suitable tools. The specificity of the viral vector-based approach promises to overcome this obstacle. However, to be useful in the monkey, viral vector-based methods have to meet a few requirements besides cell-type specificity. First, injections of virus into the monkey brain have to result in expression of the novel channels or receptors in neurons. Furthermore, expression levels have to be sufficient to allow manipulation of neural activity. Finally, in order to study the involvement of a particular group of neurons in a behavioral task, manipulations of neural activity have to be strong enough to result in measurable changes in behavior.
There are a large number of anatomical studies showing that viral vectors can be used to introduce fluorescent proteins into neurons (Luo et al., 2008). There are also a few studies demonstrating that viral vectors can be used to outfit neurons in the macaque brain with novel channels or receptors, which in turn allow control over neural activity (Tan et al., 2006; Han et al., 2009, 2011; Diester et al., 2011; Jazayeri et al., 2011; O'Shea et al., 2011). There is, however, conflicting evidence on whether these manipulations are sufficiently strong to manipulate behavior in the awake monkey. Four of the mentioned studies, all using optogenetic approaches, have tested whether activation or inactivation of neurons using light had behavioral consequences. Two of the studies (Han et al., 2009; Diester et al., 2011), in which viral injections were placed in motor areas, assessed whether optogenetic manipulations of neural activity in these areas were strong enough to influence spontaneous movements. In both cases, no effect of optogenetic stimulation on spontaneous behavior was observed. The two more recent studies (Jazayeri et al., 2011; O'Shea et al., 2011) studied behavioral consequences of optogenetic stimulation during a task. Both studies—one assessing the influences of V1 stimulation on a saccade task, and one the influences of premotor cortex inactivation on a reaching task—found small, but systematic changes in behavior during optogenetic stimulation. The small size of the evoked effects is most likely the reason why the initial studies failed to find an effect on spontaneous movements, and points to the difficulty of using a viral vector-based approach in the monkey.
In this study, we report additional evidence that a viral vector-based approach can been used to manipulate a monkey's behavior in a task. In these experiments, we used the allatostatin receptor/allatostatin (AlstR/AL) system (Birguel et al., 1999; Lechner et al., 2002) to reversibly inactivate neurons in macaque area V1. It has previously been shown that application of AL quickly and reversibly inactivates AlstR-expressing neurons in vivo (Tan et al., 2006) through opening of G-coupled inward rectifying K+ channels (Birguel et al., 1999; Lechner et al., 2002). In vivo, neurons expressing the AlstR are inactivated within a few minutes after AL application, and remain inactivated as long as they are exposed to sufficient amounts of AL. Fast recovery of neural activation is possible if the AL can be efficiently removed, for example by flushing the cortex with saline. In these cases, activity recovers within a few minutes. AL also is cleared from the brain by physiological processes, in which case the recovery of activity is slower and may take up to a few hours (Tan et al., 2006). The AlstR/AL system therefore does not allow the same precise temporal control over neural activity afforded by optogenetic stimulation. However, it may allow us to target larger populations of neurons than an optogenetic approach. The brain volume that can be targeted by optogenetic manipulations is limited by the fact that because of absorption, light levels in the brain drop with distance from the light source and eventually become too small to trigger changes in neural activity. For Channelrhodopsin-2 (ChR2), a light-gated cation channel (Boyden et al., 2005) activated by blue light, activation volumes of up to 1 mm3 have been estimated (Aravanis et al., 2007; Han et al., 2009). In case of the AlstR/AL system, the size of the targeted brain volume is determined by the diffusion of the ligand AL, which mainly depends on the amount of AL injected. The size of the brain volume that can be targeted using the AlstR/AL system is therefore likely larger than that accessible with optogenetic stimulation.
Here, we demonstrate that inactivation of AlstR-expressing V1 neurons was sufficient to impair one monkey's performance in a detection task. While these results show encouraging progress for using viral vector-based approaches in the monkey, we also demonstrate the complications of the technique by showing how large variability in AlstR expression between monkeys led to failure to produce behavioral results in a second monkey.
Materials and Methods
We used the same laboratory setup as described previously (Hafed et al., 2008; Lovejoy and Krauzlis, 2010).
Animal Preparation
We collected data from two adult, male rhesus monkeys (Macaca mulatta). Monkeys were 9–15 years of age and weighed 10–15 kg. All experimental protocols were approved by the Salk IACUC and complied with United States Public Health Service policy on the humane care and use of laboratory animals. The monkeys were prepared using standard surgical techniques described previously (Krauzlis, 2003). Briefly, a head-holder, scleral search coils (Judge et al., 1980), and a recording chamber located over V1 were implanted under isoflurane anesthesia and aseptic conditions.
Behavioral Tasks
Stimuli were presented on a CRT monitor (75 Hz refresh rate) placed 41 cm in front of the monkeys. Monkeys were trained on two tasks: a passive viewing task and a detection task. In the passive viewing task, monkeys were required to maintain fixation of a central white square (size: 0.27 × 0.27°) presented over a uniform gray background (luminance: 45 cd m−2). Each trial began with the presentation of the fixation point alone for a variable time between 300 and 800 ms, followed by the addition of a full contrast grating of 0.5–1° radius on the screen for 300–800 ms. The grating's location and orientation were varied from trial-to-trial to map the receptive field of the recorded neuron. The monkeys were required to maintain fixation 300 ms after the offset of the grating. In this passive viewing task, fixation had to be maintained within a 1 × 1° window centered on the fixation target for monkey W, and a 2 × 2° window for monkey V.
The detection task consisted of two types of trials, distinguished by whether or not a peripheral target was presented (see Figure 1). Eighty percent of the trials in a session were target-present trials. All trials began with the presentation of a central white fixation square (size: 0.16 × 0.16°) on a trial-unique, noise-textured background (size: 10 × 10°). The rest of the screen, outside of the texture, was set to a uniform gray (luminance: 45 cd m−2). The noise texture was constructed by assigning each of its pixels a gray scale value independently drawn from a Gaussian distribution. The mean of the Gaussian distribution was chosen to match the luminance of the rest of the screen, and the standard deviation σtexture was fixed at 5.5 cd/m−2. Pixel values outside of the range from 0 to 255 were set to either 0 or 255, respectively. In the target-absent trials, the central fixation square was presented for a variable time between 800 and 1400 ms before its color changed to red. After another 300–1000 ms, the fixation square and texture were removed, and the entire screen turned gray. In these target-absent trials, monkeys were rewarded if they maintained fixation of the central square as long as it was visible, irrespective of its color. In the target-present trials, the initial presentation of fixation square and texture was followed after 500–800 ms by the additional appearance of a small peripheral target. Targets measured 0.16 × 0.16° (3 × 3 pixels at our screen resolution and viewing distance), and were generated by adding a luminance increment to the gray scale values of the texture pixels at the target location. Luminance increments were expressed in terms of σtexture. Four different luminance increments were chosen for monkey W (1, 1.5, 2, 3, and 4 × σtexture). For monkey V, we added a fifth luminance increment (5 × σtexture) to decrease the overall task difficulty. Four target locations were used, chosen based on which injection site was visited. After an additional 300–600 ms, the fixation square turned red. The monkeys were required to maintain fixation within a window centered on the fixation square until this time. After the fixation spot changed color, they were trained to make a saccade directly to the location of the target: within 600 ms after the color change, their center of gaze had to leave the fixation window; after another 100 ms, it had to fall within a second window centered on the target's location. After an additional fixation period of 300 ms, the entire screen turned gray to indicate the end of the trial.
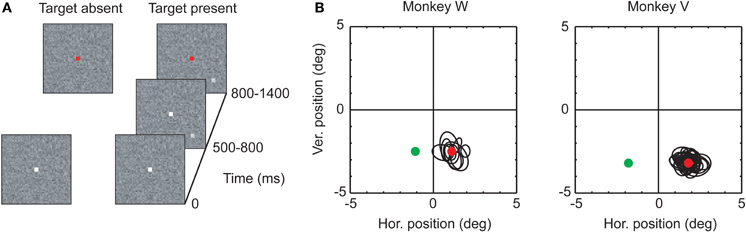
Figure 1. (A) Stimulus sequences in the two trial types (see text for a description of the task). (B) Receptive fields and target locations for the two monkeys. Black ellipses: Receptive field locations recorded at the V1 site selected for virus injection, computed from single unit and multiunit activity (see Materials and Methods). The red and green circles indicate the two target locations. Red circle: AlstR location; green circle: contralateral location.
Throughout the detection task, the fixation window had a size of 2 × 2° for monkey W, and of 3 × 2° for monkey V. Correct behavior was rewarded with juice, but to mask increased error rates in inactivation experiments, only 90% of the correct trials were rewarded.
Electrophysiological Recordings
Neuronal responses were recorded using tungsten microelectrodes (FHC) with impedances of 1–2 MΩ measured at 1 kHz. Electrodes were advanced through stainless steel guide tubes (23 gauge) with a microdrive mounted on top of the recording chamber (Narishige), which also held the guide tube. Neuronal responses were amplified and filtered (400 Hz–6 kHz) using the Multichannel Acquisition Processor system (Plexon, Inc.). Data were streamed to disk at 20 kHz using a Power1401 data acquisition interface and the Spike2 software (both from Cambridge Electronic Design). In a few initial experiments with monkey W, instead of streaming the data to disk directly, we isolated spikes from single neurons using Plexon's box-sort algorithm. Spike times were then recorded at 1 kHz resolution.
Virus
The virus construct used in these experiments was an adeno-associated virus 1 (AAV1) containing an AlstR-IRES2-EGFP expression cassette under the control of a human synapsin promoter (Tan et al., 2006). Virus was produced and titered as described previously (Tan et al., 2006). Two batches of virus were used, with initial viral titers of 3.7 × 10¹¹ particles/mL (first injection in monkey W) and 5.3 × 10¹² particles/mL (all other injections).
Virus Injection
We injected virus using a custom-made apparatus modified from Chen et al. (2001). Briefly, the injection device consisted of a metal cannula (30 gauge) with an electrode threaded through its center. The cannula was connected to a 10 μL Hamilton syringe using thin plastic tubing. In both monkeys we injected virus at four locations, arranged to form a 1 mm wide square. At each location, virus was injected at three depths (0.2, 0.6, and 1 mm above the transition from gray to white matter), and at each depth, we injected between 0.5 and 0.8 μL of virus. Each individual injection took between 20 and 80 min, and we waited for 5 min after each injection before moving the injection device to a new depth. In monkey W, injections were completed within three days, in monkey V within two days.
Placement of injections was verified using landmarks determined in prior recording sessions from the same V1 locations. These landmarks were the receptive field locations and the depth of the transition from gray to white matter at each recording site.
AL and Saline Injection
AL and saline were injected using the same type of custom-made apparatus used for injecting viruses. The Drosophila AL peptide Ser-Arg-Pro-Tyr-Ser-Phe-Gly-Leu-NH2 (Birguel et al., 1999) was synthesized in house and stored in 100 uM aliquots in water at −80°C. For experiments, AL was diluted to 1 μM in saline. In one injection in monkey V, we used 2 μM AL.
Both AL and saline were continuously infused for the duration of the experiment. We began behavioral testing after injection of 1 μL. Infusion rate was set at 0.05 μL/min for the first microliter, and then slowed down so that the speed across the entire experiment was on average 0.03 μL/min (range: 0.02–0.04 μL/min). On average, we injected a total of 2.6 μL of fluid per experiment (range: 2.0–3.5 μL). AL and saline infusions were carried out at least one month after virus injection (monkey W: 1–6 months, monkey V: 1.5–2 months).
Histology
At the end of the experiments (2.5 and 1.5 years after the first virus injection for monkey W and V, respectively), monkeys were sacrificed, perfused with fixative, and their brains were removed. 50 μm thick sections were cut on a freezing microtome parasagitally. Every fourth section was stained for expression of GFP. Immunohistochemistry for GFP was performed using a rabbit anti-GFP antibody (Invitrogen, 1:500), a biotinylated goat anti-rabbit secondary antibody (Jackson ImmunoResearch, 1:2000), and an ABC avidin-peroxidase kit (Vector Laboratories), followed by the Vector VIP peroxidase substrate kit (Vector Laboratories).
Data Analysis
Neurophysiology
Multiunit activity (MUA) was computed from the continuously acquired neuronal responses by rectifying, filtering (low-pass filter, cut-off 150 Hz) and downsampling the recorded signals to 1 kHz. Receptive field locations were then computed from MUA or spike times by first computing the stimulus evoked response for every trial as the average response in the 300 ms time window following stimulus onset, corrected by the baseline response computed across the 100 ms interval preceding stimulus onset. Repeated presentations of the same stimulus location were then averaged, and the location of the receptive field was determined by fitting the resulting data set with a 2D Gaussian profile. Receptive fields were then described by plotting the ellipse falling at the full width at half maximum (FWHM) of the Gaussian fit.
Behavioral data
For each experiment, we computed the percentage of correct responses as a function of target location and target luminance increment. These data were fit with the psychometric function:
where λ is the lapse rate, and F(x;α, β) is a Weibull function with parameters α and β. This function was fitted via maximum likelihood estimation using Palamedes (Prins and Kingdom, 2009). Palamedes was also used to determine the goodness-of-fit for each fit by computing the deviance (Wichmann and Hill, 2001). Each deviance value was then compared against a distribution of deviance values computed using a bootstrap method and 1000 iterations, and only fits with deviance values falling above the fifth percentile of the simulated distribution were included in the analysis.
Histology
Cell counts were obtained from sections spaced 400 μm apart. In each section containing labeled neurons, we plotted the positions of neuronal cell bodies labeled with GFP using Neurolucida software (MicroBrightField). Cells were visualized and plotted with a 40× objective. Only cells for which the entire circumference of the soma was visible were counted. Glial cells were identified based on their characteristic morphology and excluded from the cell count. For each of the sections, we also marked the boundary between gray and white matter, and gray matter and pia. From the Neurolucida data, we first determined the number of infected cells per section. The Abercrombie correction (Guillery, 2002) was applied to this cell count by multiplying it with T/(T + h), where T is the thickness of the tissue (50 μm), and h is the height of the elements to be counted. h was measured as the average diameter along the long axis of the counted cell somata. To determine h, we chose the section with the largest cell count for each of the three injection sites (one from monkey W, two from monkey V). In each section, we then measured the soma diameter of 50 randomly chosen neurons, making sure that neurons were selected across all layers. Since the average diameter was similar across all three sections (10.37 μm, 11.2 μm, 9.96 μm), we used the average of all three values (10.51 μm) for subsequent cell count corrections. To determine the density of labeled neurons per section, we also determined the area of tissue that contained labeled neurons by computing the area within the complex hull of the positions of labeled cells. Volume was then computed by multiplying this area with the thickness of the section. One section of monkey W had to be replaced with a neighboring section (200 μm apart) because of tissue damage. To compute the fraction of neurons infected, we used the average density of neurons across all layers of monkey V1 as reported by Beaulieu et al., 114800 neurons/mm3 (Beaulieu et al., 1992).
In addition to computing cell densities for the entire section, we also computed cell densities within smaller regions for each section. For this purpose, we used the same Neurolucida data containing the position of all labeled cells within each section. For each section, we counted the number of cells within a sliding, round window of 100 μm radius. The sliding window sampled the section at steps of 10 μm in both directions. Cell counts were again corrected as described above, and the cell density was computed for each window position by dividing the cell count by the cylindrical volume covered by the window. This resulted in a density profile for each section, from which we could determine the section's maximum cell density.
Results
The goal of the experiments was to test whether viral vector-based approaches can be used to manipulate the performance of monkeys in the types of complex tasks that have been used to study higher-order brain functions. For this purpose, we tested whether inactivation of V1 neurons using the AlstR/AL system can cause measurable changes in a visual detection task. Two monkeys (W and V) participated in the experiments. To achieve AlstR expression, we used an AAV to deliver the required genetic construct. AlstR expression was placed under the control of the human synapsin promoter (Tan et al., 2006). An IRES2 element drove additional expression of GFP as a marker for AlstR-expressing cells. In each monkey, we injected virus at a site in V1 for which we had previously established receptive field locations by recording MUA (Figure 1B). Injections were made at four locations targeted at the corners of a 1 mm wide square, injecting around 1.5 μL of virus per location. At each location we made injections at multiple depths, spaced such that injections would be expected to span the entire extent of gray matter.
Approximately one month after virus injection, we began to test whether inactivation of AlstR-expressing neurons by AL application had behavioral consequences. Monkeys were trained to perform a target detection task (Figure 1A). Each trial began with the presentation of a fixation point, centered on a textured background, which the monkeys were required to fixate. In most of the trials, this was followed by the presentation of a peripheral target. A color change of the fixation point instructed the monkeys to make a saccade to the target as quickly as possible. Monkeys were required to land within a small window centered on the target location after the very first saccade; monkeys were not allowed to scan the display to search for the target. Targets were defined by a luminance increment added to the textured background at the target location. By changing the size of the luminance increment (the “target strength”), we varied the task difficulty. We assumed that in some trials the monkeys would not be able to detect a target, especially after inactivation of V1. To thwart the strategy of guessing in these trials, we introduced a second set of trials in which no target was presented. In these trials, the monkeys were required to maintain fixation until trial end, even after the fixation spot changed color. Trials with and without target presentation were randomly interleaved in every experiment.
In the target-present trials, the target could appear at four different locations, chosen based on the receptive field locations at the virus injection site. Only two of these locations were used for further analysis. One location (the “AlstR location”) was chosen such that the target fell within the receptive fields of neurons recorded at the virus injection site. If the virus injections were successful, targets presented at this location should be represented by V1 neurons expressing the AlstR. As a within-experiment control, a second target location was chosen in the contralateral hemifield (the “contralateral location”), at the same eccentricity as the AlstR location (see Figure 2A for a schematic overview of the different experimental conditions). For every session and every target location, we quantified the monkey's behavior by computing the percentage of correct target detections as a function of target strength. These data were fit with a psychometric function consisting of a Weibull function with parameters α and β. α represents the threshold of the psychometric function, while β describes the function's slope. Since the monkey's performance did not reach 100% correct even for the highest target strength in some experiments (see below), we also included a lapse rate term λ in the fit, which captures the deviation from perfect performance at high target strengths.
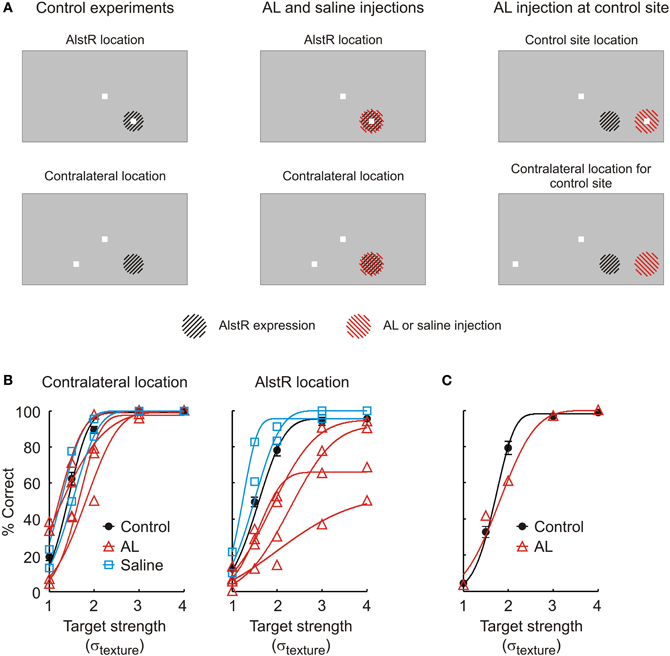
Figure 2. (A) Overview over the different experimental conditions. Left: Stimulus configuration in control experiments. The top and bottom panels indicate the two different target locations for which the monkey's performance is shown in (B). The region hatched in black indicates the part of the visual field represented by neurons expressing the AlstR (not drawn to size). Middle: The same stimulus configuration was used when injecting AL or saline at the V1 site expressing the AlstR. In these panels, the region hatched in red represents the part of the visual field targeted by the fluid injection (not drawn to size). Right: In one experiment, AL was injected at a V1 site not expressing the AlstR. (B) Performance of monkey W in the detection task. The graph on the left plots behavior for targets shown at the contralateral location; the graph on the right the behavior for targets shown at the AlstR location. Black circles: Average performance in control experiments without injection (error bars: SEM). Black line: Average psychometric function fit to the control data. Red lines and triangles: Performance in individual AL injection experiments (triangles: raw data; lines: psychometric function fit to the different injection experiments). Blue squares and lines: Performance (raw data and fit) during saline injection. (C) Performance during AL injection at a V1 site not expressing the AlstR. The target was placed to fall into the receptive field locations at this site (marked as “control site location” in A). Black circles and line: Average behavior and psychometric function in control experiments without injection (error bar: SEM). Red triangles and line: Performance (raw data and fit) during AL injection.
In the first set of experiments, we injected AL at the virus injection site in monkey W. We continuously injected AL to guarantee maximal inactivation effects by targeting a large cortical volume, and to provide stable inactivation conditions throughout the experiment. AL injections markedly impaired the monkey's ability to detect targets shown at the AlstR location. Figure 2B plots psychometric functions for the two target locations, both in control experiments without injection (black line, contralateral location: N = 26, AlstR location: N = 24), as well as in experiments with continuous injection of AL (red lines, N = 4 for both locations). Effects of AL injection on performance were quantified by comparing the parameters of the fitted psychometric functions between control and injection experiments using a Mann–Whitney U-test. These comparisons demonstrate that AL injection did not impair the monkey's detection performance for targets shown at the contralateral location: for targets shown at this location, none of the fit parameters showed a significant difference between control and AL data (α: U = 81, p = 0.2, β: U = 38, p = 0.2, λ: U = 72, p = 0.6). At the same time, AL injection did markedly impair the monkey's performance when targets were shown at the virus location—the visual field location represented by the neurons at the virus injection site. While there was no change in the slope β of the psychometric functions during AL injection (U = 33, p = 0.1), AL injection significantly increased the threshold α (U = 98, p = 0.01). This indicates that the monkey had greater difficulty detecting targets at this location during the AL injection. In addition, we also observed a significant increase in the lapse rate λ (U = 106, p = 0.002): as evident in Figure 2A, AL injection caused the monkey to miss an increased number of targets, even for the highest signal strength.
In addition to the target-present trials, the task also contained trials in which no target was presented. In these trials, the monkey was required to maintain fixation on the centrally presented target until its offset. We tested whether the AL injections impacted the monkey's performance in these target-absent trials. Performance levels for the target-absent trials was high under control conditions (average: 86% correct), and remained high during AL injections (average: 87% correct). A comparison of performance levels for the target-absent trials across experiments confirmed that it was not influenced by AL injection (Mann–Whitney U-test: U = 69, p = 0.8).
In summary, our data confirm that AL injection was sufficient to disrupt the monkey's performance in the detection task, but only for targets shown at the AlstR location. The selectivity of the effect suggests that the performance deficits during AL injection were not simply due to a general change in performance in these experiments, but instead were caused by the inactivation of the AlstR-expressing V1 neurons that were responsible for encoding the target when shown at the AlstR location.
In one set of control experiments, we confirmed that the observed deficits where not simply due to disruption of neural activity because of the injection of fluid into V1. We injected saline at the virus injection site, with injection parameters matched to the AL injections. The monkey's detection performance during saline injection is shown in Figure 2B (blue lines, N = 2 for both locations). For both target locations, performance during saline injection was not different from the control experiments (p ≥ 0.2 for all parameters and target locations). We also compared the performance during saline and AL injection directly. This comparison is limited by the small sample sizes (4 AL experiments vs. 2 saline experiments). For every fit parameter and both target locations, we asked whether the fit parameter's value observed in the two saline experiments fell within the range of values for the parameter observed during AL injection. For targets shown at the contralateral location, this was the case for all three parameters. Similarly, for targets shown at the virus location, the value for β determined for the saline experiments fell within the range observed during AL injection. However, both saline experiments had smaller thresholds α than all of the AL experiments. Also, the lapse rates λ in both saline experiments were smaller than in all of the AL experiments. This is consistent with the changes observed when comparing saline and AL experiments against the control experiments without injections, which found significant increases in α and λ in the AL experiments only. Again, performance for the target-absent trials was not different between saline and control experiments (U = 33, p = 0.8).
In a second set of control experiments, we tested whether the observed deficits could be caused by the injection of AL without involvement of the AlstR. We injected AL at a V1 site 4 mm distant to the virus injection site (“control site”). Receptive field locations for the control site were established before AL injection. Figure 2C shows the monkey's detection performance for targets presented at a location falling into the receptive fields at the control site, both in control experiments without injection (black line, N = 8), as well as during continuous AL injection (red line, N = 1). AL injection at the control site caused some changes in behavior in comparison to the control data: the injection experiment's value for the threshold α was larger than in all of the control experiments; at the same time, the value for the slope β was smaller than in all of the control experiments. AL injection did not cause changes in the lapse rate (7 out of 8 control experiments had larger values for λ than the injection experiment). These differences in behavior are qualitatively different from the previously described changes in behavior caused by injecting AL at the virus injection site. In those experiments, we observed no changes in slope, and significant changes in lapse rate, the opposite of the results obtained when injecting AL at the control site. The only change observed for both injection sites is the change in threshold. However, injection of AL at the virus injection site caused the threshold to change on average by σtexture = 0.6, while injection of AL at the control site only changed the threshold by 0.23. AL injection at a V1 site without AlstR expression therefore only had limited impact on the monkey's performance. In conclusion, our results in monkey W are consistent with behavioral deficits caused by AL-mediated inactivation of the AlstR-expressing neurons.
At the end of the experiment, we confirmed AlstR expression by post-mortem histology. AlstR-expressing neurons were identified by staining for GFP. The virus injection site was clearly visible as a region containing dense label (see Figure 3A for an example). We quantified the efficiency of virus injection by computing the density of infected neurons at the injection site. For this purpose, we counted the number of neurons labeled with GFP in consecutive sections spaced 400 μm apart. Cell counts were Abercrombie corrected to account for the distortion of cell counts in sectioned tissue (Guillery, 2002). Glial cells could be distinguished from neurons based on their different morphology and were excluded from the cell count. For each section, we also determined the volume of the tissue containing labeled neurons (see Materials and Methods), to compute the density of GFP labeled neurons for each section. The results of this analysis are listed in Table 1. We also computed a rough estimate of the fraction of neurons infected in each section, by comparing the density of labeled neurons per section to the density of neurons in macaque cortex as determined by Beaulieu et al. (Beaulieu et al., 1992). Differences between layers were not taken into account in this analysis. It should be noted that counting cells expressing GFP will result in an underestimate of AlstR-expressing neurons for the following reason: AlstR expression and GFP expression were coupled using an IRES2 element. As a consequence, while all GFP-positive neurons will also express the AlstR, there will be cells expressing the AlstR that are not GFP-positive (Mizuguchi et al., 2000). The density of infected cells reported here is, therefore, only a lower bound on the true infection efficiency.
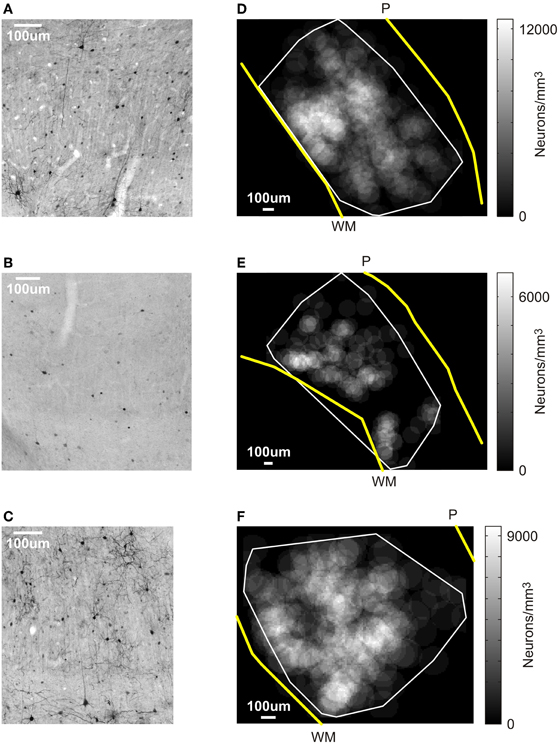
Figure 3. Results of the post-mortem histology. (A–C) V1 sections stained for GFP. Cells stained black are GFP-positive, which is co-localized with AlstR expression. Scale bar: 100 μm. (A) Tissue from monkey W. (B) Section of V1 at the first virus injection site in monkey V. (C) V1 section at the second injection site in monkey V. (D–F) Spatial profile of labeling density for an example section for each injection site. The gray scale level in this figure indicates the density of neurons computed within windows of 100 μm radius (see Materials and Methods). The white line markes the boundary of the area in each section that contained labeled cells. Yellow lines indicate the transition from gray matter to white matter (marked “WM”), and from brain to pia (marked “P”). Scale bar: 100 μm. (D) Monkey W. (E) First injection site in monkey V. (F) Second injection site in monkey V.
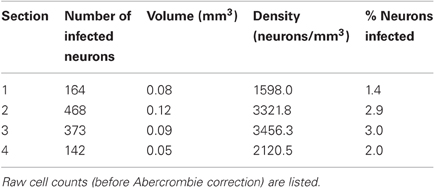
Table 1. For each section from monkey W containing labeled neurons, the table lists the number of infected neurons, tissue volume containing labeled neurons, density, and fraction of infected neurons.
As Table 1 shows, the number of infected neurons gradually increased toward the center of the injection site. The maximum cell density, when computed across the entire section, was about 3500 neurons/mm3, which corresponds to roughly 3% of all neurons. In addition to changes in infection density across sections, the density of labeled neurons also changed within each section. We, therefore, determined a spatial profile of labeling density for each section by counting the number of labeled neurons falling within windows of 100 μm radius. These windows were placed every 10 μm. Figure 3D shows the density profile of the section containing the largest number of labeled cells. From these spatial density profiles, we could then determine the maximum density of labeled neurons within the 100 μm windows, both for each section, as well as across all sections. Across all sections, this resulted in a maximum density of 12394.7 neurons/mm3, which corresponds to about 10.8% of neurons being GFP-positive.
We repeated the experiments in monkey V, and injected virus into V1, followed by AL injections at the same location. All experimental procedures were nearly identical for the two animals. Figure 4 shows monkey V's performance in the detection task for control experiments (black line, contralateral location: N = 41 for, AlstR location: N = 43) and during AL injection (red lines, N = 3 for both locations). In this monkey, AL injection failed to produce the same results as in monkey W, as performance was not noticeably changed by AL injection at the AlstR location. A comparison of the parameters of the psychometric functions showed no significant differences between control and injection data at either target location (p > 0.01 for all parameters and target locations). Performance in the target-absent trials was also unaffected by AL injection (U = 74, p = 1).
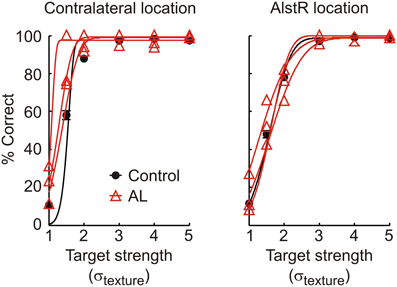
Figure 4. Performance of monkey V in the detection task for control and injection experiments, for targets shown at the contralateral and AlstR location. Black circles and line: Average behavior and psychometric function in control experiments (error bars: SEM). Red triangles and lines: Performance (raw data and fit) in individual AL injection experiments.
At the end of the experiments, we again tested for AlstR expression by staining for GFP. Unlike the findings in monkey W, we observed only relatively sparse label in monkey V (see Figure 3B for an example). Indeed, a quantification of the number of GFP labeled neurons for this injection site resulted in much lower densities of infected neurons (see Table 2). As Table 2 shows, the density of labeled neurons computed across each entire section did not exceed 1050 neurons/mm3, or roughly 1% of neurons being GFP-positive. We also computed a spatial profile of labeling density for each section (see Figure 3E for the profile of the section containing the densest label). For this injection site, the local labeling density reached 6713.8 neurons/mm3 at the maximum (5.8% of neurons). In conclusion, both values indicate that a much lower proportion of neurons were infected in monkey V than in monkey W.
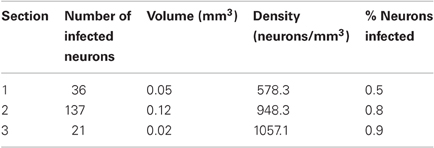
Table 2. Summary of GFP expression for the first injection site in monkey V.
One possible reason for the differences between monkeys is a difference in the injected virus. We used the same viral construct in both monkeys, but two different batches that were produced separately. To test whether the second batch of virus was indeed infectious, we injected it again in monkey V. If the low-levels of AlstR expression in this monkey were indeed caused by the batch of virus used, we would expect to again see low-levels of AlstR expression after the second injection. These injections were performed about two months prior to perfusion. Injections were placed at least 2 mm away from the initial virus injection site in V1. We placed four injections of 0.5 μL along a single long track through V1 and adjacent brain tissue, with 1 mm between injection sites. The post-mortem histology revealed dense label within V1 following this second injection (see Figure 3C). Table 3 lists the density of labeled neurons that resulted from this virus injection. These numbers are comparable to the densities observed in monkey W, with a maximal density of about 3400 neurons/mm3, or 3% of neurons. A spatial density profile for one section is shown in Figure 3F. Across all sections, the spatial analysis revealed that locally, the density of infected neurons reached 9296.0 neurons/mm3, or 8.1% of neurons. Again, this is comparable to the density observed in monkey W. The fact that we found AlstR expression after these later injections, using the same batch of virus as used previously, demonstrates that the failure of AlstR expression after the initial injections in monkey V was not due to the particular batch of virus used.
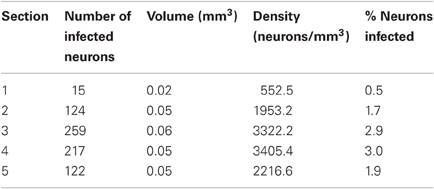
Table 3. Summary of GFP expression for the second injection site in monkey V.
Discussion
The importance of using viral vectors to introduce novel channels or receptors into neurons in the non-human primate brain lies in the possibility of repeatable and cell-type specific manipulations during the complex tasks that can be performed by these animals. Previous studies have demonstrated that viruses can be used to introduce novel channels or receptors into neurons in the primate brain, which allow control over neural activity (Tan et al., 2006; Han et al., 2009, 2011; Diester et al., 2011; Jazayeri et al., 2011; O'Shea et al., 2011). Manipulations of neural activity can in some cases be strong enough to influence behavior (Jazayeri et al., 2011; O'Shea et al., 2011). Here, we present additional evidence that manipulating neural activity using a novel receptor can be strong enough to influence a monkey's performance in a task.
We used AAV1 to introduce the AlstR into neurons in area V1 in two monkeys trained to perform a detection task. In monkey W, AL injection at the same V1 site as the virus injection caused a deficit in the detection task. This deficit was spatially specific to targets placed at the retinotopic location of the virus injection. Deficits were strong enough to affect even the most easily detectable targets, as evidenced by a significant increase in the lapse rate during AL injection. Saline injection, and AL injection at a V1 site without AlstR expression, failed to produce similar results. The deficits we observed are therefore most likely due to AL-mediated inactivation of the AlstR-expressing neurons. These effects are consistent with the behavioral deficits seen after temporary inactivation of V1 using muscimol, a GABA agonist (Newsome et al., 1985), or after V1 lesions (Cowey, 1962; Mohler and Wurtz, 1977; Newsome et al., 1985; Moore et al., 1995). In all of these experiments, monkeys failed to detect targets placed in the part of the visual field represented by the inactivated part of V1.
In monkey V, AL injection failed to produce similar behavioral results, most likely due to a lack of sufficient expression of the AlstR. An observation consistent with this explanation was reported in the study by Tan et al. (Tan et al., 2006), in which AL application failed to inactivate neurons in visual cortex in three ferrets with very low AlstR expression levels. It is unclear why the virus injections in monkey V failed to produce the same level of AlstR expression as in monkey W. One possibility is a problem with the particular batch of virus used for the injections in monkey V. However, a later injection using the same batch of virus led to much stronger AlstR expression in monkey V.
Another possibility is a failure to deliver sufficient amounts of virus during the injections, either because of incorrect placement of the injection device, insufficient injection volume, or insufficient diffusion of virus into the brain. We placed injections using a device consisting of a cannula with a metal electrode threaded down its center, which allowed recordings of neural activity during the injections. We used these recordings to confirm injection depth, ensuring that the tip of the injection device was indeed placed within V1. It therefore seems unlikely that the placement of the injection device could have led to a failure to deliver virus to V1.
Failure to express the AlstR could also be caused by injecting a virus volume that is too small. Injection volumes were chosen based on preliminary experiments in rats. In these experiments, an injection of 1.5 μL of virus, spread over three depths from the surface of the brain, usually lead to AlstR expression up to 1 mm away from the injection site (K. J. Nielsen, unpublished observation). In the monkeys, we injected 1.5 μL, again spread over three depths, at four locations. The injections in monkey W confirm that in principle this amount of virus can drive strong AlstR expression. However, the possibility remains that there was a discrepancy between the amount of virus that we intended to inject into V1, and the amount of virus actually injected. This could be due to a measurement error, leading to an incorrect estimate of the amount of virus leaving the injection device, or to insufficient diffusion of virus into the brain. A volume measurement error seems unlikely for the following reason: we injected virus by connecting the injection device to a Hamilton syringe via plastic tubing. When loading the virus into the injection device, we first filled the syringe and a portion of the tubing with distilled water before loading the virus. Virus and distilled water were kept separate by an air bubble in the tubing between the two fluids. The amount of virus injected was then measured by monitoring the spatial displacement of the leading edge of the air bubble. Because of the very limited compressibility of fluids, it seems highly unlikely that we would have observed displacements of the air bubble without delivering the corresponding fluid volume to the brain. Furthermore, the diameter of the injection cannula was large enough that we encountered no cases of clogging of the injection device.
A much more likely reason is insufficient diffusion of the virus into adjacent brain tissue. Nicholson (Nicholson, 1985) describes two possible scenarios after injection of fluid into the brain: in one the fluid generates a cavity in the tissue around the injection site; in the other, fluid actually diffuses into the brain. In addition, there will likely also be reflux of fluid along the injection device. Parameters like injection speed and pressure, the shape of the injection device, and the angle of insertion into the brain will influence the success of an injection, i.e., how much of the injected virus actually diffuses into the brain. Since we performed injections through guide tubes inserted into the dura, the surface of the brain was not visible, and we could not assess a number of these parameters. To increase the success of future studies relying on virus injections into the brain, it would be ideal to find ways to monitor the actual diffusion into the brain while placing injections. One such strategy involves co-injecting the virus with an MRI tracer, and monitoring the diffusion of this tracer using real-time MR imaging (Salegio et al., 2011).
Lastly, an immune response against the injected virus also needs to be considered as a reason for the lack of AlstR expression in monkey V. High titers of neutralizing antibodies against AAV2 have been found to interfere with AAV2 injections into the brain: AAV2 injections in animals pre-immunized against AAV2 may lead to lower expression levels than injections in naïve animals (Peden et al., 2004; Sanftner et al., 2004). In this study we injected AAV1, for which immune responses to injections into the brain have not been studied. However, the AAV1 serotype has been isolated from primates (Rapoza, 1967; Parks et al., 1970). AAV infections have no known disease association and only cause very mild immune responses, so we cannot completely rule out that monkey V had higher than normal antibody titers against AAV1 during the time of the initial virus injections. However, this possibility seems unlikely given that at the time of injections the monkey had been part of a stable primate colony for several years. Nonetheless, because immune responses can influence the outcome of AAV injections into the brain, future studies using AAV in the non-human primate should consider pre-screening the animals for antibody titers against the chosen AAV serotype. Along the same lines, an immune response should be considered when planning repeated injections: immune responses triggered by a first AAV injection may reduce expression levels of a following injection of the same virus when done to quickly after the first injection (Mastakov et al., 2002; Peden et al., 2004, 2009).
In conclusion, we suspect that differences in the virus diffusion into V1 are the main reason for the differences in AlstR expression between monkeys W and V. Since injections were performed using identical methods in both monkeys, the cause for these differences remains unclear.
The variability in expression levels across animals observed in our experiments highlight a general challenge for future studies using viral vector-based approaches in the monkey. To minimize the number of animals required per study, it will be necessary to confirm the success of each virus injection in vivo to ensure sufficient expression levels of the chosen channel or receptor. In most circumstances, viral vectors are designed to not only drive expression of a novel channel or receptor, but also of a fluorescent protein, such as the GFP used here. In some cases, the channels or receptors themselves have been engineered to be fluorescent. One example of the latter case is ChR2, which has been made fluorescent by fusion with YFP (Boyden et al., 2005). Fluorescence levels can thus be used to verify the expression levels achieved after a virus injection. The complication in the non-human primate is the opacity of the dura, which does not allow direct visualization of the brain. One technique that circumvents this problem and allows quantification of fluorescence levels in vivo even in the primate brain was developed by Diester et al. (Diester et al., 2011). It is based on an optical fiber which is lowered into the brain through a guide tube. Diester et al. have demonstrated that this device can be used to measure fluorescence generated from expression of ChR2-YFP in the monkey brain. A possible disadvantage of this approach is tissue damage caused by the relatively large optical fiber; however, the device has the advantage of being suitable even for deeper brain areas. Another possibility to detect fluorescence in a surface area is the use of an artificial dura implant (Shtoyerman et al., 2000; Roe, 2007). In this case, the dura over the brain region of interest is replaced with a transparent sheet of silicone, allowing access to the brain for optical methods, and therefore possibly the quantification of fluorescence levels generated by virus injections (Heider et al., 2010).
Despite the technical obstacles encountered when using viral vector-based techniques in the non-human primate, the approach still holds enormous promise because of the selectivity with which certain types of neurons can be targeted. A number of strategies have been developed to restrict the expression of novel genes to a selected population of neurons. The choice of promoter or viral vector used, for example, can bias expression to certain neurons (Dittgen et al., 2004; Nathanson et al., 2009). This approach is widely used in rodent studies; an example of limiting expression of ChR2 to excitatory neurons in the monkey brain can be found in Han et al. (Han et al., 2009). Another strategy suitable to limit expression of novel genes to certain neurons is the use of so called bridge proteins (Choi et al., 2010). This strategy relies on limiting which neurons a virus can infect, instead of limiting the expression of the novel genes. For this purpose, viruses are generated such that they can only infect neurons expressing a particular membrane protein. Yet another strategy relies on using retrogradely transmitted viruses to target projection neurons. These viruses—such as rabies-pseudotyped lentiviruses (Mazarakis et al., 2001)—are taken up at synapses, and therefore lead to gene expression in the neurons projecting to an area.
By choosing the right approach, it should be possible in the future to restrict expression of a novel channel or receptor to a certain type of neuron, and to test the involvement of that neuron type in a particular brain function or behavior. This will not only provide valuable insights into brain function in general, it will also yield results important to understand possible causes of neurological disorders. Changes in certain inhibitory neurons have for example been proposed to underlie disorders such as schizophrenia (Lewis et al., 2005) and epilepsy (de Lanerolle et al., 1989). Similarly, autism is thought to be due to disconnections between frontal cortex and other higher-order areas of the cerebral cortex (Geschwind and Levitt, 2007). Monkeys are able to perform the complex behavioral tasks required to study these disorders, and cell-type or circuit-specific manipulations in the monkey will therefore provide a much more detailed understanding of their etiology.
In summary, our results demonstrate that viral vector-based approaches allow manipulations of brain activity strong enough to influence a monkey's behavior. This opens the door to probe the involvement of specific classes of neurons in the complex behavioral tasks that monkeys are uniquely qualified to perform.
Conflict of Interest Statement
The authors declare that the research was conducted in the absence of any commercial or financial relationships that could be construed as a potential conflict of interest.
Acknowledgments
We would like to thank Y. Yamaguchi and A. Cetin for providing the viral vectors used in the experiment, and E. Boehle, N. Dill, A. A. Disney, and M. De La Parra for their technical assistance. This work was supported by a Catharina Postdoctoral Fellowship award (Kristina J. Nielsen), NIH grants EY020673 (Edward M. Callaway, Richard J. Krauzlis) and EY010742 (Edward M. Callaway), the Simons Foundation (Richard J. Krauzlis), and the National Eye Institute Intramural Research Program at the National Institutes of Health (Richard J. Krauzlis).
References
Aravanis, A. M., Wang, L. P., Zhang, F., Meltzer, L. A., Mogri, M. Z., Schneider, M. B., and Deisseroth, K. (2007). An optical neural interface: in vivo control of rodent motor cortex with integrated fiberoptic and optogenetic technology. J. Neural Eng. 4, S143–S156.
Beaulieu, C., Kisvarday, Z., Somogyi, P., Cynader, M., and Cowey, A. (1992). Quantitative distribution of GABA-immunopositive and -immunonegative neurons and synapses in the monkey striate cortex (area 17). Cereb. Cortex 2, 295–309.
Birguel, N., Weise, C., Kreienkamp, H. J., and Richter, D. (1999). Reverse physiology in drosophila: identification of a novel allatostatin-like neuropeptide and its cognate receptor structurally related to the mammalian somatostatin/galanin/opioid family. EMBO J. 18, 5892–5900.
Boyden, E. S., Zhang, F., Bamberg, E., Nagel, G., and Deisseroth, K. (2005). Millisecond-timescale, genetically targeted optical control of neural activity. Nat. Neurosci. 8, 1263–1268.
Chen, L. L., Goffart, L., and Sparks, D. L. (2001). A simple method for constructing microinjectrodes for reversible inactivation in behaving monkeys. J. Neurosci. Methods 107, 81–85.
Choi, J., Young, J. A., and Callaway, E. M. (2010). Selective viral vector transduction of ErbB4 expressing cortical interneurons in vivo with a viral receptor-ligand bridge protein. Proc. Natl. Acad. Sci. U.S.A. 107, 16703–16708.
de Lanerolle, N. C., Kim, J. H., Robbins, R. J., and Spencer, D. D. (1989). Hippocampal interneuron loss and plasticity in human temporal lobe epilepsy. Brain Res. 495, 387–395.
Diester, I., Kaufman, M. T., Mogri, M., Pashaie, R., Goo, W., Yizhar, O., Ramakrishnan, C., Deisseroth, K., and Shenoy, K. V. (2011). An optogenetic toolbox designed for primates. Nat. Neurosci. 14, 387–397.
Dittgen, T., Nimmerjahn, A., Komai, S., Licznerski, P., Waters, J., Margrie, T., Helmchen, F., Denk, W., Brecht, M., and Osten, P. (2004). Lentivirus-based genetic manipulations of cortical neurons and their optical and electrophysiological monitoring in vivo. Proc. Natl. Acad. Sci. U.S.A. 101, 18206–18211.
Felleman, D. J., and Van Essen, D. C. (1991). Distributed hierarchical processing in the primate cerebral cortex. Cereb. Cortex 1, 1–47.
Fenno, L., Yizhar, O., and Deisseroth, K. (2011). The development and application of optogenetics. Annu. Rev. Neurosci. 34, 389–412.
Geschwind, D. H., and Levitt, P. (2007). Autism spectrum disorders: developmental disconnection syndromes. Curr. Opin. Neurobiol. 17, 103–111.
Hafed, Z. M., Goffart, L., and Krauzlis, R. J. (2008). Superior colliculus inactivation causes stable offsets in eye position during tracking. J. Neurosci. 28, 8124–8137.
Han, X., Chow, B. Y., Zhou, H., Klapoetke, N. C., Chuong, A., Rajimehr, R., Yang, A., Baratta, M. V., Winkle, J., Desimone, R., and Boyden, E. S. (2011). A high-light sensitivity optical neural silencer: development and application to optogenetic control of non-human primate cortex. Front. Syst. Neurosci. 5:18. doi: 10.3389/fnsys.2011.00018
Han, X., Qian, X., Bernstein, J., Zhou, H. H., Franzesi, G., Stern, P., Bronson, R., Graybiel, A., Desimone, R., and Boyden, E. (2009). Millisecond-timescale optical control of neural dynamics in the nonhuman primate brain. Neuron 62, 191–198.
Heider, B., Nathanson, J. L., Isacoff, E. Y., Callaway, E. M., and Siegel, R. M. (2010). Two-photon imaging of calcium in virally transfected striate cortical neurons of behaving monkey. PloS ONE 5:e13829. doi: 10.1371/journal.pone.0013829
Jazayeri, M., Lindbloom-Brown, Z., and Horwitz, G. D. (2011). Optogenetics in primates: monkey see monkey look. Available from Nature Precedings (2011).
Judge, S. J., Richmond, B. J., and Chu, F. C. (1980). Implantation of magnetic search coils for measurement of eye position: an improved method. Vision Res. 20, 535–538.
Krauzlis, R. J. (2003). Neuronal activity in the rostral superior colliculus related to the initiation of pursuit and saccadic eye movements. J. Neurosci. 23, 4333–4344.
Lechner, H. A. E., Lein, E. S., and Callaway, E. M. (2002). A genetic method for selective and quickly reversible silencing of mammalian neurons. J. Neurosci. 22, 5287–5290.
Lewis, D. A., Hashimoto, T., and Volk, D. W. (2005). Cortical inhibitory neurons and schizophrenia. Nat. Rev. Neurosci. 6, 312–324.
Lovejoy, L. P., and Krauzlis, R. J. (2010). Inactivation of primate superior colliculus impairs covert selection of signals for perceptual judgments. Nat. Neurosci. 13, 261–266.
Luo, L., Callaway, E. M., and Svoboda, K. (2008). Genetic dissection of neural circuits. Neuron 57, 634–660.
Mastakov, M. Y., Baer, K., Symes, C. W., Leichtlein, C. B., Kotin, R. M., Matthew, J., and During, M. J. (2002). Immunological aspects of recombinant adeno-associated virus delivery to the mammalian brain. J. Virol. 76, 8446–8454.
Mazarakis, N. D., Azzouz, M., Rohll, J. B., Ellard, F. M., Wilkes, F. J., Olsen, A. L., Carter, E. E., Barber, R. D., Baban, D. F., Kingsman, S. M., Kingsman, A. J., O'Malley, K., and Mitrophanous, K. A. (2001). Rabies virus glycoprotein pseudotyping of lentiviral vectors enables retrograde axonal transport and access to the nervous system after peripheral delivery. Hum. Mol. Genet. 10, 2109–2121.
Mizuguchi, H., Xu, Z., Ishii-Watabe, A., Uchida, E., and Hayakawa, T. (2000). IRES-dependent second gene expression is significantly lower than cap-dependent first gene expression in a bicistronic vector. Mol. Ther. 1, 376–382.
Mohler, C. W., and Wurtz, R. H. (1977). Role of striate cortex and superior colliculus in visual guidance of saccadic eye movements in monkeys. J. Neurophysiol. 40, 74–94.
Moore, T., Rodman, H., Repp, A., and Gross, C. (1995). Localization of visual stimuli after striate cortex damage in monkeys: parallels with human blindsight. Proc. Natl. Acad. Sci. U.S.A. 92, 8215–8218.
Nathanson, J. L., Yanagawa, Y., Obata, K., and Callaway, E. M. (2009). Preferential labeling of inhibitory and excitatory cortical neurons by endogenous tropism of adeno-associated virus and lentivirus vectors. Neuroscience 161, 441–450.
Newsome, W., Wurtz, R. H., Duersteler, M., and Mikami, A. (1985). Punctate chemical lesions of striate cortex in the macaque monkey: effect on visually guided saccades. Exp. Brain Res. 58, 392–399.
Nicholson, C. (1985). Diffusion from an injected volume of a substance in brain tissue with arbitrary volume fraction and tortuosity. Brain Res. 333, 325–329.
O'Shea, D. J., Goo, W., Diester, I., Kalanithi, P., Yizhar, O., Ramakrishnan, C., Deisseroth, K., and Shenoy, K. V. (2011). “Optogenetic control of excitatory neurons via a red-shifted opsin in primate premotor cortex,” Program No. 306.11. 2011 Neuroscience Meeting Planner. Washington, DC: Society for Neuroscience, 2011. Online.
Parks, W. P., Boucher, D. W., Melnick, J. L., Taber, L. H., and Yow, M. D. (1970). Seroepidemiological and ecological studies of the adenovirus-associated satellite viruses. Infect. Immun. 2, 716–722.
Peden, C. S., Burger, C., Muzyczka, N., and Mandel, R. J. (2004). Circulating anti-wild-type adeno-associated virus type 2 (AAV2) antibodies inhibit recombinant AAV2 (rAAV2)-mediated, but not rAAV5-mediated gene transfer in the brain. J. Virol. 78, 6344–6359.
Peden, C. S., Manfredsson, F. P., Reimsnider, S. K., Poirier, A. E., Burger, C., Muzyczka, N., and Mandel, R. J. (2009). Striatal readministration of rAAV vectors reveals an immune response against AAV2 capsids that can be circumvented. Mol. Ther. 17, 524–537.
Prins, N., and Kingdom, F. A. A. (2009). Palamedes: matlab routines for analyzing psychophysical data. Available online at: http://www.palamedestoolbox.org
Roe, A. W. (2007). Long-term optical imaging of intrinsic signals in anesthetized and awake monkeys. Appl. Opt. 46, 1872–1880.
Salegio, E. A., Samaranch, L., Kells, A. P., Forsayeth, J., and Bankiewicz, K. (2011). Guided delivery of adeno-associated viral vectors into the primate brain. Adv. Drug Deliv. Rev. 64, 598–604.
Sanftner, L. M., Suzuki, B. M., Doroudchi, M. M., Feng, L., McClelland, A., Forsayeth, J. R., and Cunningham, J. (2004). Striatal delivery of rAAV-hAADC to rats with preexisting immunity to AAV. Mol. Ther. 9, 403–409.
Shtoyerman, E., Arieli, A., Slovin, H., Vanzetta, I., and Grinvald, A. (2000). Long-term optical imaging and spectroscopy reveal mechanisms underlying the intrinsic signal and stability of cortical maps in V1 of behaving monkeys. J. Neurosci. 20, 8111–8121.
Tan, E. M., Yamaguchi, Y., Horwitz, G. D., Gosgnach, S., Lein, E. S., Goulding, M., Albright, T. D., and Callaway, E. M. (2006). Selective and quickly reversible inactivation of mammalian neurons in vivo using the Drosophila allatostatin receptor. Neuron 51, 157–170.
Keywords: monkey, V1, viral vector, inactivation, visual detection
Citation: Nielsen KJ, Callaway EM and Krauzlis RJ (2012) Viral vector-based reversible neuronal inactivation and behavioral manipulation in the macaque monkey. Front. Syst. Neurosci. 6:48. doi:10.3389/fnsys.2012.00048
Received: 28 February 2012; Accepted: 26 May 2012;
Published online: 19 June 2012.
Edited by:
Jonathan B. Fritz, University of Maryland, USAReviewed by:
Anthony Zador, Cold Spring Harbor Laboratory, USAXue Han, Boston University, USA
Ilka Diester, Ernst Struengmann Institute in Cooperation with Max Planck Society, Germany
Copyright: © 2012 Nielsen, Callaway and Krauzlis. This is an open-access article distributed under the terms of the Creative Commons Attribution Non Commercial License, which permits non-commercial use, distribution, and reproduction in other forums, provided the original authors and source are credited.
*Correspondence: Kristina J. Nielsen, Systems Neurobiology Laboratory, Salk Institute for Biological Studies, 10010 N. Torrey Pines Rd., La Jolla, CA 92037, USA. e-mail: nielsen@salk.edu
†Present address: Zanvyl Krieger Mind/Brain Institute and Solomon H. Snyder Department of Neuroscience, Johns Hopkins University, Baltimore, MD 21218, USA.