
- 1Faculty of Sciences, Department of Biology, Kyushu University, Higashi-ku, Fukuoka, Japan
- 2Precursory Research for Embryonic Science and Technology, Japan Science and Technology Agency, Kawaguchi, Saitama, Japan
- 3Institute for Virus Research, Kyoto University, Kyoto, Japan
- 4Theoretical Biology and Bioinformatics, Utrecht University, Utrecht, Netherlands
- 5Institute of Industrial Science, The University of Tokyo, Meguro-ku, Tokyo, Japan
- 6Graduate School of Information Science and Technology, The University of Tokyo, Meguro-ku, Tokyo, Japan
Current in vitro cell culture studies of viral replication deliver detailed time courses of several virological variables, like the amount of virions and the number of target cells, measured over several days of the experiment. Each of these time points solely provides a snap-shot of the virus infection kinetics and is brought about by the complex interplay of target cell infection, and viral production and cell death. It remains a challenge to interpret these data quantitatively and to reveal the kinetics of these underlying processes to understand how the viral infection depends on these kinetic properties. In order to decompose the kinetics of virus infection, we introduce a method to “quantitatively” describe the virus infection in in vitro cell cultures, and discuss the potential of the mathematical based analyses for experimental virology.
Introduction
The recent rapid development of experimental techniques in molecular biology and cell biology has revealed many new insights into the complexed interactions between viruses and their target cells. Most of these studies are of a qualitative nature and describe the cellular and molecular details of the interactions. To learn more about the quantitative features of virus replication, we can now generate time courses tracking the dynamics of viruses and target cells in experiments. Each of the time points during a series of experiment provides a snap-shot of the number of target cells, the number of infected cells, and the amount of virions in the culture. The whole time course reflects the results of a complex process consisting of consecutive interactions between viruses, their target cells, infected cells, and viral production. It is difficult to translate these data quantitatively into the parameters identifying the multi-composed kinetics of viral infection. To decompose and quantify the kinetics of virus infection, it will be an extremely useful to rely on mathematical modeling, mathematical analysis, and numerical simulation of the experimental data (Ho et al., 1995; Perelson et al., 1997). Modeling the whole time courses mathematically, we can estimate several parameters underlying the kinetics of virus infection (e.g., the burst size and the basic reproductive number). These parameters cannot be obtained directly by experiments only. Comparing the parameter values between viruses allows one to identify the major functional differences between viruses, and to understand why one is more virulent than the other, and why their time courses are so different. This approach is particularly useful for analyzing data from in vitro experiments using cell cultures, because we can nowadays obtain frequent samples of several kinetic variables in a relatively simple environment (as compared to an in vivo infection). Indeed, it is now possible to fully parameterize our mathematical models on such in vitro data, and to realize quite robust quantification of the virus infection kinetics (Mohler et al., 2005; Beauchemin et al., 2008; Iwami et al., 2012).
The importance and significance of modeling work is slowly becoming recognized in the community of experimental virologists. Starting with the landmark papers revealing the turnover of HIV-1 infected cells in vivo from the decline in the viral load in patients following initiation of antiretroviral therapy (Ho et al., 1995; Wei et al., 1995), mathematical modeling has evolved into an important tool in modern biology (Perelson, 2001). Here we introduce our recently developed approach to “quantitatively” describe the kinetics of virus infection in cell cultures employing the full time-course of the data. And we will discuss the potential of such approaches combining experimental and mathematical analyses to address unsolved question in virology by identifying viral parameters.
Materials and Methods
In vitro cell culture experimental data on the infection of HSC-F cells with SHIV-KS661 were collected over time courses of 10 consecutive days. Each day most of virus (85.4%), and a small percentage of the cells (5.5%) was removed from the culture supernatant for measurement, and fresh medium was added. The measurement consisted of the concentrations of HSC-F cells positive or negative for a viral antigen, Nef, [cells/ml], and the SHIV-KS661viral load [RNA copies/ml] (Table 1). The experiment was repeated for two different values of the initial viral inoculum (MOI: multiplicity of infection). The time courses were analyzed with the model described below.
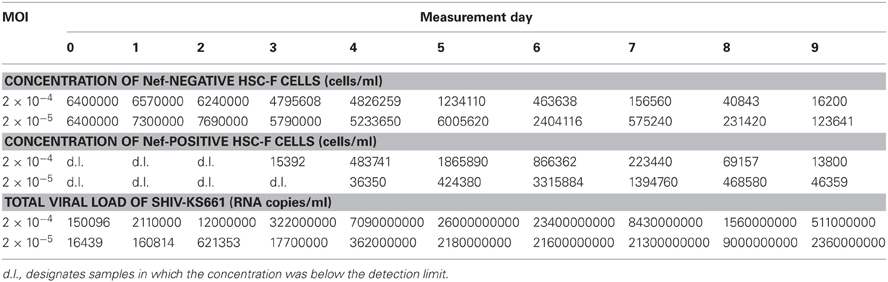
Table 1. Experimental data for the in vitro experiment.
Virus Infection
The virus solution of SHIV-KS661 (Shinohara et al., 1999) was prepared in a CD4+ human T lymphoid cell line, M8166 (a subclone of C8166) (Clapham et al., 1987), and was stored in liquid nitrogen until use. The HSC-F cell line (Akari et al., 1996) was cultured in a culture medium (RPMI-1640 supplemented with 10% fetal calf serum) at 37°C and 5% CO2 in humidified conditions. Each experiment was performed using 2 wells of a 24-well plate with a total suspension volume of 2 ml (1 ml per well) and an initial cell concentration of T0 = 6.46 × 10⁶ cells/ml in each well. Because the initial cell concentration is close to the carrying capacity of 24-well plates, and HSC-F cells replicate slowly, in the absence of SHIV-KS661 infection, the population of target cells, changes very little on the timescale of our experiment (data not shown). We therefore neglected the effects of potential regeneration of HSC-F cells when constructing the mathematical model. For virus infection, cultures of HSC-F cells were inoculated with two different MOIs [MOI 2.0 × 10⁻⁴ and MOI 2.0 × 10⁻⁵, where a MOI of 1 means one 50% tissue culture infectious dose (TCID50) per cell] of SHIV-KS661, and were incubated at 37°C. Four hours after inoculation, the cells were washed to remove the remaining viruses and were replaced into a fresh culture medium. The culture supernatant was harvested daily for 10 days, and was replaced with fresh medium. On a daily basis 5.5% of the cells in the culture were harvested to measure the number of target cells and infected cells. Cells were counted by staining them with an anti-SIV Nef monoclonal antibody (04–001, Santa Cruz Biotechnology, Santa Cruz, CA) labeled by Zenon Alexa Fluor 488 (Invitrogen, Carlsbad, CA), as previously described (Iwami et al., 2012). Each harvested supernatant, including 85.4% of the culture virus was stored at −80°C, and the amount of viral RNA was quantified by RT-PCR, as previously described (Iwami et al., 2012).
Mathematical Modeling
To describe the in vitro kinetics of virus infection, we used a classical mathematical model that is used widely for analyzing viral kinetics (Perelson and Nelson, 1999; Nowak and May, 2000; Perelson, 2001):
where T and I are the numbers of target (susceptible) cells, and infected (virus-producing) cells per ml of medium, respectively, and V is the number of RNA copies of virus per ml of medium. The parameters δ, c, β and p represent the death rate of infected cells, the degradation rate of viral RNA, the rate constant for infection of target cells by virus, and the viral production rate of an infected cell, respectively. The basic model (1) is a simplified version of the previously developed mathematical model in (Iwami et al., 2012), because we here use the time-course data including only viral RNA (but not both viral RNA and infectivity). A schematic of the basic model is shown in Figure 1.
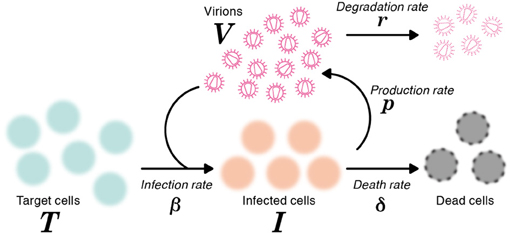
Figure 1. A schematic representation of the mathematical model. The variables T and I are the number of target and infected cells, respectively, and V is the number of RNA copies of virus. The parameters δ, c, β and p represent the death rate of infected cells, the degradation rate of viral RNA, the rate constant for infection of target cells by virus, and the viral production rate of an infected cell, respectively.
Data Fitting
Due to the daily harvesting of cells and virus, in our model the concentrations of target and infected cells must be reduced by 5.5% per day, and the viral loads (RNA copies) have to be reduced by 85.4% per day. We approximate these losses by adding continuous exponential decay terms, −dT, −dI, and −rV, to the equations, respectively, where d = 0.057 per day to account for the harvesting of cells, and r = 1.93 per day for the collection of virus. The degradation rate of virus was estimated to be c = 0.039 per day in separate experiments (data not shown). The remaining three parameters (δ, β, p), along with the 6 initial (t = 0) values for the variables (three for each of the two MOI values), were determined by fitting Equation (1) to the data. We simultaneously fit Equation (1) to the concentrations of Nef-negative and Nef-positive HSC-F cells and the viral loads for both MOIs, using nonlinear least-squares regression [using the FindMinimum package of Mathematica8.0 that minimizes the sum of squared residuals (SSR)]. Experimental measurements below the detection limit were excluded when computing the SSR.
Results and Discussion
In total we obtained 53 data points for quantifying the kinetics of SHIV-KS661 in vitro cell cultures. Using a previously established estimate for the degradation rates of RNA (c) in vitro culture, we estimated the values of the three remaining unknown parameters (δ, β, p) and the six initial values. The parameter estimates obtained by fitting Equation (1) to the full in vitro dataset simultaneously as described in “Materials and Methods” are given in Tables 2 and 3. These estimates are similar to our previous parameter estimates in (Iwami et al., 2012). The behavior of the model using these best-fit parameter estimates is shown together with the data in Figure 2, which reveals that the relatively simple model of Equation (1) describes these in vitro data very well. This suggests that the parameters that were estimated are representative for the various processes underlying the viral kinetics. Let us discuss what we can learn from these data.
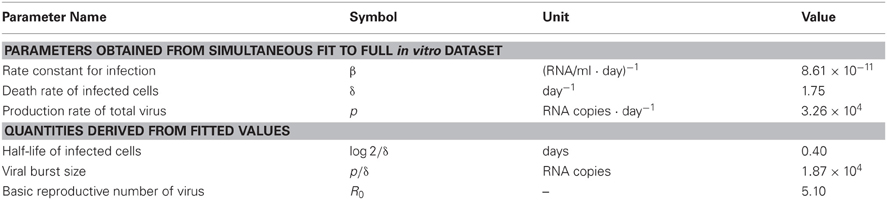
Table 2. Parameters values and derived quantities.
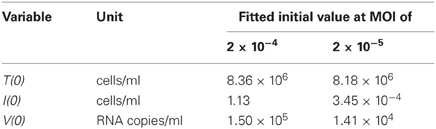
Table 3. Fitted initial values for the in vitro experiment.
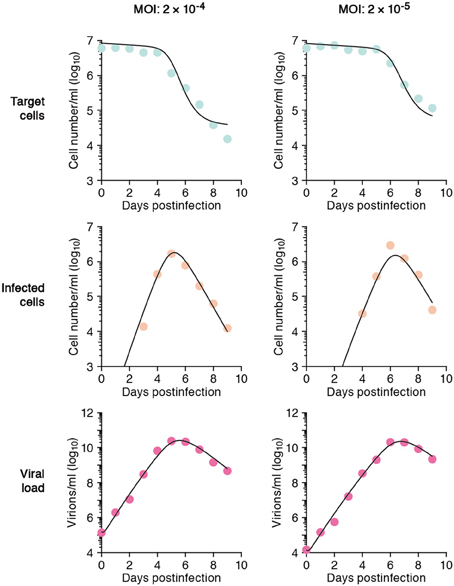
Figure 2. The mathematical model describes the data well. HSC-F cells were inoculated with SHIV-KS661 24 h before t = 0 and each in vitro experimental quantity was measured daily from t = 0 d to 9 d. The curves depict the best fit of the model (Equation 1), to the experimental data of SHIV-KS661 infection in vitro (symbols) for the target cells, infected cells, and the viral load for the two different experiments conducted at different MOIs. All data were fitted simultaneously as described in “Materials and Methods.”
Half-Life of Infected Cells (log2/δ)
The death rate of infected cells was estimated to be δ = 1.75 per day. Since in differential equations the time to death is exponentially distributed (Holder and Beauchemin, 2011), this death rate corresponds to a half-life of log 2/δ = 0.40d, and an average life-span of 1/δ = 0.57 d, of productively infected HSC-F cells. Because the Nef protein is primarily produced at a late phase of the viral replication in a cell, and since we do not distinguish between an early eclipse phase and a late phase of virus production in our model, the “infected cells” that our model describes should largely correspond to cells at a relatively late stage of infection (Iwami et al., 2012). The half-life that we estimate should therefore apply primarily for infected cells at a late stage of infection, and need not apply for cells in the early eclipse phase.
Burst Size (p/δ)
The viral production rate of an infected cell was estimated to be p = 3.26 × 10⁴ RNA copies per day. Because an infected cell in the model produces virus over an average of 1/δ days, the total viral burst size can be estimated as p/δ = 1.87 × 10⁴ RNA copies per cell. This in vitro estimate is in reasonable agreement with recent in vivo estimates obtained using single-cycle SIV (Chen et al., 2007). The total burst size is defined as the total number of virions produced by any one infected cell during its life-time (Nowak and May, 2000; Beauchemin et al., 2008; Iwami et al., 2012) (see Figure 3), and is often considered as a normalized viral replication property reflecting the trade-off between viral production (p) and its cytopathic effects (δ).
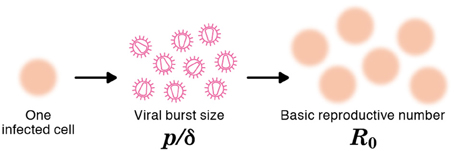
Figure 3. The burst size and the basic reproductive number of a virus. The burst size is defined as the expected number of virions produced by one infected cell over its life-time (e.g., p/δ = 9 in the figure). The basic reproductive number, R0, is defined as the expected number of newly infected cells resulting from one infected cell during its life-time (e.g., R0 = 6 in the figure).
Basic Reproductive Number (R0)
The average number of newly infected cells produced from any one infected cell, under conditions where the most of the target cells are uninfected, is known as the basic reproductive number R0, and is an important parameter predicting the course of infection (Nowak et al., 1997; Nowak and May, 2000; Ribeiro et al., 2010). Any one infected cell produces a progeny of p/(δ + d) viruses before the cell dies, or is removed from the culture, and each produced virus will infect target cells at a constant rate β, until the virus is cleared or harvested (i.e., over 1/(r + c) days on average). At the beginning of the experiment there are T0 target cells. Thus, using our parameter estimates, the reproductive number is calculated as R0 = βpT0/[(δ + d)(r + c)] = 5.10 in in vitro culture experiments (Nowak and May, 2000; Beauchemin et al., 2008; Iwami et al., 2012) (see Figure 3). The basic reproductive number characterizes the course of the infection in cell culture. For example, one can predict the fraction of target cells that will be removed by the infection through the recursive relation 1 − fI = e−R0fI, which is called the “final size equation” (Anderson, 1991; Iwami et al., 2012). Here the parameter fI corresponds to the fraction of target cells that are eventually removed by the infection (i.e., fI = 1 − T(∞)/T0). Using the R0 = 5.1 we find that fI = 0.9937, and that the fraction of surviving target cells at the end of the infection should approach 1-fI = 0.0063. In our experiments this implies a final target cell population of approximately T (∞) = 4.03 × 10⁴ cells/ml. This value agrees well with the final size of Nef-negative HSC-F cells in the MOI 2.0 × 10⁻⁴ experiment, where T (9) = 1.62 × 10⁴ cells/ml. Thus, the basic reproductive number provides valuable information about the expected course of infection. Note that at the MOI of 2.0 × 10⁻⁵ the infection is so slow that the final target cell value has not yet been approached at day 9 (see Figure 2).
Conclusion
Combining mathematical modeling with experimental data, we have been able to estimate several parameters defining the kinetics of SHIV-KS661 infecting HSC-F cells, from just two time courses of an in vitro infection. For this it was essential that we had the full time-course of the infection available for fitting the model. The data before the peak of virus infection, i.e., the up-slope of the number of viral RNA copies in the culture supernatant, reflects virus production, while the data after the peak, i.e., the down-slopes of the viral load and the infected cells, reflect the death of infected cells and viral clearance. Thus to reliably estimate the kinetic parameters, one needs to collect time-course data throughout the infection.
Perspective
Our results of an SHIV infection in an in vitro cell culture are a simple example of a quantitative analysis of virus infection dynamics employing on mathematical and computational methods. Our approach can be applied regardless of viral family and genus. To further explore how our approach of modeling time-course data can be used in future work we will discuss a number of hypothetical examples, emphasizing how quantitative estimates can be used to address unsolved question in virology.
Identifying the Major Differences Among Several Viral Strains
After fitting time-course data from different virus strains, one can compare the estimated parameters of each viral strain, such as its half-life of infected cells, burst size and basic reproductive number, to reveal the quantitatively largest differences between the strains (Mitchell et al., 2011). For example, let us denote SHIV-KS661 as “virus-A,” which brings about a half-life of 0.4 days in infected cells, and consider a less cytopathic variant “virus-B” extending the half-life 1.5-fold to 0.6 days. The expected time-courses of these two variants are depicted in Figure 4, and reveal a major difference in the target cell dynamics and minor differences in the number of infected cells and the viral load (compare the solid line with the dashed lines, depicting virus A and B, respectively). If one were to fit the in silico data from virus A and B in Figure 4 with our mathematical model, one would correctly conclude that the half-life of infected cells of virus-B is 1.5 times longer than that of cells infected with virus-A, and therefore that virus B is less cytopathic than virus A. It is difficult to arrive at that result by just visual inspection of the data, however. The effect of cytopathicity on the time courses of target cells, infected cells, and virus load are difficult to predict intuitively. Additionally, there is no experimental technique available to measure quantities like the cytopathicity directly as an absolute value. For the production rate, the burst size and the basic reproductive number of the virus, similar arguments apply, and one has to rely on modeling to identify quantitative differences between viral strains.
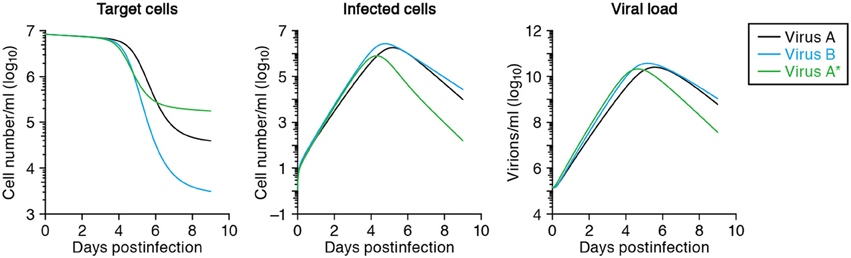
Figure 4. Predicted virus infection kinetics with different parameters. The solid curves show the predicted kinetics of target cells (left), infected cells (middle) and virus load (right) following infection with SHIV-KS661 at an MOI 2 × 10⁻⁴ using the parameters in Tables 2 and 3. The time t = 0 corresponds to 24 h after inoculation of SHIV-KS661 to HSC-F. In the text we call this virus-A. The dashed and dotted curves show those of the variants virus-B and virus-A*, respectively. Virus-B is less cytopathic and has a 1.5-fold decreased death rate of infected cells (δ = 1.16). Cells infected with the more virulent “mutant” virus-A* die 3-fold faster than those infected with the wild-type A (i.e., δ = 5.25 vs. δ = 1.75, respectively), but produce 2-fold more virus (p = 6.72 × 10⁴) per day than those infected with “wild-type” virus-A.
Identifying the Function of Viral Proteins or Amino Acids in Infection
Using molecular cell biology techniques, we are currently able to investigate the function of individual viral proteins in several aspects of viral replication. However, it remains difficult to interconnect those particular results and to integrate the roles of different molecules in terms of the overall parameters defining a virus infection, like a replication rate or a burst size. By modeling in vitro time courses, and comparing the estimated parameters between a wild-type virus and several particular mutants, one can quantify the role of every amino acid mutation on the several parameters defining a virus infection. For example, if one were to take SHIV-KS661 as a “wild-type virus-A,” with an estimated half-life of infected cells of 0.40 days and a viral production rate of 3.26 × 10⁴ RNA copies per day (see Table 2), and find by fitting that a more virulent mutant “virus-A*” has a 3-fold shorter half-life of its infected cells, but a 2.0-fold increased production rate of 6.52 × 10⁴ RNA copies per day, one would be able to conclude that this particular mutation decreases the total viral production per generation to 2/3 of that of the wild-type. Thus, the more virulent virus is less fit, i.e., has a lower R0, because the total burst sizes of virus-A and virus-A* are 1.87 × 10⁴ and 1.25 × 10⁴ RNA copies per generation, respectively. For the function of the mutated protein one would be able to conclude that it plays a role in the production of novel viral particles, and that increased production apparently brings about a shorter expected life-span of infected cells. The solid and dotted curves in Figure 4 show the virus kinetics predicted by Equation (1) for virus-A (solid line) and virus-A* (dotted line), respectively. Similar approaches allow us to also investigate the functions of multiple mutations in possibly several proteins quantitatively.
Finding the Target of Novel Antiviral Compounds
Calculating and comparing parameter estimates in the absence and presence of an antiviral compound, allows one to investigate the function of the compound in a very similar manner (Baccam et al., 2006; Beauchemin et al., 2008). For instance, if the daily viral production rate is reduced to half but the half-life of infected cells has remained similar, one concludes that the compound inhibits viral production without affecting cytopathicity. In addition, if a dose-dependent basic reproductive number, Ro, were obtained, one would estimate how effectively the compound inhibits total viral replication. From the value of 1−1/R0 (Anderson, 1991), one can calculate the critical compound concentration at which the infection should die out. Note that this value is not the same as the conventional IC50, the half maximal (50%) inhibitory concentration. Identifying the precise mode of action of novel compounds may help the development of novel antiviral drugs.
Future Direction
As discussed above, an approach of combining experiments with mathematical modeling has broad applications in virology. One possible extension of our model is to also consider the “eclipse” phase of the infection of a cell to allow for a period in which no virus is produced and the cell may have a different death rate (Baccam et al., 2006; Beauchemin et al., 2008; Iwami et al., 2012). Another extension is to divide the viral population into infectious and non-infectious virus, because the virus that is produced by most of the cells is non-infectious (Schulze-Horsel et al., 2009; Iwami et al., 2012). In Equation (1), it is assumed all virus is infectious, and the non-infectious fraction is in fact incorporated by a lower infection rate β. If one were to have data on the amounts of infectious and non-infectious virions, and/or on the fraction of infected cells in the eclipse phase, one can extend the mathematical model accordingly and obtain even more detailed quantification of the characteristics of any virus studied in particular culture conditions. Furthermore, it is challenging but very interesting to distinguish cell-free and cell-to-cell infection, which are two different mode of viral infection, and to quantify the efficacy of each mode. Sourisseau et al. reported that in a continuously shaken culture in a HIV replication assay cell-to-cell infection is blocked (Sourisseau et al., 2007). Combining a novel mathematical model including both a cell-free and a cell-to-cell infection mode, and fitting that to shaken and non-shaken HIV replication assays, we might be able to quantitatively identify the two infection modes. Summarizing, our method of modeling time courses of viral infection is effectively capable of describing the data, and therefore provides a new approach of characterizing and comparing viruses in a quantitative manner to better understand their infection kinetics under in vivo circumstances.
Conflict of Interest Statement
The authors declare that the research was conducted in the absence of any commercial or financial relationships that could be construed as a potential conflict of interest.
Acknowledgments
This work was supported by JST PRESTO program (Shingo Iwami) and by the Aihara Innovative Mathematical Modeling Project, the Japan Society for the Promotion of Science (JSPS) through the “Funding Program for World-Leading Innovative R & D on Science and Technology (FIRST Program),” initiated by Council for Science and Technology Policy (CSTP) (Shingo Iwami, Kei Sato, and Kazuyuki Aihara).
References
Akari, H., Mori, K., Terao, K., Otani, I., Fukasawa, M., Mukai, R., and Yoshikawa, Y. (1996). In vitro immortalization of Old World monkey T lymphocytes with Herpesvirus saimiri: its susceptibility to infection with simian immunodeficiency viruses. Virology 218, 382–388.
Anderson, R. M. (1991). The Kermack-McKendrick epidemic threshold theorem. Bull. Math. Biol. 53, 3–32.
Baccam, P., Beauchemin, C., Macken, C. A., Hayden, F. G., and Perelson, A. S. (2006). Kinetics of influenza A virus infection in humans. J. Virol. 80, 7590–7599.
Beauchemin, C. A., McSharry, J. J., Drusano, G. L., Nguyen, J. T., Went, G. T., Ribeiro, R. M., and Perelson, A. S. (2008). Modeling amantadine treatment of influenza A virus in vitro. J. Theor. Biol. 254, 439–451.
Chen, H. Y., Di Mascio, M., Perelson, A. S., Ho, D. D., and Zhang, L. (2007). Determination of virus burst size in vivo using a single-cycle SIV in rhesus macaques. Proc. Natl. Acad. Sci. U.S.A. 104, 19079–19084.
Clapham, P. R., Weiss, R. A., Dalgleish, A. G., Exley, M., Whitby, D., and Hogg, N. (1987). Human immunodeficiency virus infection of monocytic and T-lymphocytic cells receptor modulation and differentiation induced by phorbol ester. Virology 158, 44–51.
Ho, D. D., Neumann, A. U., Perelson, A. S., Chen, W., Leonard, J. M., and Markowitz, M. (1995). Rapid turnover of plasma virions and CD4 lymphocytes in HIV-1 infection. Nature 373, 123–126.
Holder, B. P., and Beauchemin, C. A. A. (2011). Exploring the effect of biological delays in kinetic models of influenza within a host or cell culture. BMC Public Health 11, S10.
Iwami, S., Holder, B. P., Beauchemin, C. A., Morita, S., Tada, T., Sato, K., Igarashi, T., and Miura, T. (2012). Quantification system for the viral dynamics of a highly pathogenic simian/human immunodeficiency virus based on an in vitro experiment and a mathematical model. Retrovirology 9, 18.
Mitchell, H., Levin, D., Forrest, S., Beauchemin, C. A., Tipper, J., Knight, J., Donart, N., Layton, R. C., Pyles, J., Gao, P., Harrod, K. S., Perelson, A. S., and Koster, F. (2011). Higher level of replication efficiency of 2009 (H1N1) pandemic influenza virus than those of seasonal and avian strains: kinetics from epithelial cell culture and computational modeling. J. Virol. 85, 1125–1135.
Mohler, L., Flockerzi, D., Sann, H., and Reichl, U. (2005). Mathematical model of influenza A virus production in large-scale microcarrier culture. Biotechnol. Bioeng. 90, 46–58.
Nowak, M. A., Lloyd, A. L., Vasquez, G. M., Wiltrout, T. A., Wahl, L. M., Bischofberger, N., Williams, J., Kinter, A., Fauci, A. S., Hirsch, V. M., and Lifson, J. D. (1997). Viral dynamics of primary viremia and antiretroviral therapy in simian immunodeficiency virus infection, J. Virol. 71, 7518–7525.
Perelson, A. S., Essunger, P., Cao, Y., Vesanen, M., Hurley, A., Saksela, K., Markowitz, M., and Ho, D. D. (1997). Decay characteristics of HIV-1-infected compartments during combination therapy. Nature 387, 188–191.
Perelson, A. S., and Nelson, P. W. (1999). Mathematical analysis of HIV-1 dynamics in vivo. SIAM Rev. 41, 3–44.
Ribeiro, R. M., Qin, L., Chavez, L. L., Li, D., Self, S. G., and Perelson, A. S. (2010). Estimation of the initial viral growth rate and basic reproductive number during acute HIV-1 infection. J. Virol. 84, 6096–6102.
Schulze-Horsel, J., Schulze, M., Agalaridis, G., Genzel, Y., and Reichl, U. (2009). Infection dynamics and virus-induced apoptosis in cell culture-based influenza vaccine production—Flow cytometry and mathematical modeling. Vaccine 27, 2712–2722.
Shinohara, K., Sakai, K., Ando, S., Ami, Y., Yoshino, N., Takahashi, E., Someya, K., Suzaki, Y., Nakasone, T., Sasaki, Y., Kaizu, M., Lu, Y., and Honda, M. (1999). A highly pathogenic simian/human immunodeficiency virus with genetic changes in cynomolgus monkey. J. Gen. Virol. 80, 1231–1240.
Sourisseau, M., Sol-Foulon, N., Porrot, F., Blanchet, F., and Schwartz, O. (2007). Inefficient human immunodeficiency virus replication in mobile lymphocytes. J. Virol. 81, 1000–1012.
Keywords: virus infection, mathematical modeling, in vitro experiment, quantification
Citation: Iwami S, Sato K, De Boer RJ, Aihara K, Miura T and Koyanagi Y (2012) Identifying viral parameters from in vitro cell cultures. Front. Microbio. 3:319. doi: 10.3389/fmicb.2012.00319
Received: 14 July 2012; Accepted: 16 August 2012;
Published online: 04 September 2012.
Edited by:
Hironori Sato, National Institute of Infectious Diseases, JapanReviewed by:
Takao Masuda, Tokyo Medical and Dental University, JapanYoshinao Kubo, Nagasaki University, Japan
Copyright © 2012 Iwami, Sato, De Boer, Aihara, Miura and Koyanagi. This is an open-access article distributed under the terms of the Creative Commons Attribution License, which permits use, distribution and reproduction in other forums, provided the original authors and source are credited and subject to any copyright notices concerning any third-party graphics etc.
*Correspondence: Shingo Iwami, Faculty of Sciences, Department of Biology, Kyushu University, 6-10-1 Hakozaki, Higashi-ku, Fukuoka, Fukuoka 812-8581, Japan. e-mail: siwami@kyushu-u.org