Integration of SAR Data Into Monitoring of the 2014–2015 Holuhraun Eruption, Iceland: Contribution of the Icelandic Volcanoes Supersite and the FutureVolc Projects
 Stéphanie Dumont1,2*
  Freysteinn Sigmundsson1
  Michelle M. Parks3
  Vincent J. P. Drouin1
  Gro B. M. Pedersen1
  Ingibjörg Jónsdóttir1
  Ármann Höskuldsson1
  Andrew Hooper4
  Karsten Spaans4
  Marco Bagnardi4
  Magnús T. Gudmundsson1
  Sara Barsotti3
  Kristín Jónsdóttir3
  Thórdís Högnadóttir1
  Eyjólfur Magnússon1
  Ásta R. Hjartardóttir1
  Tobias Dürig1,5
  Cristian Rossi6
  Björn Oddsson7
- 1Nordic Volcanological Center, Institute of Earth Sciences, University of Iceland, Reykjavík, Iceland
- 2Instituto Dom Luiz – University of Beira Interior, Covilhã, Portugal
- 3Icelandic Meteorological Office, Reykjavík, Iceland
- 4Centre for the Observation and Modelling of Earthquakes and Tectonics (COMET), School of Earth and Environment, University of Leeds, Leeds, United Kingdom
- 5Department of Geology, University of Otago, Dunedin, New Zealand
- 6Satellite Applications Catapult, Harwell, United Kingdom
- 7National Commissioner of the Icelandic Police, Department of Civil Protection and Emergency Management, Reykjavík, Iceland
We report how data from satellite and aerial synthetic aperture radar (SAR) observations were integrated into monitoring of the 2014–2015 Holuhraun eruption in the Bárðarbunga volcanic system, the largest effusive eruption in Iceland since the 1783–84 Laki eruption. A lava field formed in one of the most remote areas in Iceland, after the propagation of a ∼50 km-long dyke beneath the Vatnajökull ice cap, where the Bárðarbunga caldera is located. Due to the 6 month duration of the eruption, mainly in wintertime, daily monitoring was particularly challenging. During the eruption, the European volcanological project FutureVolc was ongoing, allowing collaboration of many European experts on volcano monitoring activities. Icelandic volcanoes are also a permanent Supersite within the Geohazard Supersites and Natural Laboratories (GSNL) initiative, with support from the Committee on Earth Observation Satellite (CEOS) in the form of a large collection of SAR images. SAR data were acquired by Cosmo-SkyMed (CSK) and TerraSAR-X (TSX) satellites and complemented by aerial SAR images. The large set of SAR satellite data significantly contributed to the daily monitoring during the unrest at Bárðarbunga caldera, the Holuhraun eruption and the year following the eruption. Detection of surface changes using both SAR amplitude and phase information was conducted throughout the whole duration of the volcano-tectonic event, and in the following months, to quantify and track the evolution of volcanic processes at Holuhraun and geothermal activity at Bárðarbunga volcano. Combination of SAR data with other data sets, e.g., satellite optical images and geodetic Global Positioning System (GPS) measurements, was essential for the evaluation of the volcanic hazard in the whole area. International collaboration within the FutureVolc project formed the basis for successful analyses and interpretation of the large SAR data set. Information was provided at Scientific Advisory Board meetings of the Icelandic Civil Protection and used in decision-making, as well as for supporting field-deployment and air-based surveys.
Introduction
Delivering timely early warnings to local authorities is of prime importance when dealing with natural hazards. However, monitoring large and remote areas can be challenging, as monitoring data quality may by poor and of limited spatial and temporal resolution. This may result in delaying the time of information delivery. A strategy is therefore required for efficient assess of natural hazards in a timely manner, e.g., during eruptions. Iceland is one of the most volcanically active regions in the world, with more than 30 active volcanic systems distributed mostly along a >500 km-long divergent plate boundary where the European and American plates diverge. Eruptions in Iceland occur every 2–5 years on average, and landforms in Iceland are affected by a wide variety of eruptive styles, ranging from small effusive to major explosive eruptions. However, only a few volcanic systems (Katla, Grímsvötn, Hekla and Bárðarbunga) located in the Eastern Volcanic Zone of Iceland for most of them are responsible for more than half Icelandic eruptions (Figure 1; Thordarson and Larsen, 2007; Thordarson and Höskuldsson, 2008). The diversity of the Icelandic volcanic systems is illustrated by the elongated stratovolcano Hekla, the subglacial Bárðarbunga caldera and the nested calderas at Askja, which all reflect different interactions with tectonics, eruption environment or with the Icelandic mantle plume. These various interactions directly impact the eruptive styles that vary from effusive to large explosive eruptions also including mixed eruption behavior. In addition, seismic precursors identified at Icelandic volcanoes varied between 15 min to 13 days prior to the eruption; all contributing to a larger range of volcanic hazards (Thordarson and Larsen, 2007; Einarsson, 2018). The eruption of Eyjafjallajökull volcano in 2010 triggered a widespread disruption of airspace during a full week (Mazzocchi et al., 2010; Budd et al., 2011) and demonstrated how a small-medium size eruption can impact a very large area in a short time. Located in south Iceland, this volcano is relatively accessible and deployment of ground-based instruments and the detection of precursory signals could be carried out. However, for other volcanoes located further in-land, such deployment is technically and financially challenging. Bad weather conditions and long winters with few hours of daylight add to the difficulties for deploying and maintaining ground-based instrumentation during unrest or volcanic crisis as well as conducting frequent aerial surveys.
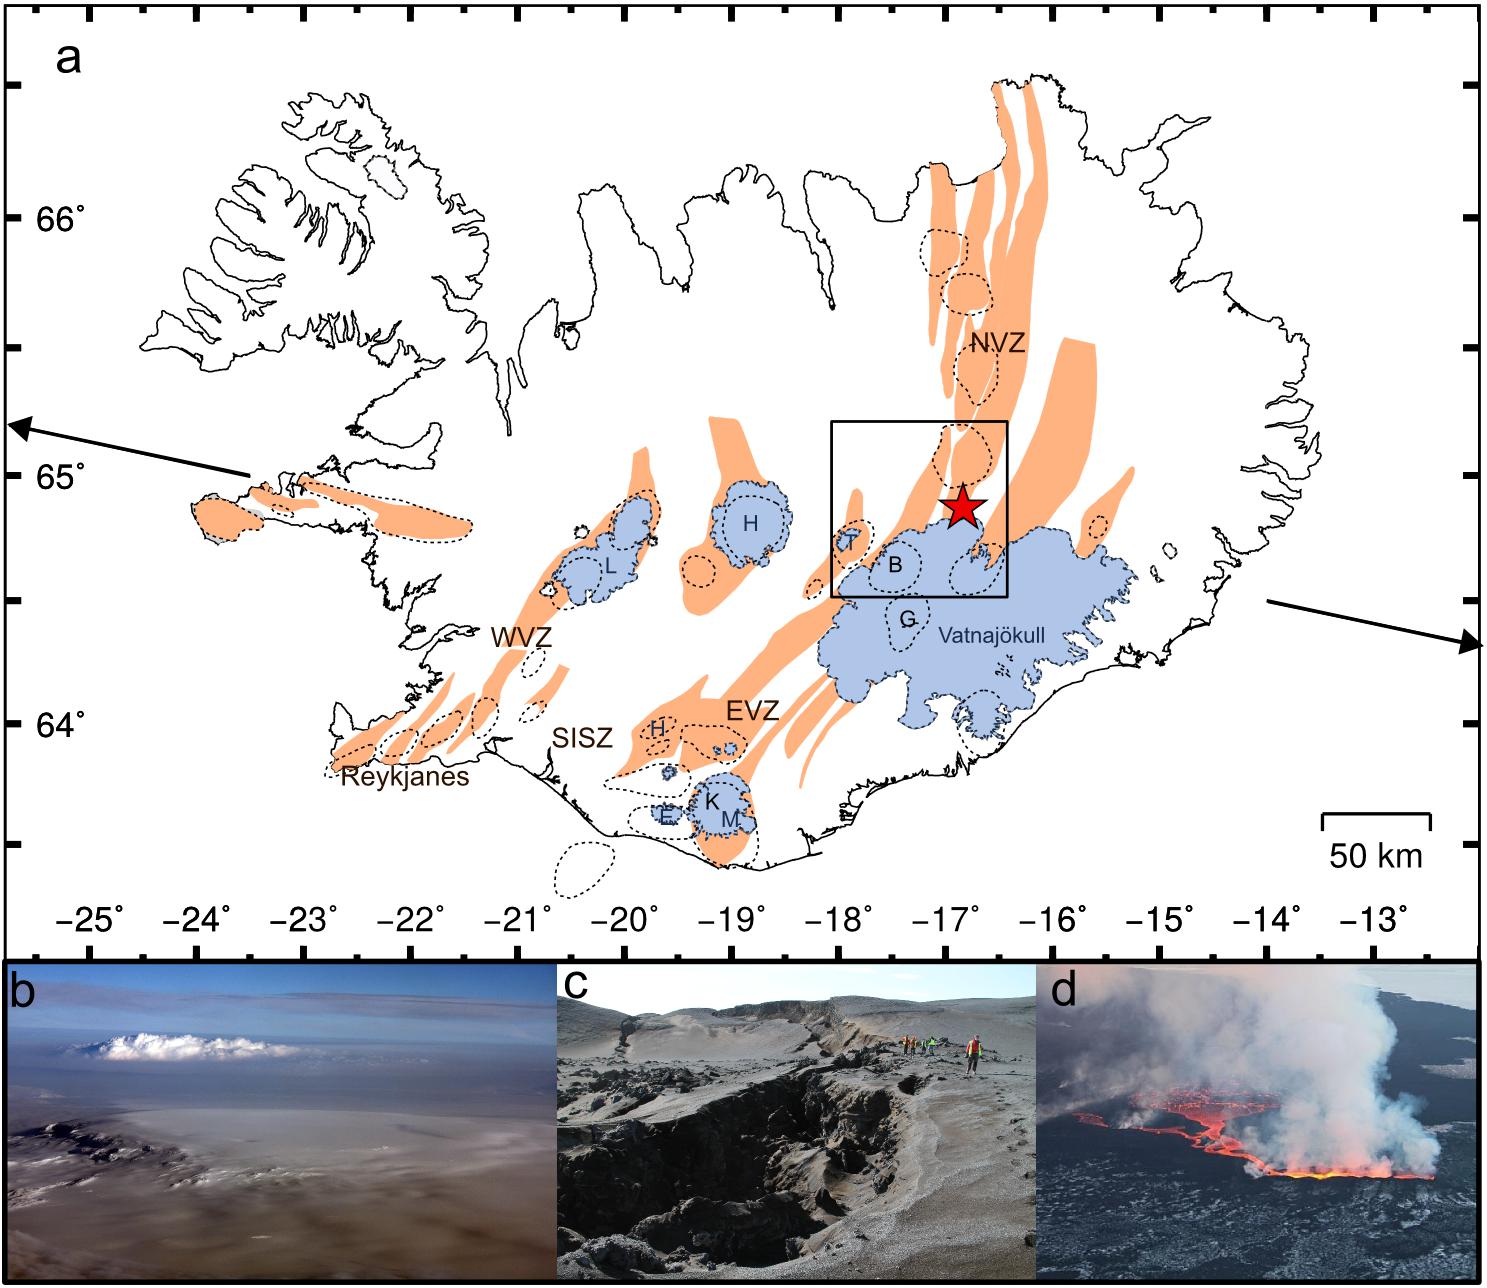
Figure 1. (a) Volcano-tectonic map of Iceland showing fissure swarms (orange) and central volcanoes (dotted outlines) in neovolcanic zones (Johannesson and Sæmundsson, 2009), including: Reykjanes, the Western Volcanic Zone (WVZ), the South Iceland Seismic Zone (SISZ), the Eastern Volcanic Zone (EVZ), and the Northern Volcanic Zone (NVZ). The most active volcanoes include Hekla (H), Katla (K), Eyjafjallajökull (E), Grímsvötn (G) and Bárðarbunga (B). Glaciers are also shown in blue with Hofsjökull (H), Langjökull (L), Mýrdalsjökull (M) and Tungnafellsjökull (T). The black box indicates the study area, where unrest at Bárðarbunga caldera and Holuhraun eruption (red star) took place. The three pictures illustrate (b) the subglacial Bárðarbunga caldera with the volcanic plume from Holuhraun eruption in the background (photo: Magnús T. Gudmundsson), (c) some fissures composing the dyke-induced graben nearby the eruption site (photo: Gro B. M. Pedersen) and (d) the large effusive Holuhraun eruption with the intense gas plume emitted from the main crater (photo: Gro B. M. Pedersen).
Synthetic aperture radar satellite images have begun to change monitoring conditions by imaging areas covering several hundreds of km2 independently of weather and daylight conditions, supporting ground based measurements in the field by detecting displacement and property changes at ground surface. In Iceland, measurements of surface deformation using SAR interferometry can only occur in the snow-free season, which excludes half the year at altitudes exceeding a few hundred meters above sea level (Oelke and Zhang, 2004). However, recent SAR-sensor satellites have offered new opportunities with revisit time of a few days and down to 1 day for the constellation of four Cosmo-SkyMed satellites (Covello et al., 2010). Such new satellite resources were used during unrest at the subglacial Bárðarbunga caldera and during Holuhraun eruption that started mid-August 2014 and ended 6 months later February 27, 2015. Activity took place in one of the most remote areas of central Iceland (Figure 1), extending over more than 250 km2, where very few continuous stations were running prior to the eruption onset. However, the monitoring conditions rapidly changed thanks to national and European support including FutureVolc and Icelandic Volcanoes Supersite projects. The first 15 days were associated with the lateral propagation of a segmented dyke over 48 km (Sigmundsson et al., 2015; Ágústsdóttir et al., 2016) and the next 6 months were followed by an intense effusive eruption that formed a 1.44 km3 lava field, released 9.6 Mt SO2 and triggered the 65 m deep caldera collapse (Gudmundsson et al., 2016; Pedersen et al., 2017; Pfeffer et al., 2018). Assessment of the ongoing activity took place at meetings of a Science Advisory Board of the Icelandic Civil Protection, that were held at 1–7 days intervals during the unrest. The Scientific Advisory Board is a gathering of earth scientists from the Icelandic Meteorological Office (the Icelandic Volcano Observatory), University of Iceland, and several other institutions dealing with public health, pollution, and other relevant issues. Here we present the methods used for mapping surface deformation using InSAR measurements at Bárðarbunga caldera and at the eruption site. We also show how SAR amplitude images were used to track temporal changes and provided valuable information on the active volcanic system during the whole crisis as well as in the following months. These SAR satellites data were used in conjunction with aerial SAR and optical images when available, complementing on-site monitoring instruments and therefore contributing to monitoring natural hazard assessment.
Futurevolc and Icelandic Volcanoes Supersite Projects
The idea of the FutureVolc project1 arose from the small-to moderate 2010 VEI 3–4 eruption at Eyjafjallajökull volcano in Iceland, during which a 5–8 km high eruptive plume paralyzed air traffic on and beyond European continent during a full week (Mazzocchi et al., 2010; Budd et al., 2011; Gudmundsson et al., 2012). The impact of such a small-to moderate size eruption shed light on how interactions between different disciplines of Sciences and Technologies were required to better anticipate and assess the onset of such an eruption and more importantly to track and predict the related ash dispersal. The FutureVolc project began in October 2012 and continued for 3.5 years, funded by the European commission through their Seventh Framework program (FP7). The goal was to establish an integrated volcanological monitoring procedure through a European collaboration using Icelandic volcanoes as a natural laboratory (Jordan et al., 2013; Sigmundsson et al., 2013). The project included the development of new methods to evaluate volcanic crises, which also was considered an opportunity to increase scientific understanding of magmatic processes, all in order to improve timely delivery of relevant information to civil protection and local authorities. The unrest at Bárðarbunga and the Holuhraun eruption offered a unique opportunity to test technical developments and communication procedures serving hazard assessment and allowing at the same time, to further probe magmatic systems as illustrated for instance by several multi-method studies (Sigmundsson et al., 2015; Gudmundsson et al., 2016; Eibl et al., 2017; Müller et al., 2017).
New generations of SAR satellite sensors have short repeat periods ranging from 1, 3, 4, 8, or 12 days for the Cosmo-SkyMed constellation and from 11 days for TerraSAR-X satellite allowing near real-time monitoring through the integration of SAR satellite data. Hence, SAR satellite images were integrated in the FutureVolc project as a key tool for tracking magma movement in the crust to complement ground-based monitoring networks (Parks et al., 2014). This approach was supported by the Icelandic Volcanoes Supersite, an initiative from the Group on Earth Observations (GEO), awarded in 2013. Recognizing the Icelandic volcanoes2 as a Permanent Supersite for Earth Sciences within the Geohazard Supersites and Natural Laboratories (GSNL) initiative was important, and the two projects sharing a common objective: increase scientific understanding of magmatic processes to narrow down the uncertainty in hazard and risk assessment, both in line with an open access policy (Sigmundsson et al., 2017). The Icelandic Volcanoes Supersite has allowed access to archived data from the Radarsat-2, ENVISAT, ERS-1/2, COSMO-SkyMed, and TerraSAR-X/TanDEM-X satellites and more importantly to order future scenes for the two latter satellites, ensuring regular acquisitions and maintenance of time-series to facilitate tracking any magma movement at Icelandic volcanoes.
Data and Data Access
SAR data acquired by the TSX and CSK satellites were ordered and acquired through the Icelandic Volcanoes Supersite. Catalog of archived data for TSX, CSK and Radarsat-2 satellites were initially used to plan future acquisitions as well as for inferring surface deformation prior to the unrest period at Bárðarbunga. The constellation of four CSK satellites was initially re-tasked over Bárðarbunga and Askja calderas in July 2014 with systematic acquisitions planned every 16–30 days in both ascending and descending mode, enabling the first SAR images to be acquired prior to the unrest at Bárðarbunga (Figures 2, 3). At the onset of the eruption, the acquisition plan was altered by the Italian Space Agency (ASI) to enable occasional tandem acquisitions, with images 1 day apart. This allowed the generation of 12 one-day interferograms throughout the unrest/eruption over Bárðarbunga and 7 over Holuhraun (Figure 3). CSK data were acquired over Bárðarbunga and Holuhraun areas along both ascending and descending passes and with various incidence angles. They were delivered through an FTP server within 6 h of their acquisition. During the unrest at Bárðarbunga caldera, several configurations of TSX images were ordered to capture the propagating dyke at best. With the eruption onset, the number of these configurations was reduced to maintain regular acquisitions on the areas bordering Bárðarbunga caldera and surroundings of Holuhraun lava field, using past tracks acquired in this area (Figures 2, 3). In wintertime both during and after the eruption, TSX tracks 147 and 34 covering Bárðarbunga caldera were successfully maintained to survey geothermal activity along the caldera ring faults. TSX orders needed to be planned a couple of days prior to the acquisition date and were delivered through FTP server within 3–5 days, depending on the orbit precision requested.
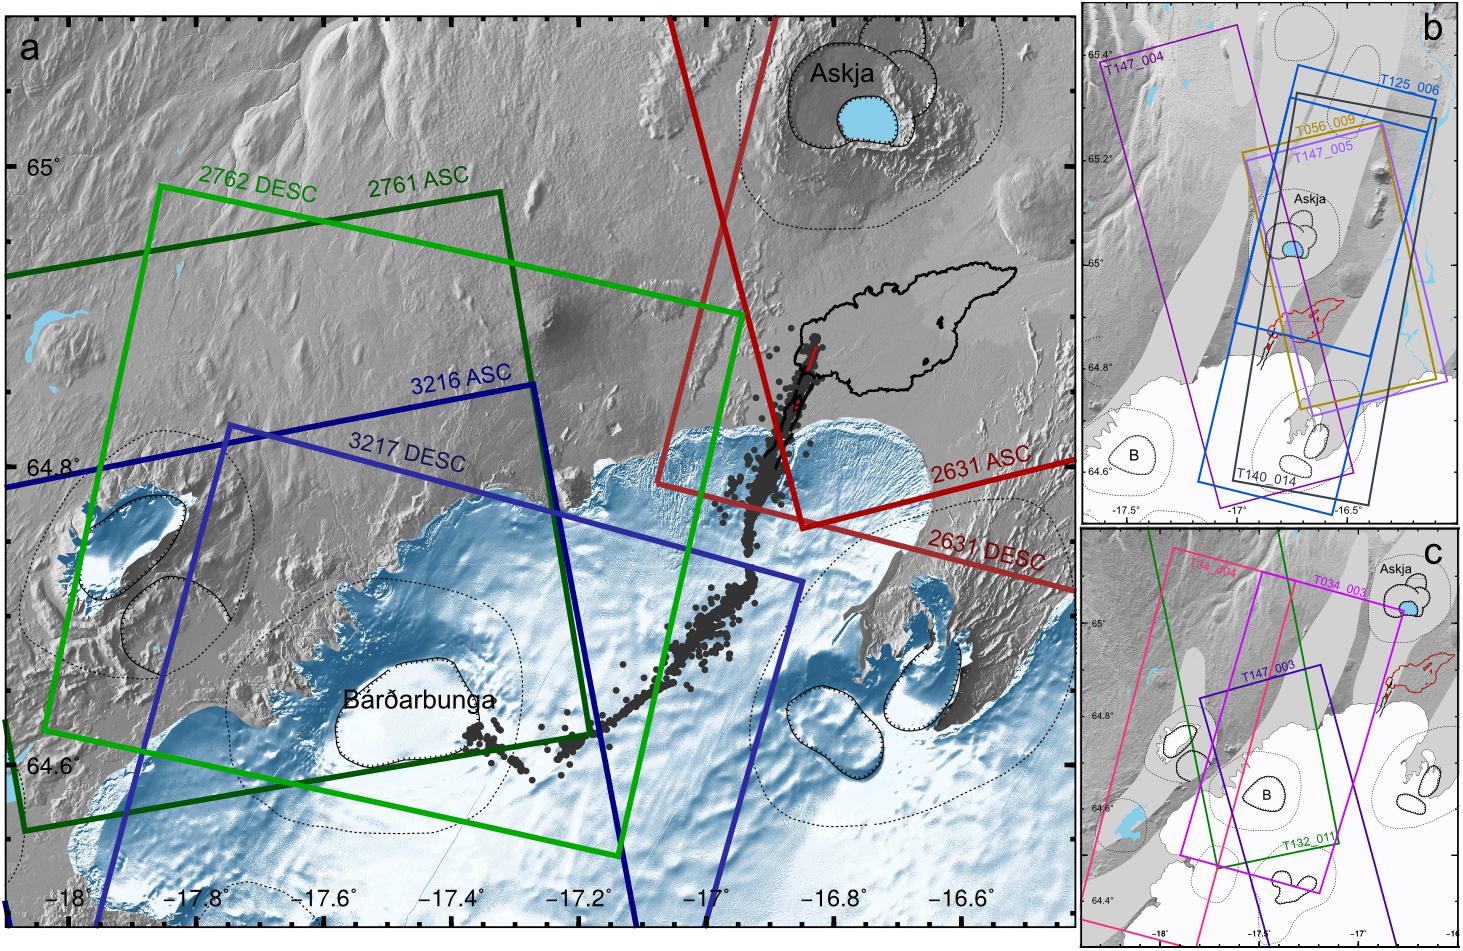
Figure 2. Tracks of SAR satellite images acquired during the unrest at Bárðarbunga and during the 2014–2015 Holuhraun eruption. Footprints of Cosmo-SkyMed satellite images (a), and most frequent TerraSAR-X images acquired over Holuhraun and Bárðarbunga (b,c), respectively (see Figure 3). Dark gray dots in (a) represent seismic events related to the dyke propagation after Sigmundsson et al. (2015). B for Bárðarbunga caldera.
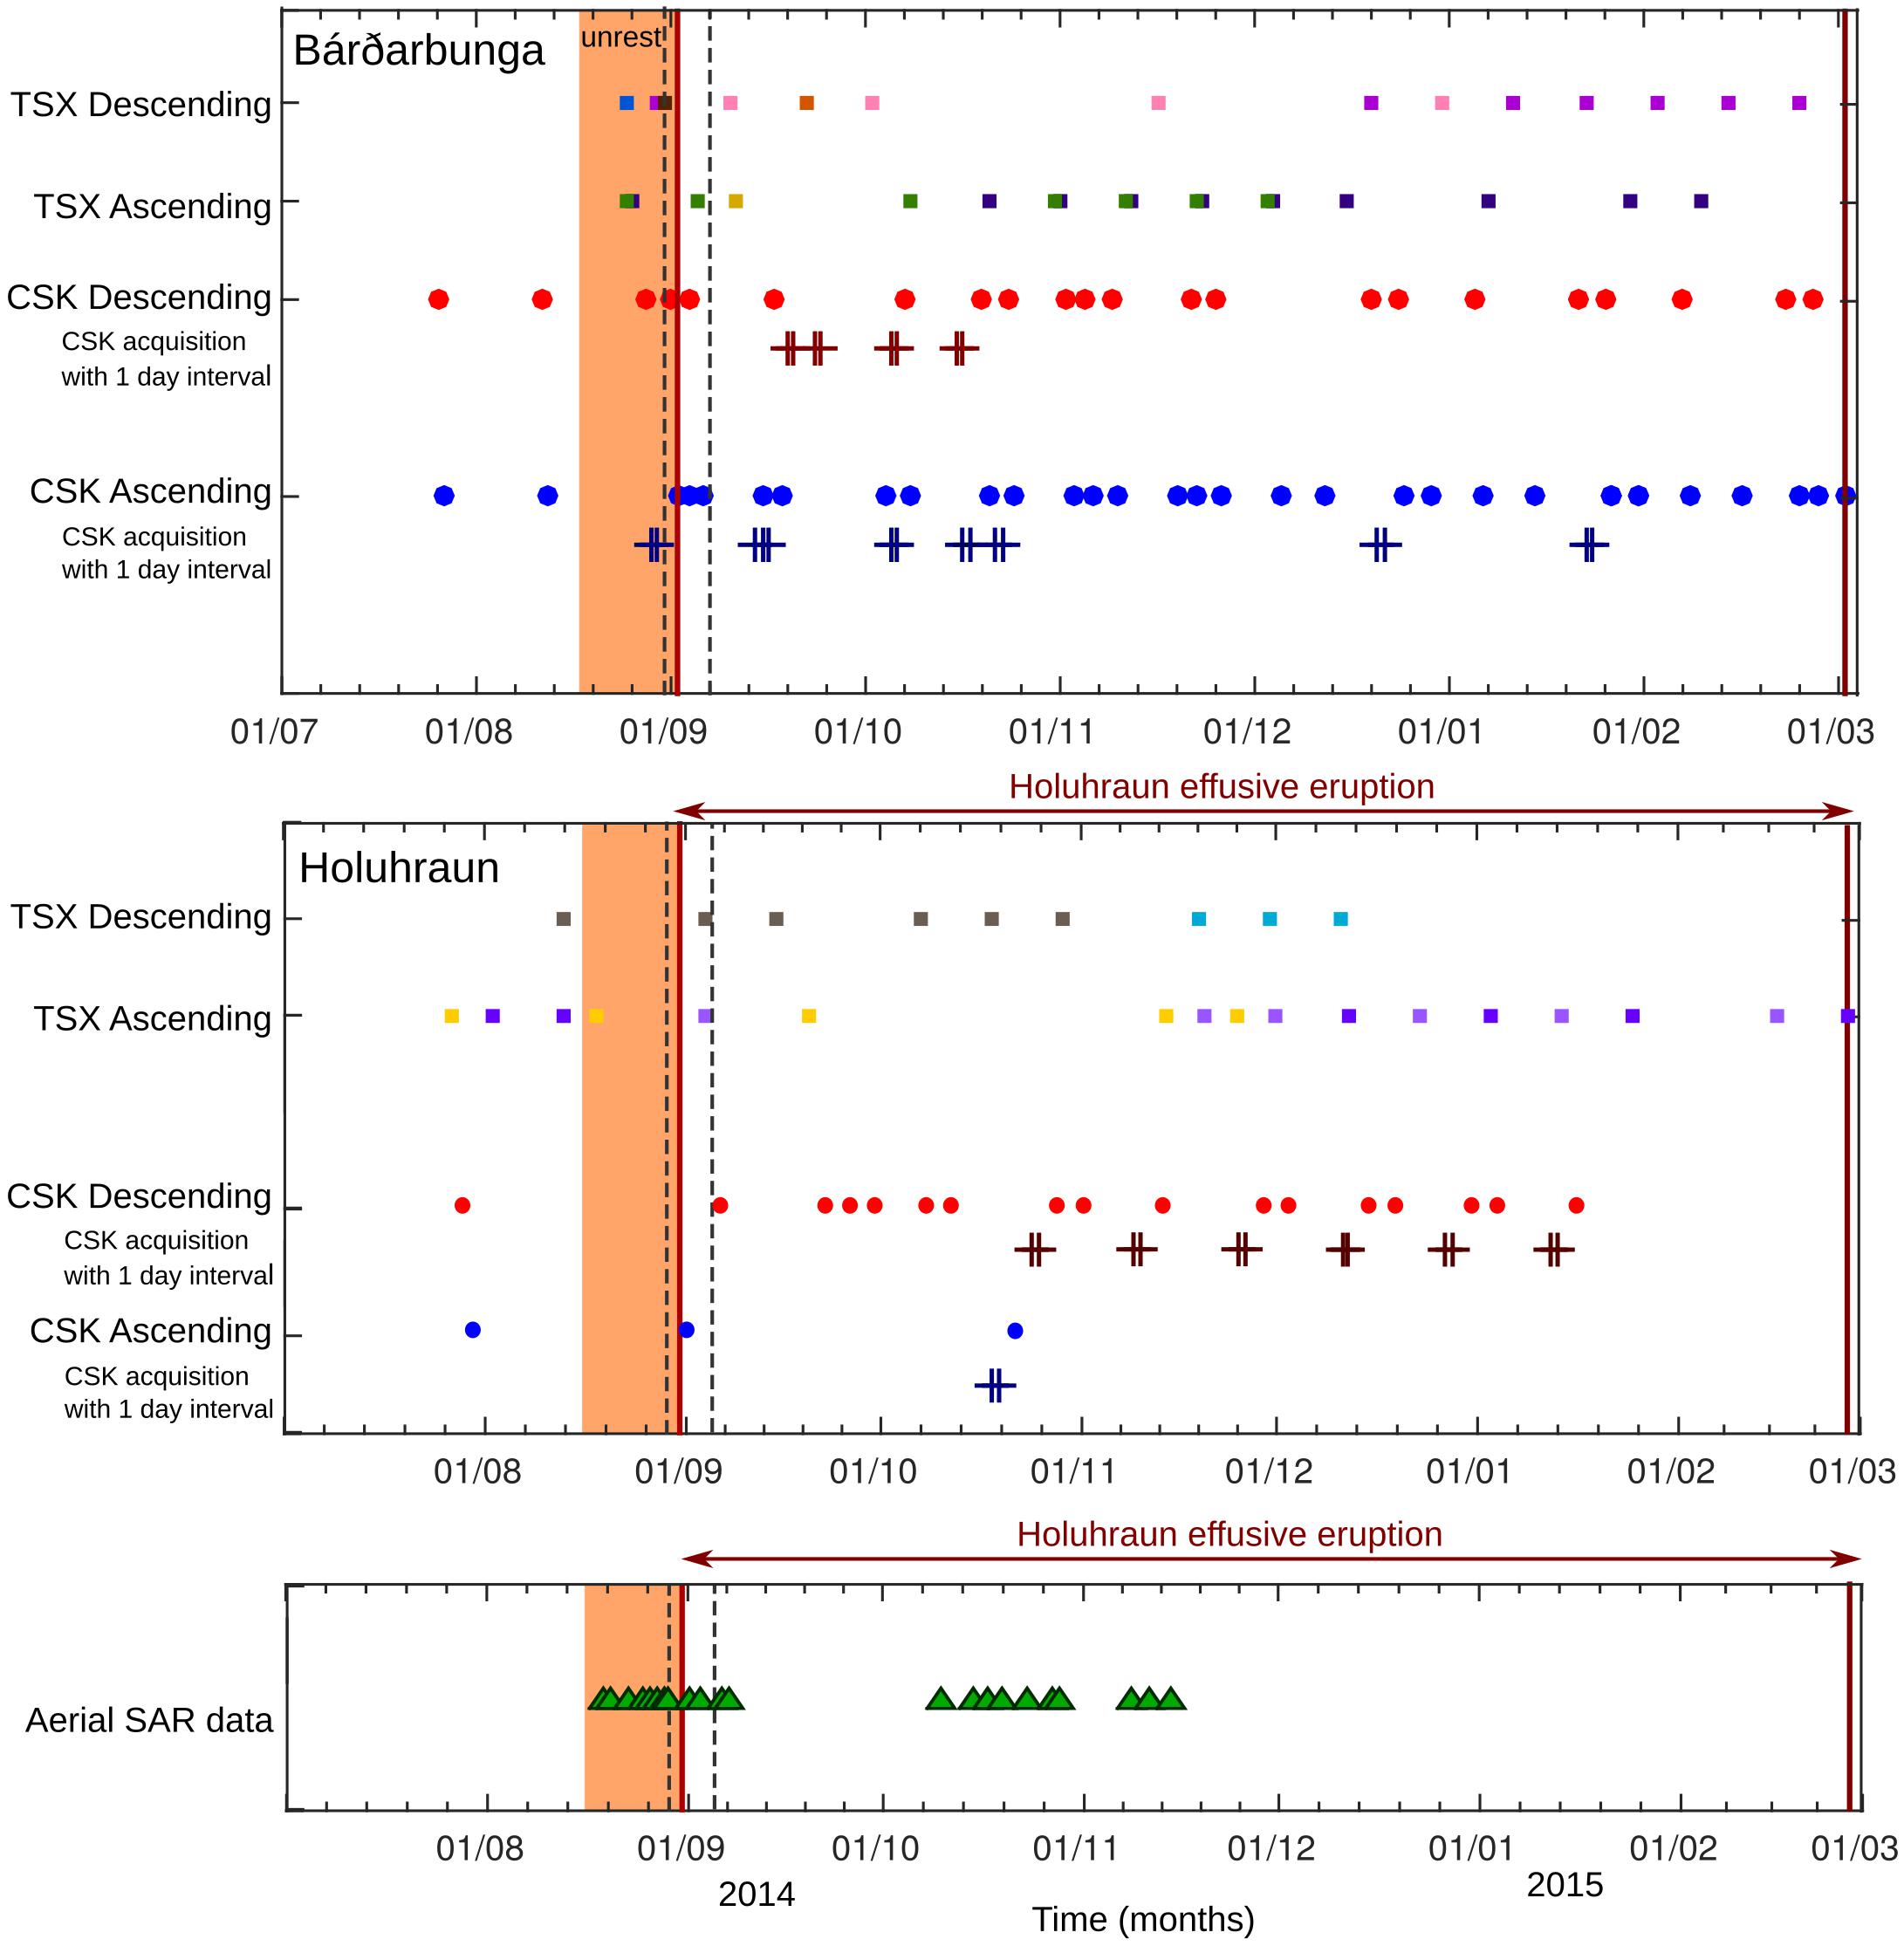
Figure 3. Time-line showing the SAR satellite acquisitions over Bárðarbunga (upper) and Holuhraun (middle) areas as well as aerial acquisitions (lower) for the unrest period and the 6 months of the eruption. The ascending TSX images over Bárðarbunga include track 132 (beam 11, green squares), track 56 (beam 7, dark yellow square) and track 147 (beam 3, magenta squares), and the descending ones: track 34 (dark pink for beam 3 and light pink for beam 4), track 125 (light blue), track 49 (brown for beam 1, orange for beam 2). Over the Holuhraun area, TSX ascending configuration includes track 147 (magenta for beam 4 and mauve for beam 5), track 56 (beam 9, yellow) and for the descending TSX images: track 125 (beam 6, blue) and track 140 (beam 14, gray). Aerial SAR images (lower) include Bárðarbunga caldera and/or Holuhraun area. The red vertical lines mark the onset and the end of the main effusive eruption while the dashed gray lines indicate minor eruptions.
The TanDEM-X (TDX) satellite mission, a twin satellite placed in close formation with TSX satellite, aims at generating a global DEM with a 12-m resolution and a vertical accuracy better than 2 m (Krieger et al., 2007; Zink et al., 2014). The tandem acquisition of TSX/TDX data was originally planned in FutureVolc project in collaboration with the DLR, the German space agency, to track the evolution of height changes relating to ice cauldron formation.
As part of FutureVolc project and from a long volcano monitoring experience in Iceland, airborne SAR data was acquired repeatedly during the unrest. X-band (∼10 GHz) radar data were acquired on board a Bombardier Dash 8 aircraft of the Icelandic Coast Guard, first used for volcano monitoring in Iceland during the Eyjafjallajökull eruption in 2010 (Edwards et al., 2012; Magnússon et al., 2012). The images were typically obtained at a safe aircraft-target distance of 30–60 km with an incidence angle of 75–85°. Spatial resolution of the images obtained range from 1 to 12 m, with a trade-off between area coverage and resolution, and with only amplitude data preserved. These acquisitions were of major importance during the first 3 months of unrest (Figure 3), where the SAR images allowed tracking the changes in ice surface due to thermal activity underneath the glacier, both within the Bárðarbunga caldera and along the subglacial path of the dyke (Gudmundsson et al., 2016; Reynolds et al., 2017). At the eruption site, the aerial SAR images appeared also essential to track the development of the lava field in the first months and to retrieve lava thickness (Pedersen et al., 2017). An important aspect of these data is that they were near-real time, with images available immediately after acquisitions.
During the eruption, all available satellite and airborne images including SAR data were used in near-real time to map and track geomorphological changes at the Bárðarbunga caldera and Holuhraun eruption site, as well as the area in between. Various multi-spectral satellite images (NOAA AVHRR, ∼1 km resolution; MODIS, 250–500 m resolution; LANDSAT-7 and 8, 15–30 m resolution; EO-1, 10–30 m resolution) and thermal images (MODIS and NOAA AVHRR, 1 km resolution) were freely accessible through the USGS EarthExplorer and NASA platforms. Some of these data were purchased via the Dundee Satellite Receiving Station to ensure a real time delivery. NOAA AVHR and MODIS data were used on a daily basis with up to 10 images per day on average, for a low spatial resolution, while EO-1 and LANDSAT-7 and 8 were typically acquired 1–2 per week, with a delivery time varying from 0.5 to 6 h. CSK, TanDEM-X/TerraSAR-X SAR data were also used on a regularly basis (Figure 3) as well as Sentinel-1A satellite images (ESA Copernicus). These latter became available from an operational point of view on October 6, 2014 every 12 days with 3 h delivery time. Some SAR data were purchased via KSAT, Kongsberg satellite services, allowing a near-real time delivery of ∼0.5 h. Although less frequent, SAR data proved to be very useful for maintaining the monitoring over this large area located in central Iceland and partly occurring during Icelandic winter.
Methods
Mapping Surface Deformation Using InSAR Analysis
Surface deformation was mapped by forming interferograms using interferometric analysis of SAR images (Figure 4), using either the ROI_PAC (Rosen et al., 2004) or the GMTSAR software (Sandwell et al., 2011a,b). When using ROI_PAC, Single Look Complex (SLC) images were usually multi-looked at 16 looks in both range and azimuth to increase the signal noise ratio while reducing the processing time. For instance, the initial pixel for CSK data, ∼1 × 2.5 m in range and azimuth respectively, resulted in a size of ∼20 × 40 m. With GMTSAR, the full resolution of SLC images is maintained up to the filtering step. Then a decimation of a factor from 1 to 2 (2 pixels in azimuth and 1 in range, or 4 and 2 respectively) was applied prior to the unwrapping.
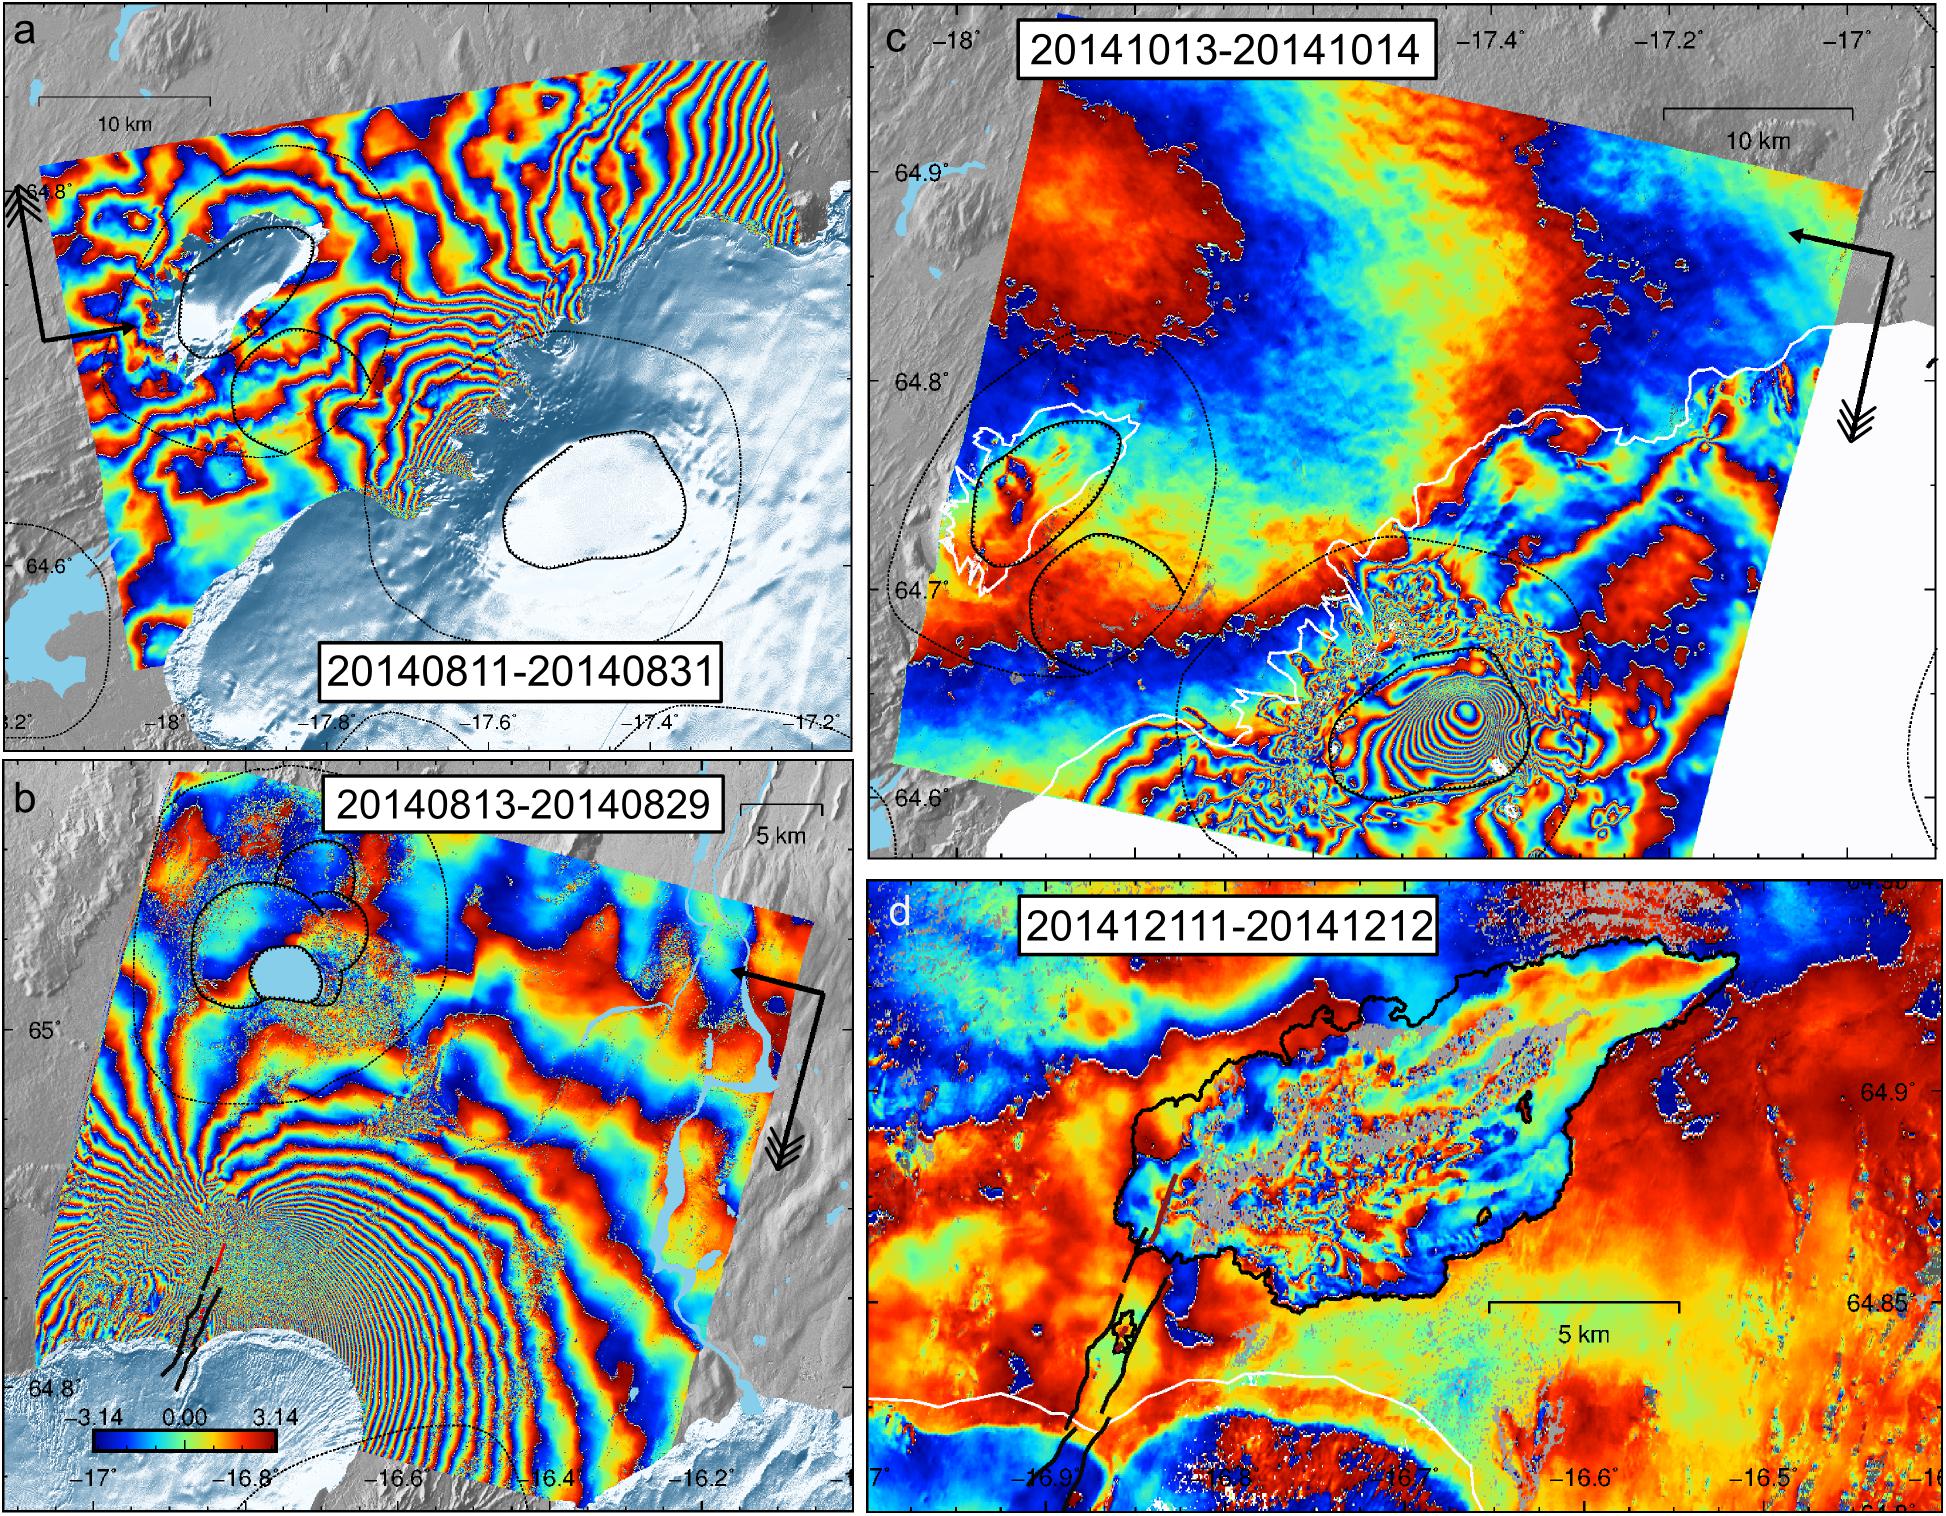
Figure 4. Mapping surface deformation using SAR interferometry at Bárðarbunga caldera and Holuhraun eruption site. Wrapped interferograms formed using CSK images illustrate different surface deformation patterns: (a) the subsidence outside the Bárðarbunga volcano caused by the withdrawal of the magma chamber into the propagating dyke that induced a horizontal dominated surface displacement north of the scene; (b) Northern tip of the dyke propagation where the effusive eruption initiated; (c) subsidence of the ice-capped Bárðarbunga caldera captured by 1-day interferogram and illustrating the 6-month slow caldera collapse. (d) 1-day descending interferogram over the lava field can reveal the most active lava channels (decorrelating areas) and those where lava keeps flowing or inflating at slower rate. Central volcanoes are shown using black dotted lines, calderas using dashed lines, graben borders and eruptive fissure using black and red lines respectively, and the glacier borders in white. Simple black arrow indicates the Line-of-Sight direction, the triple arrows the satellite flight direction.
In both approaches, the co-registration of SLC images and interferogram formation are followed by the elimination of the topographic phase using a DEM. The DEM used was the intermediate TanDEM-X DEM where identified gaps were merged with a combination of ASTER and EMISAR data (Magnússon et al., 2005; Sigmundsson et al., 2015). The adaptive power spectrum filter from Goldstein and Werner (1998) was applied prior to the unwrapping when using ROI_PAC, while a static Gaussian filter was used with GMTSAR. The unwrapping step was performed most frequently using Snaphu, a minimum cost-flow based method (Chen and Zebker, 2001) but also using the branch-cut algorithm implemented in ROI_PAC (Goldstein et al., 1988); used for scenes with an overall good coherence. Over time, it turned out that GMTSAR was particularly efficient for rapid delivery of wrapped and unwrapped interferograms. In general, the wrapped interferogram could be calculated in less than 1 h.
Modeling the Deformation Source
We combined the SAR data collected during the unrest at Bárðarbunga with the GPS data to model the propagating dyke preceding the eruption, which took place beneath the Vatnajökull ice cap and to the north of the ice cap edge. The interferograms were down-sampled using an adaptive quad-tree approach (Decriem et al., 2010). This adaptative quadtree algorithm takes into account the variance of the measurements and their spatial coverage that may include data gaps. It proceeds recursively such the image is progressively divided into squares whose the variance, if higher than a given threshold, will maintain the subsampling process (Decriem et al., 2010). Initial modeling with no a priori constraints on the dyke position matched well with the location of the seismicity, so we fixed the dyke location (though not the depth) to that of the seismic data. We modeled the ∼50 km-long dyke as 120 2 × 2 km patches (Figures 5a,b) and solved for opening and slip of each patch (Okada, 1992), for each day between August 16 and September 6, 2014 (for details, see Sigmundsson et al., 2015). The deflation beneath the caldera was modeled as point pressure source (Mogi, 1958). A Bayesian Markov chain Monte Carlo approach was applied (Tarantola, 2005), to provide a joint probability distribution for the model parameters, sampled using the Metropolis-Hastings rule (Metropolis et al., 1953).
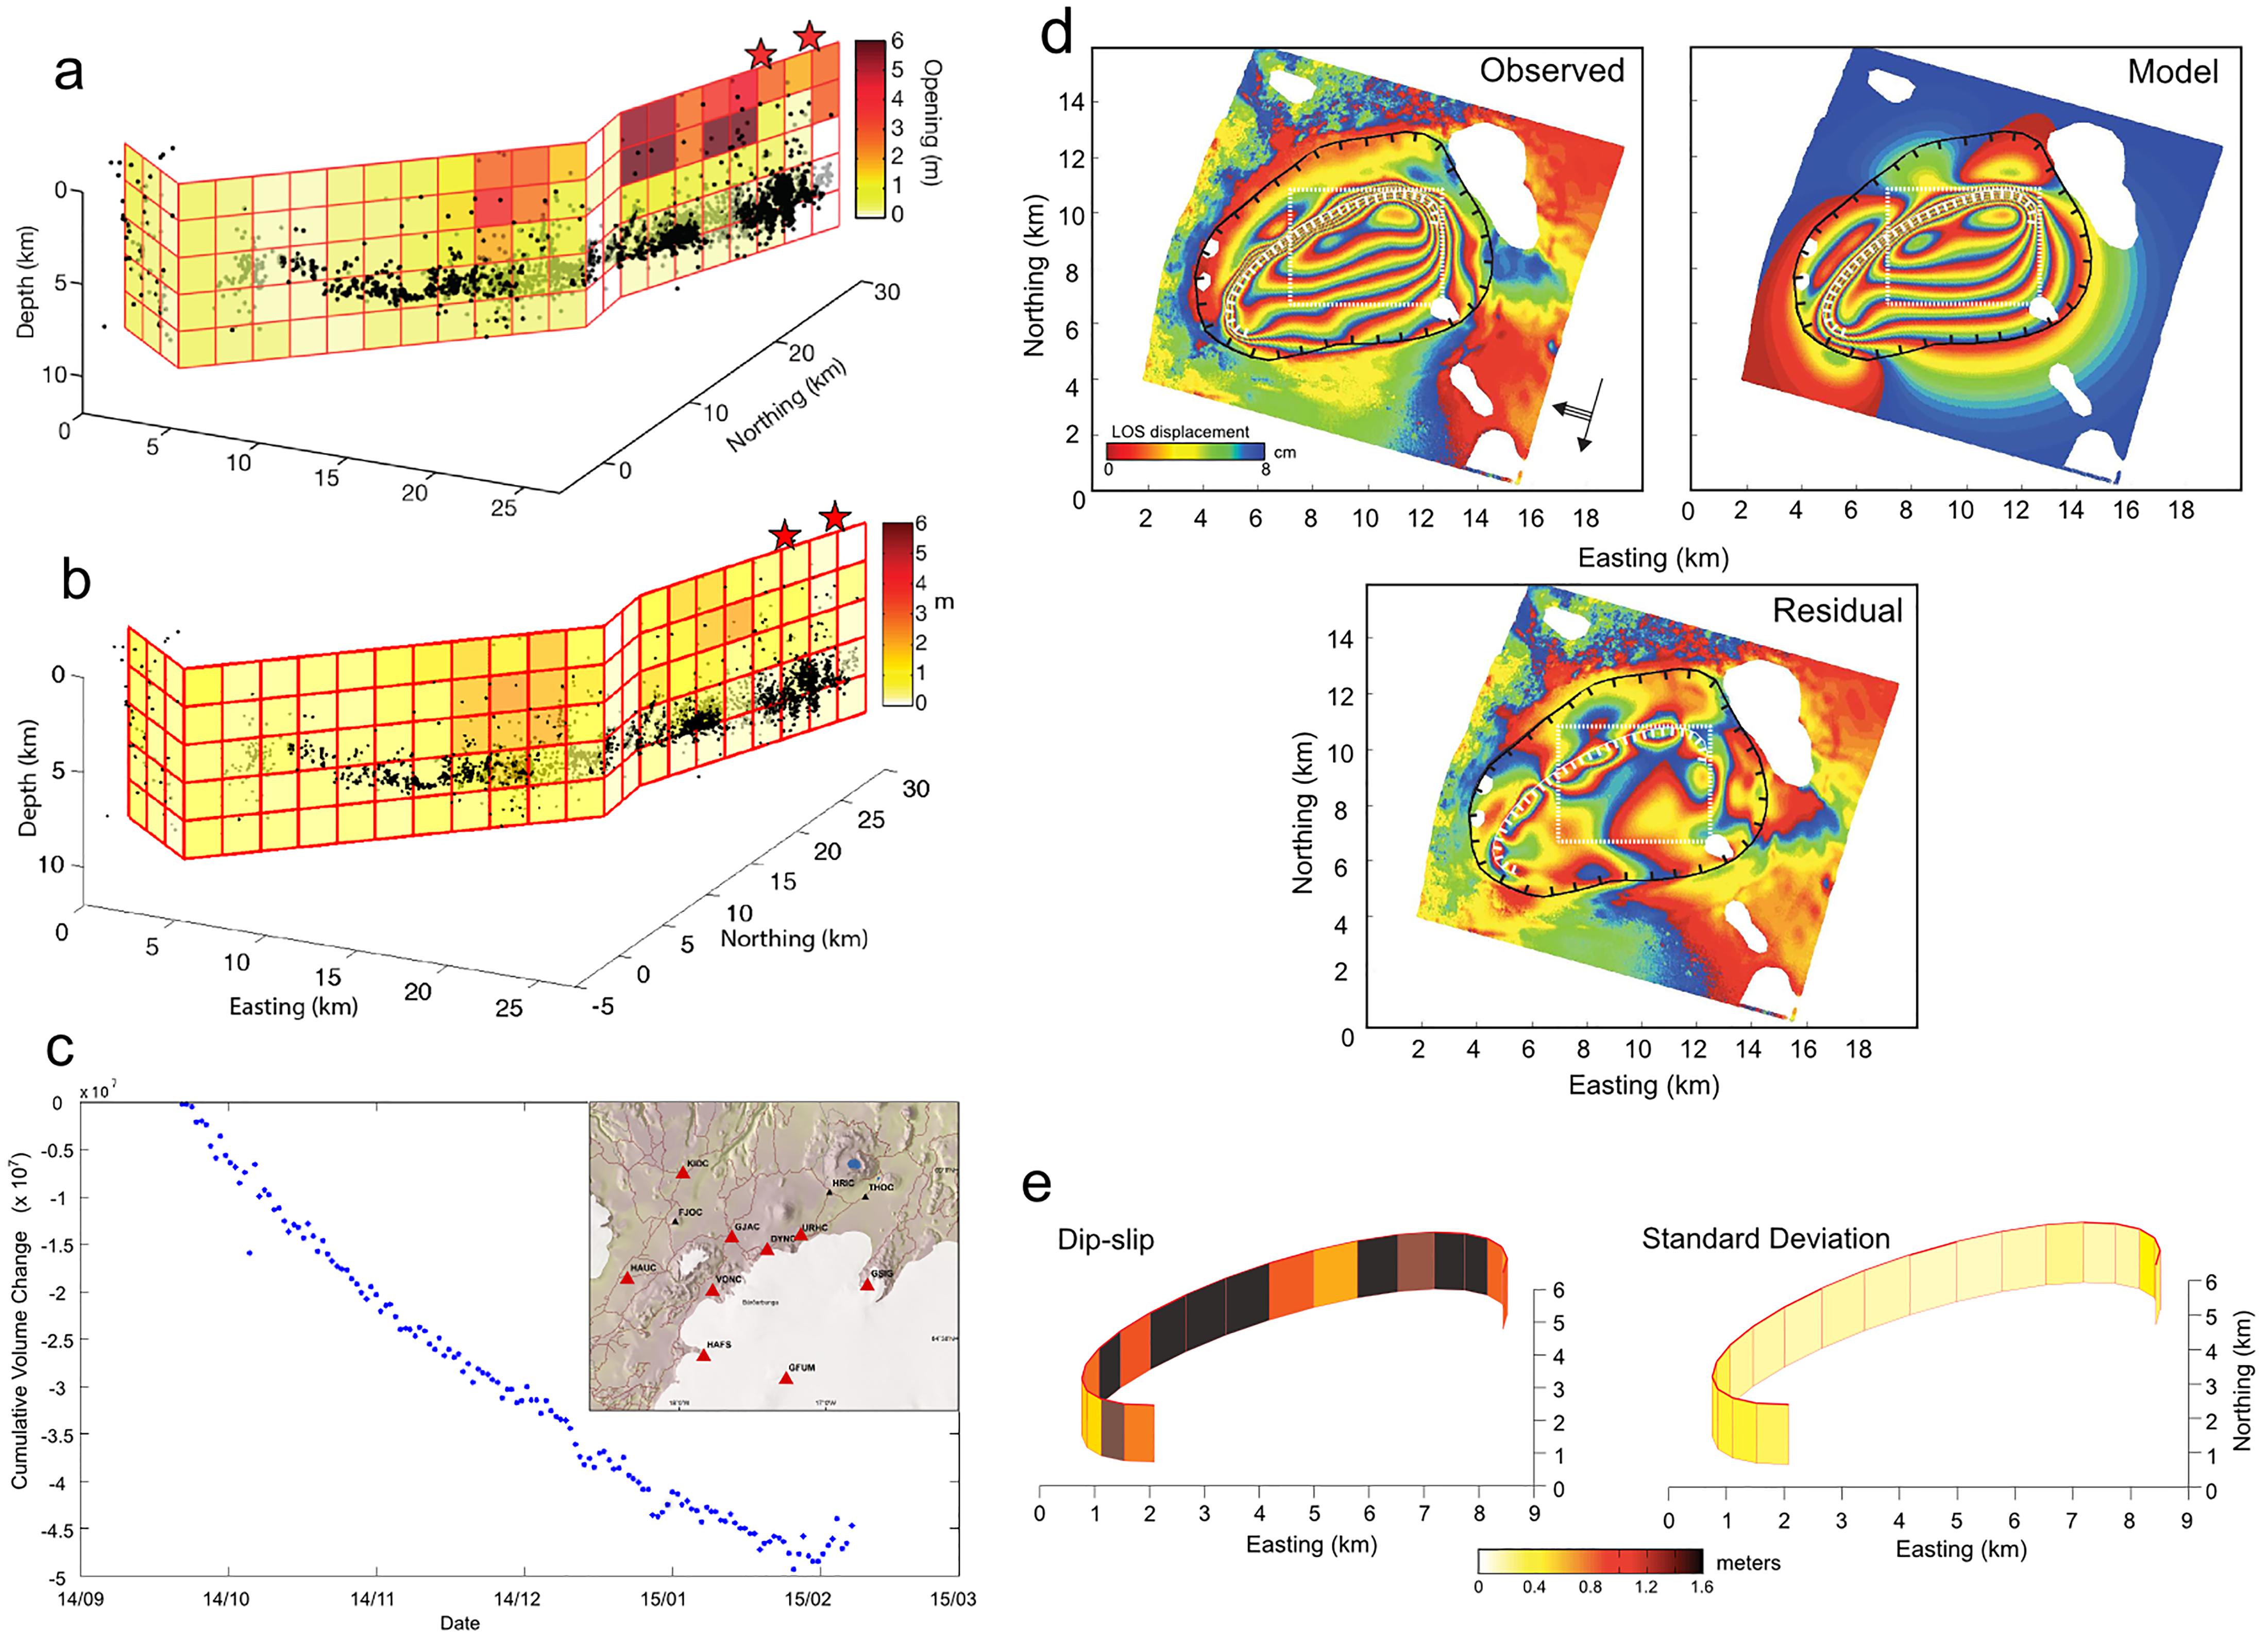
Figure 5. Modeling of the rifting event and the caldera collapse. (a) Mean opening along the ∼50 km dyke that fed the Holuhraun eruption estimated using the MCMC approach and (b) associated standard deviation. Black dots represent the seismicity up to September 6, 2014. (a,b) Modified from Sigmundsson et al. (2015) with permission of SpringerNature. (c) Time series of the volume change for a point source like reservoir estimated from August 31 to February 15, 2015 using CGPS measurements shown in the inset (red triangles), assuming pressure change of a point source beneath the caldera. (d) Observed, predicted and residual surface displacements for deformation at the caldera associated with a Mw 5.3 earthquake on September 18, 2014. The black line outlines the outer caldera rim. The white lines mark the location of the inferred intra-caldera fault system (solid) and of the contracting body (dotted). (e) Median and standard deviation of the posteriori probability of dip-slip for fault segments inferred from modeling. Color indicates the magnitude of slip (key at the bottom). (d,e) Reproduced from Gudmundsson et al. (2016) with permission of AAAS.
After the eruption onset, most of the surface deformation concentrated within a week to the subsiding Bárðarbunga caldera. To track changes at the caldera during the eruption at Holuhraun, we quantified the volume change throughout the 6 month long eruption using continuous GPS measurements (Figure 5c) as well as airplane altimetry (Gudmundsson et al., 2016). The lack of coherence in interferograms and the decreasing deformation magnitude with time, made the use of SAR data for constraining the volume change of magma over time progressively more difficult. GPS observations were converted into a time-series of volume change at crustal depths using the approach outlined by Biggs et al. (2010) and Parks et al. (2015). Displacements were assumed to result from a pressure change within a point source at depth, embedded within an elastic, homogeneous half-space (Mogi, 1958). Although a point source is a simplified approximation of the real source geometry, this is an adequate approximation for modeling far-field cGPS observations. This simplified geometry enables the rapid generation of a time-series of volume change – a technique that proved extremely useful for near-real time monitoring of temporal variations in source parameters/eruptive behavior (Figure 5c). We expect that the estimated volume change reflects only the volume change due to the change of pressure acting on the walls of the chamber, and not that due to replacement of magma by collapse of the chamber roof.
The 6 month long collapse at Bárðarbunga caldera was punctuated by ∼350 Mw4+ earthquakes that induced deformation of the overlying ice cap (Gudmundsson et al., 2016). Some of the earthquakes were captured by 1-day CSK interferograms and modeling these events was crucial for understanding the shallow intra-caldera fault system. The 20140917-20140918 interferogram showed the largest amount of surface displacement, which made it the best event to infer the location and geometry of the subsurface structure (Figure 5d). Other 1-day CSK interferograms are consistent with slip on smaller segments of the same structure, in particular the NE portion.
Initial modeling of the 20140917-20140918 one-day interferogram, with no a priori constraints on position, strike or dip of the fault system, shows that the InSAR data require the faults to be subvertical and form an elliptical structure oriented NE-SW ∼2 km south of the northern caldera rim. The same preliminary analysis shows that a contracting body at the base of the fault system is necessary to account for subsidence at the center and in the southern portion of the caldera. We therefore fixed the fault dip to be vertical and the geometry of the structure to be elliptical. We modeled the caldera fault system as a series of 30 rectangular faults (Okada, 1992) with varying strike and estimated their location, size, minimum depth beneath the surface, and slip on each segment. The contracting body at the base of the fault system was modeled as a closing rectangular dislocation with uniform contraction (Okada, 1992). A Markov-chain Monte Carlo approach was used to estimate the multi-variate probability distribution for all model parameters (Bagnardi and Hooper, 2018).
Morphological Analysis Using Amplitude SAR Images
With pixel resolution varying from 1–3 to 100 m, SAR satellite data turned out to be a progressively indispensable tool over the months of the eruption providing complementary information to thermal and optical satellite imagery allowing not only to map the lava field area but to survey and track morphological changes within the lava field (lava channels, pond and fronts as well as active vents) helping to predict changes of flow directions as well as map the eruptive and tectonic fissures, ice cauldrons and any other changes on the glacier (Figure 6; Hjartardóttir et al., 2016; Pedersen et al., 2017; Reynolds et al., 2017).
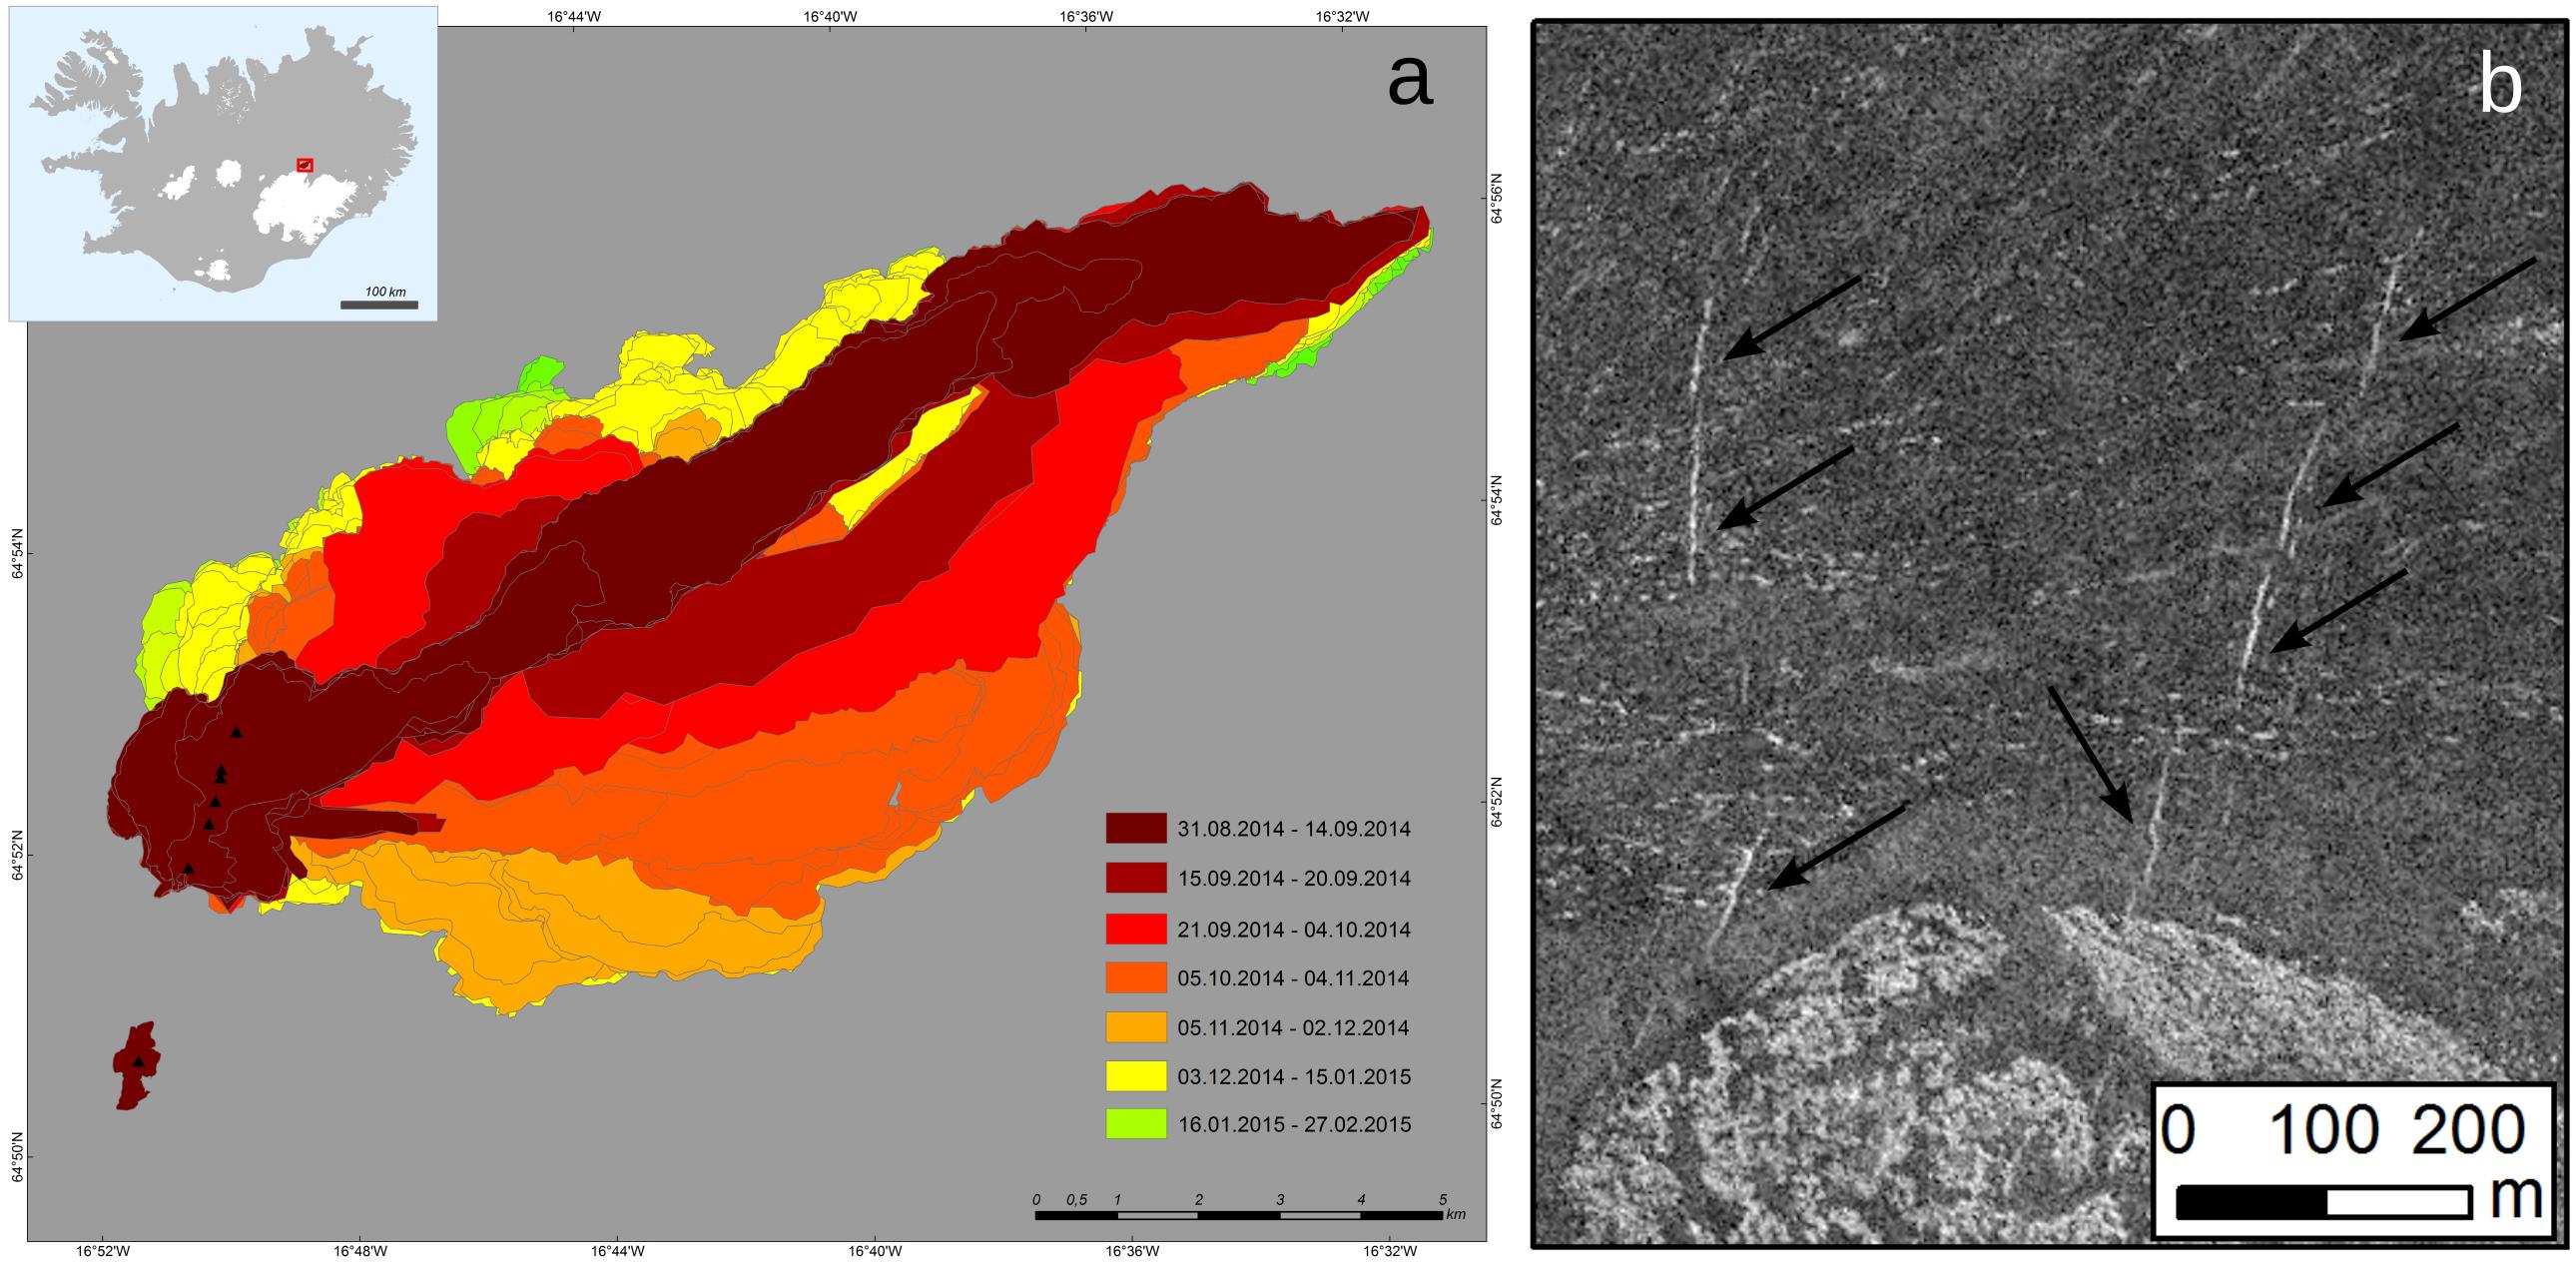
Figure 6. Detecting surface changes using amplitude SAR images. (a) Time evolution of the lava field area deduced from the mapping of the lava outlines using a combination of various remote-sensing data including SAR aerial and satellite data. (b) SAR aerial image covering northern part of Vatnajökull glacier and the South of Holuhraun eruption site and showing fissures (arrows) that formed with the dyke emplacement late August 2014. Modified from Hjartardóttir et al. (2016) with permission of Elsevier.
For ensuring a near real-time monitoring, georeferenced formats of SAR satellite data easily readable using GIS (Geographical Information System) program, were preferred (e.g., Geotiff format). In some case, when such format was not available, georeferencing of quick-look images (jpg format) with a low resolution (50-100 m) was performed both using aerial images and quicklooks from Airbus or directly from the German space agency3. The comparison of different images allowed identification of common stable features like the edge of older lava or visible tracks in both data sets as illustrated with the Figure 7. The comparison of various SAR data for tracking surface changes was challenging because of the different acquisition parameters as e.g., the incidence angle making the radar shadows and hence the reference points different from one set of sensors compared to others. However, their combination with aerial and optical satellite images was essential to overcome these issues and the rapid changes observed in this wash plain due to lava field development (Figure 7). The processing classically applied to SAR amplitude images consisting of a radiometric calibration and a terrain correction was too much time-consuming to be performed in near-real time.
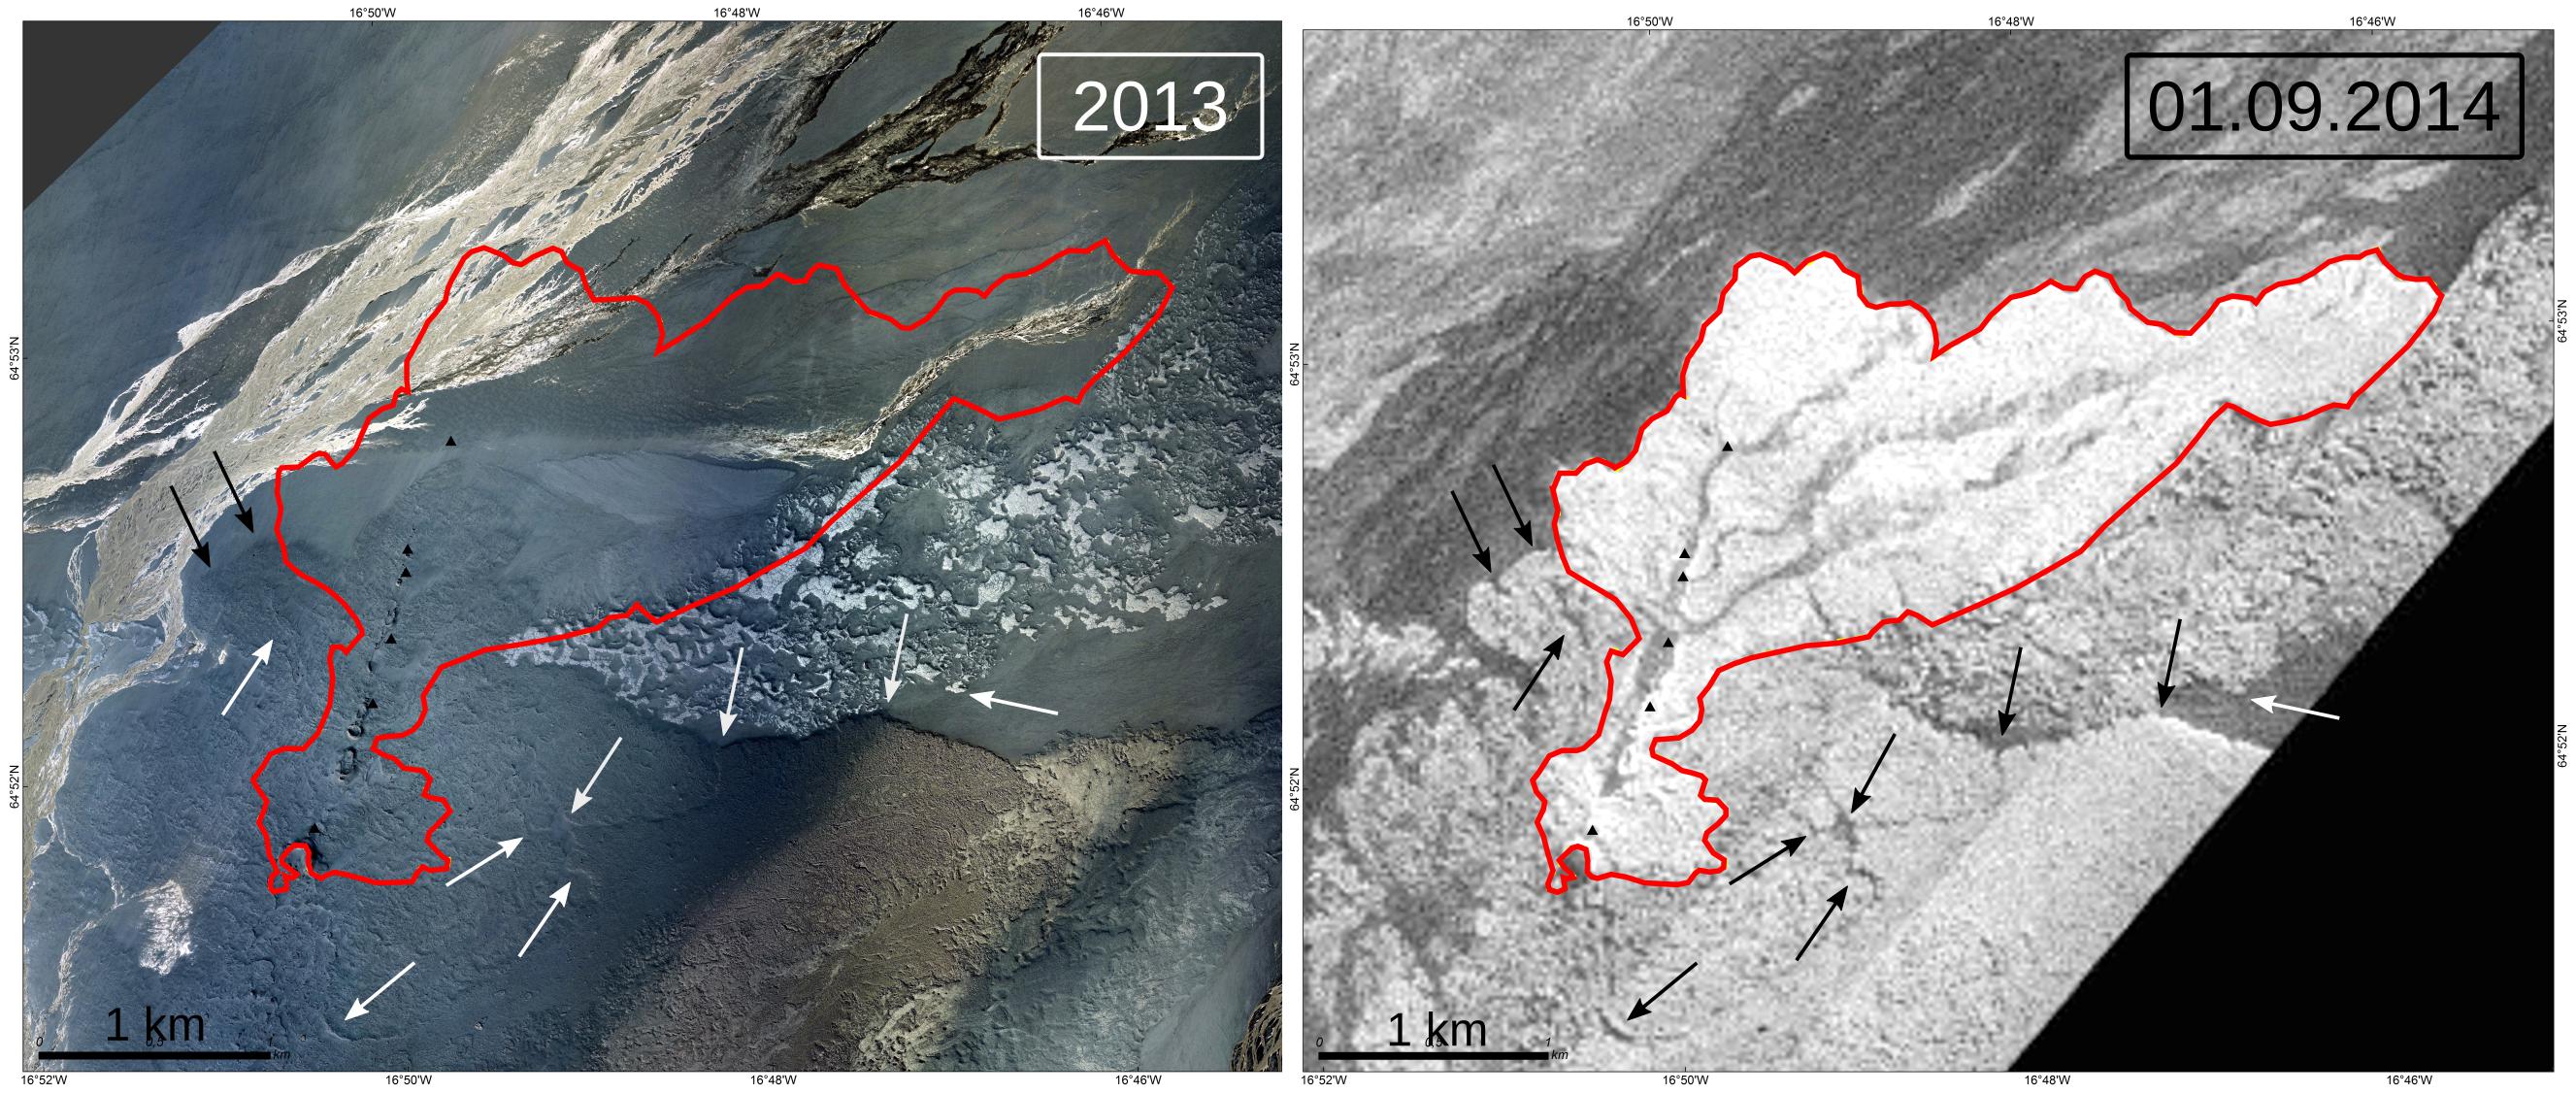
Figure 7. Example of image georeferencing for mapping the lava field. (Left) The high resolution optical aerial image acquired in 2013 by Loftmyndir Inc., show the floodplain and the eroded Holuhraun I lava, formed in 1797 CE (Hartley and Thordarson, 2013), where the 2014–2015 eruption took place. (Right) SAR aerial amplitude image acquired by the Icelandic Coast Guards on September 1, 2014. The red line shows the lava outline on September 1, 2014, the black triangles show the cones formed during 2014–2015 Holuhraun eruption. The arrows point toward common features in both images that helped for georeferencing the SAR amplitude image.
Thickness Estimates of the Lava Field
TanDEM-X Data
The generation of DEMs from bistatic SAR acquisitions was performed using the Integrated TanDEM-X Processor (ITP) that follows standard interferometric procedure complemented by an internal calibration step (Rossi et al., 2012). Once the interferogram is unwrapped, a noise reduction is applied using a median filter prior to the detection of unwrapping errors that are masked during the next calibration step. In parallel, a stereo-radargrammetric DEM is built using the geometrical transformation that links the offsets computed during the co-registration to the topography. The final stage of the ITP processing allows calibration of the unwrapped interferometric phase using a local factor corresponding to the absolute phase offset that is determined by the difference between the interferometric phase and the stereo-radargrammetric DEM (Rossi et al., 2012).
In a glacier environment like the Northwest Vatnajökull area, uncertainty estimate has to take into account the SAR wave penetration into the ice-cap in addition to errors due to system parameters. Rossi et al. (2016) have performed such uncertainties analysis using airborne radar altimeter measurements, showing a maximal height error of 3 m, for a mean value inferior to 1.5 m. In the late fall 2014, the TanDEM-X raw DEM calculated between images acquired on November 11, 2011 and September 9, 2014 revealed the graben formed inland and below Vatnajökull glacier as well as two cauldrons formed along the path of the 50km-long dyke toward Holuhraun eruption site (Figure 8).
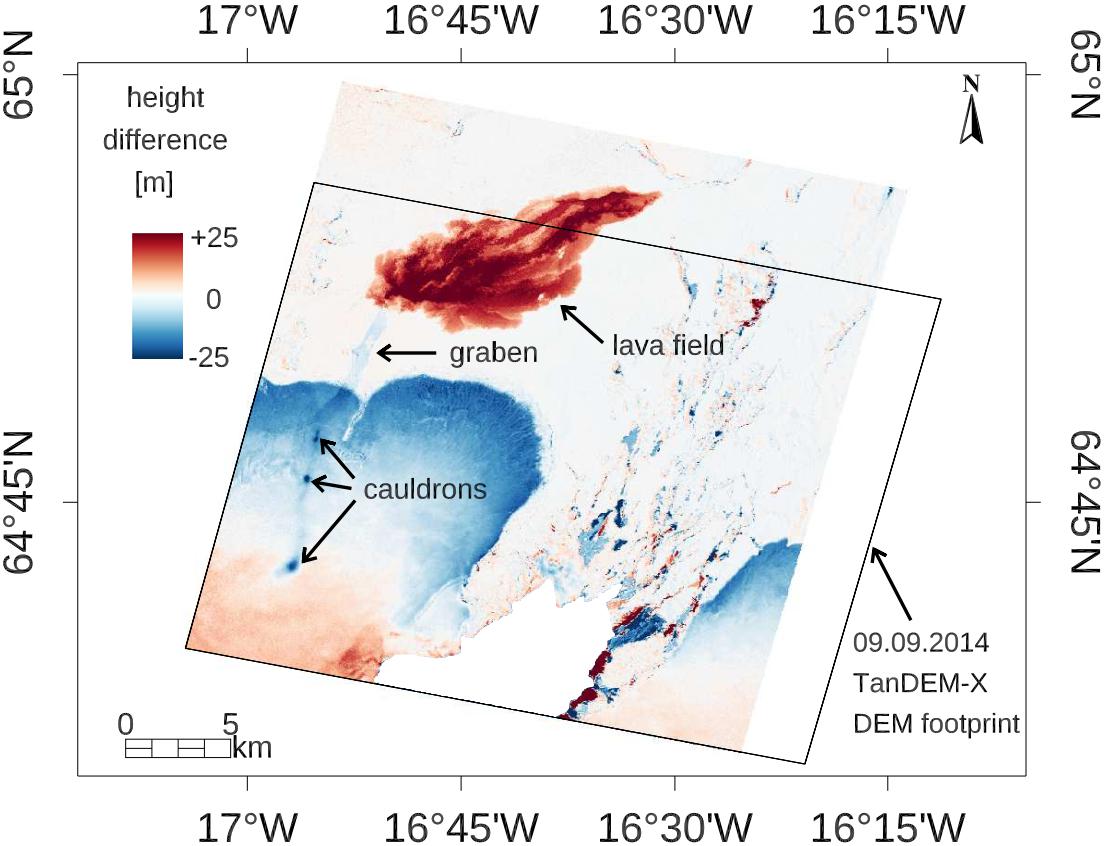
Figure 8. Topographical changes North Vatnajökull and Holuhraun area during the unrest and eruption. TanDEM-X DEMs generated using bistatic acquisitions prior, during and after the eruption allowed to detect height variations on the glacier, with the formation of new cauldrons, inland, with the newly formed lava field, and on both with the dyke-induced graben. The black rectangle shows the first TanDEM-X DEM that was made available to the Science group in the fall 2014 as presented in Rossi et al. (2012). Modified from Dirscherl and Rossi (2018) with permission of Elsevier.
Aerial SAR Data
One important and challenging task during monitoring was the regular assessment of thickness of the developing lava field, since this parameter is essential for computing the erupted volume and obtaining effusion rates.
By a newly developed technique, the extent of the lava was tracked parallel to the lava margin by two cars in a tandem configuration, equipped with video cameras and GPS loggers. By analyzing the resulting videos it was possible to obtain a geo-referenced marginal thickness profile of the lava front (Dürig et al., 2015). Heights of selected points in the inner parts of the lava were measured by periodical theodolite measurements and by applying photogrammetry using selected pictures taken on the ground. However, due to the large extent and the roughness of the lava field, the use of these ground-based approaches alone could not provide a sufficient constraint of the overall lava thickness. Therefore, in absence of field measurements or to complement them, aircraft monitoring techniques were applied. Due to considerable steam and gas emissions over the lava field the frequently unfavorable visibility conditions impede the generation of digital elevation models (DEMs) based on airborne photography (Müller et al., 2017). Hence, monitoring efforts focused on the analyses of airborne SAR maps. This method makes use of casted shadows from ridges, rims, peaks and other distinct objects in the terrain visible in the SAR maps, together with the fact that the lengths of these shadows depend on the height of the depicted objects (Figure 9, insets). As the positions of radar source and the targets on the ground are known, the heights of the targets can be reconstructed by measuring the lengths of the shadows. Importantly, this method gives only relative height values, which means that, to obtain the absolute lava thickness value at an observed edge of a lobe overlying an older part of the lava flow, the thickness of the underlying lava has to be considered.
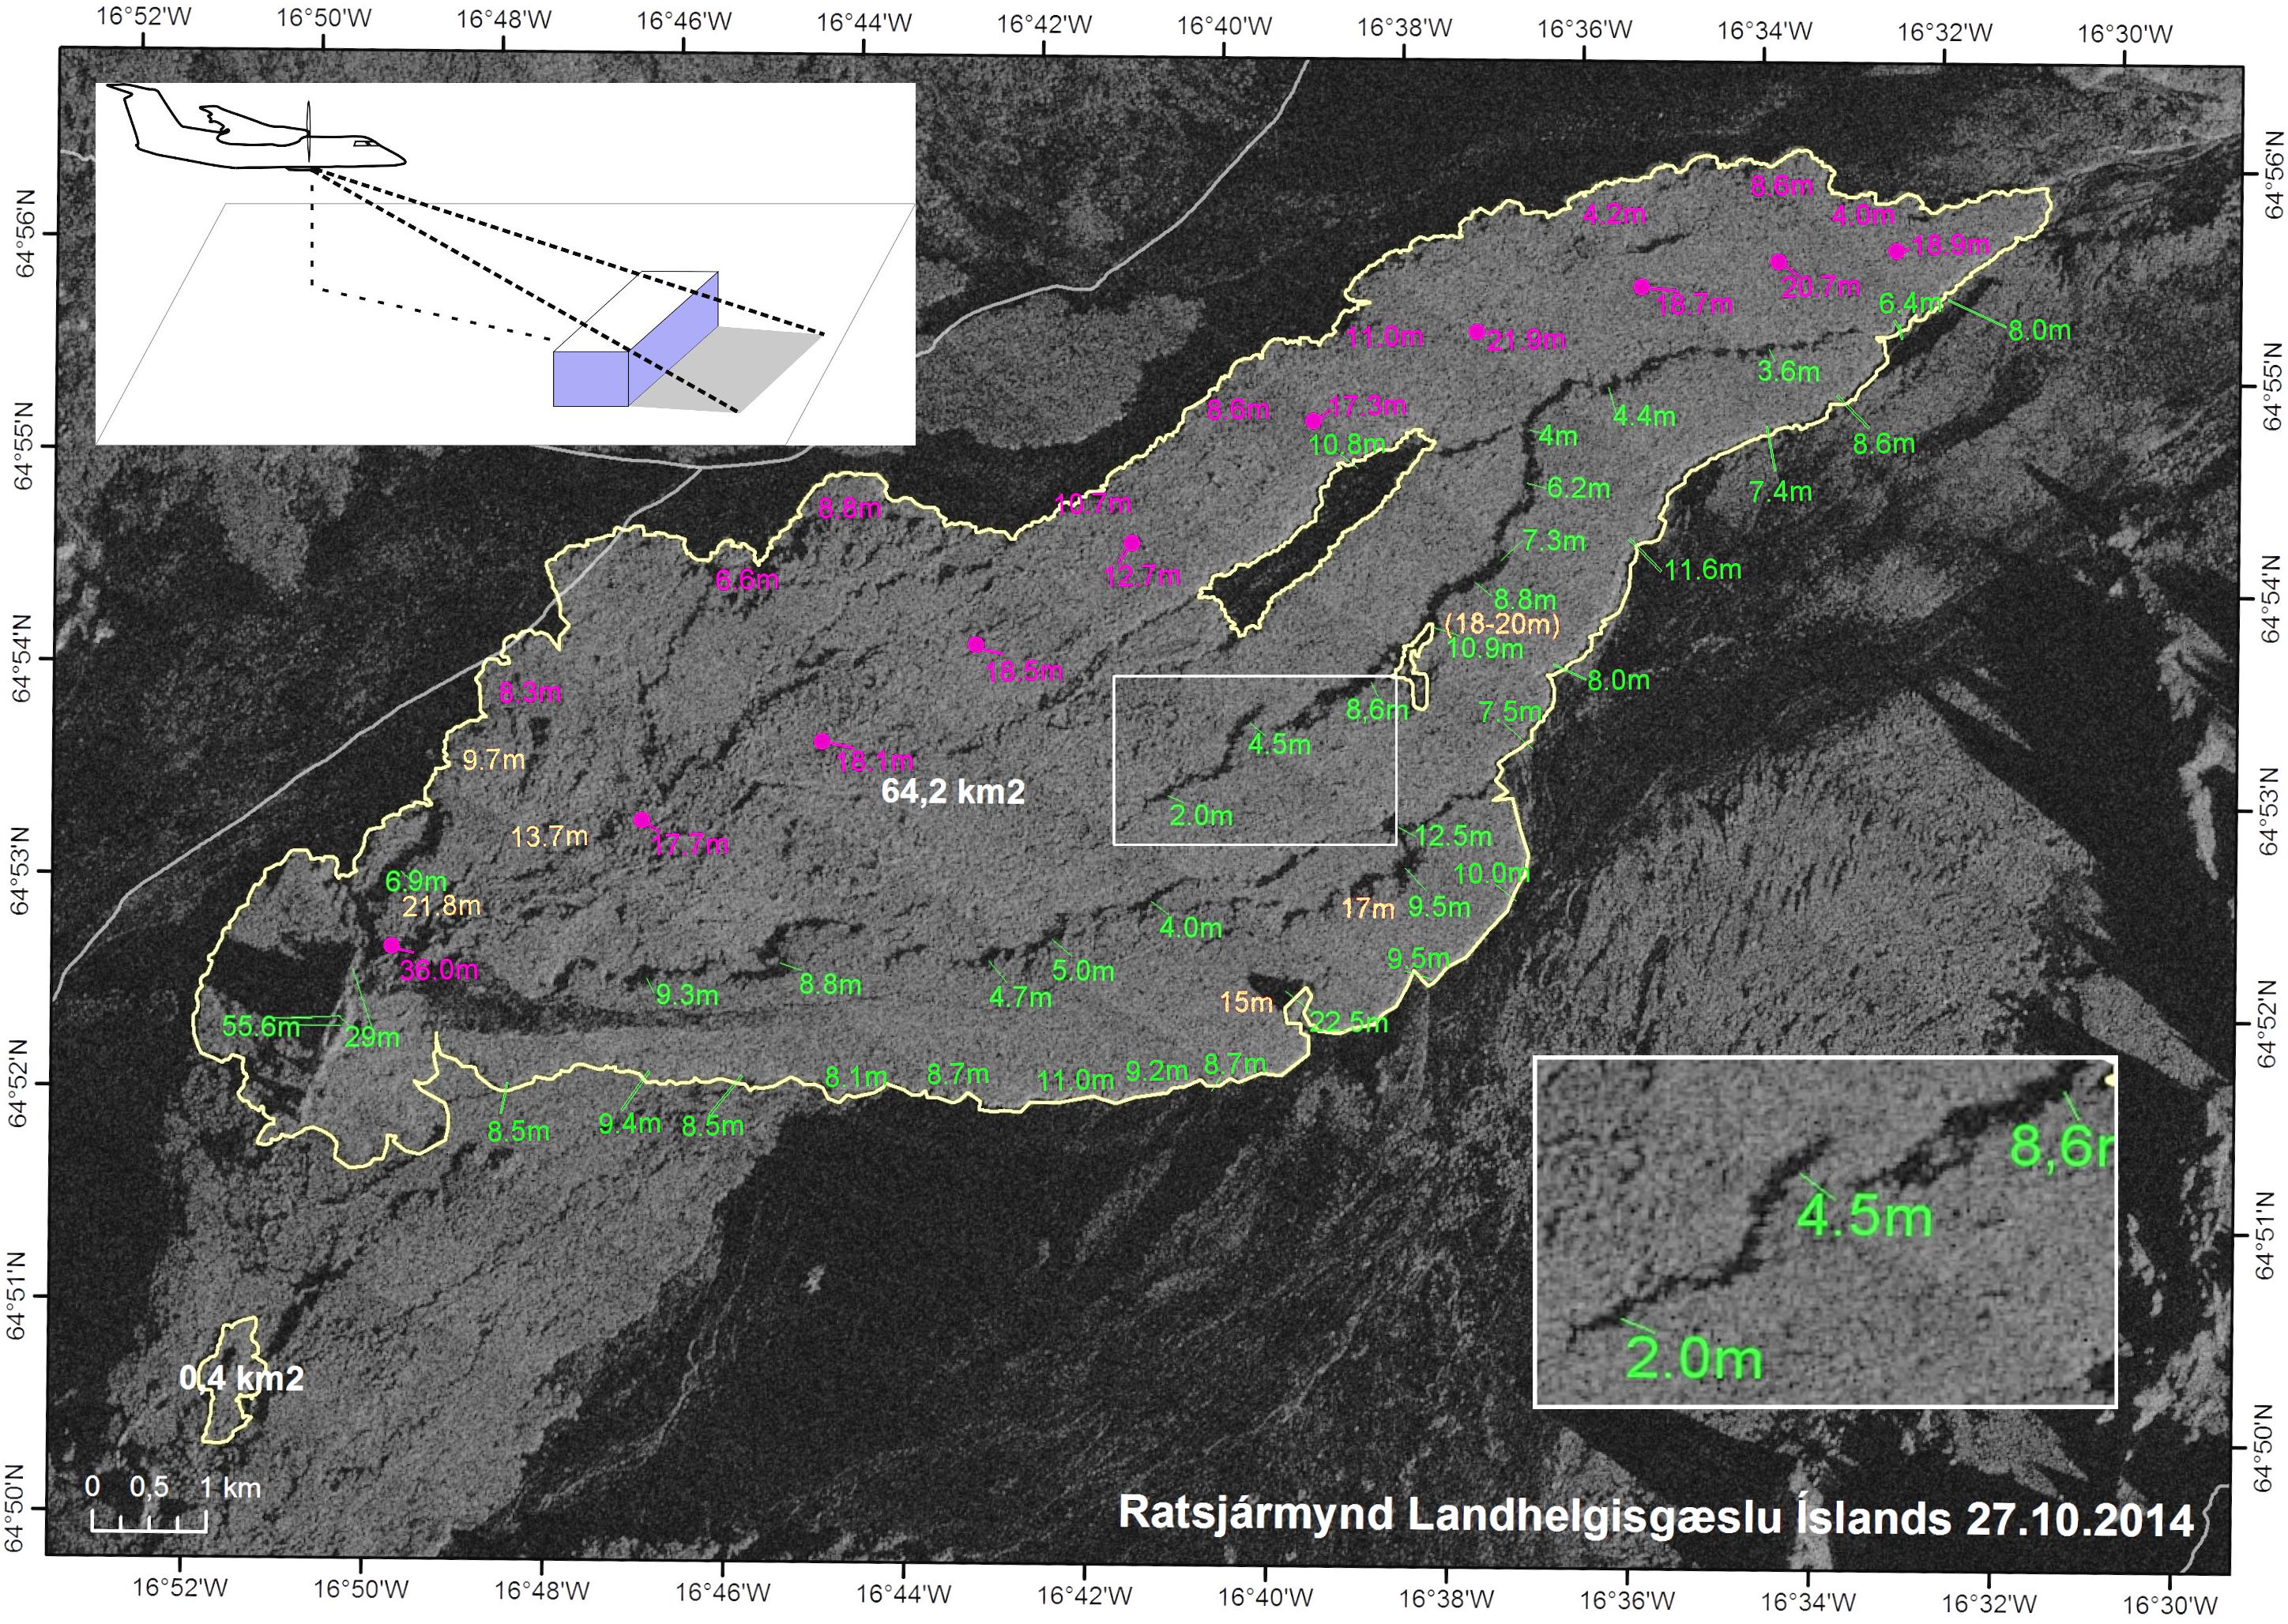
Figure 9. Map generated by airborne SAR comprising thickness values assessed by airborne SAR and ground-based methods. The green numbers give the heights of visible margins, measured by aerial SAR shadow analyses (schematically drawn in upper left corner). Inlet in the lower right corner shows a close-up on exemplary shadows seen as black areas. The SAR maps used were taken on flights at October 15, 27, and 28, 2014. These numbers are relative height values of overlapping lava flow fronts. In contrast, numbers colored in orange are absolute thickness values, obtained by comparing the SAR map of October 27 with a pre-eruptive DEM (East orange values), and by theodolite measurements conducted at October 23 (South–West orange values). Magenta colored numbers represent absolute thickness values obtained from theodolite measurements conducted on September 19 and 20. Since between these dates lava flow inflation might have occurred, all given values should be regarded as minimum estimates.
As a complementary aircraft monitoring method, starting from November 4, 2014, lava thickness profiles were obtained by low-level flights with an aircraft equipped with a radar altimeter. This method was the main source of lava thickness information in that phase of the eruption, since from November on, the coastguard aircraft equipped with SAR was not available anymore. Hence it was mandatory to merge and integrate the estimates of all applied thickness estimation methods. In Figure 9 an example of a map generated by airborne SAR together with thickness values assessed by the aforementioned method is shown.
Results: Information Delivered to Civil Protection and Local Authorities During the Eruption
The unrest at Bárðarbunga from 16 to 29 August 2014 was particularly challenging to evaluate by SAR images because of the direction changes taken by the 50-km long dyke, its propagation underneath the glacier as well as its rapid propagation, up to 2–3 km per hour, during 14 days (Sigmundsson et al., 2015). This is illustrated by the TerraSAR-X data that were acquired along various configurations during the unrest period but not maintained in the following months (Figures 3, 10). With only few hours from time of acquisition to time of delivery, CSK data offered the possibility for the first time to map surface displacements in near-real time using interferometric analysis. Thereby providing information of prime importance (location, magnitude and spatial distribution) to the monitoring group and local authorities. We used both wrapped and unwrapped interferograms to present and discuss analysis of surface deformation at both Bárðarbunga and Holuhraun. This allowed us to introduce the relative measure of deformation through the line-of-sight (LOS) changes to other scientists and authorities taking part of the Science Advisory Board. By keeping the same mode of representation, it was possible to quantify and track the first-order evolution of the surface deformation with time, which could be compared with other data sets such surface displacements measured by GPS stations, seismic activity or gas release.
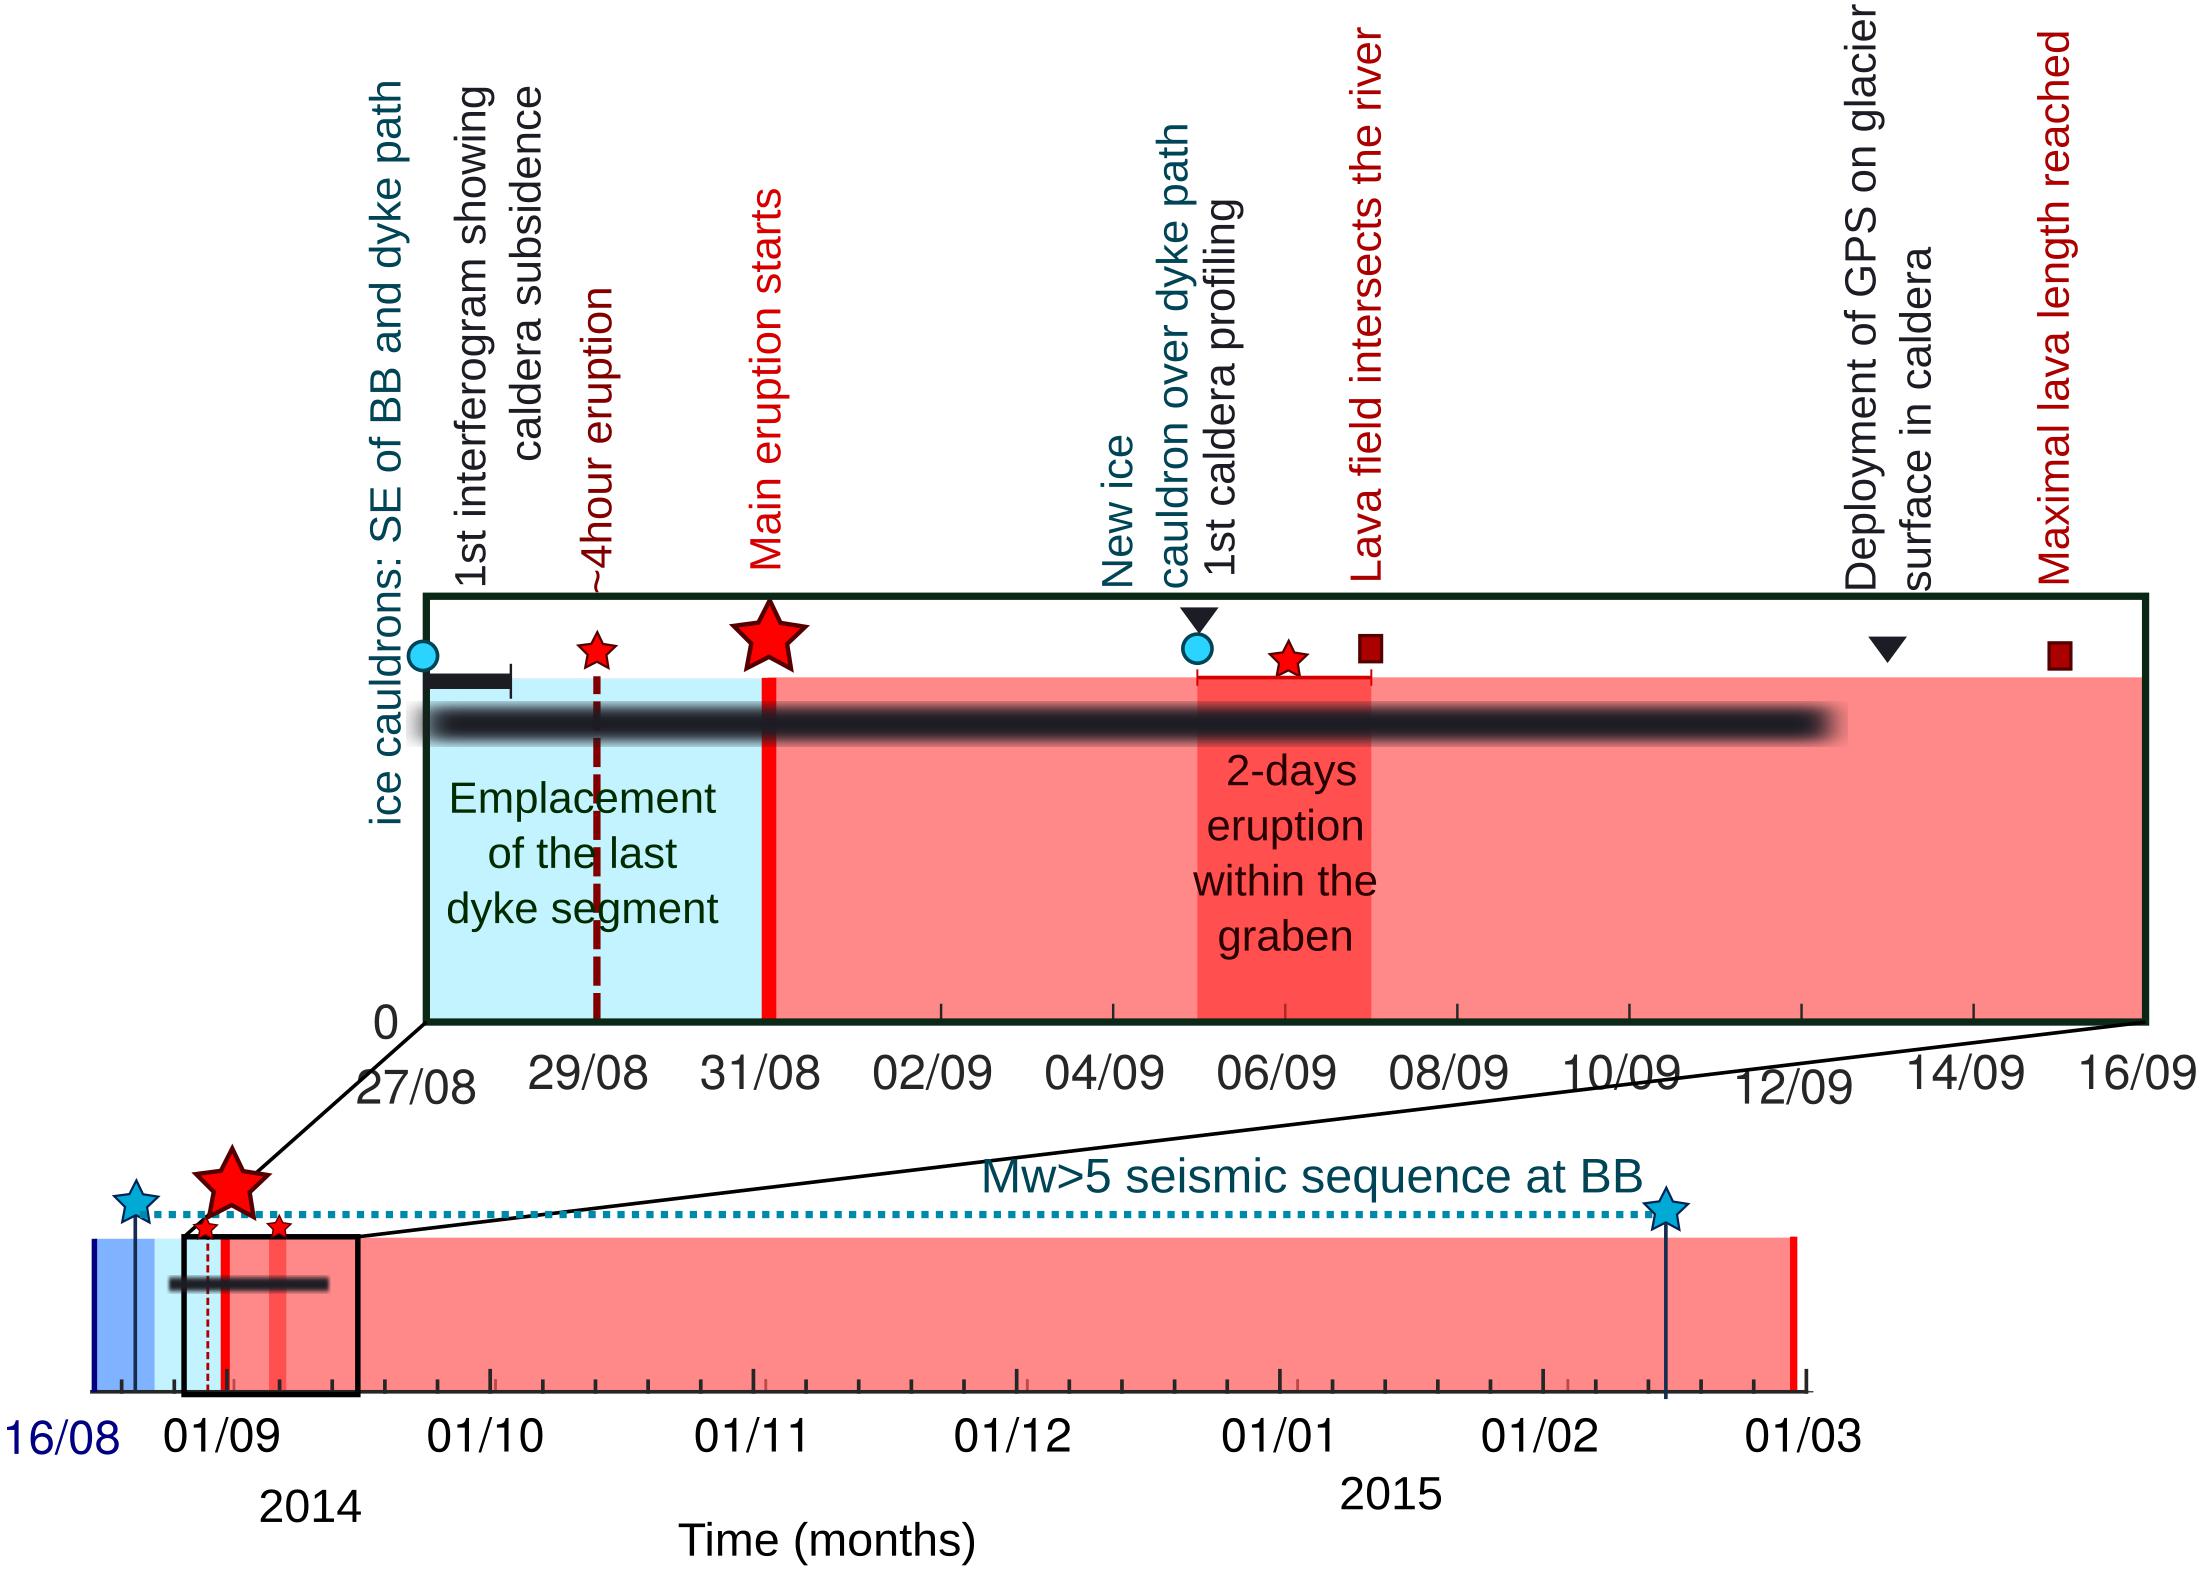
Figure 10. Timeline of the main events during the unrest at Bárðarbunga and Holuhraun eruption. The seismic unrest is depicted by the blue areas with the lighter area showing the propagation of the last dyke segment including both beneath and north of Vatnajökull glacier. The red area shows the main effusive eruption. The red dashed line and smaller red area with related red stars show the two other eruptions that occurred during this eruptive period. The inset emphasizes events between late August and mid-September with the detection of ice-cauldrons (blue circles), and other eruption related events with red symbols. The dates indicated for the ice-cauldrons relate only their time of discovery, not formation (Reynolds et al., 2017). The black symbols (small horizontal bar and inverted triangles) indicate key dates for instrument deployment/data acquisition that provided valuable information for the volcano monitoring and the understanding of physical processes. The black horizontal and thick bar represents the period when first results of the feeder dyke modeling were obtained. BB stands for Bárðarbunga.
On August 20, the first two Mw > 4.5 earthquakes occurred along the bordering faults of the Bárðarbunga caldera (Figure 10; Gudmundsson et al., 2016). No interferogram could be formed at that time and new continuous GPS stations between Bárðarbunga and Holuhraun were in a deployment phase (Figure 3). The possibility to form 1-day interferograms using CSK images over the ice-capped caldera with good coherence was discovered late August-early September (Riel et al., 2015). The first interferogram spanning August 27–28 over the ice-capped volcano revealed an elongated bowl, smaller than the caldera itself, showing a high rate subsidence exceeding 30 cm a day at Bárðarbunga caldera (Riel et al., 2015), with a deformation pattern similar to those presented in Figures 4c, 5d. With no complementary data to corroborate the caldera behavior, this deformation of the caldera ice-cap was not fully understood at that time. Moreover, a closer monitoring over Holuhraun area was ongoing as the seismicity kept propagating toward Askja volcano (Sigmundsson et al., 2015; Ágústsdóttir et al., 2016; Gudmundsson et al., 2016). The focus on Holuhraun area was reinforced late August with the 4-h eruption on August 29 and the onset of the main eruption on August 31 while the daily sequence of Mw > 5 was ongoing since August 21 at the Bárðarbunga caldera (Figure 10; Gudmundsson et al., 2016) in line with its subsidence.
With the onset of the main eruption, regular CSK and TSX acquisitions were acquired at both sites, e.g., Bárðarbunga and Holuhraun, using different geometries (Figures 2, 3). This way, in the first week of September, interferograms were formed over Holuhraun area to characterize the magmatic processes leading to the eruption. A metric scale surface deformation and the formation of a 5 m-graben were detected in the region confirming the emplacement of a feeder dyke (Figures 4a,b, 8; Sigmundsson et al., 2015; Hjartardóttir et al., 2016; Rossi et al., 2016; Ruch et al., 2016; Müller et al., 2017). The first radar altimeter profiling flight over Bárðarbunga was carried out on September 5 with the aim to detect any changes (Figure 10), like elevation changes for instance, at that time or later that could be related to the withdrawal of the underlying magma chamber. The profiles surprisingly revealed a 16–17 m subsidence bowl. These results were first discussed within the science group and presented at the Science Advisory Board meeting the next day as a base to evaluate the possible hazards related to these observations. Additional deformation maps showed subsidence to the north–west of Bárðarbunga, outside of the caldera ice-cap, confirming the withdrawal of the magma from a body located below Bárðarbunga and feeding the Holuhraun eruption (Figure 4a). These observations were confirmed by repeated radar altimeter flights over the caldera early September and were determinant for the installation of a continuous GPS coupled with a seismic station at the caldera center on the September 13 (Figures 3, 10; Gudmundsson et al., 2016). The dike-induced deformation at Holuhraun decreased rapidly in a few weeks after the onset of the eruption (Dumont et al., 2017). While most areas were surveyed using different geophysical techniques, it appears that InSAR data was the only technique allowing to regularly monitor the movement of the graben, even of small amplitude, over time (Figure 4d). The results were only shared with qualitative interpretation as a precautionary measure since the 5 m graben was not integrated into the pre-eruption DEM which could result in misinterpretation of the interferometric phase changes. Later in the fall, the newly formed graben was characterized using TanDEM-X data (Figure 8), which was merged with the pre-eruption DEM in order to remove any error in the interferometric processing.
Despite a large access to SAR data, the acquisitions remained too few to constrain a daily modeling and contribute more to the volcanic hazard assessment. Later in the fall, such modeling was performed using simple deformation sources and using continuous GPS stations deployed in the region between Bárðarbunga volcano and Holuhraun eruption site (Figure 5c). However, individual unwrapped interferograms were used in combination with GPS measurements and seismic data to model the propagating dyke (Figures 5a,b, Sigmundsson et al., 2015). This modeling was performed late August and during the first weeks after the onset of the main eruption providing better constraints on the source of deformation during the whole unrest period. The integrated model helped to estimate the volume of magma involved in the rifting event and more generally to perceive the connection between the maintained activity at Bárðarbunga volcano and the long-lasting effusive eruption at Holuhraun.
With few hours of daylight during winter-time in Iceland, data acquisitions are particularly challenging for ground-based measurements (Gauthier et al., 2016; Pfeffer et al., 2018) but also for survey flights (Figure 3). Snow and freezing conditions prevented the tracking of ground deformation using interferometric procedure. Surprisingly, interferometric analyses were possible up to early December when sustained snow fall started and prevented correlation between SAR acquisitions except for a few 1-day interferograms, where coherence was relatively well preserved within a 24 h interval. These SAR satellite data depicted precisely the extensive area affected by the rifting event and caldera collapse allowing surveys of the behavior of the neighboring volcanic systems, i.e., Askja and Tungnafellsjökull volcanoes before field instruments were (decided to be) deployed (Parks et al., 2017). In addition, SAR amplitude images allowed regular qualitative observations of both Bárðarbunga and Holuhraun sites. Deepening or smoothing of cauldron dimensions could reveal sustained or aborted heat transfer toward the surface providing some clues to the underlying processes and possible changes in eruptive dynamics. As an example, numerical modeling of the heat fluxes measured at the cauldrons located along the dyke path were interpreted in terms of a small subglacial eruptions (Reynolds et al., 2017). Detecting changes at the ice cauldrons was crucial and was performed visually both during the eruption but also in the months/years following the end of the eruption using TSX SAR amplitude images (Figure 11). These observations were completed by repeated radar altimeter profiling that were repeatedly carried out after September 5, providing quantitative measurements on these ice-cauldrons (Figure 10; Reynolds et al., 2017). This way, the geothermal activity along the ring faults bordering Bárðarbunga caldera was closely surveyed as well as the development of the lava field.
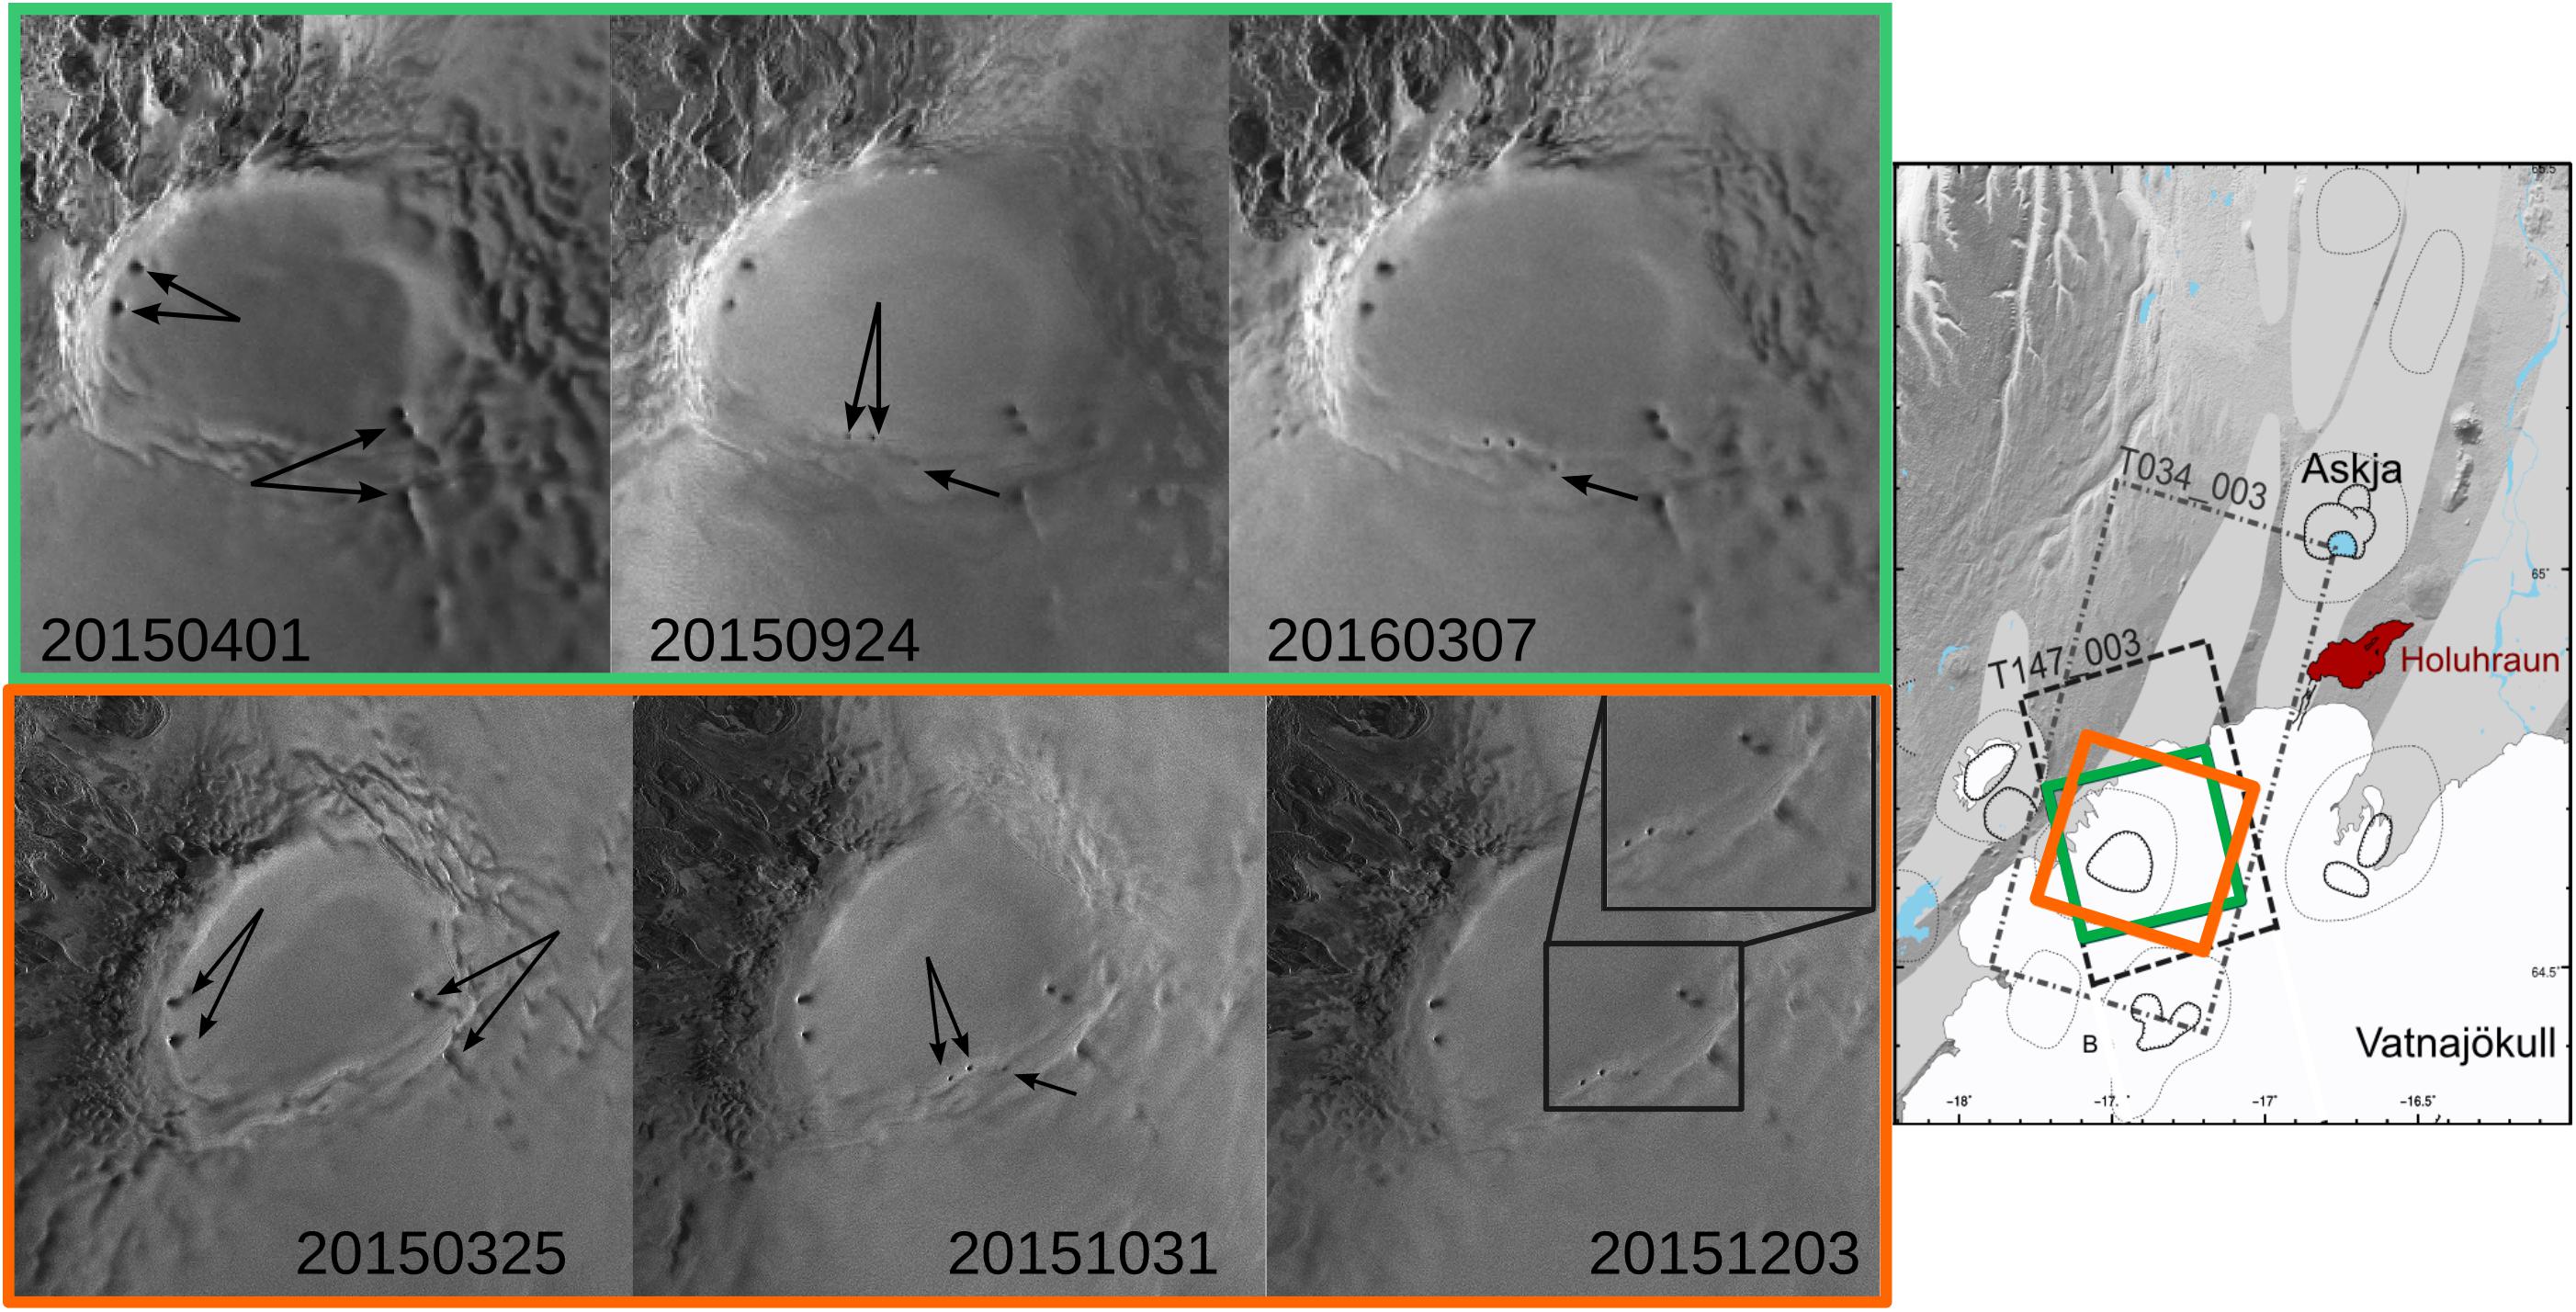
Figure 11. Tracking surface changes at the Bárðarbunga ice-capped caldera using SAR amplitude images. Ascending (track 147, beam 03, upper panel, green color) and descending (track 34 beam 03, bottom panel, orange color) TSX scenes were used for monitoring the evolution of ice cauldrons located along the ring faults bordering Bárðarbunga caldera during the 2014–2015 winter and in the year following the end of the Holuhraun eruption. In the first column, arrows indicate all ice cauldron identified, in the next images arrows point out significant surface changes.
With the onset of a long-lasting eruption, lava volume was a key parameter to characterize during the evolution of the lava field. However, measuring the volume of Holuhraun lava field was particularly challenging. The lava flows progressed rapidly on a sand plain located between Vatnajökull glacier and Askja volcano bordered to the east by a glacial river, Jökulsá á Fjöllum. On September 7, the lava flowed into the Jökulsá á Fjöllum making it impossible to obtain field observations in the area south of the lava as it was too hazardous (Pedersen et al., 2017). The maximal distance of the lava flows from the eruptive fissure was, 17 km, which was reached on September 15 (Figures 6a, 10; Pedersen et al., 2017). Flights with radar altimeter measurements were crucial for estimating the lava flow field area, a first step for evaluating the volume of the lava field, especially in the first days of the eruption, despite limited over the whole eruptive period (Figure 3). The lava field area was thus estimated using SAR amplitude images and other satellite images to update the lava-covered area (Figure 6). As the TanDEM-X SAR data were sparse and initially not aimed for monitoring purposes, the derived differential TanDEM-X DEMs could not be used for evaluating the evolution of the lava field volume during the eruption. Lava-field thickness measurements were therefore necessary and were either performed from the field or using aerial SAR images (Figure 9). However, these measurements could not be performed over the whole lava field. The range of observed thickness values were considered and combined with the lava field area in order to estimate the first order volume of magma emitted. Hence, first estimates of the effusion rate were presented at meeting with local authorities depicting progressively its evolution during the eruption, confirming other observations like the subsidence of Bárðarbunga caldera.
Following the end of the effusive eruption, more attention could be devoted to the analysis of 1-day interferograms as they provided unique constraints on the glacier subsidence confined within Bárðarbunga caldera and caused by the continuous magma outflow from the magma reservoir. A few of them captured Mw5+ earthquakes induced by the caldera collapse allowing an in-depth modeling of the ring fault system (Figures 5d,e; Gudmundsson et al., 2016; Bagnardi and Hooper, 2018). An example of such modeling performed for the September 18 Mw5+ earthquake, suggests a slip along a ∼13 km long semi-elliptical fault system extending from the SW caldera rim to the NE with a minimum depth of ∼950 m beneath the surface. The survey of the ice-capped caldera using SAR sensors on board of the UAVSAR aircraft from Jet Propulsion Laboratory (United States) allowed the detection of the formation of a new cauldron on the southern caldera border late May 2015. This monitoring was maintained thanks to both SAR satellite and air-based data (Figure 11). The formation of a new cauldron contributed to explain the high SO2 values measured early May in the caldera. This observation came few months before a new phase of increased seismic activity began in September 2015, confirming as for the past rifting episodes experienced in Iceland, how important it was to continue to monitor the central volcano in particular in the time period after a major events to evaluate if more activity should be anticipated (e.g., Heimisson et al., 2015).
Discussion
The Contribution of FutureVolc and the Icelandic Volcanoes Supersite Projects to Volcano Monitoring
The unrest at Bárðarbunga and the Holuhraun eruption was the first volcanic crisis in Iceland where extensive SAR satellite data was used in near-real time during the crisis response. The wealth of SAR data made available through the Icelandic Volcanoes Supersite was crucial for rapid analysis and improved understanding of this major rifting event and caldera collapse. It was very fortuitous that “Icelandic Volcanoes” were selected as a permanent GEO-GSNL Supersite in December 2013. This allowed image ordering and processing procedures to be worked out a few months before the awakening of Bárðarbunga, including finding solution to various issues relating to data format. Ordering/downloading procedures followed the procedures required by each space agency. This required either repeated ordering requests for each acquisition of each satellite cycle (in the case of DLR), or the definition of satellite tasking for a given area with a given acquisition frequency (in the case of ASI). The latter approach does not require the same amount of work. In general, the Supersite status contributed to increase the amount of acquired SAR images. However, with public-private partnership satellites, the acquisition of ordered scenes is not guaranteed due to different priorities despite the upstream work. Without the early Supersite award, the first CSK SAR data would not have been acquired in July 2014, 1 month prior to the unrest and eruption which was critical to detect the surface changes and characterize at best the underlying physical processes. With the ordering capacity for two SAR satellites, it became possible to develop a flexible acquisition strategy that guaranteed data acquisition during an evolving situation like the 16 days of unrest beneath the Vatnajökull ice cap. The propagation of a 50 km long dyke was particularly challenging to capture (Figure 3). The SAR imaging strategy had to consider the long-lasting eruption. It was necessary to respect image quota as the GEO-GSNL Supersite structure does not primarily aim at crisis response. We acquired CSK scenes at variable but high rates such the yearly quota attributed by ASI for the future acquisitions over the whole country were consumed rapidly. Frequency of CSK SAR acquisitions had then to be reduced. Thanks to the Supersite framework, the surface deformation was captured from different satellite configurations, different time spans and covering different sectors of the ∼250 km2 affected by the rifting event. The different SAR data represented a clear advantage to reconstruct the deformation field and track its space-time evolution for an important benefit of the crisis response; not easy to obtain without the support of such project. Such a large set of open-access SAR data for an event of this dimension rapidly brought the attention of the international scientific community. The first priority of FutureVolc was to support the volcano monitoring during the unrest and the 6-month eruption, but the international community already started to publish analyses of the ongoing eruption. This added extra pressure on local scientists. This competitive but challenging context promoted internal collaborations for delivering high quality science, as illustrated by the diversity of the numerous studies published by FutureVolc partners (e.g., Sigmundsson et al., 2015; Ágústsdóttir et al., 2016; Gauthier et al., 2016; Gudmundsson et al., 2016; Thun et al., 2016; Eibl et al., 2017; Müller et al., 2017; Parks et al., 2017; Pedersen et al., 2017; Dirscherl and Rossi, 2018; Dürig et al., 2018).
Without the Icelandic Volcanoes Supersite in place, there would have been a need to buy SAR images at a rate of several hundred euros per image. Due to limited research budgets this is often not a viable option. In addition, the purchased images could not have been made available in near-real time. Thus, the analysis of interferograms would not have been incorporated into the data/results discussed at civil protection meetings. This would have reduced the capacity to monitor the ongoing caldera collapse and increase the uncertainties when assessing the potential hazards over the 250 km2 wide area, and resulted in an incomplete overview of the deformation field related to the dyke emplacement and caldera collapse.
The unrest at Bárðarbunga and eruption at Holuhraun occurred in the middle of the FutureVolc project period. Because of FutureVolc, the team dedicated to the analysis of SAR satellite data was reinforced in both Iceland and the United Kingdom, forming a group capable of both InSAR processing and deformation modeling. To face the large number of SAR images and the specific ordering procedures of the Italian (ASI) and German (DLR) space, the CSK and TSX acquisition plans were handled by separate individuals, facilitating exchange with each space agency. This team enabled rapid generation of interferograms, near-real time modeling and cross-validation of results. If the FutureVolc consortium had not been in place then some of this analysis would have eventually been outsourced to existing collaborators abroad. This may be more feasible during a short-lived eruption but likely problematic for a 6-month lasting eruption. The combination of the Icelandic Volcanoes Supersite and the FutureVolc projects thus provided optimal conditions for input to the crisis response, securing both plentiful data base of SAR images and the workforce to interpret the images. The projects allow to communicate the interpretation of deformation data and modeling results, along with uncertainties, at Science Advisory Board meetings held throughout the event. This would be very difficult if the work was not being undertaken “in-house.” Ineffective communication may result in concerns regarding the reliability of data presented and confidence in results affecting both preparedness and decision making.
In general, the FutureVolc project reinforced cooperation at a national level, between University of Iceland, the Icelandic Met Office and the Icelandic Civil Protection. Close interaction facilitated in particular observations during winter time data and assessment of the volcanic hazards. With the diversity in expertise among its pool of participants and all the instrumental support it provided, FutureVolc project allowed the Icelandic Met Office to respond in a noticeable short time to hazards such as the large sulfur degassing during the eruption (Gíslason et al., 2015; Gauthier et al., 2016; Pfeffer et al., 2018). The pre-eruptive and eruptive events required coordination and communication between scientists and observatory operators that were tested during the FutureVolc project for the first time 2 months before the unrest start (Witham et al., 2017). All this experience appears also to be very relevant for the monitoring team. In addition, the monitoring of the gas plume at Holuhraun allowed to prepare the quantification in real-time of key parameters for future explosive eruptions in Iceland (Dürig et al., 2018).
The Use of SAR Data for Volcano Monitoring
Prior to 2014, it was difficult to integrate SAR satellite data into monitoring procedures for volcanic eruptions because of the cost per scene, the data ordering, the revisit- and delivery time. This made the data acquisition process unreliable therefore not able to support crisis management sufficiently. Time-consuming interferometric analysis requiring know-how was also an issue. However, the situation has changed. Open data policy set up progressively in Sciences and Technologies has contributed to make SAR data more accessible through initiatives such as Supersites within the GEO-GSNL initiative and importantly now via the fully open data policy of the European Space Agency for the Sentinel satellites.
Despite variable data ordering and delivering structures of space agencies, significant effort was made to ensure data acquisition during Holuhraun eruption and the 1-year post-eruption period in order to maintain the monitoring survey of the entire region. The acquisition of regular SAR satellite images with at least two complementary geometries, from ascending and descending satellite orbits, is important in case of an erupting volcano. The complementary geometries are crucial to decipher how important the horizontal component of the surface displacement is, providing better constrains when modeling the source of deformation (Wright et al., 2004). Maintaining similar observing conditions (e.g., fixed view from space) offers the best prerequisites to promptly detect and monitor changes over time in an hazardous situation, but might be challenging to ensure.
Facing the exponential increase of SAR data, technical efforts have been made focusing on online platform as for instance SNAP, the ESA online toolbox for processing Sentinel-1 SAR data (Foumelis et al., 2018) or new approaches aiming at making timeseries analysis more efficient and flexible (Agram et al., 2013). The open-access C-band Sentinel-1 data that cover most of the world with a short delivery time, have fostered a large interest in the volcanological and InSAR communities for developing strategies of global volcano monitoring. Technical development has focused on near-real time processing and the detection of any deformation pattern related to volcanic activity (e.g., Anantrasirichai et al., 2018; Gaddes et al., 2018). During the volcanic crisis in central Iceland, we experienced that obtaining a rapid map of surface displacement which can be discussed with local authorities is essential. However, in interferometric analysis, the co-registration and phase unwrapping are the steps that are the most susceptible to fail and also time-consuming. Tuning an interferometric analysis to ensure interferogram calculation may take some time, risking to delay the result delivery. Our experience revealed that GMTSAR software appeared well adapted to rapidly produce wrapped interferogram (Sandwell et al., 2011a,b). In a similar way, the RapidSAR algorithm was recently developed and tested during the eruption in Iceland with the aim to ensure timely, high-quality coherence estimation (Spaans and Hooper, 2016). This approach differs from the conventional boxcar coherence estimate often used when rapid results are required, by using only pixels with similar scattering properties in the estimation ensemble.
Beyond these technical aspects, interferometric analysis was first focused on the seismicity that defined the dyke path and nearby the glacier outlets to detect any surface changes related to the magma body below Bárðarbunga caldera. With 1-day CSK interferograms, new opportunities arose to map transients spanning shorter time scale, providing snapshots of the deformation over 24-h time intervals. Analyses of the 1-day interferograms were primarily used to track and quantify the slow collapse of Bárðarbunga caldera to better decipher the connection between the ring faults and the underlying magma body (Figures 5d,e, Gudmundsson et al., 2016; Bagnardi and Hooper, 2018). However, this data could also have been used to quantify the deformation within the subsidence bowl in the ice, distributed along the ring faults during the unrest and during the eruption itself. A few 1-day interferograms were processed over the Holuhraun area. High rate deformation was thus captured within the lava field while it was mostly coherent-less for larger time span interferograms due to continued flows and volume changes related to lava emplacement (Figure 4d). Actually, the LOS changes that occur in 1 day interval revealed the main lava channels that fed the extensive flows (decorrelating areas, Figure 4d), the sectors where lava was slowly drifting or accumulating (areas with fringes, Figure 4d) and those that are not fed by new lava anymore. Despite being very few, these observations could have been better used by being integrated to morphological analyses focused on the lava field development. A detailed SAR-based analysis of lava flow emplacement was performed after the eruption by Pedersen et al. (2017), using a combination of amplitude images of high spatial resolution aerial SAR (1–3 m/pixel) and high temporal resolution satellite SAR (Figure 12). During the Holuhraun 2014–2015 eruption the analysis of morphological changes was limited by the absence of aerial SAR from mid-November to the end of the eruption (post-eruption images were taken April 24), inhibiting near-real time monitoring of the lava pathway dynamics. Pedersen et al. (2017) documented that certain lava surface morphologies had certain range of emplacement velocity, e.g., the slabby pāhoehoe had flow velocities of 800–1000 m/h, rubbly pāhoehoe and ‘a’ā, had flow velocities up to 65 m/h whereas spiny pāhoehoe had the lowest observed flow velocities of 1–4 m/h. It was therefore shown that monitoring the lava surface morphology may provide an opportunity to forecast lava emplacement velocities on short time scales. Using SAR amplitude images acquired with different polarizations such HV, VH or VV, other than HH classically used for InSAR analysis, would allow a better characterization of the backscattering properties of the target area (Haack et al., 2006) what could also benefit to InSAR analysis (Pritchard et al., 2018). This would notably help to map surface roughness and thereby lava surface morphology, as well morphological evolution with time. Integrating interferograms, especially those with 1-day interval and coherence maps, into morphological studies could be determinant for deciphering the dynamics of the lava emplacement. The rapid elevation changes related to the lava field formation may induce both decorrelation signal but also fringes as they are not included in the DEM used in the InSAR processing. The ability to create up-to-date DEM would significantly improve these analyses but most of current constellations of SAR satellite sensors can not provide suitable data for this.
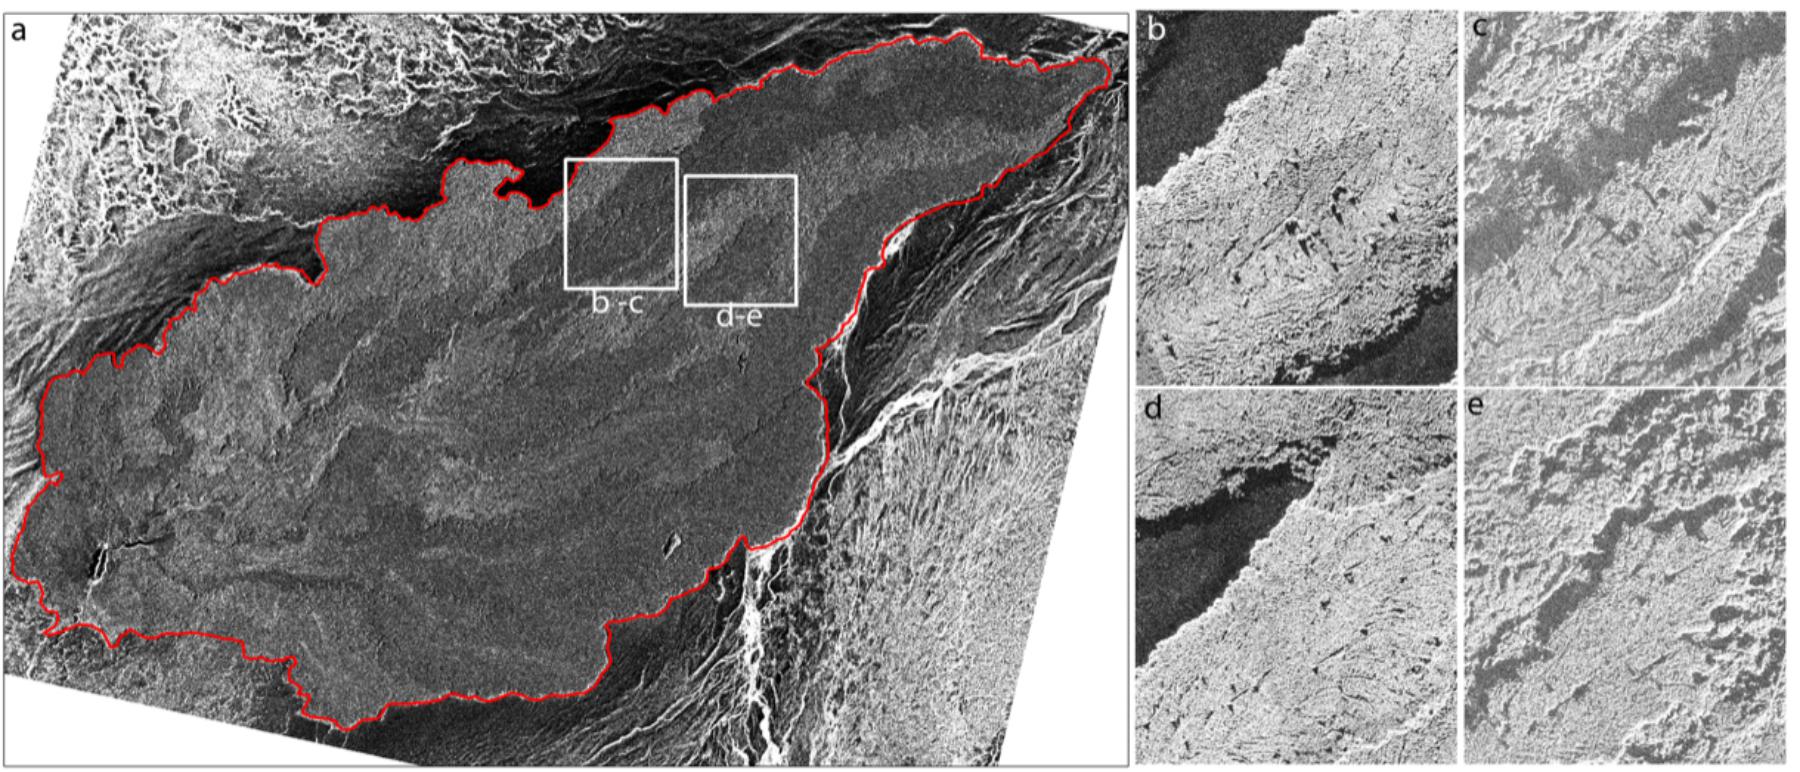
Figure 12. (a) TSX SAR amplitude image of the entire lava field from January 16, 2015. The red outline show the mapped boundaries of the lava field. Internal morphologies can be observed but details cannot be resolved. The gray boxes show zoom in on lava flow 1 and 2. (b) Aerial SAR image of a part of lava flow 1 on November 8, 2014 before tube formation. (c) Aerial SAR image of a part of lava flow 1 on April 24, 2015 after tube formed lifting up the central part of the lava channel. (d) Aerial SAR image of a part of lava flow 2 on November 8, 2014 before tube formation. (e) Aerial SAR image of a part of lava flow 2 on April 24, 2015 after tube formed lifting up the central part of the lava channel and resurfacing the surroundings. Tube inflation is typically revealed by shadows in the SAR amplitude image that appear along the tube edge located away from the SAR sensor illumination (c,e).
Our experience revealed other aspects of working in a crisis situation using a large set of data. Actually experts of InSAR processing (program based), geomorphological analysis (GIS based) are used to working with a certain type of data and softwares. Although these specialists communicated, each group used their usual processing tools and data access channels to provide new deformation maps or detection of surface changes as soon as possible. Time could have been gained by knowing, e.g., preferred data formats beforehand, in order to directly share data and results between different specialists, especially InSAR and GIS-based users. As an example, Single Looks Complex (SLC) made available for InSAR processing through different formats (h5 for CSK, xml for TSX) are in radar coordinates and therefore not directly usable by GIS experts. Converting them to geographical coordinates as well as sharing coherence maps, wrapped and unwrapped interferograms systematically would allow more rapid and detailed observations of volcano-tectonic events like fracturing.
Lessons Learnt From the Contribution of FutureVolc and Icelandic Volcanoes Supersite Projects
In 2014–2015, InSAR processing was not automatically carried out and relied on a group of persons with experience in using different SAR softwares. Having a group of people involved strongly helped to overcome processing difficulties encountered with one InSAR processor. This allowed the group to systematically provide timely observations of surface deformation, coupled with ground deformation models, to Sciences Advisory Board meetings. During the unrest and the eruption period, significant efforts were done by all scientists to present timeseries approaches (cGPS, volume change, seismicity..) at Science Advisory Boards meetings to discuss the evolution of the ongoing events and the related hazards. However, timeseries analysis based on SAR satellite data and a specific processing were not presented. Doris/StAMPS softwares are particularly efficient to map surface deformation and quantify their temporal and spatial evolution in volcanic environments where terrain conditions and frequent/rapid changes promote decorrelation in interferometric SAR analyses (Hooper et al., 2004; Pinel et al., 2014). At the time of the eruption, such timeseries analysis was time-consuming, especially for ingesting new data every few days what is not affordable during a volcanic crisis. However, with the current large effort made for developing new and innovative techniques for processing large set of SAR data (Anantrasirichai et al., 2018; Gaddes et al., 2018), it might be possible in a few years’ time to integrate InSAR timeseries analysis as a monitoring tool (Drouin and Sigmundsson, 2018).
Although the large access to remote-sensing data contributes significantly to hazard assessment, even more with near-real time delivery, this poses also some technical challenges. When infrastructures and informatic resources are limited, managing such data (e.g., to store and manipulate data) may be particularly challenging. This aspect should not be underestimated as it may significantly impact and reduce the response potential to events like a volcanic crisis.
Organization and communication are essential during a (volcano) crisis management. If dedicated staff is in place, the distribution of the main tasks related to InSAR processing (data ordering/downloading, processing, plotting and modeling) as well as the implementation of routines prior to the onset of an eruption may help to be better prepared and better respond to requests during a real crisis. Otherwise, this work could be achieved through international cooperation. The FutureVolc project demonstrated very well how an international collaboration can support local institutions and hazard assessment notably by performing data processing or in-depth analysis that on-site people cannot systematically afford because of the ongoing events and related workflow. Moreover, having a clear plan of who is in charge for which task will considerably reduce the stress of everyone involved. Such procedure may apply to any kind of data, including remote-sensing. An important aspect of organizing workflow is to consider communications. Presentation of focused results for evaluating volcanic risks is a key part of the decision-making process. Other scientists and civilians that take part of the decision-making should receive required information for understanding the interpretation of results from InSAR or remote-sensing data analysis, and the associated uncertainties.
Conclusion
Monitoring of the 2014–2015 unrest at Bárðarbunga volcano and the related 6 month effusive eruption was extensively assisted by the use of SAR satellite data. The access to SAR satellite data was facilitated through the Icelandic Volcanoes Supersite and FutureVolc projects, allowing ordering of new acquisitions with the TerraSAR-X and Cosmo-SkyMed satellites. Full advantage was taken of the different acquisition procedures and delivery time from the different space agencies, in order to ensure the short and long-term monitoring of the effusive eruption, slow caldera collapse, graben deformation and related changes. Interferometric analyses of CSK data were carried out within 12 h after their acquisition and was successfully performed up to early December 2014, but after that time snow prevented interferogram coherence. During but also after the eruption, analysis of SAR amplitude images provided key information to track the newly formed lava field and its geomorphological features, ground fractures, and ice-cauldrons. However, complementing the SAR satellite images with aerial SAR data was essential especially to extract further information, i.e., estimate the thickness of the lava field and hence the mass eruption rate. One-day interferograms offered the first and new opportunity to track high-rate surface changes on the ice-covered caldera. The SAR data was thus a very valuable data set whose full potential was exploited over the time of the eruption, e.g., how to better extract information how to combine with other data sets. Experience gained during the eruption demonstrated that SAR data is a key component for monitoring future volcanic eruptions, in particular in remote areas. The combination of the Icelandic Volcanoes Supersite and FutureVolc was essential for using at best SAR satellite data for providing near-real time satellite observations to monitor the evolving situation at Bárðarbunga volcano and Holuhraun eruption site thanks to human and technical resources provided by these projects.
Author Contributions
SD designed the manuscript and led the writing in coordination with FS, who led FutureVolc and the Icelandic Volcanoes Supersite projects. SD, MMP, VJPD, KS and MB worked on the InSAR analysis. GBMP, IJ, ÁRH, and ÁH analyzed the morphological changes using SAR satellite data. MTG, TH, EM, and TD analyzed the aerial SAR data. AH, MMP, and MB modeled surface deformation using SAR data and GPS measurements. CR processed TanDEM-X SAR data. SB and KJ led the volcano hazard assessment in closed collaboration with Icelandic Civil Protection represented by BO. All authors listed have made a direct and intellectual contribution to the work.
Funding
Support for this work was received from the European Community’s Seventh Framework Program Grant No. 308377 (Project FUTUREVOLC), the Research Fund at the University of Iceland and the Icelandic Government through the Civil Protection Department of the National Commissioner of the Icelandic Police. SD is currently supported by the FCT postdoctoral grant (SFRH/BPD/17714/2016), as part of POCH and the European Union.
Conflict of Interest Statement
The authors declare that the research was conducted in the absence of any commercial or financial relationships that could be construed as a potential conflict of interest.
Acknowledgments
This work represents only one part of a much larger and collaborative effort of monitoring Holuhraun eruption and the unrest at Bárðarbunga during 6 months. We would like to thank all those that took part to this work in one way or another. We are grateful to the Icelandic Coast Guard who allowed safe flights over the caldera and the lava field as well as the acquisition of data. We thank the two reviewers and the editor Maurizio Battaglia, for their insightful reviews that improved the paper, M. Dirscherl for helping with the Figure 8 and Christian Minet for his collaboration and advice when dealing with TSX-TDX data. COSMO-SkyMed data were provided by the Italian Space Agency (ASI) and TerraSAR-X data by the German Space Agency (DLR) through the Icelandic Volcanoes Supersite project supported by the Committee on Earth Observing Satellites (CEOS). An intermediate TanDEM-X digital elevation model was provided by DLR under project IDEM_GEOL0123.
Footnotes
References
Agram, P. S., Jolivet, R., Riel, B., Lin, Y. N., Simons, M., Hetland, E., et al. (2013). New radar interferometric time series analysis toolbox released. EOS Trans. Am. Geophys. Union 94, 69–70.
Ágústsdóttir, T., Woods, J., Greenfield, T., Green, R. G., White, R. S., Winder, T., et al. (2016). Strike-slip faulting during the 2014 Bárðarbunga-Holuhraun dike intrusion, central Iceland. Geophys. Res. Lett. 43, 1495–1503. doi: 10.1002/2015GL067423
Anantrasirichai, N., Biggs, J., Albino, F., Hill, P., and Bull, D. R. (2018). Application of machine learning to classification of volcanic deformation in routinely generated InSAR data. J. Geophys. Res. Solid Earth 123, 6592–6606. doi: 10.1029/2018JB015911
Bagnardi, M., and Hooper, A. (2018). Inversion of surface deformation data for rapid estimates of source parameters and uncertainties: a Bayesian approach. Geochem. Geophys. Geosyst. 19, 2194–2211. doi: 10.1029/2018GC007585
Biggs, J., Lu, Z., Fournier, T., and Freymueller, J. T. (2010). Magma flux at Okmok volcano, Alaska, from a joint inversion of continuous gps, campaign gps, and interferometric synthetic aperture radar. J. Geophys. Res. Solid Earth 115, B12401. doi: 10.1029/2010JB007577
Budd, L., Griggs, S., Howarth, D., and Ison, S. (2011). A fiasco of volcanic proportions? Eyjafjallajökull and the closure of European airspace. Mobilities 6, 31–40. doi: 10.1080/17450101.2011.532650
Chen, C. W., and Zebker, H. A. (2001). Two-dimensional phase unwrapping with use of statistical models for cost functions in nonlinear optimization. JOSA A 18, 338–351. doi: 10.1364/JOSAA.18.000338
Covello, F., Battazza, F., Coletta, A., Lopinto, E., Fiorentino, C., Pietranera, L., et al. (2010). COSMO-SkyMed an existing opportunity for observing the Earth. J. Geodyn. 49, 171–180. doi: 10.1016/j.jog.2010.01.001
Decriem, J., Árnadóttir, T., Hooper, A., Geirsson, H., Sigmundsson, F., Keiding, M., et al. (2010). The 2008 May 29 earthquake doublet in SW Iceland. Geophys. J. Int. 181, 1128–1146. doi: 10.1111/j.1365-246X.2010.04565.x
Dirscherl, M., and Rossi, C. (2018). Geomorphometric analysis of the 2014–2015 Bárðarbunga volcanic eruption, Iceland. Remote Sens. Environ. 204, 244–259. doi: 10.1016/j.rse.2017.10.027
Drouin, V., and Sigmundsson, F. (2018). Country-wide deformation fields over Iceland using Sentinel-1 SAR images. Geophys. Res. Abstracts 20, EGU2018–EGU14247.
Dumont, S., Sigmundsson, F., Hooper, A., Vogfjörd, K. S., Hreinsdóttir, S., Ófeigsson, B., et al. (2017). Spatial and Temporal Evolution of the Plumbing System Feeding the 2014-2015 Fissure Eruption at Holuhraun (Iceland) Inferred from a Multi-disciplinary Approach. Portland: IAVCEI.
Dürig, T., Gudmundsson, M., Högnadóttir, T., Jónsdóttir, I., Gudbjörnsson, S., Lárusson, Ö, et al. (2015). Estimation of lava flow field volumes and volumetric effusion rates from airborne radar profiling and other data: monitoring of the Nornahraun (Holuhraun) 2014/15 eruption in Iceland. Geophys. Res. Abstracts 17, EGU2015–EGU8519.
Dürig, T., Gudmundsson, M. T., Dioguardi, F., Woodhouse, M., Björnsson, H., Barsotti, S., et al. (2018). REFIR- a multi-parameter system for near real-time estimates of plume-height and mass eruption rate during explosive eruptions. J. Volcanol. Geotherm. Res. 360, 61–83. doi: 10.1016/j.jvolgeores.2018.07
Edwards, B., Magnússon, E., Thordarson, T., Gudmundsson, M. T., Höskuldsson, A., Oddsson, B., et al. (2012). Interactions between lava and snow/ice during the 2010 Fimmvörðuháls eruption, south-central Iceland. J. Geophys. Res. Solid Earth 117:B04302. doi: 10.1029/2011JB008985
Eibl, E. P. S., Bean, C. J., Jónsdóttir, I., Höskuldsson, A., Thordarson, T., Coppola, D., et al. (2017). Multiple coincident eruptive seismic tremor sources during the 2014–2015 eruption at Holuhraun, Iceland. J. Geophys. Res. Solid Earth 122, 2972–2987. doi: 10.1002/2016JB013892
Einarsson, P. (2018). Short-term seismic precursors to Icelandic eruptions 1973-2014. Front. Earth Sci. 6:45. doi: 10.3389/feart.2018.00045
Foumelis, M., Blasco, J. M. D., Desnos, Y. L., Engdahl, M., Fernández, D., Veci, L., et al. (2018). “ESA SNAP–Stamps integrated processing for sentinel-1 persistent scatterer interferometry,” in Proceedings of the International Geoscience and Remote Sensing Symposium (IGARSS), 2018, (Piscataway, NJ: IEEE). doi: 10.1109/IGARSS.2018.8519545
Gaddes, M. E., Hooper, A., Bagnardi, M., Inman, H., and Albino, F. (2018). Blind signal separation methods for InSAR: The potential to automatically detect and monitor signals of volcanic deformation. J. Geophysi. Res. Solid Earth 123, (in press). doi: 10.1029/2018JB016210
Gauthier, P. J., Sigmarsson, O., Gouhier, M., Haddadi, B., and Moune, S. (2016). Elevated gas flux and trace metal degassing from the 2014–2015 fissure eruption at the Bárðarbunga volcanic system, Iceland. J. Geophys. Res. Solid Earth 121, 1610–1630. doi: 10.1002/2015JB012111
Gíslason, S. R., Stefánsdóttir, G., Pfeffer, M. A., Barsotti, S., Jóhannsson, T., Galeczka, I., et al. (2015). Environmental pressure from the 2014–15 eruption of Bárðarbunga volcano, Iceland. Geochem. Perspect. 1, 84–93. doi: 10.7185/geochemlet.1509
Goldstein, R. M., and Werner, C. L. (1998). Radar interferogram filtering for geophysical applications. Geophys. Res. Lett. 25, 4035–4038. doi: 10.1029/1998GL900033
Goldstein, R. M., Zebker, H. A., and Werner, C. L. (1988). Satellite radar interferometry: two-dimensional phase unwrapping. Radio Sci. 23, 713–720. doi: 10.1029/RS023i004p00713
Gudmundsson, M. T., Jónsdóttir, K., Hooper, A., Holohan, E. P., Halldórsson, S. A., Ófeigsson, B. G., et al. (2016). Gradual caldera collapse at Bárdarbunga volcano, Iceland, regulated by lateral magma outflow. Science 353:aaf8988. doi: 10.1126/science.aaf8988
Gudmundsson, M. T., Thordarson, T., Höskuldsson,Á, Larsen, G., Björnsson, H., Prata, A. J., et al. (2012). Ash generation and distribution from the April-May 2010 eruption of Eyjafjallajökull, Iceland. Sci. Rep. 2:572. doi: 10.1038/srep00572
Haack, H., Rossi, M. J., and Dall, J. (2006). SAR mapping of Burfellshraun: a terrestrial analog for recent volcanism on Mars. J. Geophys. Res. 111:E06S13. doi: 10.1029/2005JE002536
Hartley, M. E., and Thordarson, T. (2013). The 1874–1876 volcano-tectonic episode at Askja, North Iceland: Lateral flow revisited. Geochem. Geophys. Geosyst. 14, 2286–2309. doi: 10.1002/ggge.20151
Heimisson, E. R., Einarsson, P., Sigmundsson, F., and Brandsdóttir, B. (2015). Kilometer-scale kaiser effect identified in Krafla volcano. Icel. Geophys. Res. Lett. 42, 7958–7965. doi: 10.1002/2015GL065680
Hjartardóttir,ÁR., Einarsson, P., Gudmundsson, M. T., and Högnadóttir, T. (2016). Fracture movements and graben subsidence during the 2014 Bárðarbunga dike intrusion in Iceland. J. Volcanol. Geoth. Res. 310, 242–252. doi: 10.1016/j.jvolgeores.2015.12.002
Hooper, A., Zebker, H., Segall, P., and Kampes, B. (2004). A new method for measuring deformation on volcanoes and other natural terrains using InSAR persistent scatterers. Geophys. Res. Lett. 31:L23611. doi: 10.1029/2004GL021737
Johannesson, H., and Sæmundsson, K. (2009). Geological Map of Iceland, Tectonics 1:600.000. Gardabaer: Institute of Natural History.
Jordan, C., Sigmundsson, F., Vogfjord, K., Gudmundsson, M. T., Kristinsson, I., Loughlin, S., et al. (2013). “Futurevolc: a European volcanological supersite observatory in Iceland, a monitoring system and network for the future,” in Proceedings of the Geoscience and Remote Sensing Symposium (IGARSS), 2013, (Piscataway, NJ: IEEE), 286–289. doi: 10.1109/IGARSS.2013.6721148
Krieger, G., Moreira, A., Fiedler, H., Hajnsek, I., Werner, M., Younis, M., et al. (2007). TanDEM-X: A satellite formation for high-resolution SAR interferometry. IEEE Trans. Geosci. Remote Sens. 45, 3317–3341. doi: 10.1109/TGRS.2007.900693
Magnússon, E., Björnsson, H., Dall, J., and Pálsson, F. (2005). Volume changes of Vatnajökull ice cap, Iceland, due to surface mass balance, ice flow, and subglacial melting at geothermal areas. Geophys. Res. Lett. 32:L05504. doi: 10.1029/2004GL021615
Magnússon, E., Gudmundsson, M. T., Sigurdsson, G., Roberts, M. J., Höskuldsson, F., and Oddsson, B. (2012). Ice-volcano interactions during the 2010 Eyjafjallajökull eruption, as revealed by airborne radar. J. Geophys. Res. 117:B07405. doi: 10.1029/2012JB009250
Mazzocchi, M., Hansstein, F., and Ragona, M. (2010). The 2010 volcanic ash cloud and its financial impact on the European airline industry. München:CESifo.
Metropolis, N., Rosenbluth, A. W., Rosenbluth, M. N., Teller, A. H., and Teller, E. (1953). Equation of state calculations by fast computing machines. J. Chem. Phys. 21, 1087–1092. doi: 10.1063/1.1699114
Mogi, K. (1958). Relations between the eruptions of various volcanoes and the deformations of the ground surfaces around them. Bull. Earthq. Res. Inst. Univ. Tokyo 36, 99–134.
Müller, D., Walter, T. R., Schöpa, A., Witt, T., Steinke, B., Gudmundsson, M. T., et al. (2017). High-resolution digital elevation modeling from tls and uav campaign reveals structural complexity at the 2014/2015 Holuhraun eruption site, Iceland. Front. Earth Sci. 5:59. doi: 10.3389/feart.2017.00059
Oelke, C., and Zhang, T. (2004). A model study of circum-Arctic soil temperatures. Permafrost Periglac. 15, 103–121. doi: 10.1002/ppp.485
Okada, Y. (1992). Internal deformation due to shear and tensile faults in a half-space. B. Seismol. Soc. Am. 82, 1018–1040.
Parks, M., Dumont, S., Spaans, K., Drouin, V., Sigmundsson, F., and Hooper, A. (2014). Icelandic volcanoes geohazard supersite and FUTUREVOLC: role of interferometric synthetic aperture radar to identify renewed unrest and track magma movement beneath the most active volcanoes in Iceland. Geophys. Res. Abstracts 16, EGU2014–EGU10707.
Parks, M. M., Heimisson, E. R., Sigmundsson, F., Hooper, A., Vogfjörd, K. S., Árnadóttir, T., et al. (2017). Evolution of deformation and stress changes during the caldera collapse and dyking at Bárdarbunga, 2014–2015: implication for triggering of seismicity at nearby Tungnafellsjökull volcano. Earth Planet. Sci. Lett. 462, 212–223. doi: 10.1016/j.epsl.2017.01.020
Parks, M. M., Moore, J. D., Papanikolaou, X., Biggs, J., Mather, T. A., Pyle, D. M., et al. (2015). From quiescence to unrest: 20 years of satellite geodetic measurements at Santorini volcano, Greece. J. Geophys. Res. Solid Earth 120, 1309–1328. doi: 10.1002/2014JB011540
Pedersen, G. B. M., Höskuldsson, A., Dürig, T., Thordarson, T., Jonsdottir, I., Riishuus, M. S., et al. (2017). Lava field evolution and emplacement dynamics of the 2014–2015 basaltic fissure eruption at Holuhraun, Iceland. J. Volcanol. Geoth. Res. 340, 155–169. doi: 10.1016/j.jvolgeores.2017.02.027
Pfeffer, M. A., Bergsson, B., Barsotti, S., Stefánsdóttir, G., Galle, B., Arellano, S., et al. (2018). Ground-based measurements of the 2014–2015 Holuhraun volcanic cloud (Iceland). Geosciences 8:29. doi: 10.3390/geosciences8010029
Pinel, V., Poland, M. P., and Hooper, A. (2014). Volcanology: lessons learned from synthetic aperture radar imagery. J. Volcanol. Geoth. Res. 289, 81–113. doi: 10.1016/j.jvolgeores.2014.10.010
Pritchard, M. E., Biggs, J., Wauthier, C., Sansosti, E., Arnold, D. W. D., Delgado, F., et al. (2018). Towards coordinated regional multi-satellite InSAR volcano observations: results from the Latin America pilot project. J. Appl. Volcanol. 7:5. doi: 10.1186/s13617-018-0074-0
Reynolds, H. I., Gudmundsson, M. T., Högnadóttir, T., Magnússon, E., and Pálsson, F. (2017). Subglacial volcanic activity above a lateral dyke path during the 2014–2015 Bárdarbunga-Holuhraun rifting episode, Iceland. Bull. Volcanol. 79:38. doi: 10.1007/s00445-017-1122-z
Riel, B., Milillo, P., Simons, M., Lundgren, P., Kanamori, H., and Samsonov, S. (2015). The collapse of Bárðarbunga caldera, Iceland. Geophys. J. Int. 202, 446–453. doi: 10.1093/gji/ggv157
Rosen, P. A., Hensley, S., Peltzer, G., and Simons, M. (2004). Updated repeat orbit interferometry package released. Eos Trans. Agu 85, 47–47. doi: 10.1029/2004EO050004
Rossi, C., Gonzalez, F. R., Fritz, T., Yague-Martinez, N., and Eineder, M. (2012). TanDEM-X calibrated raw DEM generation. ISPRS. J. Photogramm. Remote Sens. 73, 12–20. doi: 10.1016/j.isprsjprs.2012.05.014
Rossi, C., Minet, C., Fritz, T., Eineder, M., and Bamler, R. (2016). Temporal monitoring of subglacial volcanoes with TanDEM-X—Application to the 2014–2015 eruption within the Bárðarbunga volcanic system, Iceland. Remote Sens. Environ. 181, 186–197. doi: 10.1016/j.rse.2016.04.003
Ruch, J., Wang, T., Xu, W., Hensch, M., and Jónsson, S. (2016). Oblique rift opening revealed by reoccurring magma injection in central Iceland. Nat. Commun. 7:12352. doi: 10.1038/ncomms12352
Sandwell, D., Mellors, R., Tong, X., Wei, M., and Wessel, P. (2011a). GMTSAR: An Insar Processing System Based on Generic Mapping Tools. San Diego: Scripps Institution of Oceanography, 97.
Sandwell, D., Mellors, R., Tong, X., Wei, M., and Wessel, P. (2011b). Open radar interferometry software for mapping surface deformation. EOS Trans. Am. Geophys. Union 92, 234–234. doi: 10.1029/2011EO280002
Sigmundsson, F., Hooper, A., Hreinsdóttir, S., Vogfjörd, K. S., Ófeigsson, B. G., Heimisson, E. R., et al. (2015). Segmented lateral dyke growth in a rifting event at Bárðarbunga volcanic system, Iceland. Nature 517, 191–195. doi: 10.1038/nature14111
Sigmundsson, F., Parks, M., Dumont, S., Drouin, V., Wittman, W., Hooper, A., et al. (2017). The Icelandic Volcanoes Supersite: Integrating in SAR space geodetic results into interdisciplinary hazard response and volcano science studies. Geophys. Res. Abstracts 19, EGU2017–EGU15645.
Sigmundsson, F., Vogfjord, K., Gudmundsson, M. T., Kristinsson, I., Loughlin, S., and Ilyinskaya, E. (2013). FUTUREVOLC: A European volcanological supersite in Iceland, a monitoring system and network for the future. Geophys. Res. Abstracts 15, EGU2013–EGU9495.
Spaans, K., and Hooper, A. (2016). InSAR processing for volcano monitoring and other near-real time applications. J. Geophys. Res. Solid Earth 121, 2947–2960. doi: 10.1002/2015JB012752
Tarantola, A. (2005). Inverse Problem Theory and Methods for Model Parameter Estimation. Philadelphia, PA: SIAM. doi: 10.1137/1.9780898717921
Thordarson, T., and Larsen, G. (2007). Volcanism in Iceland in historical time: volcano types, eruption styles and eruptive history. J. Geodyn. 43, 118–152. doi: 10.1016/j.jog.2006.09.005
Thun, J., Lokmer, I., Bean, C. J., Eibl, E. P., Bergsson, B. H., and Braiden, A. (2016). Micrometre-scale deformation observations reveal fundamental controls on geological rifting. Sci. Rep. 6:36676. doi: 10.1038/srep36676
Witham, C., Barsotti, S., and Dumont, S. (2017). Katla Erupts”: A Transboundary Exercise Conducted by Futurevolc. Portland: IAVCEI.
Wright, T. J., Parsons, B. E., and Lu, Z. (2004). Toward mapping surface deformation in three dimensions using InSAR. Geophys. Res. Lett. 31:L01607. doi: 10.1029/2003GL018827
Keywords: SAR data, volcano monitoring, Bárðarbunga volcano, Holuhraun eruption, Iceland, FutureVolc, Icelandic Volcanoes Supersite
Citation: Dumont S, Sigmundsson F, Parks MM, Drouin VJP, Pedersen GBM, Jónsdóttir I, Höskuldsson Á, Hooper A, Spaans K, Bagnardi M, Gudmundsson MT, Barsotti S, Jónsdóttir K, Högnadóttir T, Magnússon E, Hjartardóttir ÁR, Dürig T, Rossi C and Oddsson B (2018) Integration of SAR Data Into Monitoring of the 2014–2015 Holuhraun Eruption, Iceland: Contribution of the Icelandic Volcanoes Supersite and the FutureVolc Projects. Front. Earth Sci. 6:231. doi: 10.3389/feart.2018.00231
Received: 31 August 2018; Accepted: 28 November 2018;
Published: 21 December 2018.
Edited by:
Maurizio Battaglia, United States Geological Survey, United StatesReviewed by:
Elisa Trasatti, National Institute of Geophysics and Volcanology (INGV), ItalyEmanuele Intrieri, Università degli Studi di Firenze, Italy
Copyright © 2018 Dumont, Sigmundsson, Parks, Drouin, Pedersen, Jónsdóttir, Höskuldsson, Hooper, Spaans, Bagnardi, Gudmundsson, Barsotti, Jónsdóttir, Högnadóttir, Magnússon, Hjartardóttir, Dürig, Rossi and Oddsson. This is an open-access article distributed under the terms of the Creative Commons Attribution License (CC BY). The use, distribution or reproduction in other forums is permitted, provided the original author(s) and the copyright owner(s) are credited and that the original publication in this journal is cited, in accordance with accepted academic practice. No use, distribution or reproduction is permitted which does not comply with these terms.
*Correspondence: Stéphanie Dumont, sdumont@segal.ubi.pt