Glacier Changes in Iceland From ∼1890 to 2019
 Guðfinna Aðalgeirsdóttir1*
  Eyjólfur Magnússon1
  Finnur Pálsson1
  Thorsteinn Thorsteinsson2
  Joaquín M. C. Belart1,3,4
  Tómas Jóhannesson2
  Hrafnhildur Hannesdóttir2
  Oddur Sigurðsson2
  Andri Gunnarsson5
  Bergur Einarsson2
  Etienne Berthier6
  Louise Steffensen Schmidt1,6 Hannes H. Haraldsson5
  Helgi Björnsson1
- 1Institute of Earth Sciences, University of Iceland, Reykjavík, Iceland
- 2Icelandic Meteorological Office, Reykjavík, Iceland
- 3National Land Survey of Iceland, Akranes, Iceland
- 4Laboratoire d'Etudes en Géophysique et Océanographie Spatiales, Université de Toulouse, CNRS, Toulouse, France
- 5National Power Company of Iceland, Reykjavík, Iceland
- 6Department of Geosciences, University of Oslo, Oslo, Norway
The volume of glaciers in Iceland (∼3,400
Introduction
Glaciers in most areas of the world are losing mass as global temperatures rise in response to increased greenhouse gas concentrations in the atmosphere (e.g., Vaughan et al., 2013; Hock et al., 2019; Meredith et al., 2019; Zemp et al., 2019). In situ mass-balance observations are sparse (e.g., Zemp et al., 2020a), but with the aid of satellite and other remote-sensing data, an increasingly clear picture of glacier mass loss around the world has been appearing (e.g., Brun et al., 2017; Wouters et al., 2019; Morris et al., 2020; Shean et al., 2020). Glacier mass loss is a global phenomenon, and the rates in the early 21st century are unprecedented for the observed period (Zemp et al., 2015). Reconstructions of glacier mass-change rates for the 20th century and the first decade of the 21st century show substantial temporal and spatial variations, but a global mass loss trend became clear toward the end of the 20th century (Leclercq et al., 2011; Marzeion et al., 2015; Marzeion et al., 2012).
Iceland is located in a region of maritime climate in the middle of the North Atlantic Ocean with relatively cool summers, mild winters, and high precipitation. Glaciers in Iceland are all temperate and cover about 10% of the area of the country (Björnsson and Pálsson, 2008), with the largest ice cap Vatnajökull (∼7,700 km2, ∼2,870 km3, in the year 2019) located near the southeast coast, two smaller ice caps Langjökull (∼835 km2, ∼171 km3, in the year 2019) and Hofsjökull (∼810 km2, ∼170 km3, in the year 2019) in the central highlands [area estimates are from Hannesdóttir et al. (2020) and volumes are calculated in this study], and Mýrdalsjökull [∼598
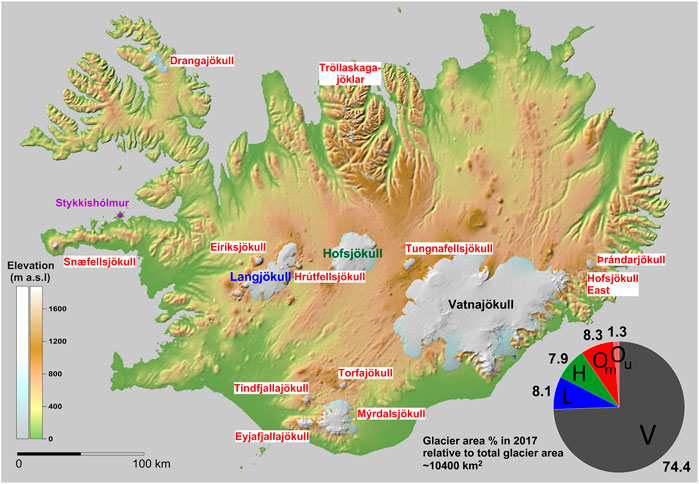
FIGURE 1. Map of Iceland showing the glaciers considered in this study. The pie chart in the bottom right corner shows the relative sizes of the glaciers in 2017 (Hannesdóttir et al., 2020) in percentage; Vatnajökull (V), Langjökull (L), Hofsjökull (H), and the smaller glaciers grouped as Om in pie chart: Drangajökull, Snæfellsjökull, Eyjafjallajökull, Tindfjallajökull, Torfajökull, Mýrdalsjökull, Þrándarjökull, Hofsjökull eystri, Tungnafellsjökull, Hrútfellsjökull, Eiríksjökull and Barkárdals- and Tungnahryggsjökull, considered as one glacier unit on Tröllaskagi. Unmeasured glaciers (Ou) corresponded to ∼1.3% of the total area in 2019 (Hannesdóttir et al., 2020). The town Stykkishólmur is shown with a purple dot, from which a temperature record exists since the middle of the 19th century.
Glaciers in Iceland have received much attention through the centuries due to their proximity to inhabited regions (Figure 1). The retreat of many glacier tongues was noticed in the early 20th century and in 1930 a country-wide voluntary monitoring program was initiated (Eyþórsson, 1963; Sigurðsson, 2005). This program was later continued by the Icelandic Glaciological Society (founded in 1950) and continues to this day (Björnsson, 2017; Hannesdóttir et al., 2020). Thirty to forty terminus positions are measured annually and the observations are posted on the website spordakost.jorfi.is. The surface and bedrock topographies of the largest ice caps have been measured in radio-echo sounding campaigns carried out since 1977. Radio-echo sounding on the temperate ice caps in Iceland required a much longer electromagnetic wavelength than had been used on the cold polar ice caps (Björnsson and Pálsson, 2020). The pioneering measurements resulted in a good knowledge of the subglacial topography of the ice caps and their total volume (Björnsson, 1986; Björnsson, 2017; Björnsson and Pálsson, 2020). Lidar measurements of the glacier surfaces were conducted in the period 2008–2013 (Jóhannesson et al., 2013). Annual glaciological mass-balance measurements started on Hofsjökull in the glaciological year 1987/88 (Thorsteinsson et al., 2017), in 1991/92 on Vatnajökull, and 1996/97 on Langjökull (Björnsson et al., 1998; Björnsson et al., 2002). Since 2001, mass-balance measurements have also been carried out on an irregular basis on Mýrdalsjökull (Ágústsson et al., 2013). Geodetic mass balance has been estimated for several glaciers, with an increasing coverage in recent years (Pálsson et al., 2012; Jóhannesson et al., 2013; Hannesdóttir et al., 2015a; Magnússon et al., 2016; Belart et al., 2019; Belart et al., 2020). Mass changes of the Icelandic glaciers have, furthermore, been estimated using ICESat (Nilsson et al., 2015), CryoSat2 (Foresta et al., 2016), and the GRACE satellites (von Hippel and Harig, 2019; Wouters et al., 2019; Ciracì et al., 2020), and Sørensen et al. (2017) showed that signal leakage due to mass changes of the neighboring Greenland Ice Sheet and the effect of glacial isostatic rebound need to be carefully taken into account.
Mass loss from Icelandic glaciers in the years 1994/5–2009/10 was reported as 9.5 ± 1.5 Gt
Methods and Data
The time steps in this study correspond to the glaciological year (Cogley et al., 2011) from autumn to autumn, using the floating-date mass-balance system (Østrem and Brugman, 1991; Björnsson et al., 2002; Cogley et al., 2011), that is, the end of the summer melt season marks the start of a new glaciological year. To construct the mass-balance history of Icelandic glaciers back to the year 1890/91 [assumed here to be the end of the LIA in Iceland (Thorarinsson, 1943; Sigurðsson, 2005)], we compile and combine different data sets and methods. These include the following:
(1) Record of the annual surface mass balance obtained with the glaciological method for the three largest ice caps, Vatnajökull (glaciological years 1991/92 to 2018/19), Hofsjökull (1987/88 to 2018/19), and Langjökull (1996/97 to 2018/19). The data records are shown in Figures 2 and 3A,B,C.
(2) Simulation of the surface mass balance of Vatnajökull for the years 1980/81 to 1991/92 from the HIRHAM5 snowpack model that uses MODIS albedo (Schmidt et al., 2017) and is forced with a ERA-Interim downscaling using the HARMONIE–AROME model at 2.5 km resolution (Schmidt et al., 2019) (see shaded area in Figure 3A). Data from automatic weather stations and glaciological surface mass balance, and runoff measurements were used to constrain the model (Schmidt et al., 2018).
(4) The non-surface mass-balance estimates from Jóhannesson et al. (2020) are taken into account and added to the glaciological and modeled surface mass balance listed above.
(5) Zero annual mass balance for Vatnajökull for the period 1970/71 to 1979/80 and for Hofsjökull from 1970/71 to 1986/87 is assumed (green boxes in Figures 3A,B). This is supported by the small area changes during these periods (Hannesdóttir et al., 2020), the relatively cold weather conditions (Figure 3E), the observations of limited terminus length changes (spordakost.jorfi.is), and the near–zero geodetic mass balances of several of the smaller glaciers in these periods (Figure 3D).
(6) Geodetic mass-balance records for Langjökull (Pálsson et al., 2012), from 1937/38 to 1996/97 (red lines with uncertainties in Figure 3B) and 12 smaller glaciers (Figure 3D) from 1945/46 to 2016/17 (Belart et al., 2020) that cover 8.3% of the glacier area in Iceland. The remaining 1.3% of glacier area that is not observed is assumed to have the same mass loss rate as the measured small glaciers. The geodetic results were also used to scale (Jóhannesson et al., 2013) and validate (Pálsson et al., 2012) the glaciological measurements.
(7) Estimates of the volumes of Vatnajökull and Hofsjökull in 1890 and 1945 as well as the volume of Langjökull in 1890 based on the volume–area scaling (Bahr et al., 1997; Bahr et al., 2015) (Figure 4). The glacier areas are derived from Hannesdóttir et al. (2020); we describe the method below and the resulting mass change rates calculated from the area and volume changes are shown with purple boxes in Figures 3A,B,C.
(8) To include an estimate of mass change for other glaciers than Vatnajökull, Langjökull, and Hofsjökull in the periods 1890/91–1944/45 and 2017/18–2018/19, the net mass change of those three is multiplied by F = 1.130, which is the ratio between mass change of all glaciers in Iceland in 1945/46–2016/17 and the mass change of the three large ice caps in the same period. Values for the ratio F are specifically calculated for the periods 1994/95–2003/04, 2004/5–2009/10, and 2010/11–2016/17 (1.176, 1.131, and 1.056, respectively), corresponding to the geodetic mass-balance periods of Belart et al. (2020). After 1994/95, an estimate of the annual variability of the mass change for other glaciers than the three largest is included by calculating the net mass change for each glaciological year, using the corresponding F value for each period. The net mass change during these periods, which is obtained with the geodetic method, is not altered by this.
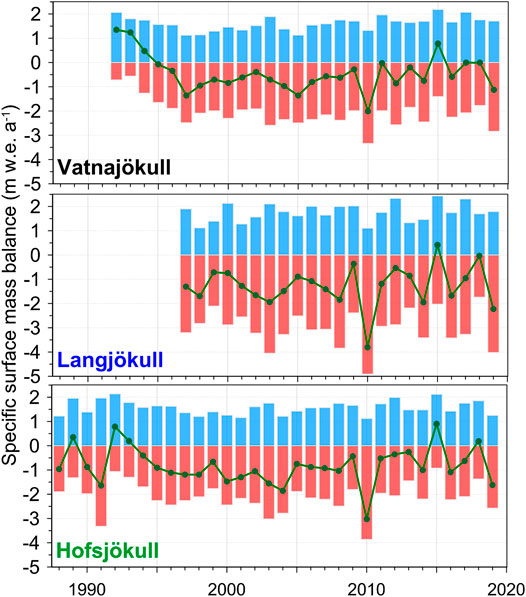
FIGURE 2. Mean specific surface mass-balance records of the three largest glaciers in Iceland obtained with glaciological method (in situ surveys). The mass-balance measurements have been conducted at ∼60, ∼25, and ∼25 locations since 1991/92, 1996/97, and 1987/88 for Vatnajökull, Langjökull, and Hofsjökull, respectively. Measurements by Institute of Earth Sciences, University of Iceland, and the National Power Company of Iceland (Langjökull and Vatnajökull) and the Icelandic Meteorological Office (Hofsjökull).
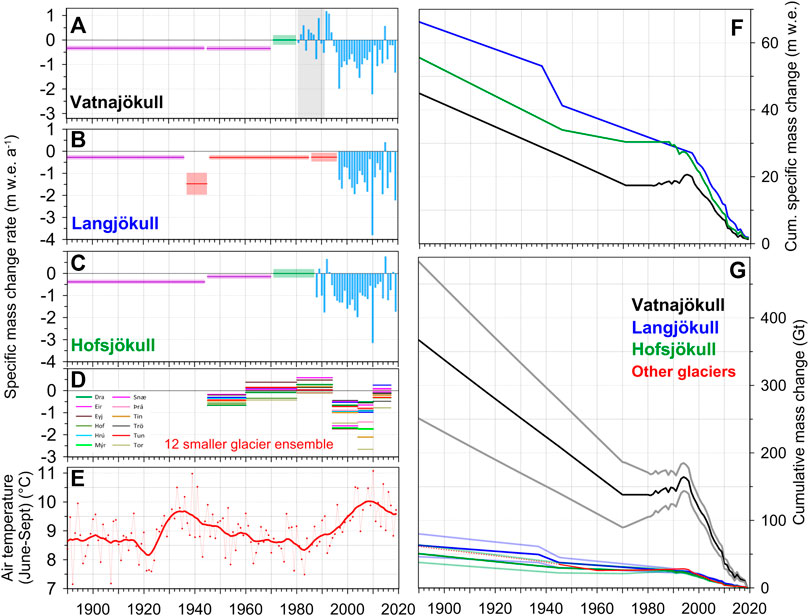
FIGURE 3. Left: The specific mass balance of glaciers in Iceland as observed, modeled, and estimated with various methods. The gray area in (A) indicates a period of modeled surface mass balance for Vatnajökull (Schmidt et al., 2019), green boxes in (A) and (C) are estimates from various sources (see main text), red boxes in (B) and lines in (D) are from geodetic mass balance (Pálsson et al., 2012; Belart et al., 2020) (heights of the boxes indicate uncertainty of measurements), and purple boxes in (A), (B), and (C) show estimated mass loss from volume–area scaling method (see. Figure 4). (E) The average summer (June through September) temperature at the meteorological station in Stykkishólmur (see Figure 1 for location); the thick line shows the 11-year running average with triangular weight, a 5-year filter. Right: (F) Cumulative specific mass balance (m w.e.) for Vatnajökull (black), Langjökull (blue), and Hofsjökull (green). (G) Cumulative mass change (Gt) of the same ice caps and the sum of other glaciers in Iceland assuming that the mass-balance records of the glaciers shown in (D) are representative for the unmeasured glaciers. The red dotted line shows the extension of this record for the years 1890/91 to 1944/45 (see Section 2). [in (G) the mass change of Mýrdalsjökull for the years 1945/46–1959/60, not included in (Belart et al., 2020), is estimated from a linear fit (with
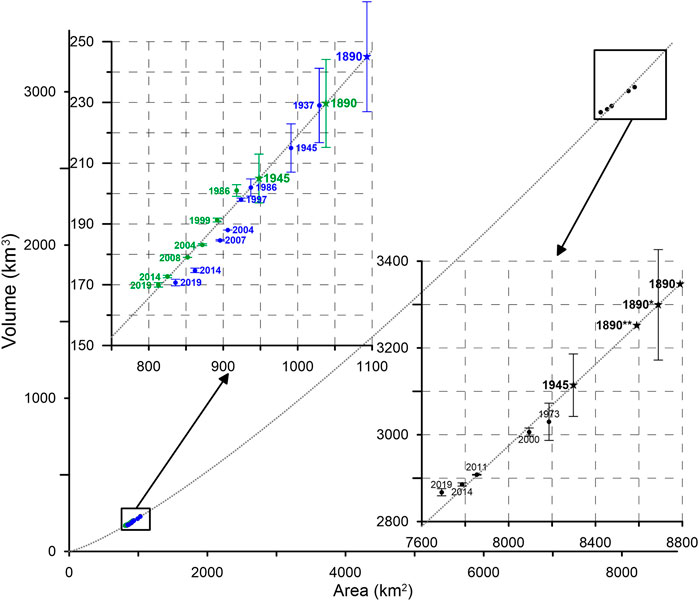
FIGURE 4. Volume–area scatter plot for the three largest ice caps in Iceland at various times since 1890. The blue markers are for Langjökull, green markers for Hofsjökull, and the black for Vatnajökull. The dotted gray line shows the least square fit of Eq. 1 through all volume–area points for these ice caps. Inset figures show a zoom in of the plot for the clusters with data from Hofsjökull and Langjökull (upper left corner) and Vatnajökull (lower right corner). Labels by the filled circles indicate dates when both area (Hannesdóttir et al., 2020) and volume are well established, while labels beside stars indicate dates of well-known area, with volume estimated from the deduced volume–area relation (dotted gray line). The 1890 values are obtained using area based on geomorphological evidence of the Little Ice Age maximum extent (Hannesdóttir et al., 2020). The 1890* and 1890** for Vatnajökull show the volume estimates with the reduced area to compensate for the large portion of surging outlets from Vatnajökull (see main text).
The above records were combined to calculate the mass balance of all Icelandic glaciers from 1890/91 to 2018/19. The cumulative mass change of all the glaciers for each period was computed as the sum of the total mass balance of the all glaciers (the product of the specific mass balance and the time-dependent glacier area). Below we discuss i) how the surface mass balance from the glaciological method is combined with the non-surface mass-balance estimates, ii) the application of the volume–area scaling to estimate past volumes of the three largest ice caps, and iii) the uncertainty of the obtained total mass balance of the Icelandic glaciers.
Combining the Surface and Non-Surface Mass-Balance Records
The surface mass balance from the glaciological method is obtained by measuring the snow water equivalent (w.e.) thickness of the snowpack above last summer’s surface in spring, and the summer ablation at the end of the summer melt season at ∼60 survey sites on Vatnajökull and ∼25 survey sites on Hofsjökull and Langjökull. These measurements, together with the HIRHAM5 snowpack model simulations, yield a detailed record of the winter, summer, and annual surface mass balance during the last three to four decades for these ice caps (Figure 2), constituting ∼90% of the glacier area in Iceland. These records show rather large annual variability and the exceptional effect of the 2010 eruption in Eyjafjallajökull, which doubled the summer melt due to the deposition of volcanic tephra on the surface of the ice caps (Björnsson et al., 2013).
The non-surface mass balance is known to be a non-negligible component of the mass balance of glaciers in Iceland (e.g., Björnsson et al., 2013) but has so far not been included in mass-balance estimates. The previously published mass-balance record for the Icelandic glaciers has now been revised by including this component. The non-surface melting of glaciers in Iceland for the period 1995–2019 estimated by Jóhannesson et al. (2020) includes geothermal melting, energy dissipation caused by the flow of water and ice, volcanic eruptions, and calving.
For Hofsjökull and Langjökull, the non-surface mass balance due to volcanic eruptions and calving is negligible, but not for Vatnajökull. Rather than including the ice melt (∼3.7 Gt) due to the Gjálp eruption in October 1996 (Guðmundsson et al., 2004), in the average rate over the period (1995/95–2018/19), it is subtracted and then added to the glaciological year 1996/97. This reduces the average mass balance due to geothermal melting and volcanic eruptions on Vatnajökull presented by Jóhannesson et al. (2020) from −0.075 m w.e.
Mass loss due to calving is negligible for all outlets except for Breiðamerkurjökull on the south side of Vatnajökull, which calves into the terminal lake Jökulsárlón. We apply a variable calving rate as described by Jóhannesson et al. (2020) for the years 1996/97–2016/17, resulting in an average of −0.056 m w.e.
The average non-surface mass-balance values for Langjökull and Hofsjökull, where calving is insignificant and no eruption has taken place during our study period, are −0.055 m w.e.
Comparison of the glaciological surface mass-balance record of Hofsjökull with results from geodetic mass balance, derived by differencing digital elevation models (DEMs), revealed a bias between the two data sets. This bias has been corrected in the surface mass-balance record of Hofsjökull (Jóhannesson et al., 2013; Thorsteinsson et al., 2017) shown in Figure 2, taking into account the contribution of the non-surface mass balance.
Volume–Area Scaling
The volume of a glacier can be obtained by integrating the ice thickness, calculated as the difference between surface and bedrock DEMs. Bedrock DEMs for the three largest ice caps have been made from dense radio-echo sounding data (Björnsson and Pálsson, 2020) and are assumed stable over time. Their volumes have been calculated using the following surface DEMs: lidar surface DEM of Hofsjökull from 2008 (Jóhannesson et al., 2013), a SPOT5-HRS (Korona et al., 2009) surface DEM of Vatnajökull from 2010, and a SPOT5 surface DEM of Langjökull from 2004 (Korona et al., 2009; Pálsson et al., 2012). The areal extent at several times for all the glaciers has been estimated based on a data set of glacier outlines (Pálsson et al., 2012; Jóhannesson et al., 2013; Hannesdóttir et al., 2020). Ice-volume estimates at other times can be calculated by multiplying the annual specific mass balance (Figure 3) of each glacier by the corresponding glacier area, linearly interpolated with time between dates of area observations, converting the annual mass change into ice volume [assuming the conversion factor 0.85 (Huss, 2013); note that mass-balance records previously published that used conversion factor 0.9 (Pálsson et al., 2012; Jóhannesson et al., 2013) have been adjusted accordingly (Thorsteinsson et al., 2017)] and integrating the volume change relative to the date of the surface DEMs listed above. This calculation gives the area and volume for several times back to 1970 for Hofsjökull and Vatnajökull and to 1937 for Langjökull. The results for the three ice caps for dates of observed areas and corresponding glacier volumes are shown with filled circles on the volume–area scatter plot in Figure 4.
Volume–area scaling, as described by Bahr et al. (1997), Bahr et al. (2015), gives an empirical relation between glacier volume (V) and area (A) of the form:
This relationship was already applied to estimate the ∼1890 volume of Langjökull by Pálsson et al. (2012). Here, we assume that the relationship between area and volume is the same for the three largest glaciers in Iceland, Vatnajökull, Langjökull, and Hofsjökull, which is supported by the linear relationship shown in Figure 4. The available area and volume data for all of them are therefore combined to estimate the parameters for the volume–area scaling equation. We subtract the area of debris-covered moraines and dead-ice fields with little surface-elevation change in the GLIMS glacier outlines (Hannesdóttir et al., 2020) (in total 27
Volume–area scaling has been widely used to estimate the volume of glaciers with an unknown subglacial topography/ice thickness (e.g., Radić and Hock, 2010), and changes in ice volume associated with variations in glacier extent when multi-temporal DEMs of the glacier surface are not available (e.g., Pálsson et al., 2012). The method is found to be uncertain by tens of per cent, up to even a factor 2–3, for estimating the volume of ice caps with an unknown subglacial topography (Gärtner-Roer et al., 2014), and methods that include information on glacier mass balance and glacier-surface geometry using ice-flow dynamics (Huss and Farinotti, 2012; Farinotti et al., 2019) are preferred for this purpose. Using volume–area scaling to estimate changes in the volume of glaciers with a well-known subglacial topography, from variations in glacier area over decadal time spans, may be expected to be more accurate because this mainly relies on the assumption that the glacier maintains a similar shape as it responds to mass-balance variations with changes in its area and volume. Timescales for redistribution of ice volume to maintain the characteristic shape of a glacier are expected to be much shorter than the response time of the glacier to mass-balance changes (Jóhannesson et al., 1989; Harrison et al., 2001). This approach has its limitations for surge-type glaciers but may be expected to provide reasonable volume-change estimates over long time periods with substantial changes in volume, even for ice caps with many outlet glaciers that may surge at irregular intervals. In case the glacier surface and subglacial topographies are well known at one point in time, the computation of volume changes can be based on an accurate estimate of the glacier volume at that time and the method mainly relies on the assumption that there is a statistical relationship between volume and area changes (see Figure 4). Thus, uncertainty about the overall magnitude of the volume of the glacier in question does not affect the accuracy of the estimated volume changes in this case. We note that over the time periods considered in this article, repeated surface mapping and surface reconstructions of the glaciers, where available, have shown elevation changes that are small in the interior of the glacier and amplified toward the ice margin, as expected if the glacier maintains a geometrically similar shape as it adjusts toward a new geometry during variations in the climate (Hannesdóttir et al., 2015b; Thorsteinsson et al., 2017).
The volumes of Hofsjökull and Vatnajökull in 1945 and 1890 and for Langjökull in 1890 were calculated based on the derived fit (shown with stars in Figure 4). The area of the glaciers in ∼1890 is based on geomorphological evidence of the maximum LIA extent in Iceland (Hannesdóttir et al., 2020). About half of Vatnajökull’s glacier margin is substantially affected by surges (Björnsson et al., 2003). The geomorphological evidence indicating the maximum LIA extent in front of these surge-type outlets is due to an advance during a surge that increased the area of the glacier without much effect on the glacier volume. Using this area as input for the volume–area relationship (Eq. 1) is likely to result in an overestimate of the glacier volume in ∼1890 for two reasons. First, Vatnajökull did not at any one time reach the determined maximum LIA extent because the surges responsible for the geomorphological evidence of maximum extent did not occur simultaneously. Second, right after a surge, the glacier spreads over a larger area than before without any increase in volume, resulting in a thinner glacier with smaller volume than indicated by the volume–area relationship (Eq. 1). To take this into account, we reduced the area so it represents the likely ice-cap area when the surge-type outlets are on average near their mid-quiescent-period size. This corresponds to ∼500 m retreat from the determined LIA extent of Vatnajökull’s surge-type outlets. Most of these advance between a few hundred meters and several kilometers during surges (Björnsson et al., 2003), the average probably being close to 1 km. The volume–area point marked 1890* for Vatnajökull in Figure 4 includes an area correction that corresponds to a 500 m retreat (area reduction by 100 km2), and the point marked 1890** includes double this area correction (the point marked 1890 corresponds to data that have not been adjusted to reflect the impact of the surges on the area). The effect of surges on Hofsjökull and Langjökull is much smaller than on Vatnajökull and therefore not taken into account in this study.
From the estimated ∼1890 volume for the three ice caps and the 1945 volume for Vatnajökull and Hofsjökull, it is possible to estimate the mean specific mass balance for the periods between the volume estimates. The determined values for mean specific mass balance for two periods for Hofsjökull and Vatnajökull (1890/91 to 1944/45 and 1945/46 to 1969/70) and one period for Langjökull (1890/91 to 1936/37) are shown with purple lines in Figures 3A,B,C. They are computed to be the value which, multiplied by glacier area (linearly interpolated in time), converted to ice volumes [again assuming a conversion factor of 0.85 based on Huss (2013)] and summed over the periods, results in the volume determined with the volume–area scaling shown with stars in Figure 4.
Uncertainties of the Presented Mass-Balance Records
It is not straightforward to estimate the uncertainty of the mass-balance estimates derived from the different observations and methods described above. A thorough consideration results in an uncertainty of 0.10 m w.e.
For 1900/01 to 1989/90, the total uncertainty is
due to how
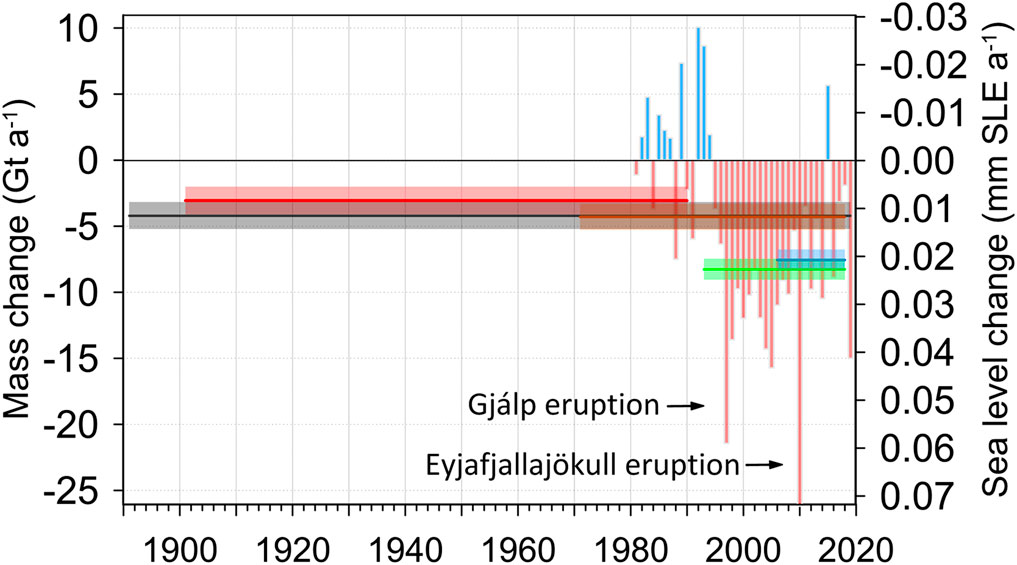
FIGURE 5. The mass changes of all glaciers in Iceland as estimated from the data presented in Figure 3, showing annual values for the period 1980/81 to 2018/19 and average mass loss rates for the five periods; 1890/91–2018/19 (black), 1900/01–1989/90 (red), 1970/71–2017/18 (orange), 1992/93–2017/18 (green), and 2005/06–2017/18 (blue). The two pronounced extremes in 1996/97 and 2009/10 show the melting of ∼3.7 Gt of ice due to the Gjálp eruption (mid-Vatnajökull) in October 1996 and the enhanced melting in summer 2010 caused by the deposition of a thin layer of volcanic tephra on the ice cap surfaces during the Eyjafjallajökull eruption in April–May 2010.
In previous studies, we have assumed the uncertainty for a point measurement of the surface mass balance to be ∼0.30 m w.e, while the uncertainty of the specific annual mass-balance values is expected to be smaller due to the good coverage of the survey sites and the number of measurement stakes (Björnsson et al., 2013). The surface mass-balance record obtained with the glaciological method for Langjökull (in 1997/98–2003/04) has been compared with volume changes derived from geodetic mass-balance estimates (Pálsson et al., 2012). This comparison revealed ∼0.05 m w.e.
Thorough validation of the glaciological mass-balance record for Vatnajökull has not yet been carried out, but comparison between geodetic and glaciological surface mass balance for limited periods and areas has suggested differences that are comparable to the non-surface melt included here (Zamolo, 2019). Based on these comparsions, the uncertainties for the decadal averages for specific mass balance of Vatnajökull during the observed and modeled periods is determined to be 0.1 m w.e.
The uncertainty of 0.1 m w.e.
The choice of the year 1890 as the time of maximum LIA extent of glaciers in Iceland for our analysis leads to some uncertainty in the mass-balance estimate for the first period after 1890, as the glaciers in fact reached the LIA maximum extent at different times. Most glaciers in Iceland reached their greatest historical extent during the LIA, with a maximum recorded in the late 19th century, although some glaciers reached a similar extent already during the 18th century (e.g., Thorarinsson, 1943; Geirsdóttir et al., 2009; Björnsson, 2017; Hannesdóttir et al., 2020, and references therein). Many glaciers started retreating from an advanced position near their LIA terminal moraines in the last decades of the 19th century, even if they reached the absolute maximum extent somewhat earlier. The volume of the glaciers will therefore have been close to the LIA maximum near the end of the 19th century, which we choose to represent with the year 1890, even for glaciers that reached their maximum earlier. We do not quantify the contribution of this uncertainty about the timing of the LIA maximum to the uncertainty of our mass-balance estimates as this can only be done on a glacier-by-glacier basis.
The mass change record of each glacier is constructed from three to four methods. Each method may have a constant bias, of a similar magnitude to the estimated uncertainties; the probability of the minimum mass change occurring for all periods (or alternatively maximum mass change for all periods) is, however, smaller. By cumulating the uncertainties independent of the method, we assume this is possible. This generous uncertainty estimate is applied because of the partial dependency between methods, for example, the input data for the volume–area scaling is from both geodetic and glaciological data. Treating the methods as independent would therefore lead to underestimation of the uncertainties. The uncertainties for each of the contributions,
Results
The mass change record of all glaciers in Iceland is shown in Figure 5. Before the glaciological year 1980/81, the observations do not allow the estimation of annual or decadal variability. The glaciological observations started on Hofsjökull in 1987/88 and annual variabilty in the period 1980/81 to 1987/88 is obtained from simulations from the HIRHAM5 snowpack model (Schmidt et al., 2019, see the Section 2). The annual variability is large: for the Vatnajökull record, the standard deviation of the observations is 0.75 m w.e.
Average mass change rates are computed for several selected periods (the reporting periods of the forthcoming IPCC AR6 assessment; see colored horizontal lines in Figure 5): 1900/01–1989/90: −3.1 ± 1.1 Gt
In the cold period 1980–1994 (see Figure 3E), 9 out of the 14 years show mass gain, but only 1 year after that (the mass-balance year 2014/15). The high mass losses of 1996/97 and 2009/10 are conspicuous. The large mass loss in 1996/97 is due to the melting of ∼3.7 Gt of ice due to the subglacial Gjálp volcanic eruption in October 1996 (Guðmundsson et al., 2004), followed by a warm and sunny summer with low surface albedo due to dust precipitating onto the glacier surface. Both tephra and dust blown onto the surface of the glaciers enhance the surface melt due to lowering of the albedo (e.g., Möller et al., 2016; Wittmann et al., 2017). In the summer of 2010, a thin layer of volcanic tephra was distributed onto almost all Icelandic glaciers in the final phase of the Eyjafjallajökull eruption in April–May 2010 (Gudmundsson et al., 2012; Gascoin et al., 2017; Möller et al., 2019). Followed by an unusually warm and sunny summer, the tephra greatly enhanced melting (Björnsson et al., 2013; Belart et al., 2019), especially in the accumulation zones of the glaciers, except on Eyjafjallajökull and large portions of Mýrdalsjökull, where the tephra layer became thick enough to insulate the snow and ice, reducing the melt rates (Dragosics et al., 2016).
The mass balance year 2014/15 was characterized by a long sequence of low-pressure systems arriving one after another through the winter, bringing large amounts of precipitation, followed by a cool summer with little melt, resulting in positive mass balance on all the glaciers. In the following three years, the mass loss rate was less negative than in the previous years, but the glaciological year 2018/19 was one of the most negative mass-balance years on record, due to the persistence of anticyclonic conditions during the summer of 2019 (Tedesco and Fettweis, 2020), which resulted in warm and sunny conditions from early spring. This led to early melting of a relatively thin winter snow layer, which in turn led to early exposure of low-albedo regions in the ablation areas (Gunnarsson et al., 2020).
Discussion
Although the glaciers in Iceland are located in a highly active volcanic region, they are useful monitors of climate variations. The detailed mass-balance record presented here is combined from glaciological observations, geodetic measurements, simulation with the HIRHAM5 snowpack model, estimates of non-surface mass balance, and results from an empirical volume–area scaling that are used to extend the record back to the time of maximum LIA extent of the glaciers as recorded by geomorphological evidence. The record spans 129 years, although the annual variability is not available until the last two decades of the 20th century. The record shows variability on decadal timescales with a period of near-zero mass balance in the 1980s and early 1990s before the onset of consistently negative mass balance on the order of −1 m
In the light of the limited geodetic observations (Figures 3B,D) (Pálsson et al., 2012; Belart et al., 2020), the length-change observations back to 1930 (Eyþórsson, 1963; Sigurðsson et al., 2005), the glaciological measurements carried out on southeast outlets of Vatnajökull in the 1930s (Thorarinsson, 1940; Björnsson et al., 2013), modeling of the Vatnajökull SE outlet glacier Hoffellsjökull (Aðalgeirsdóttir et al., 2011), and the temperature evolution in Iceland during our study period (Figure 3E), it is likely that a large proportion of the 20th-century mass loss occurred during the ∼30 year period from the late 1920s to the late 1950s. For other time periods of the 20th century, Icelandic glaciers were probably close to equilibrium on a decadal timescale. On those timescales, this study does not clearly indicate periods of substantially positive mass balance. In the period 1980/81–1993/94, which is probably the period with the most positive mass balance since the early 1920s, given the temperature history (Figure 3E), the average mass gain only corresponds to 0.23±0.1 m w.e.
Mass change records for Icelandic glaciers have been made from the glaciological observations provided to the World Glacier Monitoring Service (WGMS) database (Zemp et al., 2019) (a subset of the observations presented in Figure 3), from ICESat data (Nilsson et al., 2015) (−10 ± 3 Gt
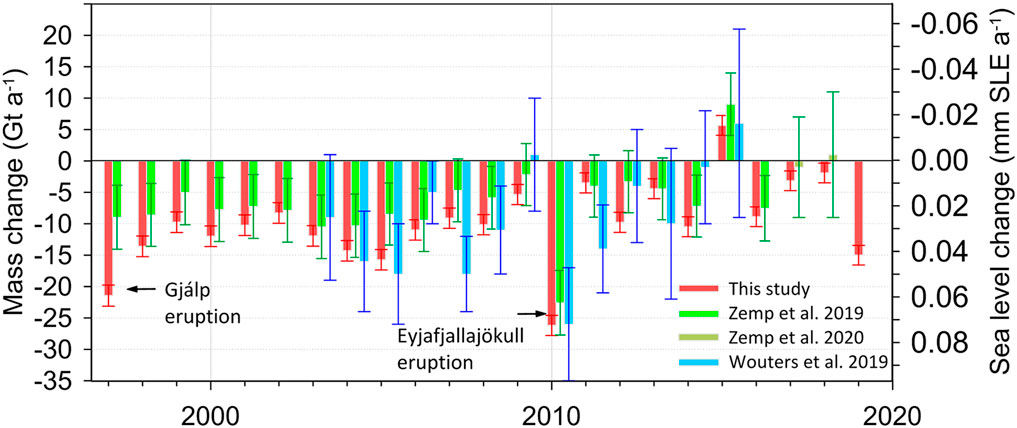
FIGURE 6. Comparison of mass change rates estimated in this study and studies based on glaciological observations provided to the WGMS database (Zemp et al., 2019; Zemp et al., 2020b) and the GRACE observations (Wouters et al., 2019), with the respective estimated uncertainties. The figure shows only the period when Vatnajökull, Hofsjökull, and Langjökull have all been monitored with glaciological observations. The contribution of other glaciers is from geodetic results (Belart et al., 2020), including an estimated annual variability (see Section 2).
As discussed above, annual mass-balance data are not available prior to 1980/81, so we have used geodetic observations and the volume–area scaling to extend the record to the end of the 19th century. Zemp et al. (2019) extend the record for Icelandic glaciers back to 1950 using mass-balance observations from Storglaciären in Sweden and Storbreen in Norway. The obtained mass change rate for the period 1950–1990 in their record is about double the rate that we find here (−4.0 vs. −1.7 Gt
The mass-balance record presented here includes the non-surface mass balance due to geothermal melting, energy dissipation in the flow of water and ice, volcanic eruptions, and calving from the study of Jóhannesson et al. (2020). The previously estimated mass change rate of −9.5 ± 1.5 Gt
There are strong similarities in the response of glaciers around the North Atlantic Ocean to atmospheric conditions, in particular at a multi-decadal time scale. This is illustrated by strongly negative mass balances and considerable retreat of glaciers in the 1930–1950s in Iceland (this study), on the east coast of Greenland (Bjørk et al., 2012), in Svalbard (Möller and Kohler, 2018) and for Hardangerjøkulen in Norway (Weber et al., 2019). More recently, the ocean around Iceland warmed after 1995 which correlates with the enhanced mass loss after 1995 in Iceland (Björnsson et al., 2013, this study) and Norway (Andreassen et al., 2020). The glaciers in Svalbard also shifted from a positive to a negative regime around 1990 (Østby et al., 2017; Schuler et al., 2020). The cooler oceanic conditions after 2010 (ICES, 2018) cooled the atmosphere and thereby reduced the mass loss in Iceland and Norway, and in Greenland the mass loss slowed down after a record mass-loss year in 2012 (Shepherd et al., 2019; Velicogna et al., 2020). The glaciological year 2018/19 shows one of the largest annual mass losses in our record. The Greenland Ice Sheet experienced a record mass loss in the same year (Sasgen et al., 2020) due to the persistence of anticyclonic conditions during the summer of 2019 (Tedesco and Fettweis, 2020).
With increased global temperatures, the summers in Iceland are warmer, resulting in longer ablation seasons, and in winter less precipitation falls as snow. With less snowfall on the glaciers, dirty ice appears earlier from beneath the snow in spring, which enhances the glacier ablation (Björnsson et al., 2013; Gunnarsson et al., 2020). There is, however, a large variability in the melting due to several factors. In some years, the spring is cool, so glacier ice appears later from beneath the snow. There can be snowfall on glaciers during the summer months that rapidly raises albedo and reduces melt. Dust and tephra from volcanic eruptions are blown around in the highlands in dry periods and are often deposited on the glaciers, enhancing the melt (Wittmann et al., 2017).
With more detailed information about the past mass changes of Icelandic glaciers, models for projecting their future evolution can be improved. The mass loss from glaciers in Iceland has been projected to continue in the coming decades (Flowers et al., 2005; Marshall et al., 2005; Aðalgeirsdóttir et al., 2006; Guðmundsson et al., 2009; Aðalgeirsdóttir et al., 2011; Schmidt et al., 2019). Mass-balance models have been coupled with ice-flow models, and scenarios for future climate have been applied to simulate past and future mass changes. Hofsjökull and Langjökull, which currently have more negative specific mass balance than Vatnajökull and are both smaller in area and with less ice thickness, are likely to lose about 60 and 80% of their mass, respectively, until the year 2100 (Guðmundsson et al., 2009; Thorsteinsson et al., 2013). The larger ice cap Vatnajökull will survive longer; it is projected to lose 20–30% of its mass until the end of the century. Its future after that will depend on how much warming will be realized (Schmidt et al., 2019). These studies are based on mass-balance models that do not take non-surface mass balance into account and they therefore have a tendency to underestimate the future glacier decline. The projected mass losses toward the end of the 21st century are more rapid and persistent than the observations presented here. In the period 1890–2019, Vatnajökull, Langjökull, and Hofsjökull lost 12 ± 4, 29 ± 8, and 25 ± 6%, respectively, relative to their estimated mass in 1890. The future mass loss will both be due to the already realized temperature increase (Mernild et al., 2013; Vaughan et al., 2013; Marzeion et al., 2018) and the projected continued warming. The glaciers are now in disequilibrium with the already realized warming (Christian et al., 2018), because of their several-decades-long response times (Jóhannesson et al., 1989; Harrison et al., 2001), and would continue to lose mass even if temperatures could be stabilized in the near future. The continued mass loss is dependent on future greenhouse gas emissions and whether, and if so how rapidly, they will be reduced.
Conclusion
Glaciers in Iceland are useful indicators of climate conditions in the middle of the North Atlantic Ocean. The results presented here add valuable information to global estimates of the response of glaciers to climate change in the past several decades. The study shows a total mass change of −540 ± 130 Gt (−4.2 ± 1.0 Gt
After 1995, we have detailed glaciological observations, made on ∼60 survey sites on Vatnajökull and ∼25 survey sites on each of Hofsjökull and Langjökull, which show mass loss every year until 2014. In 2014/15, high winter precipitation and reduced melt during a short and cold summer caused a single anomalous year with positive mass balance. There is large interannual variability that often is impacted by volcanic eruptions enhancing the melt and dust or volcanic tephra blown onto the glacier surface from their sediment-rich vicinity. The glaciological year 2018/19 was among the most negative mass-balance years that were not significantly impacted by volcanic eruptions but by dust blown onto the glacier surface.
The non-surface mass balance of glaciers in Iceland, as estimated by Jóhannesson et al. (2020), is non-negligible, accounting for about one-fifth of the mass loss since 1994. A part of this non-surface mass balance is caused by calving activity, which was insignificant in the first half of the 20th century, but has been gradually increasing with the ongoing retreat of the outlet glaciers located in over-deepened troughs (Guðmundsson et al., 2019). The calving will continue to increase as the glaciers retreat, and should, along with other non-surface mass-balance components, be taken into account in future projections of mass loss of glaciers in Iceland.
Data Availability Statement
The regional mass-balance record constructed here is provided in Supplementary Tables S1, S2, together with mass-change rates for various periods. A subset of the mass-balance observations from Vatnajökull, Hofsjökull, and Langjökull is submitted to the WGMS database on annual basis. The geodetic mass balance estimates from Belart et al. (2020) are in the last version of the WGMS database (10.5904/wgms-fog-2020-08). The outlines of glaciers in Iceland published by Hannesdóttir et al. (2020) are submitted to the GLIMS database. Glacier length changes measured by members of the Icelandic Glaciological Society are available at spordakost.jorfi.is.
Author Contributions
GA, FP, and EM designed the study, wrote the paper, and made the figures. HB and HHH designed, initiated, and led the Vatnajökull mass-balance work for decades and AG has facilitated the continuation of the mass-balance studies reported here. FP, EM, TT, TJ, AG, BE, HB, HH, HHH, and OS have conducted the in situ mass-balance measurements on the three main ice caps. HH, OS, EM, and JB contributed the area estimates at different times. JB, EM, EB, and TJ processed and contributed the geodetic estimates. LS contributed the simulations from HARMONIE–AROME. TJ contributed the non-surface mass-balance estimates. All authors contributed to discussions at various stages of the work and during the revisions of the manuscript.
Funding
This work and collection of data on which this work is based has been supported financially by and with the participation of the University of Iceland Research Fund; the National Power Company of Iceland; the Icelandic Public Road Administration; Iceland Glaciological Society; Reykjavík Energy Environmental and Energy Research Fund; three multinational European Union research projects TEMBA, ICEMASS, and SPICE; two projects supported by Nordic Energy Research: Climate and Energy (CE) and Climate and Energy Systems (CES); the Nordic Centre of Excellence SVALI (Stability and Variations of Arctic Land Ice), funded by the Nordic Top-level Research Initiative (TRI); and the Icelandic Ministry for the Environment and Natural Resources through the cooperative project Melting glaciers. SPOT6/7 data were obtained thanks to public funds received in the framework of GEOSUD, a project (ANR-10-EQPX-20) of the program “Investissements d’Avenir” managed by the French National Research Agency. EB acknoweldges support from the French Space Agency (CNES).
Conflict of Interest
The authors declare that the research was conducted in the absence of any commercial or financial relationships that could be constructed as a potential conflict of interest.
The handling editor declared a past co-authorship with one of the authors HH
Acknowledgments
We express our gratitude to Þorsteinn Jónsson, Hlynur Skagfjörð Pálsson, Sveinbjörn Steinþórsson, Vilhjálmur Kjartansson, members of the Iceland Glaciological Society, and many others for their important contributions during decades of mass-balance measurements in the field. We thank three reviewers and the scientific editor Michael Zemp for constructive comments on the manuscript.
Supplementary Material
The Supplementary Material for this article can be found online at: https://www.frontiersin.org/articles/10.3389/feart.2020.523646/full#supplementary-material
References
Aðalgeirsdóttir, G., Jóhannesson, T., Björnsson, H., Pálsson, F., and Sigurðsson, O. (2006). The response of Hofsjökull and southern Vatnajökull, Iceland, to climate change. J. Geophys. Res. 111, F03001. doi:10.1029/2005JF000388
Aðalgeirsdóttir, G., Guðmundsson, S., Björnsson, H., Pálsson, F., Jóhannesson, T., Hannesdóttir, H., et al. (2011). Modelling the 20th and 21st century evolution of Hoffellsjökull glacier, SE-Vatnajökull, Iceland. Cryosphere 5, 961–975. doi:10.5194/tc-5-961-2011
Ágústsson, H., Hannesdóttir, H., Thorsteinsson, T., Pálsson, F., and Oddsson, B. (2013). Mass balance of Mýrdalsjökull ice cap accumulation area and comparison of observed winter balance with simulated precipitation. Jökull 63, 91–104
Andreassen, L. M., Elvehøy, H., Kjøllmoen, B., and Belart, J. M. C. (2020). Glacier change in Norway since the 1960s—an overview of mass balance, area, length and surface elevation changes. J. Glaciol. 66, 313–328. doi:10.1017/jog.2020.10
Bahr, D. B., Meier, M. F., and Peckham, S. D. (1997). The physical basis of glacier volume–area scaling. J. Geophys. Res. 102 (B9), 20355–20362. doi:10.1029/97JB01696
Bahr, D. B., Pfeffer, W., and Kaser, G. (2015). A review of volume–area scaling of glaciers. Rev. Geophys. 63, 95–140. doi:10.1002/2014RG000470
Belart, J. M. C., Magnússon, E., Berthier, E., Pálsson, F., Aðalgeirsdóttir, G., and Jóhannesson, T. (2019). The geodetic mass balance of Eyjafjallajökull ice cap for 1945–2014: processing guidelines and relation to climate. J. Glaciol. 65, 395–409. doi:10.1017/jog.2019.16
Belart, J. M. C., Magnússon, E., Berthier, E., Gunnlaugsson, Á. Þ., Pálsson, F., Aðalgeirsdóttir, G., et al. (2020). Mass balance of 14 Icelandic glaciers, 1945–2017: spatial variations and links with climate. Front. Earth Sci. 8, 163. doi:10.3389/feart.2020.00163
Bjørk, A. A., Kjær, K. H., Korsgaard, N. J., Khan, S. A., Kjeldsen, K. K., Andresen, C. S., et al. (2012). An aerial view of 80 years of climate-related glacier fluctuations in southeast Greenland. Nat. Geosci. 5, 427–432. doi:10.1038/ngeo1481
Björnsson, H. (1986). Surface and bedrock topography of ice caps in Iceland, mapped by radio echo-sounding. Ann. Glaciol. 8, 11–18. doi:10.3189/S026030550000104X
Björnsson, H., and Pálsson, F. (2020). Radio-echo soundings on Icelandic temperate glaciers: history of techniques and findings. Ann. Glaciol. 61, 25–34. doi:10.1017/aog.2020.10
Björnsson, H., Pálsson, F., and Guðmundsson, M. T. (2000). Surface and bedrock topography of the Mýrdalsjökull ice cap, Iceland: the Katla caldera, eruption sites and routes of jökulhlaups. Jökull 49, 29–46.
Björnsson, H., Pálsson, F., and Guðmundsson, S. (2001). Jökulsárlón at Breiðamerkursandur, Vatnajökull, Iceland: 20th century changes and future outlook. Jökull 50, 1–18.
Björnsson, H., Pálsson, F., Guðmundsson, M. T., and Haraldsson, H. H. (1998). Mass balance of western and northern Vatnajökull, Iceland, 1991–1995. Jökull 45, 35–38.
Björnsson, H., Pálsson, F., Guðmundsson, M. T., and Haraldsson, H. H. (2002). Mass balance of Vatnajökull (1991–2001) and Langjökull (1996–2001), Iceland. Jökull 51, 75–78.
Björnsson, H., Pálsson, F., Guðmundsson, S., Magnússon, E., Aðalgeirsdóttir, G., Jóhannesson, T., et al. (2013). Contribution of Icelandic ice caps to sea level rise: trends and variability since the Little Ice Age. Geophys. Res. Lett. 40, 1–5. doi:10.1002/grl.50278
Björnsson, H., Pálsson, F., Sigurðsson, O., and Flowers, G. E. (2003). Surges of glaciers in Iceland. Ann. Glaciol. 36, 82–90. doi:10.3189/172756403781816365
Brun, F., Berthier, E., Wagnon, P., Kääb, A., and Treichler, D. (2017). A spatially resolved estimate of High Mountain Asia glacier mass balances from 2000 to 2016. Nat. Geosci. 10, 668–673. doi:10.1038/NGEO2999
Christian, J. E., Koutnik, M., and Roe, G. (2018). Committed retreat: controls on glacier disequilibrium in a warming climate. J. Glaciol. 64, 675–688. doi:10.1017/jog.2018.57
Ciracì, E., Velicogna, I., and Swenson, S. (2020). Continuity of the mass loss of the world’s glaciers and ice caps from the grace and grace follow-on missions. Geophys. Res. Lett. 47, GL086926. doi:10.1029/2019GL086926
Cogley, J., Hock, R., Rasmussen, L., Arendt, A., Bauder, A., Braithwaite, R., et al. (2011). Glossary of glacier mass balance and related terms (IHP-VII technical documents in hydrology No. 86, IACS contribution No. 2). Paris, France: UNESCO–IHP, 114.
Dragosics, M., Meinander, O., Jónsdóttir, T., Dürig, T., De Leeuw, G., Pálsson, F., et al. (2016). Insulation effects of Icelandic dust and volcanic ash on snow and ice. Arab. J. Geosci. 9, 126. doi:10.1007/s12517-015-2224-6
Farinotti, D., Huss, M., Fürst, J. J., Landmann, J., Machguth, H., Maussion, F., et al. (2019). A consensus estimate for the ice thickness distribution of all glaciers on Earth. Nat. Geosci. 12, 168–173. doi:10.1038/s41561-019-0300-3
Flowers, G., Marshall, S., Björnsson, H., and Clarke, G. (2005). Sensitivity of Vatnajökull ice cap hydrology and dynamics to climate warming over the next 2 centuries. J. Geophys. Res. 110, F02011. doi:10.1029/2004JF000200
Foresta, L., Gourmelen, N., Pálsson, F., Nienow, P., Björnsson, H., and Shepherd, A. (2016). Surface elevation change and mass balance of Icelandic ice caps derived from swath mode CryoSat-2 altimetry. Geophys. Res. Lett. 43, 12138–12145. doi:10.1002/2016GL071485
Gärtner-Roer, I., Naegeli, K., Huss, M., Knecht, T., Machguth, H., and Zemp, M. (2014). A database of worldwide glacier thickness observations. Glob. Planet. Change. 122, 330–344. doi:10.1016/j.gloplacha.2014.09.003
Gascoin, S., Guðmundsson, S., Aðalgeirsdóttir, G., Pálsson, F., Schmidt, L., Berthier, E., et al. (2017). Evaluation of MODIS albedo product over ice caps in Iceland and impact of volcanic eruptions on their albedo. Rem. Sens. 9 (5), 399. doi:10.3390/rs9050399
Geirsdóttir, Á., Miller, G. H., Axford, Y., and Ólafsdóttir, S. (2009). Holocene and latest Pleistocene climate and glacier fluctuations in Iceland. Quat. Sci. Rev. 28, 2107–2118. doi:10.1016/j.quascirev.2009.03.013
Guðmundsson, M. T., Sigmundsson, F., Björnsson, H., and Högnadóttir, Þ. (2004). The 1996 eruption at Gjálp, Vatnajökull ice cap, Iceland: course of events, efficiency of heat tranfer, ice deformation and subglacial water pressure. Bull. Volcanol. 66, 46–65. doi:10.1007/s00445-003-0295-9
Gudmundsson, M. T., Thordarson, T., Höskuldsson, A., Larsen, G., Björnsson, H., Prata, F. J., et al. (2012). Ash generation and distribution from the April–May 2010 eruption of Eyjafjallajökull, Iceland. Sci. Rep. 08, 572. doi:10.1038/srep00572
Guðmundsson, S., Björnsson, H., Aðalgeirsdóttir, G., Jóhannesson, T., Pálsson, F., and Sigurðsson, O. (2009). Similarities and differences in the response of two ice caps in Iceland to climate warming. Hydrol. Res. 40, 495–502. doi:10.2166/nh.2009.210
Guðmundsson, S., Björnsson, H., Pálsson, F., Magnússon, E., Sæmundsson, Þ., and Jóhannesson, T. (2019). Terminus lakes on the south side of Vatnajökull ice cap, SE-Iceland. Jökull 69, 1–34.
Gunnarsson, A., Gardarsson, S. M., Pálsson, F., Jóhannesson, T., and Sveinsson, O. G. B. (2020). Annual and interannual variability and trends of albedo for Icelandic glaciers. Cryosphere Discuss. 2020, 1–32. doi:10.5194/tc-2019-328
Hannesdóttir, H., Björnsson, H., Pálsson, F., Aðalgeirsdóttir, G., and Guðmundsson, S. (2015a). Changes in the southeast Vatnajökull ice cap, Iceland, between ∼1890 and 2010. Cryosphere 9, 565–585. doi:10.5194/tc-9-565-2015
Hannesdóttir, H., Björnsson, H., Pálsson, F., Aðalgeirsdóttir, G., and Guðmundsson, S. (2015b). Variations of southeast Vatnajökull ice cap (Iceland) 1650–1900 and reconstruction of the glacier surface geometry at the Little Ice Age maximum. Geogr. Ann. Phys. Geogr. 97, 237–264. doi:10.1111/geoa.12064
Hannesdóttir, H., Sigurðsson, O., Þrastarson, R. H., Guðmundsson, S., Belart, J. M. C., Pálsson, F., et al. (2020). Variations in glacier extent in Iceland since the end of the Little Ice Age. Jökull 639, 200929. doi:10.33799/jokull2020.70.001
Harrison, W. D., Elsberg, D. H., Echelmeyer, K. A., and Krimmel, R. M. (2001). On the characterization of glacier response by a single time-scale. J. Glaciol. 47, 659–664. doi:10.3189/172756501781831837
Hock, R., Rasul, G., Adler, C., Cáceres, B., Gruber, S., Hirabayashi, Y., et al. (2019). IPCC special report on the ocean and cryosphere in a changing climate. high mountain areas. IPCC. Available at: https://www.ipcc.ch/srocc/chapter/chapter-2/ (Accessed September 25, 2019).
Huss, M. (2013). Density assumptions for converting geodetic glacier volume change to mass change. Cryosphere 7, 877–887. doi:10.5194/tc-7-877-2013
Huss, M., and Farinotti, D. (2012). Distributed ice thickness and volume of all glaciers around the globe. J. Geophys. Res. Earth Surface. 117, F04010. doi:10.1029/2012JF002523
ICES (2018). Report No.: #331. ICES report on ocean climate. International council for the exploration of the sea area 3—Icelandic waters. Available at: doi:10.17895/ices.pub.4625 (Accessed March 21, 2018).
Jóhannesson, T., Björnsson, H., Magnússon, E., Guðmundsson, S., Pálsson, F., Sigurðsson, O., et al. (2013). Ice-volume changes, bias estimation of mass-balance measurements and changes in subglacial lakes derived by lidar mapping of the surface of Icelandic glaciers. Ann. Glaciol. 54, 63–74. doi:10.3189/2013AoG63A422
Jóhannesson, T., Pálmason, B., Hjartarson, Á., Jarosch, A., Magnússon, E., Belart, J., et al. (2020). Non-surface mass balance of glaciers in Iceland. J. Glaciol. 66, 685–697. doi:10.1017/jog.2020.37
Jóhannesson, T., Raymond, C., and Waddington, E. (1989). Time–scale for adjustment of glaciers to changes in mass balance. J. Glaciol. 35, 355–369. doi:10.3189/S002214300000928X
Korona, J., Berthier, E., Bernard, M., Remy, F., and Thouvenot, E. (2009). SPIRIT. SPOT 5 stereoscopic survey of polar ice: reference images and topographies during the fourth international polar year (2007–2009). ISPRS J. Photogramm. Remote Sens. 64, 204–212. doi:10.1016/j.isprsjprs.2008.10.005
Leclercq, P. W., Oerlemans, J., and Cogley, J. G. (2011). Estimating the glacier contribution to sea-level rise for the period 1800–2005. Surv. Geophys. 32, 519. doi:10.1007/s10712-011-9121-7
Magnússon, E., Belart, J., Pálsson, F., Ágústsson, H., and Crochet, P. (2016). Geodetic mass balance record with rigorous uncertainty estimates deduced from aerial photographs and lidar data – case study from Drangajökull ice cap, NW Iceland. Cryosphere 10, 159–177. doi:10.5194/tc-10-159-2016
Marshall, S. J., Björnsson, H., Flowers, G. E., and Clarke, G. K. C. (2005). Simulation of vatnajökull ice cap dynamics. J. Geophys. Res. Earth Surface. 110, F03009. doi:10.1029/2004JF000262
Marzeion, B., Jarosch, A. H., and Hofer, M. (2012). Past and future sea-level change from the surface mass balance of glaciers. Cryosphere 6, 1295–1322. doi:10.5194/tc-6-1295-2012
Marzeion, B., Leclercq, P. W., Cogley, J. G., and Jarosch, A. H. (2015). Brief communication: global reconstructions of glacier mass change during the 20th century are consistent. Cryosphere 9, 2399–2404. doi:10.5194/tc-9-2399-2015
Marzeion, B., Kaser, G., and Maussion, F. (2018). Limited influence of climate change mitigation on short-term glacier mass loss. Nat. Clim. Change. 8, 305–308. doi:10.1038/s41558-018-0093-1
Meredith, M., Sommerkorn, M., Cassotta, S., Derksen, C., Ekaykin, A., Hollowed, A., et al. (2019). IPCC special report on the oceans and cryosphere in a changing climate. polar regions. Available at: https://www.ipcc.ch/srocc/chapter/chapter-3-2/ (Accessed September 25, 2019).
Mernild, S. H., Lipscomb, W. H., Bahr, D. B., Radić, V., and Zemp, M. (2013). Global glacier changes: a revised assessment of committed mass losses and sampling uncertainties. Cryosphere 7, 1565–1577. doi:10.5194/tc-7-1565-2013
Möller, M., and Kohler, J. (2018). Differing climatic mass balance evolution across Svalbard glacier regions over 1900–2010. Front. Earth Sci. 6, 128. doi:10.3389/feart.2018.00128
Möller, R., Dagsson-Waldhauserova, P., Möller, M., Kukla, P. A., Schneider, C., and Gudmundsson, M. T. (2019). Persistent albedo reduction on southern Icelandic glaciers due to ashfall from the 2010 Eyjafjallajökull eruption. Remote Sens. Environ. 233, 111396. doi:10.1016/j.rse.2019.111396
Möller, R., Möller, M., Kukla, P. A., and Schneider, C. (2016). Impact of supraglacial deposits of tephra from Grímsvötn volcano, Iceland, on glacier ablation. J. Glaciol. 62, 933–943. doi:10.1017/jog.2016.82
Morris, A., Moholdt, G., and Gray, L. (2020). Spread of Svalbard glacier mass loss to Barents Sea margins revealed by CryoSat-2. J. Geophys. Res.: Earth Surface. 125, e2019jf005357. doi:10.1029/2019JF005357
Nilsson, J., Sandberg Sørensen, L., Barletta, V. R., and Forsberg, R. (2015). Mass changes in Arctic ice caps and glaciers: implications of regionalizing elevation changes. Cryosphere 9, 139–150. doi:10.5194/tc-9-139-2015
Østby, T. I., Schuler, T. V., Hagen, J. O., Hock, R., Kohler, J., and Reijmer, C. H. (2017). Diagnosing the decline in climatic mass balance of glaciers in Svalbard over 1957–2014. Cryosphere 11, 191–215. doi:10.5194/tc-11-191-2017
Østrem, G., and Brugman, M. (1991). Report No.: 4. glacier mass-balance measurements: a Manual for Field and Office work. 234 (Oslo, Norwegian water resources and energy administration, and Saskatoon, Canada, national hydrology research institute. NHRI science. Available at: https://wgms.ch/downloads/Oestrem_Brugman_GlacierMassBalanceMeasurements_1991.pdf (Accessed March, 1996).
Pálsson, F., Guðmundsson, S., Björnsson, H., Berthier, E., Magnússon, E., Guðmundsson, S., et al. (2012). Mass and volume changes of Langjökull ice cap, Iceland, ∼1890 to 2009, deduced from old maps, satellite images and in situ mass balance measurements. Jökull 62, 81–96.
Radić, V., and Hock, R. (2010). Regional and global volumes of glaciers derived from statistical upscaling of glacier inventory data. J. Geophys. Res.: Earth Surface. 115, F01010. doi:10.1029/2009JF001373
Sasgen, I., Wouters, B., Gardner, A. S., King, M., Tedesco, M., Landerer, F. W., et al. (2020). Return to rapid ice loss in Greenland and record loss in 2019 detected by the GRACE-FO satellites. Commun. Earth Environ. 1, 8. doi:10.1038/s43247-020-0010-1
Schmidt, L. S., Aðalgeirsdóttir, G., Guðmundsson, S., Langen, P. L., Pálsson, F., Mottram, R., et al. (2017). The importance of accurate glacier albedo for estimates of surface mass balance on Vatnajökull: evaluating the surface energy budget in a regional climate model with automatic weather station observations. Cryosphere 11, 1665–1684. doi:10.5194/tc-11-1665-2017
Schmidt, L. S., Aðalgeirsdóttir, G., Pálsson, F., Langen, P. L., Guðmundsson, S., and Björnsson, H. (2019). Dynamic simulations of Vatnajökull ice cap from 1980 to 2300. J. Glaciol. 66, 97–112. doi:10.1017/jog.2019.90
Schmidt, L. S., Langen, P. L., Aðalgeirsdóttir, G., Pálsson, F., Guðmundsson, S., and Gunnarsson, A. (2018). Sensitivity of glacier runoff to winter snow thickness investigated for Vatnajökull ice cap, Iceland, using numerical models and observations. Atmosphere 9, 450. doi:10.3390/atmos9110450
Schuler, T. V., Kohler, J., Elagina, N., Hagen, J. O. M., Hodson, A. J., Jania, J. A., et al. (2020). Reconciling Svalbard glacier mass balance. Front. Earth Sci. 8, 156. doi:10.3389/feart.2020.00156
Shean, D. E., Bhushan, S., Montesano, P., Rounce, D. R., Arendt, A., and Osmanoglu, B. (2020). A systematic, regional assessment of High Mountain Asia glacier mass balance. Front. Earth Sci. 7, 363. doi:10.3389/feart.2019.00363
Shepherd, A., Ivins, E., Rignot, E., Smith, B., van den Broeke, M., Velicogna, I., et al. (2019). Mass balance of the Greenland ice Sheet from 1992 to 2018. Nature 579, 233–239. doi:10.1038/s41586-019-1855-2
Sigurðsson, O. (2005). “Variations of termini of glaciers in Iceland in recent centuries and their connection with climate,” in Iceland—modern processes and past environment. Editors Caseldine, C., Russell, A., Harðardóttir, J., and Knudsen, O. (Amsterdam, Netherlands:Elsevier), 241–255.
Sigurðsson, O., and Williams, R. (2008). “Geographic names of Iceland’s glaciers,” in Historic and modern (Washington: U.S. Geological Survey Professional Paper), 1746.
Sigurðsson, O., Williams, R. S., and Víkingsson, S. (2017). Jöklakort af íslandi/map of the glaciers of Iceland. scale 1:500,000, with two inset maps of 1:250,000, Tröllaskagi and Kerlingarfjöll, with accompanying illustrated pamphlet, and list of glacier place-names. 2nd Edn. Reykjavík, Veðurstofa Íslands: National Energy Authority, 6. [Dataset].
Sørensen, L. S., Jarosch, A. H., Aðalgeirsdóttir, G., Barletta, V. R., Forsberg, R., Pálsson, F., et al. (2017). The effect of signal leakage and glacial isostatic rebound on GRACE-derived ice mass changes in Iceland. Geophys. J. Int. 209, 226–233. doi:10.1093/gji/ggx008
Tedesco, M., and Fettweis, X. (2020). Unprecedented atmospheric conditions (1948–2019) drive the 2019 exceptional melting season over the Greenland ice sheet. Cryosphere 14, 1209–1223. doi:10.5194/tc-14-1209-2020
Thorarinsson, S. (1940). Present glacier shrinkage, and eustatic changes of sea-level. Geogr. Ann. 22, 131–159. doi:10.1080/20014422.1940.11880686
Thorarinsson, S. (1943). Chapter XI. Oscillations of the Iceland glaciers in the last 250 years. Geogr. Ann. 25, 1–54. doi:10.1080/20014422.1943.11880716
Thorsteinsson, T., Jóhannesson, T., and Snorrason, Á. (2013). Glaciers and ice caps: vulnerable water resources in a warming climate. Curr. Opin. Env. Sust. 5, 590–598. doi:10.1016/j.cosust.2013.11.003
Thorsteinsson, T., Jóhannesson, T., Sigurðsson, O., and Einarsson, B. (2017). Tech. Rep., ví 2017-016. Afkomumælingar á Hofsjökli 1988–2017 (mass balance Measurements on Hofsjökull 1988–2017). Reykjavík, Iceland: Icelandic Meteorological Office, 84.
Vaughan, D., Comiso, J., Allison, I., Carrasco, J., Kaser, G., Kwok, R., et al. (2013). Climate change 2013: the physical science basis. Contribution of working group I to the fifth assessment report of the intergovernmental panel on climate change. Cambridge, United Kingdom: Cambridge University Press.
Velicogna, I., Mohajerani, Y., Geruo, A., Landerer, F., Mouginot, J., Noel, B., et al. (2020). Continuity of ice sheet mass loss in Greenland and Antarctica from the grace and grace follow-on missions. Geophys. Res. Lett. 47, GL087291. doi:10.1029/2020GL087291
von Hippel, M., and Harig, C. (2019). Long-term and inter-annual mass changes in the Iceland ice cap determined from GRACE gravity using Slepian functions. Front. Earth Sci. 7, 171. doi:10.3389/feart.2019.00171
Weber, P., Boston, C. M., Lovell, H., and Andreassen, L. M. (2019). Evolution of the Norwegian plateau icefield Hardangerjøkulen since the “little ice age”. Holocene 29, 1885–1905. doi:10.1177/0959683619865601
Wittmann, M., Zwaaftink, C. D. G., Schmidt, L., Guðmundsson, S., Pálsson, F., Arnalds, O., et al. (2017). Impact of dust deposition on the albedo of Vatnajökull ice cap, Iceland. Cryosphere 11, 741–754. doi:10.5194/tc-11-741-2017
Wouters, B., Gardner, A. S., and Moholdt, G. (2019). Global glacier mass loss during the GRACE satellite mission (2002–2016). Front. Earth Sci. 7, 96. doi:10.3389/feart.2019.00096
Zamolo, A. (2019). Glacier mass balance and ice-volcano interactions of the Vatnajökull Ice Cap (Iceland) from SPOT 6/7 and LiDAR DEM differencing. Master’s thesis. Talence, France: Bordeaux INP ENSEGID.
Zemp, M., Frey, H., Gärtner-Roer, I., Nussbaumer, S. U., Hoelzle, M., Paul, F., et al. (2015). Historically unprecedented global glacier decline in the early 21st century. J. Glaciol. 61, 745–762. doi:10.3189/2015JoG15J017
Zemp, M., Huss, M., Thibert, E., Eckert, N., McNabb, R., Huber, J., et al. (2019). Global glacier mass changes and their contributions to sea-level rise from 1961 to 2016. Nature 568, 382–386. doi:10.1038/s41586-019-1071-0
Zemp, M., Gärtner-Roer, I., Nussbaumer, S. U., Bannwart, J., Rastner, P., Paul, F., et al. (Editors) (2020a). WGMS 2020. Global glacier change bulletin No. 3 (2016–2017). Zurich, Switzerland: CSU(WDS)/IUGG(IACS)/UNEP/UNESCO/WMO, World Glacier Monitoring Service, 274. [Dataset].
Keywords: mass balance, glaciers, climate, Iceland, glacier–climate relationship
Citation: Aðalgeirsdóttir G, Magnússon E, Pálsson F, Thorsteinsson T, Belart JMC, Jóhannesson T, Hannesdóttir H, Sigurðsson O, Gunnarsson A, Einarsson B, Berthier E, Schmidt LS, Haraldsson HH and Björnsson H (2020) Glacier Changes in Iceland From ∼1890 to 2019. Front. Earth Sci. 8:574754. doi: 10.3389/feart.2020.523646
Received: 30 December 2019; Accepted: 13 October 2020;
Published: 26 November 2020.
Edited by:
Michael Zemp, University of Zurich, SwitzerlandReviewed by:
Tom Holt, Aberystwyth University, United KingdomJon Ove Methlie Hagen, University of Oslo, Norway
Copyright © 2020 Aðalgeirsdóttir, Magnússon, Pálsson, Thorsteinsson, Belart, Jóhannesson, Hannesdóttir, Sigurðsson, Gunnarsson, Einarsson, Berthier, Schmidt, Haraldsson and Björnsson. This is an open-access article distributed under the terms of the Creative Commons Attribution License (CC BY). The use, distribution or reproduction in other forums is permitted, provided the original author(s) and the copyright owner(s) are credited and that the original publication in this journal is cited, in accordance with accepted academic practice. No use, distribution or reproduction is permitted which does not comply with these terms.
*Correspondence: Guðfinna Aðalgeirsdóttir, gua@hi.is