Risk Assessment of Dam-Breach Flood Under Extreme Storm Events
 Xiajing Lin
 Guohe Huang
 Guoqing Wang
 Denghua Yan4
 - 1Faculty of Engineering and Applied Science, University of Regina, Regina, SK, Canada
- 2State Key Joint Laboratory of Environmental Simulation and Pollution Control, China-Canada Center for Energy, Environment and Ecology Research, UR-BNU, School of Environment, Beijing Normal University, Beijing, China
- 3State Key Laboratory of Hydrology-Water Resources and Hydraulic Engineering, Nanjing Hydraulic Research Institute, Nanjing, China
- 4China Institute of Water Resources and Hydropower Research, Beijing, China
In recent years, as a result of increasingly intensive rainfall events, the associated water erosion and corrosion have led to the increase in breach risk of aging dams in the United States. In this study, a hydrodynamic model was used to the inundation simulation under three hypothetical extreme precipitation-induced homogeneous concrete dam-breach scenarios. All hydraulic variables, including water depth, flow velocity, and flood arriving time over separated nine cross-sections in the Catawba River, were calculated. The hypothetical simulation results illustrate that the impact of Hurricane Florence’s rainfall is far more severe over the downstream of hydraulic facilities than that of the Once-in-a-century storm rainfall event. Although Hurricane Florence’s rainfall observed in Wilmington had not historically happened near the MI Dam site, the river basin has a higher probability to be attacked by such storm rainfall if more extreme weather events would be generated under future warming conditions. Besides, the time for floodwaters to reach cross-section 6 under the Hurricane Gustav scenario is shorter than that under the Once-in-a-century rainfall scenario, making the downstream be inundated in short minutes. Since the probability can be quantitatively evaluated, it is of great worth assessing the risk of dam-break floods in coastal cities where human lives are at a vulnerable stage.
Introduction
Heretofore, about 87,000 dams have been built in the United States, which control 600,000 miles (970,000 km) of rivers (Figure 1) (Infrastructure Report Card, 2017). However, most dams in the United States have been built for nearly 100 years or even more, and thousands of dams have been listed as high-risk dams, all of which are facing the risk of failure (Chen and Hossain, 2019). Such man-made structures are more likely to fail when they become older, as they will not be able to withstand today’s warmer climate and associated extreme weather events (Mallakpour et al., 2019). For instance, extreme rainfall events, such as hurricanes, tropical cyclones, and typhoon-induced precipitation, may attribute to dam failures and lead to devastating inundation disasters (Hill and Lackmann, 2011). Such dam failures including overtopping and piping failures frequently occurred when the accumulated floods came from the high stage level of the river. The inundation disasters caused by those hydrological failures are short in duration, fast in speed, and large in flow, and its harm to the protection area is far greater than that of the general flood. Therefore, analyzing the dam breach flood vulnerability under extreme storm events is of vital importance.
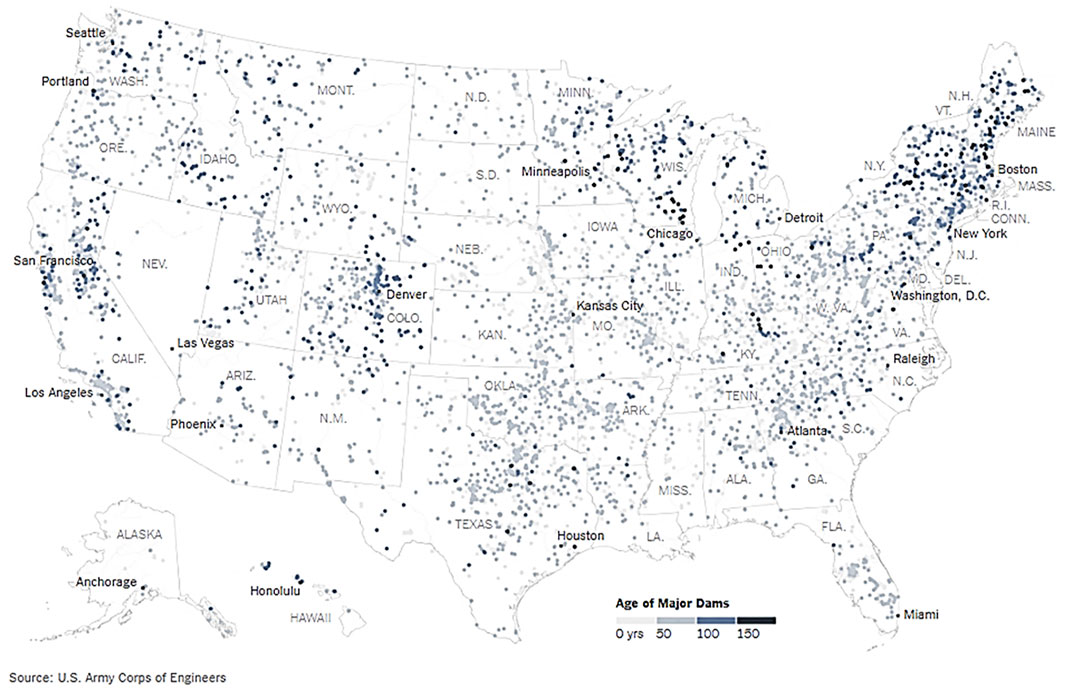
FIGURE 1. America’s aging dams and distribution (data source: https://www.nytimes.com).
The dam breach simulations were challenging due to the accuracy of extreme flood estimates and time step definition (Chaudhuri et al., 2020; Yu et al., 2020). Various multidimensional hydrodynamic models, thus, have been designed to simulate extreme events through evaluating flood timing and inundation areas. Models such as HEC-RAS, DAMBRK, FLO-2D, and MIKE are commonly used when it comes to deal with hypothetical dam-breach events. Yang et al. developed a three-dimensional river flood plain on the national river system in southern Canada (Yang et al., 2006). The HEC-RAS model was used to simulate the flood by generating the plane diagram of six differently designed storm events with return periods of 100, 50, 25, 10, 5, and 2 years (Yang et al., 2006). Lodhi et al. conducted a proposed dam breach flood simulation under series of scenarios over River Yamuna, India (Lodhi and Agrawal, 2012). The hydrological DAMBRK model and ArcGIS were adopted for mapping the flood inundated areas in the downstream of the dam site (Lodhi and Agrawal, 2012). The authors used the deterministic method to calculate the possible maximum flood (PMF) based on a 1000-year recurrence period under various dam failure scenarios. Ganiyu et al. carried out a hypothetical dam-breach case study in Asa Dam, Nigeria, through assessing the flood hazard along the approximately 12 km river channel by using the HEC-RAS and HEC-GeoRAS models. The unsteady flow simulation was modeled with Once-in-a-century 24-h flow event data based on the digital terrain model from USGS (Ganiyu, 2018).
Despite previous studies involving the risk of extreme rainfall/flood events with different return periods, they have been examined in various watersheds in the United States by using the hydrodynamic models; few studies have been conducted to assess the flood risk to specific dams in consideration of hurricane event–induced rainfall. As an extension of the previous research, the overall objective of this study was to evaluate the dam-break floodwater hydrograph and routing through the downstream valley and floodplain. In detail, the two-dimensional dam-breach inundation simulation and downstream vulnerability assessment under three extreme storm rainfall scenarios were conducted. The inundation depths, resulting damages to the downstream communities, and potential affecting areas over the watershed were comprehensively evaluated. The hypothetical dam-breach scenarios of the Mountain Island dam (MI Dam, MI Lake, North Carolina (NC), United States) were analyzed using the HEC-RAS model in conjunction with the ArcGIS pro.
Materials and Methods
Study Area
It is identified that 168 high-hazard dams have been found in poor or unsatisfactory condition in North Carolina as climate change induces rainstorms to be generated more frequently and put those dams under the dangerous state (Dalesio, 2019). As recorded, at least 18 dams failed in NC as floodwaters from Hurricane Matthew and Hurricane Florence attacked the inland. The water levels at MI Lake have been rising in recent years, especially during heavy rain seasons. Since the construction year of the MI dam (1924) was much earlier than that of the Cowans Ford dam (1963), its flood controlling capacity is significantly inadequate to meet the peak discharge coming from the upstream. It poses a great threat to the safety of life and property of the residents along the river, especially when the extreme storms attack inland.
In this study, we propose various hypothetical dam-breach scenarios over the high-risk dam which is the MI Dam in MI Lake. MI Lake, with a water area of 112 km2, is a large sub-lake of the Catawba River in North Carolina, United States. The flows of MI Lake into Catawba River are governed by the releases from the MI Dam on MI Lake, with over 85% of the total inflow to the reservoir coming from Lake Norman regulated by Cowans Ford Dam (Dalesio, 2019). The terrain distribution of this study area is shown in Figure 2, and the generated nine cross-sections are shown in Figure 3 for further discussion.
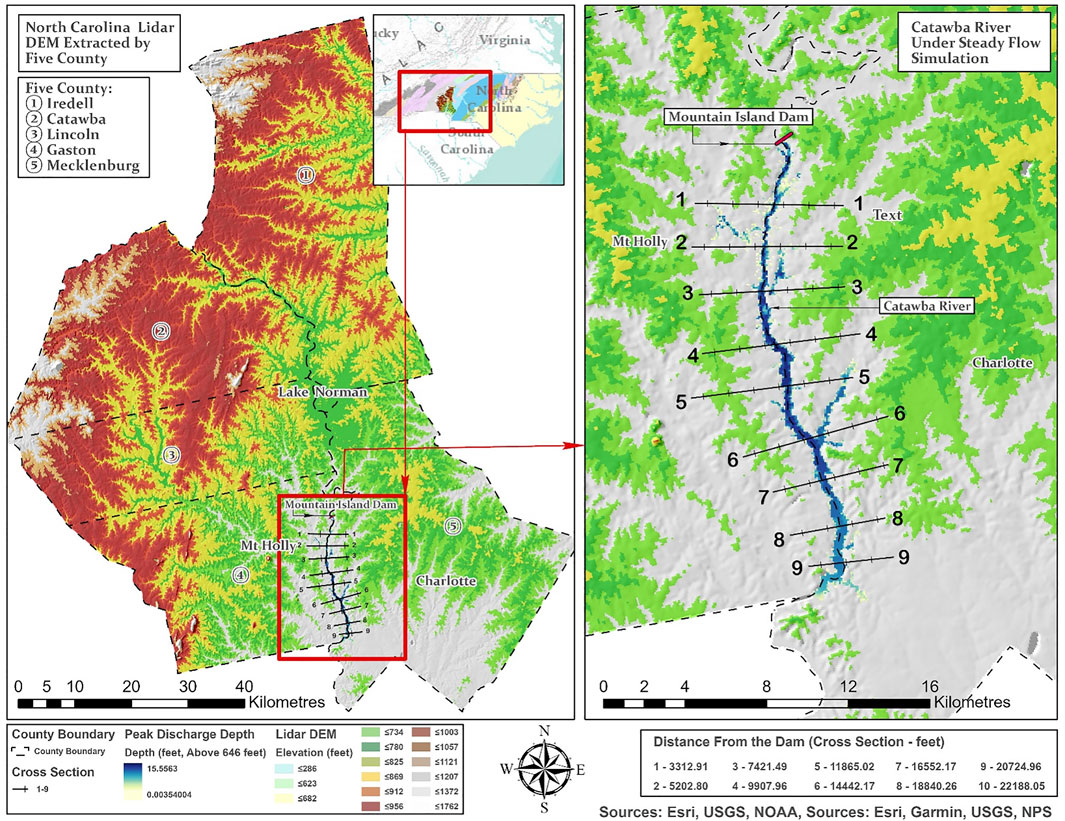
FIGURE 2. Study area.
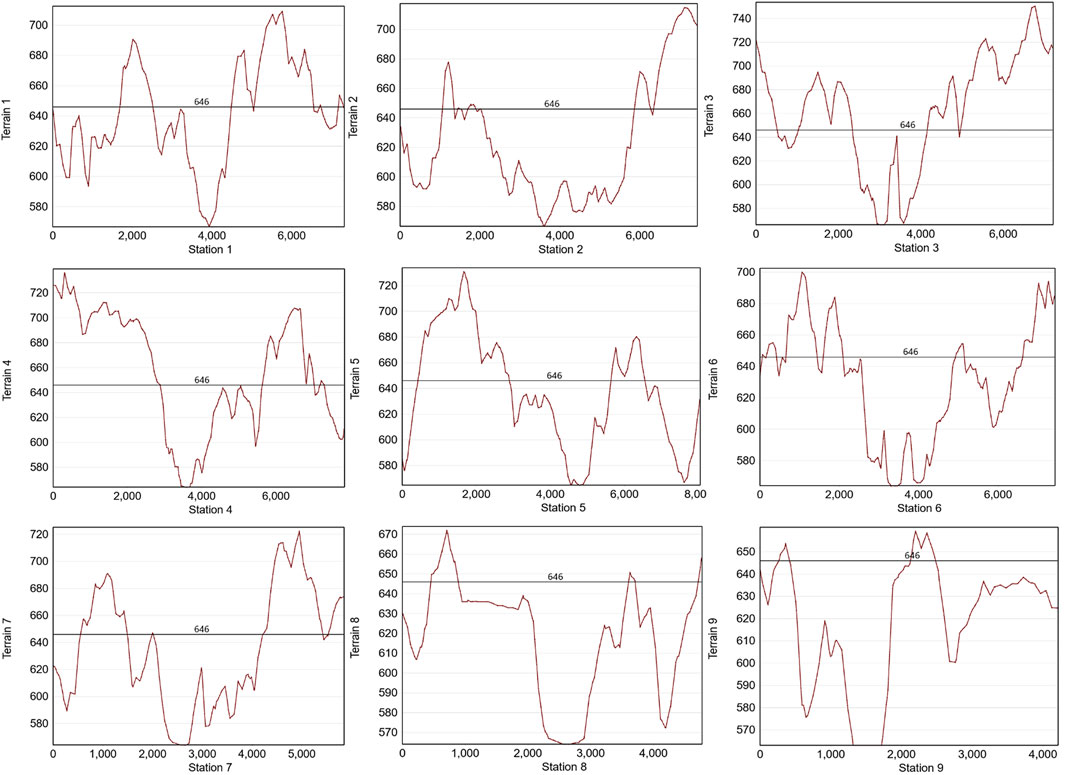
FIGURE 3. Terrain over cross-sections 1–9
Hydrodynamic Model
The risk analysis of dam-break flood is considered as a more urgent topic with the development of social economy, as the population and social wealth are more concentrated in the lower reaches of the reservoir (Bales et al., 2001; Mohsin and Muhammad Umar, 2013; Balogun and Ganiyu, 2017). However, the occurrence of the dam break and the formation of the associated flood are unsteady and unpredictable, which poses threat to the safety of life (Asnaashari et al., 2014; Derdous et al., 2015). In fact, the computational simulation procedure of dam-break flood is complicated as it is necessary to calculate the maximum peak discharge and flood process at the dam site, as well as the flood evolution process and inundation situation in the downstream of the dam. Therefore, numerical hydrodynamic models have been considered for evaluating the dam-break flood and stream routing, and we mainly assess the performance of the HEC-RAS model in this case study.
A hydrodynamic model is mainly composed of the upper and lower boundary conditions, initial conditions, calculation area, and other parts, which are interrelated to form a whole model. It is very interesting to calculate the grid with the two-dimensional model of RAS. It is specially stated in the HEC-RAS official manual that its calculation grid uses a kind of technology called “subgrid.” The hydraulic characteristics such as elevation–wet cycle, elevation–roughness, and elevation–cross-section area can be extracted by the edge of each cell grid and then be integrated into the calculation (Brunner et al., 2016). Most of the cell grids of hydrodynamic models can only extract the elevation of the endpoint, the center points, and interpolate the plane in a single grid. The spatial scale of the grid has thus become the main sensitive factor (Brunner et al., 2016). However, HEC-RAS can extract more terrain details within the same scale grid, which is less sensitive to spatial step size. Hence, HEC-RAS ensures the accuracy of the results in the case of large-scale spatial grids and enables the interior of a single grid to be partially submerged, which saves quantities of computational time.
The HEC-RAS two-dimensional model computations currently consist of only two equations, the complete shallow water equation and the diffusion wave equation, which is simplified from the former and omits the inertial action, turbulence, and Coriolis effect. The diffusion wave hypothesis is subjected only to gravity, friction, and water pressure (Brunner et al., 2016). The diffusion wave equation has a fast convergence rate, small error, and narrow application range. However, the diffusion wave equation is hardly used in dam-break flood simulation. In addition, there are many conditions under which diffusion wave equations cannot be used, and the RAS manual explains more details in the scope of its application (Brunner et al., 2016).
The hydrodynamic simulation of dam break is generally divided into two methods: integral method and stepwise method. The integral method is to couple the dam-break model with the hydrodynamic model. The whole model simulates the dam-break process to solve the flow process of the breach, and simultaneously calculate the corresponding downstream flood evolution in the same time step. Such models generally require separate models of reservoirs and dams. At this point, the upper boundary condition of the integral model is usually the reservoir inflow or the upstream channel of the reservoir. The stepwise method separates dam-break simulation from flood evolution. The process of simulating and calculating the flow rate of the dam break is completed externally. It is imported as the condition of the upper boundary, which should be located at the dam site, which does not depend on specific model functions.
In this case study, the hypothetical dam-break flood simulation adopts the integral method. The model elements are divided into the reservoir, dam, and downstream influence area. There are no tributaries and downstream reservoirs, and the downstream impact area is simulated with a single two-dimensional grid.
Data Source
When the interpolated surface is generated from elevation points, both the MIKE and TELEMAC hydrodynamic models can read the elevation point format, and the elevation can then be assigned to the computational grid. However, HEC-RAS currently does not have this capability and can only read the interpolated/ completed topographic surface data, which means that no missing values are allowed before input to HEC-RAS. This would directly lead to a computational failure (Brunner et al., 2016).
The spatial radar mapping of SRTM30 and SRTM90 has a large scale of topographic data with low accuracy. The spatial resolution of DEM is generally around 30 m with a small number of missing values, especially in some places such as river channels and embankments. However, the losses can be very severe. At this point, another type of data source lays the foundation for more accurate simulation of RAS. This is a high-resolution DEM generated from point cloud data scanned by a LiDAR system, which has extremely high accuracy. The spatial resolution of the DEMs generated by the LiDAR system for the river and its banks is currently about 1 m. In fact, the “subgrid” technology in HEC-RAS is prepared for this high-resolution DEM. In the general hydrodynamic model, in order to better fit the terrain in the high-resolution DEM, the computational grid space ratio is set to be relatively small, which will significantly prolong the simulation time. The “subgrid” technique of HEC-RAS achieves similar terrain fitting effect in large-scale grid.
Satellite Images, Terrain Data, and Hydrological Boundary Conditions
The satellite images and land cover of North Carolina were obtained from USGS, and the coordinate system for the NC region was acquired from EPSG (number at 32,119). The hydrological and climate station observations and historical/real-time runoff datasets were retrieved from USGS at https://waterwatch.usgs.gov. The daily precipitation reanalysis is from the North American Regional Reanalysis (NARR,https://www.ncdc.noaa.gov/data-access/model-data/model-datasets/north-american-regional-reanalysis-narr). The interpolated high-resolution Lidar DEM (20 foot) was attained from North Carolina One Map (https://www.nconemap.gov) and used as the geometric raster input data for HEC-RAS simulation. The precipitation records of three designed extreme storm scenarios were regarded as the input boundary conditions.
Dam Parameters
The MI Dam parameters were retrieved from the website at http://mountain-island.lakesonline.com/Dam/3AE5F61F-AD60-4BA4-B6B5-189EA16B095F/.
Simulation Process
In this case, the homogeneous concrete dam will be arranged downstream. The HEC-RAS hydrodynamic model will be used to create an inundation map under the overtopped dam failure scenarios. The initial water level of the reservoir is 96 ft (elevation 646 ft). The flowchart of idealized overtopped dam-break simulations under extreme precipitation scenarios is shown in Figure 4. Here, four separate steps have been conducted for the dam-break flood simulation in HEC-RAS and ArcGIS pro, including preprocessing, reservoir modeling, dam modeling, and boundary and initial conditions setting. The idealized dam-break case 2D model validation results are shown in Table 1.
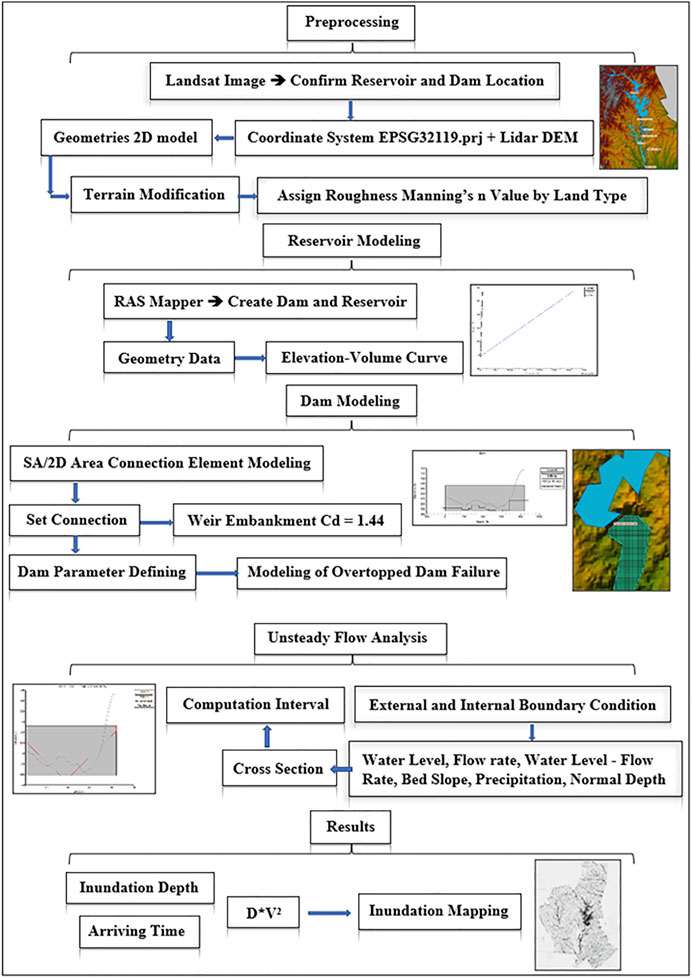
FIGURE 4. Flowchart of dam-break flood simulation.
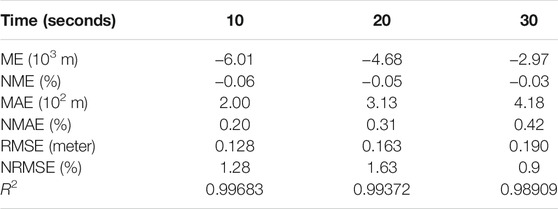
TABLE 1. Water depth goodness-of-fit statistics for the idealized dam-break case (Balogun and Ganiyu, 2017).
First Step: Preprocessing. Landsat images were loaded to confirm the location of reservoir and dam in the preprocessing step. Lidar DEMs (20 ft) provided by the NC one mapping organization were incorporated with the North Carolina coordinate system (EPSG32119.prj) in HEC-RAS. A new geometric 2D model was then created in the raster map associated with the raster elements (MI dam, Catawba River basin, MI Lake inundation area, Cowans Ford dam). The generated river topography by interpolation based on river segments, is allowed to be modified in RAS. Land-use maps in the raster format were introduced on the maps, and roughness manning’s n values were assigned by the land type (Table 2).
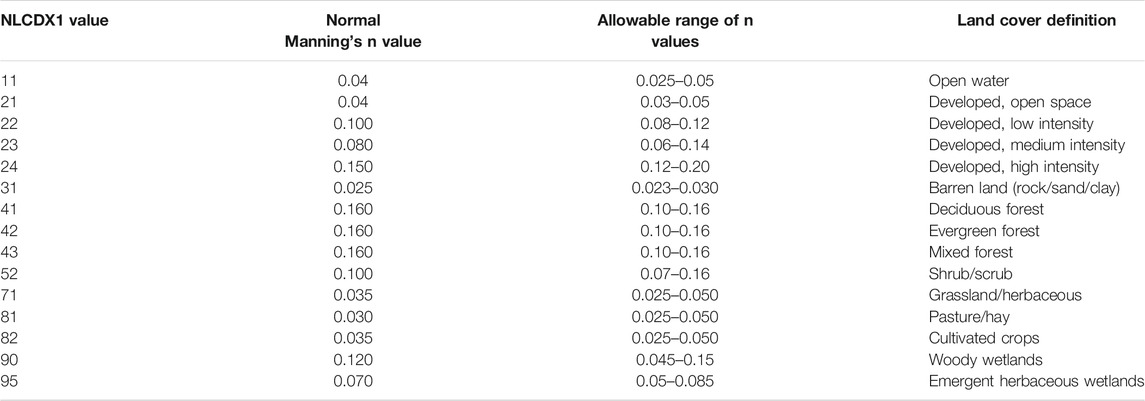
TABLE 2. Manning’s n values for various land covers (Balogun and Ganiyu, 2017).
First Step: Reservoir Modeling. The dam and reservoir element layers are created in the RAS Mapper as two-dimensional connections, storage areas, and two-dimensional flow area geometric input data. According to the relationship between reservoir characteristic water level (dead water level, normal water level, designed flood level, and checked flood level) and corresponding storage capacity, the elevation—volume curve (water level—storage capacity) of the reservoir is fitted with a quadratic curve. The reference equation is as follows (Brunner et al., 2016):
where W is the storage capacity; P1, P2, and P3 are the coefficients of quadratic function; h is the characteristic water level; and Hr is the dead water level.
Third Step: Dam Modeling. The SA/2D regional connection cell modeling is performed by giving the dam connections between each reservoir and setting the weir embankment Cd = 1.44. The dam breach modeling is performed in the diffuse top mode (overtopping failure). The dam parameters were set to include the breach bottom elevation, pool elevation, pool volume, inlet, bottom elevation, bottom width, and left- and right-side slopes H:V. The diffuse top failure mode is calculated according to the Von Thun & Gillete Function (Brunner et al., 2016).
Last Step: Unsteady Flow Analysis. The unsteady flow (non-constant flow) analysis was performed under external and internal boundary conditions, including water level, flow velocity, water level flow rate, streambed slope, precipitation, and normal depth at each cross-section. The calculation interval was set to 1 min. Non-constant flow simulations were performed based on the incompressible flow assumption. The differential form of the mass continuity equation is as follows (Brunner et al., 2016):
where t is the time, u and v are the velocities in two dimension, and q is the sink flux term.
Results
Dam Failure Scenarios
Once-in-a-Century Storm Rainfall Induced Dam Break Flood Scenario
The intensity–duration–frequency curve (IDF curve) is an engineering mathematical function based on time series, which links rainfall intensity (inches/hour) with its duration (minutes) and frequency (return period). The IDF curves are frequently used in the civil engineering of hydrological flood forecast and urban drainage design, especially as an evaluation index for the flood resistance capacity of the dam (Wang et al., 2014). Here, the IDF curves are obtained through the frequency analysis of historically observed meteorological station precipitation.
The empirical plotting position approach (Dettinger et al., 2018) was applied to measure the 2-, 10-, and 50-year historical 6-h storm rainfall events by computing the P (probability)-T (return period) relationship associated with each rainfall volume by the corresponding duration. The Once-in-a-century storm rainfall intensity can be obtained in every minute by a linear relationship with the larger exceedance probability. The historical annual maximum daily precipitation records during 1983–2009 are shown in Figure 5. The computed 6-h extreme rainfall distribution, accumulated storm rainfall depth, and storm rainfall intensity corresponding to each return period are shown in Figure 6.
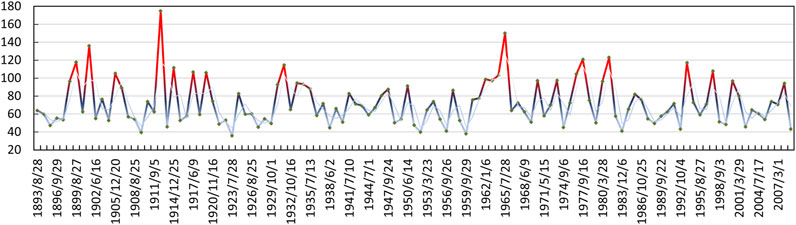
FIGURE 5. Highest rainfall record (mm) by each year in Charlotte City of North Carolina.
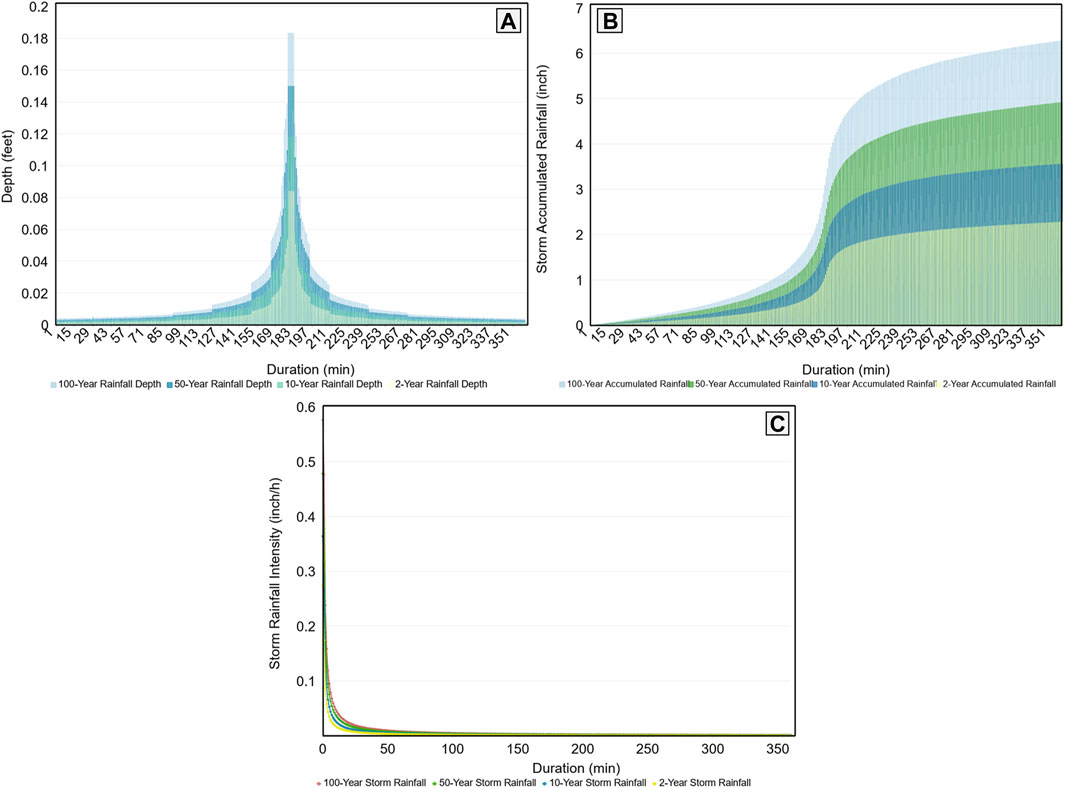
FIGURE 6. (A) 6-hour storm rainfall depth by different return periods; (B) 6-hour storm accumulated rainfall depth by different return periods; (C) 6-hour storm rainfall intensity–duration–frequency curve.
Hurricane Rainfall Induced Dam Break Flooding Scenarios
Figure 7A,B are the daily cumulative rainfall distributions in North and South Carolina and surrounding states provided by the NOAA NCEP multisensor stage IV precision dataset. The distribution of the spiral rain belt of a hurricane can be clearly observed. The area where the hurricane eye meets the eyewall is generally affected by high-intensity rainfall. During this period, the upstream and downstream of the river in the coastal area will be scoured by a rainstorm to a large extent, and the streamflow diversion would force those aging dams to bear a doubly stressful time caused by the rising flood stage on both sides. Therefore, the dam is more likely to suffer from an overtopping risk. To explore the spatial and temporal distributions of two hurricane rainfall events in NC province more clearly, the gridded average daily precipitation reanalysis data (0.125° × 0.125°) on Sep.13 ∼ 18, 2018 and Aug.25 ∼ 28, 2008 were extracted. The NetCDF format was then transformed into a raster in order to create the contour plot of precipitation on each day (Figure 8). The rainfall events caused by two serious hurricanes in the history of the United States are considered as the inducers of dam break. The frequency of rainfall and the location of two landing hurricanes are different in time and space.
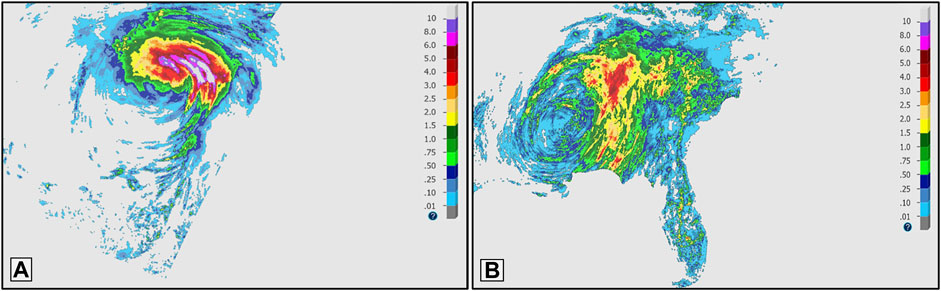
FIGURE 7. (A) Daily precipitation distribution in North and South Carolina and surrounding states during Hurricane Florence on Sep. 16, 2018 and (B) Hurricane Gustav on Aug. 26, 2008 (data source: NOAA NCEP Multi-sensor Stage IV precipitation analysis).
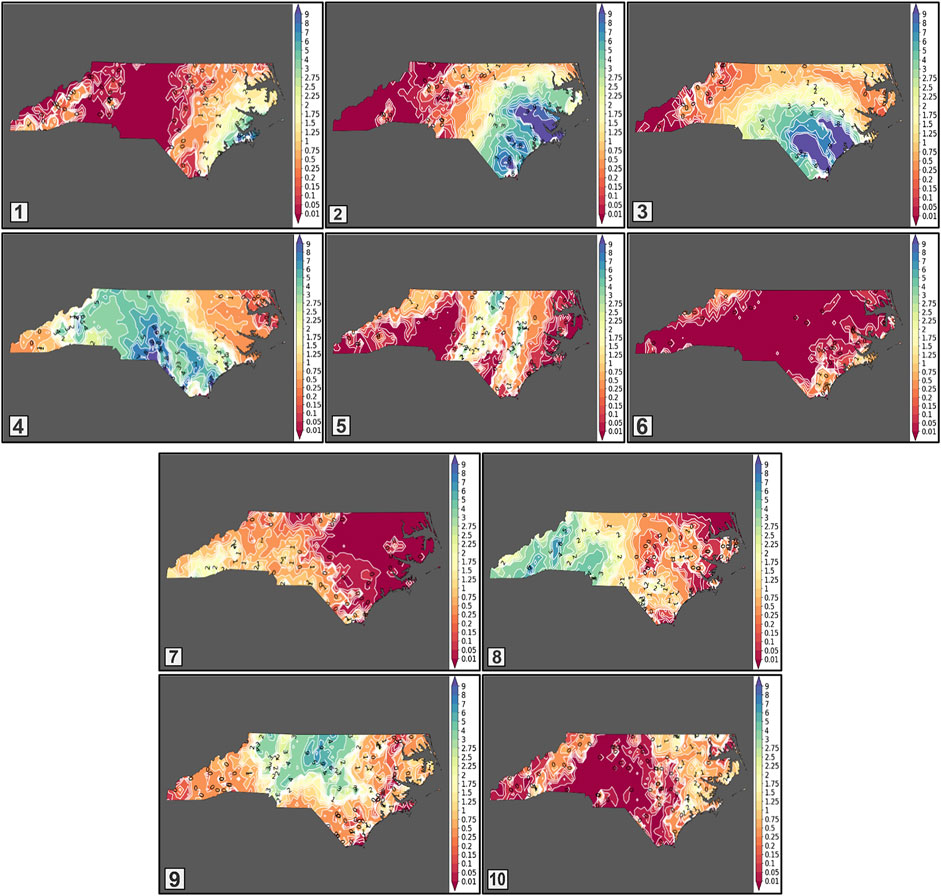
FIGURE 8. Contour plot of reanalysis daily precipitation (inches) in North Carolina during Hurricane Florence on Sep.13–18 2018 (No.1 ∼ 6) and Hurricane Gustav on Aug.25–28 2008 (No.7 ∼ 10).
Hurricane Florence (Sep.13 ∼ 18, 2018) landed in Wilmington on the eastern part of North Carolina and led to the power plant of Wilmington to be breached by devastating floodwaters. MI Lake and Catawba River were not seriously affected by Hurricane Florence; thus, the old dam survived from the disastrous events. However, according to the rainfall observation recorded in the meteorological station of Charlotte City, the 3-day accumulated rainfall brought by Hurricane Gustav (Aug.26, 2008) was considered as the historical heaviest precipitation event at KCLT Charlotte observation, yet it was not brought to any dam breach. The rainfall brought by Hurricane Florence (Figure 9, No.1) in Wilmington was observed as a type of intensive neutral rainfall, while Hurricane Gustav in Charlotte observation was a transient high-intensity storm (Figure 9, No.2).
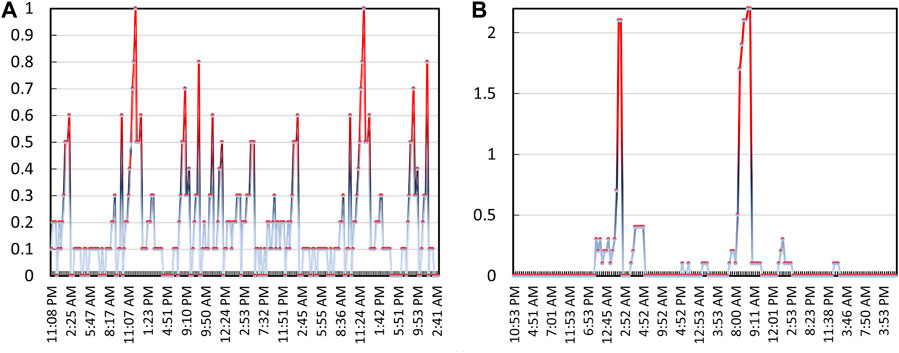
FIGURE 9. (A) Hurricane Florence precipitation observation (inches) of Wilmington weather station; (B) top three-day heaviest rainfall at KCLT record in Charlotte City (Hurricane Gustav).
To some extent, the accumulated rainfall brought by Hurricane Gustav is higher than that of Hurricane Florence in Charlotte City but not as serious as in Wilmington City. However, it could not be sure that such a level of hurricane-induced rainfall in Wilmington would not occur in Charlotte City under the impact of climate change on hurricane intensity. Therefore, it is essential to explore the risk of dam failure exposed to such an extreme situation (Hurricane Florence rainfall in Wilmington) in the area near the dam site.
Simulation Results
This study mainly focuses on the influence of the MI dam-break flood on Charlotte City and Mount Holly, which are 5,202.8 ft and 11,865.02 ft away from the downstream of the dam. It is assumed that the formation time of the gap is 2 h, and the breaking process starts to spread from the center point. When the water level exceeds the dam crest elevation of 647.5 ft, the dam break begins. The downstream boundary condition is set to the level of peak discharge water depth.
In the simulation of hydrodynamic systems using the HEC-RAS model, it is usually necessary to assume that the water surface profile is a steady, gradually varied water flow case. The second assumption is that a dam failure event is a hypothetical case. Typically, a reasonable modeling approach might be to assume that the roughness coefficient is of twice the normal Manning’s n value and then transition to a normal roughness factor in the downstream valley from the dam site. Under this roughness coefficient condition, turbulent flow, sediment, and debris transport due to the dam breach are expected to be reduced.
In response to the three extreme scenarios of heavy rainfall, the upstream dam (Cowans Ford dam) was considered as the unsteady input flow under its maximum discharge situation. The simulated dam breach happened at the MI dam, with its upstream inflow (MI Lake) and downstream outflow (Catawba River) affected by the extreme storm precipitation scenarios. The inundation maps under three extreme scenarios in different periods and all hydraulic variables including water depth, flow velocity, and flood arriving time over separated nine cross-sections in the Catawba River are shown in the following results.
Once-in-a-Century Storm Rainfall Induced Dam-Break Flood Scenario
The formation of extremely intensive discharge results from the combination of an accumulated additional inflow and unsteady floodwater caused by the Once-in-a-century storm rainfall induced dam breach. By comparing the water depth of each cross-section simulated when the upstream dam was drained by the peak discharge, the dam-break flood caused by the Once-in-a-century rainfall event shows an abnormal water level over the central river channel. Affected by the dynamic variations of surface topography, it takes 60 min for the peak discharge to reach section 6, and the water depth in this cross-section is nearly three times the maximum drainage depth (Figure 10). It is noteworthy to observe that the safety of life and property of residents would be severely affected by the floodwater in cross-section 2 although it is nearly 3,000 ft away from the river center. After 90 min of dam failure, it is potentially dangerous that the water level of sections 1–6 in the center of the river remains over 25 ft, while 150 min after the dam break, flows through cross-sections 1–6 moderately level off and transit to the area below cross-section 7. However, low-lying areas in the range of 3,000 m from the river channel at cross-section 7 remain flooded.
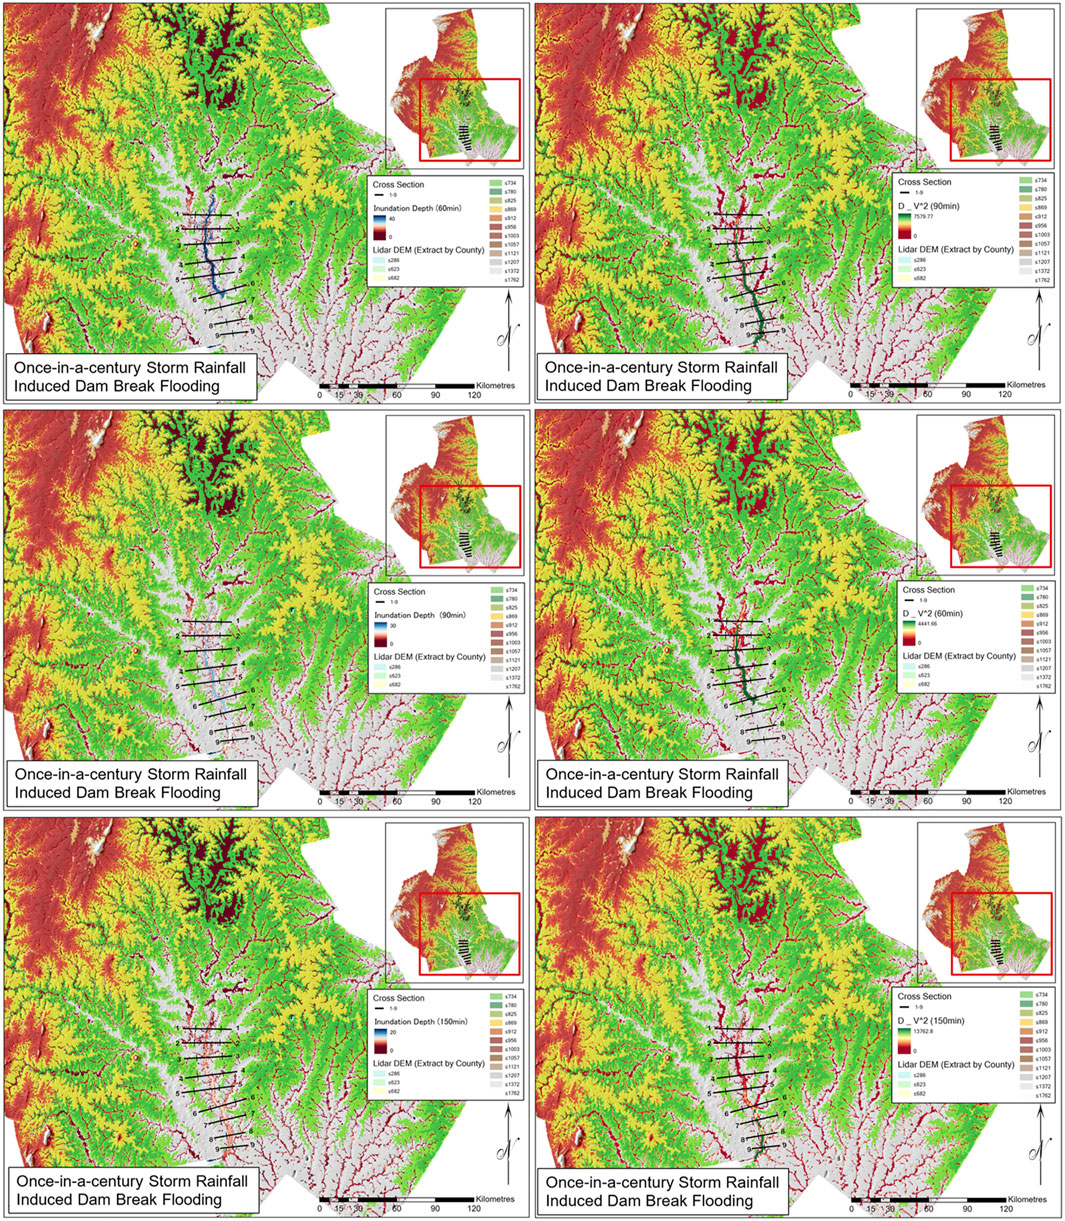
FIGURE 10. Once-in-a-century storm rainfall induced dam-break flooding scenario.
Hurricane Florence Rainfall Induced Dam-Break Flooding Scenario
Affected by Hurricane Florence’s intensive neutral rainfall, the water level in the channel center will remain significantly high for a long period of time. The velocity (Figure 11, D*V2 (60 min)) observed in the hurricane storm rainfall induced dam-break flood was faster than that of the flood observed in the Once-in-a-century storm rainfall event (Figure 10, D*V2 (60 min)). Within 60 min, the latter illustrated that the floodwater has reached the cross-section 8, while the former is still at the cross-section 6. In Figure 11, under the influence of continuous rainfall, the central water level of the channel at cross-sections 2–4 tends to continuously rise during this breaking period. Within 150 min after the break, the water depth of the second station exceeds 55 ft, and the water depth of the fifth station is over 60 ft in the low-lying area 4,000 ft away from the center of the river. The central floodwater at cross-sections 7–8 is fast-moving, yet the water level is falling at 150 min. Possibly due to the significant gap in terrain difference between the river outlet and the downstream flow area, the speed of flood discharge is consequently faster. Additionally, the floodwater depth contributed from the accumulated rainfall of Hurricane Florence exceeds 6 times the flood level caused by the peak discharge situations in low-lying regions.
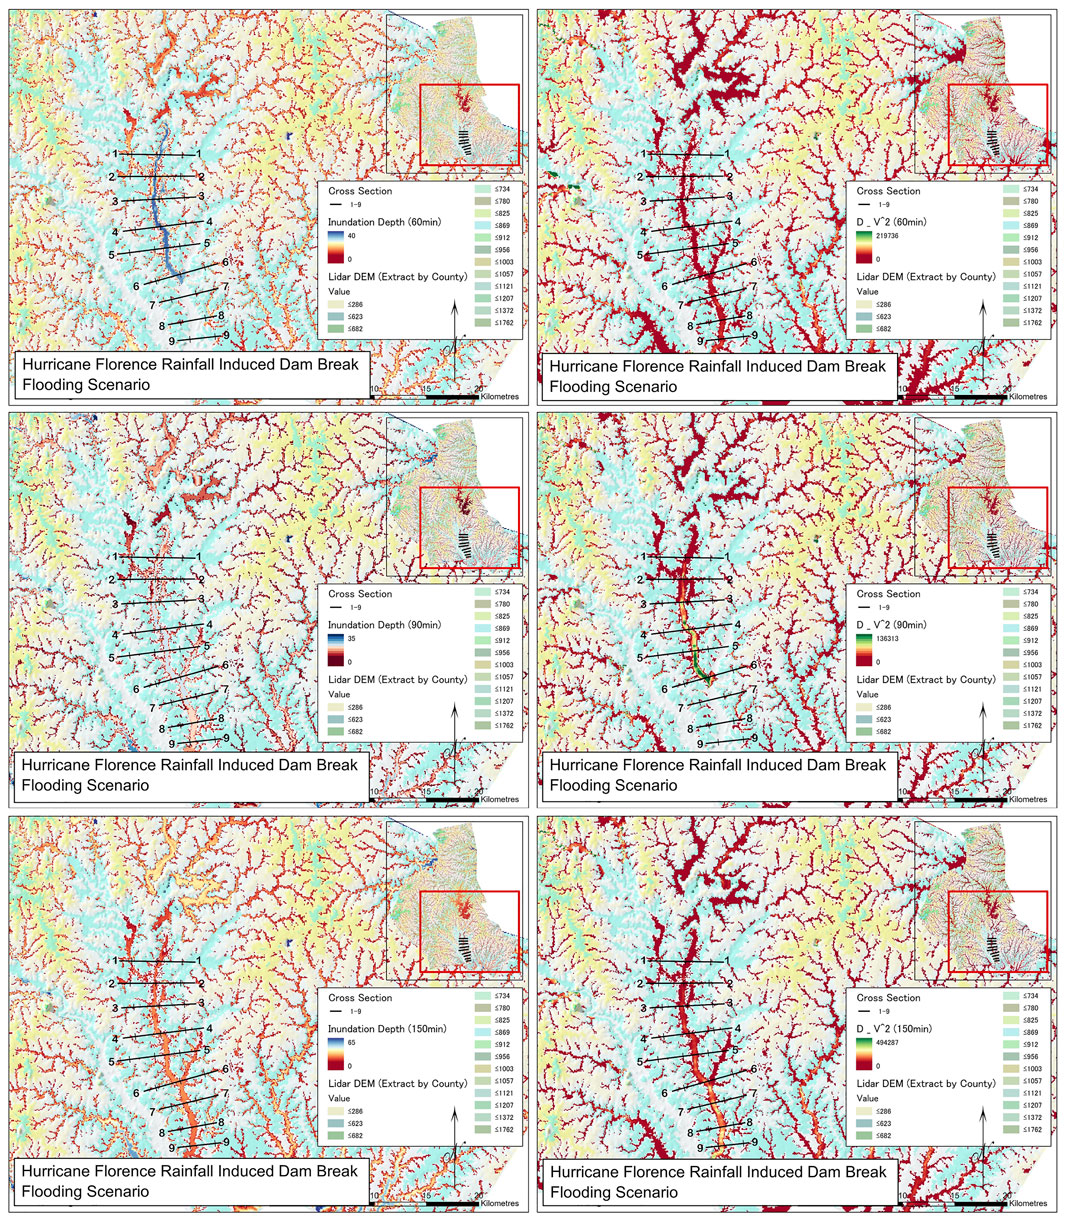
FIGURE 11. Hurricane Florence rainfall induced dam-break flooding scenario.
Hurricane Gustav Induced Dam-Break Flood Scenario
The water level in the center of the river decreases with the time of dam breach (Figure 12). In stations 1–6, the floodwater depth can exceed 30 ft within 60 min after the dam break. It is possibly because Hurricane Gustav is considered as a type of transient high-intensity storm and the instantaneous precipitation is comparatively higher. However, the cumulative rainfall of Hurricane Gustav is relatively more than that of Hurricane Florence. The dam-break flood is greatly affected by the accumulated rainfall, and the flood discharge capacity of the MI dam is not equal to the supply of rainwater flowing into the river channel. The instantaneous rainfall is conducive to the timely drainage of the river water flowing into the downstream direction, and the excessive floodwater can be eliminated during the period of relatively sparse rainfall.
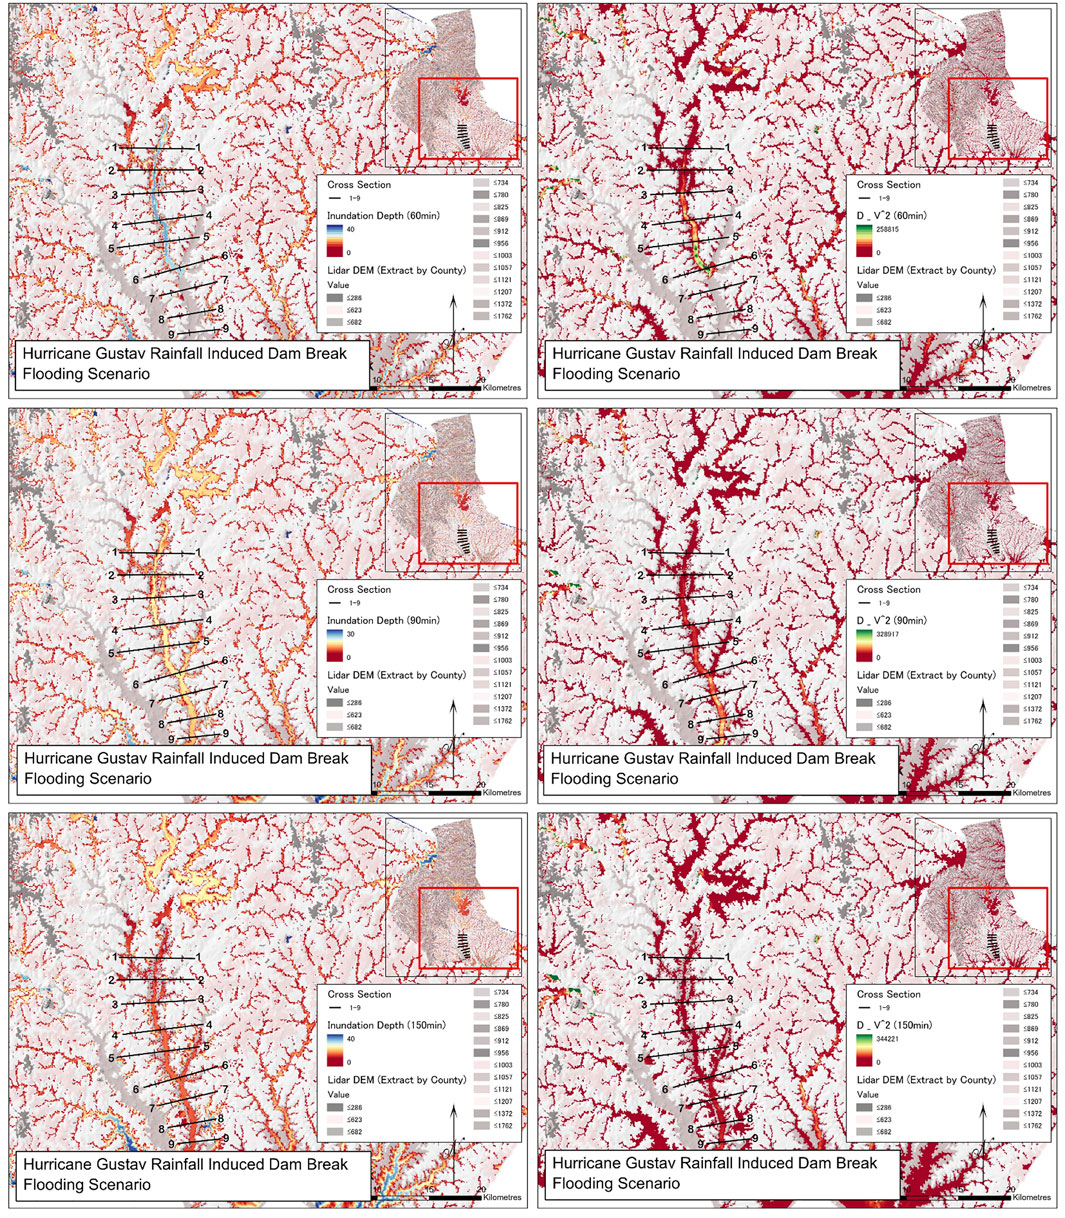
FIGURE 12. Hurricane Gustav rainfall induced dam-break flooding scenario.
It is obvious that under the Hurricane Florence scenario, floodwater took the shortest time to reach each section compared to the other two scenarios. In the Hurricane Gustav scenario, the time for floodwaters to reach cross-section 6 is shorter than that of the Once-in-a-century rainfall event. Although Hurricane Florence’s extremely heavy rainfall on Wilmington had not historically occurred near the MI dam site, it was well beyond the range of the Once-in-a-century storm intensity–duration–frequency curve. In other words, if tropical cyclones’ increase in intensity is expected under future warming conditions, Hurricane Florence-induced rainfall is more likely to occur near the MI dam in the future and may generate a far more severe impact than that of the Once-in-a-century storm rainfall event. Hence, dam owners are responsible to repair and upgrade those aging dams like the MI dam ahead of time, while people living on the downstream side of the dam should be evacuated in advance when such intensive hurricanes attacked near the dam.
Discussion
Three hypothetical dam-break scenarios were proposed based on historical extreme rainfall events including Once-in-a-century storm rainfall and two devastating hurricane events. The presumption was that the proposed dam would collapse. However, the occurrence of dam break and the formation of floodwaters are unsteady and unpredictable in the real world. In the face of extreme events, the relationship between rainfall and runoff can be calculated to assess the probability of dam failure risk based on the severity degree of rainfall (Mallakpour et al., 2019; Chaudhuri et al., 2020; Yu et al., 2020). It is recommended that the prediction results of downscaling gridded RCM data (regional climate model) can be used to evaluate the trend of future extreme rainfall events and the possibility of dam failure (Tryhorn and Degaetano, 2011; Wang et al., 2013; Moeini and Soltani-nezhad, 2020). Additionally, stronger storms in warmer climates should be taken into consideration as the IDF (intensity–duration–frequency) curve varies and the dam failure risk would be simultaneously changed in the future. In other words, the future climate information is recommended to be incorporated in the dam failure probability evaluation (Aerts and Botzen, 2011; Dottori et al., 2016).
Conclusion
Most modern dams are built to resist natural disasters such as floods, landslides, and seepage, and some dams are built for irrigation and water supply. A number of older dams built more than 50 years ago were not designed to modern standards, most of which have already shown signs of degradation (erosion, aging, and disrepair). In recent years, as a result of the increasingly intensive extreme rainfall events associated with dam failure caused by the water erosion and inadequate maintenance, the breach risk of aging dams continues to be dramatically increased in the United States. The risk of dam failure predominantly derives from the high stage level of the river, which leads to overtopping and piping failures (Li et al., 2008; He et al., 2018; Shrestha and Wang, 2020).
In this case study, a hydrodynamic model was applied to the inundation simulation of three types of extreme precipitation-induced homogeneous concrete dam breach. The inundation maps of the three extreme scenarios in different time periods and all hydraulic variables including water depth, flow velocity, and flood arriving time over separated nine cross-sections in the Catawba River were calculated. The hypothetical simulation results illustrate that the impact of Hurricane Florence’s rainfall is far more severe over the downstream of hydraulic facilities than that of the Once-in-a-century storm rainfall event. Although Hurricane Florence’s rainfall observed in Wilmington had not historically happened near the MI dam site, the river basin has a higher probability to be attacked by such storm rainfall if more extreme weather events would be generated as previously predicted under future warming conditions. Besides, the time for floodwaters to reach cross-section 6 under the Hurricane Gustav scenario is shorter than that under the Once-in-a-century rainfall scenario, making the downstream be inundated in short minutes. Therefore, dam owners are responsible for maintaining the dams they have built in the past and are legally and morally responsible for all the effects of a dam collapse. Since the probability can be quantitatively evaluated, it is of great worth to assess the risk of dam-break flood in coastal cities where human lives are at a vulnerable stage.
Data Availability Statement
The original contributions presented in the study are included in the article/Supplementary Material; further inquiries can be directed to the corresponding author.
Author Contributions
Conceptualization, XJ and GH; methodology, XJ; software, XJ; validation, XJ, GQ, and DH; formal analysis, GQ; investigation, DH; resources, XJ; data curation, XJ; writing—original draft preparation, XJ; writing—review and editing, GH and XZ; visualization, XJ; supervision, GH; project administration, GH; funding acquisition, GH.
Funding
This research was supported by the National Key Research and Development Plan (2016YFC0502800), Natural Sciences Foundation (U2040212), Canada Research Chair Program, Natural Science and Engineering Research Council of Canada, Western Economic Diversification (15269), and MITACS.
Conflict of Interest
The authors declare that the research was conducted in the absence of any commercial or financial relationships that could be construed as a potential conflict of interest.
Publisher’s Note
All claims expressed in this article are solely those of the authors and do not necessarily represent those of their affiliated organizations, or those of the publisher, the editors, and the reviewers. Any product that may be evaluated in this article, or claim that may be made by its manufacturer, is not guaranteed or endorsed by the publisher.
Acknowledgments
We are also very grateful for the helpful inputs from the editor and reviewers.
References
Aerts, J. C. J. H., and Botzen, W. J. W. (2011). Climate Change Impacts on Pricing Long-Term Flood Insurance: a Comprehensive Study for the Netherlands. Glob. Environ. Change 21 (3), 1045–1060. doi:10.1016/j.gloenvcha.2011.04.005
Asnaashari, A., Meredith, D., and Scruton, M. (2014). “Dam Breach Inundation Analysis Using HEC-RAS and GIS - Two Case Studies in British Columbia, Canada,” in Canadian Dam Association Annual Conference, October, 2014 Conference - Banff Alberta.
Dalesio, E. P. (2019). N Carolina No. 2 in risky dams where failure could kill. Retrieved from: https://apnews.com/article/9214fb55444f4369999d0d9d23505fea
Bales, J. D., Sarver, K. M., and Giorgino, M. J. (2001). Mountain Island Lake, North Carolina; Analysis of Ambient Conditions and Simulation of Hydrodynamics, Constituent Transport, and Water-Quality Characteristics, 1996–97: U.S. Geol. Surv. Water Resour. Invest. Rep. 2001 4138, 85. doi:10.3133/wri014138
Balogun, O., and Ganiyu, H. (2017). Development of Inundation Map for Hypothetical ASA Dam Break Using HEC-RAS and ArcGIS. Arid Zone J. Eng. 13 (6), 831–839.
Chaudhuri, S., Roy, M., and Jain, A. (2020). Appraisal of WaSH (Water-Sanitation-Hygiene) Infrastructure Using a Composite Index, Spatial Algorithms and Sociodemographic Correlates in Rural India. J. Environ. Inform. 35 (1), 1–22. doi:10.3808/jei.201800398
Chen, X., and Hossain, F. (2019). Understanding Future Safety of Dams in a Changing Climate. Bull. Am. Meteorol. Soc. 100, 1395–1404. doi:10.1175/bams-d-17-0150.1
Derdous, O., Djemili, L., Bouchehed, H., and Tachi, S. E. (2015). A GIS Based Approach for the Prediction of the Dam Break Flood hazard - A Case Study of Zardezas Reservoir "Skikda, Algeria". J. Water Land Develop. 27 (1), 15–20. doi:10.1515/jwld-2015-0020
Dettinger, M., Ralph, F., and Rutz, J. (2018). Empirical Return Periods of the Most Intense Vapor Transports during Historical Atmospheric River Landfalls on the US West Coast. J. Hydrometeorol. 19. 1363–1377. doi:10.1175/jhm-d-17-0247.1
Dottori, F., Salamon, P., Bianchi, A., Alfieri, L., and Hirpa, F. A. (2016). Development and Evaluation of a Framework for Global Flood hazard Mapping. Adv. Water Resour. 94, 7–102. doi:10.1016/j.advwatres.2016.05.002
Ganiyu, H. (2018). Study and Analysis of Asa River Hypothetical Dam Break Using HEC-RAS. Agric. Bioresour. Biomed. Food Environ. Water Resour. Eng. 36, 1.
He, Y., Gui, Z., Su, C., Chen, X., Chen, D., Lin, K., et al. (2018). Response of Sediment Load to Hydrological Change in the Upstream Part of the Lancang-Mekong River over the Past 50 Years. Water 10 (7), 888. doi:10.3390/w10070888
Brunner, G. W.Institute for Water Resources (U.S.)Hydrologic Engineering Center (U.S.) (2016). HEC-RAS river analysis system: Hydraulic reference manual. Davis, CA: US Army Corps of Engineers, Institute for Water Resources. Hydrologic Engineering Center.
Hill, K. A., and Lackmann, G. M. (2011). The Impact of Future Climate Change on TC Intensity and Structure: A Downscaling Approach. J. Clim. 24, 4644–4661. doi:10.1175/2011jcli3761.1
Li, Y. P., Huang, G. H., Yang, Z. F., and Nie, S. L. (2008). IFMP: Interval-Fuzzy Multistage Programming for Water Resources Management under Uncertainty. Resour. Conser. Recycl. 52 (5), 800–812. doi:10.1016/j.resconrec.2007.11.007
Lodhi, M., and Agrawal, D. (2012). Dam-break Flood Simulation under Various Likely Scenarios and Mapping Using GIS: Case of a Proposed Dam on River Yamuna, India. J. Mountain Sci. 9, 10. doi:10.1007/s11629-012-2148-5
Mallakpour, I., AghaKouchak, A., and Sadegh, M. (2019). Climate‐Induced Changes in the Risk of Hydrological Failure of Major Dams in California. Geophys. Res. Lett. 46, 2130–2139. doi:10.1029/2018gl081888
Moeini, R., and Soltani-nezhad, M. (2020). Extension of the Constrained Gravitational Search Algorithm for Solving Multi-Reservoir Operation Optimization Problem. J. Environ. Inform. 36 (2), 70–81. doi:10.3808/jei.202000434
Mohsin, J. B., and Muhammad Umar, R. Q. (2013). Landslide Dam and Subsequent Dam-Break Flood Estimation Using HEC-RAS Model in Northern Pakistan. Nat. Hazards 65 (1), 241–254. doi:10.1007/s11069-012-0361-8
Shrestha, N. K., and Wang, J. (2020). Water Quality Management of a Cold Climate Region Watershed in Changing Climate. J. Environ. Inform. 35 (1), 56–80. doi:10.3808/jei.201900407
Tryhorn, L., and Degaetano, A. (2011). A Comparison of Techniques for Downscaling Extreme Precipitation over the Northeastern United States. Int. J. Climatol. 31, 1975–1989. doi:10.1002/joc.2208
Wang, X., Huang, G., and Liu, J. (2014). Projected Increases in Intensity and Frequency of Rainfall Extremes through a Regional Climate Modeling Approach. J. Geophys. Res. Atmos. 119, 10. doi:10.1002/2014jd022564
Wang, X., Huang, G., Lin, Q., Nie, X., Cheng, G., Fan, Y., et al. (2013). A Stepwise Cluster Analysis Approach for Downscaled Climate Projection - A Canadian Case Study. Environ. Model. Softw. 49, 141–151. doi:10.1016/j.envsoft.2013.08.006
Yang, J., Townsend, R. D., and Daneshfar, B. (2006). Applying the HEC-RAS Model and GIS Techniques in River Network Floodplain Delineation. Can. J. Civ. Eng. 33, 19–28. doi:10.1139/l05-102
Keywords: dam failure, inundation mapping, extreme storm events, flood vulnerability, heavy rainfall
Citation: Lin X, Huang G, Wang G, Yan D and Zhou X (2021) Risk Assessment of Dam-Breach Flood Under Extreme Storm Events. Front. Environ. Sci. 9:742901. doi: 10.3389/fenvs.2021.742901
Received: 16 July 2021; Accepted: 21 September 2021;
Published: 25 October 2021.
Edited by:
Shan Zhao, Shandong University, ChinaReviewed by:
Lvyang Xiong, China Agricultural University, ChinaYanhu He, Guangdong University of Technology, China
Copyright © 2021 Lin, Huang, Wang, Yan and Zhou. This is an open-access article distributed under the terms of the Creative Commons Attribution License (CC BY). The use, distribution or reproduction in other forums is permitted, provided the original author(s) and the copyright owner(s) are credited and that the original publication in this journal is cited, in accordance with accepted academic practice. No use, distribution or reproduction is permitted which does not comply with these terms.
*Correspondence: Guohe Huang, huangg@uregina.ca