Why Are Households Willing to Pay for Renewable Energy? Lessons From Romania
 Alexandru Maxim
 Dumitru-Tudor Jijie
 Teodora Roman
- Department of Management Marketing and Business Administration, Faculty of Economics and Business Administration, Alexandru Ioan Cuza University of Iași, Iași, Romania
Renewable energy is seen as a key tool in addressing the dual issue of increasing energy demand and climate change mitigation. In the current geopolitical climate, it may also play a key long-term role in increasing energy security. In order to reach the ambitious green energy targets set for each European Union member state public support for fiscal and other support mechanisms is required. The purpose of this paper is to determine to what extent the population in the North-East region of Romania is willing to make financial sacrifices for further development of renewable energy. We also explore what lifestyle and socio-demographic factors influence willingness to pay. We applied a discrete choice experiment on a sample of 602 households from the populous North-East region of Romania. Our results show that the creation of new jobs and the increase of the national energy independence, followed by the reduction of pollution are societal benefits that would convince households to pay a premium in order to support renewable energy development. Increased local budgets for rural communities resulting from the taxation of new energy companies is not one of the desired outcomes of green energy development. The study is useful in the design of adequate fiscal and renewable support policies and serves companies by identifying willingness to pay influence factors, as well as by demonstrating a market segmentation procedure.
1 Introduction
Satisfying the ever-growing energy demand, but at the same time reducing greenhouse gas emissions and mitigating climate change are some of the most challenging and ardent issues for the policymakers around the world. Renewable energy is perceived as an effective way to cope with the dual nature of these challenges, usually topping the list of meaningful changes that our society can implement. The new European Green Deal places the European Union (EU) on a path towards climate neutrality by 2050, a goal that requires a significant commitment towards developing the production of electricity from Renewable Energy Sources (RES). However, fiscal policies and financing schemes that promote RES, will not prove to be successful if governmental authorities do not take note of the local or national public opinions and perceptions. According to the 2019 Eurobarometer, the population in Romania is not significantly concerned with climate change, but rather believes that the most serious problems that the world is faced with are the overall economic situation and issues such as poverty and hunger (European Union, 2019). In the current geopolitical context, assuring long term energy security for the European Union is likely to be achieved both through a diversification of fossil fuel imports and, crucially, the large scale development of internal generation of electricity from non-fossil sources (Sauvageot, 2020; Mišík, 2022). The aim of this paper is to determine to what extent the population in the North-East region of Romania is willing to make financial sacrifices in order to support the development of RES. We have pursued three goals in order to reach our aim: determining the Willingness to Pay (WTP) of households in the North-East region of Romania for the development of RES, identifying the factors that influence WTP, and simulating the structure of the retail electricity market based on the preferences of household consumers.
The current paper makes several contributions to the field of knowledge. From a methodological standpoint, we provide demonstrations on how discrete choice experiments can be constructed in order to estimate preferences both in the short and in the medium/long term, as well as how to incorporate socio-demographic and lifestyle variables in the segmentation of the retail electricity market. Empirically, this is the first large scale experimental study of the WTP of households in the North-East region of Romania for renewable electricity. Finally, in terms of policy implications, our findings demonstrate that the public is willing to pay for fiscal and financing schemes for RES development to the extent in which it provides energy independence, creates new local jobs and reduces pollution. However, we find that they are opposed to additional taxation of newly established RES producers.
The literature review section presents the current status and debates around renewable energy policies and markets across the world and introduces the primary method used in the study. This is followed by the methodology section, in which we outline the data collection process, the validation of our energy knowledge scale, the market segmentation procedure and the discrete choice experiment. We then proceed to the results section, where we present the findings focusing on the three research goals outlined above: determining the WTP of Romanian households for RES development, identifying the factors that influence WTP, and simulating the future structure of the retail electricity market. Finally, we conclude with an outline of the theoretical, policy and practitioner implications of our study and discuss its limitations and future studies required.
2 Literature Review
2.1 Renewable Energy: Evolution and Debate
Renewable energy presents a complex set of advantages, besides those of being “green”. The growing sector of renewables expands energy access in many developing countries and it can create jobs, and, in the long term, it can help lower energy bills, as well as improve environmental protection and the general health of the public.
The main types of RES currently utilized are hydro (including tidal energy), wind, solar, biomass and geothermal. Nuclear energy could also be considered “green”, although the fuels used for energy production are non-renewable. The fact that, on one hand, nuclear power plants do not generate emissions of greenhouse gasses or other air pollutants during their operation, while, on the other hand, creating issues related to nuclear waste, investment costs and public acceptance makes this a disputed source of clean, sustainable energy (Suman, 2018; European Commission Joint Research Centre, 2021; US Department of Energy, 2021; Simionescu et al., 2022).
In terms of electricity generation, the latest data by the IEA shows that, in 2019, global production reached 25.8 TWh, out of which coal represented 36%, natural gas 23%, hydro 17%, nuclear 10%, wind 6%, solar 3%, biomass 3% and oil 3% (IEA, 2020a). It is worth noting that, in 2019, “low carbon” electricity generation (renewables and nuclear) surpassed coal sources, which decreased by 3.1% in 2019.
The pursuit and implementation of RES related policies around the world, as well as the proportion of RES energy production and consumption at macro-regional and national levels in the respective energy mixes are influenced by a series of geo-political and socio-economic factors such as type and level of resources available, energy dependency, economic development or public perception of environmental issues and RES. When it comes to some of these factors, the EU member states have been proven to be both more exposed to energy supply risks and more committed to reducing greenhouse gas emissions compared to the other countries in the world, determining the EU to provide significant support for the development of renewable energy. Due to its low reserves of oil and natural gas, the EU imports more than half of all the energy it consumes. In its path towards improving energy security the European Commission has sought to increase the integration of the EU energy markets and infrastructure, but also to increase domestic production of electricity (primarily through RES). As a result, in 2019, the electricity generation mix for the EU was: 36% RES (of which 11% hydro), 25% nuclear, 22% natural gas, 15% coal and 2% oil (IEA, 2020b). The data shows a remarkable 245% increase in non-hydroelectric RES by 2019 compared to 2010 (IEA, 2020b).
Renewable energy production and the pursuit of new technologies meant to solve de dilemma of satisfying the growing energy demand while protecting the environment are not without their critics. First of all, an issue of principle can be brought up: that of the poorer countries and regions of the world which face the challenge of having to grow their economies, alleviate poverty and increase electricity access for their citizens, whilst avoiding the carbon-intensive approach which was used for decades by the currently developed countries of the world. That said, according to the International Renewable Energy Agency, many countries in Africa have sought to support the RES development as a means of leapfrogging the traditional centralized-utility model of providing energy to households and businesses (International Renewable Energy Agency, 2015).
Other valid critiques of RES are related to the intermittent nature of some of the energy sources (such as solar or wind), the changes to the landscape and the disruption to ecosystems that dams, large solar plants or wind turbine fields create, the technology and maintenance costs, or the production of new types of waste and pollution (Levenda et al., 2021; Sayed et al., 2021). In terms of landscape integration and planning of renewables, the COST Action TU 1401 (“Renewable Energy and Landscape Quality”—RELY) performed extensive pan-European research and produced case studies, community events and toolkits that can support the synergy between landscape protection and management and renewable energy (RELY, 2022). The Action also generated a comprehensive guide on renewable energy sources with their production potential, advantages, disadvantages, as well as paths towards addressing these disadvantages with applied case studies across 33 European states, including Romania (Roth et al., 2022).
Wind turbines and solar photovoltaic panels do not generate greenhouse gas or other emissions during their operation. They both have a relatively short installation time (compared to all other conventional and renewable power plants) and can be placed in a variety of locations. Their main practical disadvantage is related to intermittency of generation, making them inadequate destabilizing components of the energy grid in the absence of rapid response units such as large hydroelectric plants or natural gas turbines. In the case of wind, there are several disadvantages that need to be considered, ranging from a limited negative impact on wildlife (birds in particular), potential micro-climate disruptions, as well as noise pollution and landscape disruption (Breeze, 2005; Genoud and Lesourd, 2009). The last of these has been addressed in detail by the RELY COST Action mentioned previously. The disadvantages of solar photovoltaic panels relate to excessive land use, potential negative visual impact (e.g., when placed on historical buildings) and a notable risk of pollution and greenhouse gas emissions during the production process (Maxim, 2015a). Notably, solar panels are one of the most effective methods of supplying electricity for a dwelling that is not connected to the grid, a fact that has been recognized by a funding scheme by the Romanian Environment Fund Administration, through which 5,000 euro subsidies were offered for the installation of photovoltaic panels on isolated homes. This scheme along with other current renewable energy support mechanisms in Romania are discussed in more detail in Section 2.3.
Biomass is overall much closer to conventional fossil fuel technologies, in the sense that electricity is generated using steam turbines, but using a sustainable carbon neutral fuel. The crops used in the process can be regrown locally every year, thus increasing energy security and re-capturing the equivalent carbon from the atmosphere and soil as is emitted during the generation process. The burning of biomass does contribute to carbon emissions, which can be offset by the crops of the following year, but it also generates nitrous oxides, particulate matter and ash. It also requires large land surfaces for cultivation, thus limiting the areas available for growing food crops and amplifying the pollution of the water table with fertilizers. Some grassy and wood energy crops (e.g., poplar) can have the positive effects such as soil stabilization and underground water filtration (Breeze, 2005; Genoud and Lesourd, 2009).
Hydroelectric power has become a somewhat controversial energy source over the last decades due to its significant socio-environmental disadvantages coupled with its undeniable socio-economic and technical benefits. Large hydroelectric projects have numerous benefits, such as low generation costs, rapid and on-demand response to peak demand. The reservoirs have also been used to facilitate irrigation, prevent floods and to boost local economic development through the establishment of water-centric recreation amenities that attract tourists. However, there are complex issues that arise from the establishment of large hydroelectric power-plants. These range from the unforeseen complications that can appear during the dam construction phase to the social and environmental impact that the newly established reservoir creates. For example, any population living in the area to be flooded must be moved, while any significant locales, such as worship sites and historical landmarks will be submerged and become inaccessible. From an environmental standpoint, the reservoir reduces the natural habitat of fauna and flora in the area, severely changes the local landscape and it may also lead to greenhouse gas emissions resulting from the decomposition of the organic matter that becomes submerged. The dam itself can affect the flow of fish and sediments along the river and could lead to erosion and even drought downstream—generating the need for internationally coordinated management of strategically important transnational rivers, such as the Nile (Heggy et al., 2021).
It is due to the significant disadvantages such as those outlined above, but also due to the fact that much of the large hydroelectric potential has generally been exploited across the European Union that renewable energy support schemes do not focus on providing support for such developments. In Romania, the vast majority of the large hydropower projects have been developed before 1990 and are now owned and operated by the state-controlled company Hidroelectrica SA. Under these circumstances, the initial law outlining the green certificate support scheme adopted in 2008 mentions power plants with an installed capacity of at most 10 MW (Nazare, 2020). There are currently 245 small hydroelectric plants (below 10 MW) that are connected to the national grid according to Transelectrica, the grid operator (Transelectrica, 2022). While small hydropower plants can have many of the same benefits as their larger counterparts, they generally do not have the same flexibility in the generation process, as they cannot rely on the availability of a large reservoir of potential energy. In addition, as many of these plants have been developed along remote mountainous regions, environmental activists, as well as mass media outlets and local communities have condemned these projects for their destructive impact on picturesque local ecosystems, making small hydropower plants a rather controversial option (Pavlakovič et al., 2022).
The pros and cons of renewable energy have a differentiated impact on the public, based on their perception of the advantages and disadvantages encompassed, on their personal beliefs and preferences, all influenced by a complex set of economic, demographic, social and cultural factors.
2.2 Development of Renewable Energy: Policies and Public Support
In order to develop the willingness to make an effort (financial, visual, personal convenience) so as to support RES development, the public in general and consumers in particular need to accept that renewable energy is desirable and has a predominantly positive impact on society and their lives. Without this type of support, any inconvenience that arises from the implementation of RES support policies will be met with protests and disobedience. Thus, issues regarding how RES are perceived and to what extent they are accepted by citizens has been the topic of several studies. One innovative piece of research concerns how renewable energy is perceived by young schoolchildren in Latvia, Lithuania and Romania. The authors find that the label “clean” and the colours “yellow” and “white” are prevalent in the mind of first to fourth graders, compared to the label “green” and the colour “green” in older children (Tsagarakis et al., 2018). This finding has implications on the entire manner of communicating about renewable energy in schools in order to develop awareness from a young age.
Paravantis et al. find that the social acceptance of renewable energy has been affected primarily by institutional shortcomings (bureaucracy, inefficient legal frameworks, planning issues), economic factors, such as higher electricity costs paid by consumers, as well as more complex societal issues (lack of trust in investors, lack of information and awareness regarding the new technologies) (Paravantis et al., 2018). In the case of Greece, these problems are prevalent among lower income societal groups, with a lower level of formal education or information on the topic, who live far away from existing renewable energy projects. A different study applied in Italy also found that the desirability of renewable electricity generation facilities depends significantly on the energy source used, with agricultural biomass being the least desirable (lowest WTP) out of the set presented to the respondents (Vecchiato and Tempesta, 2015). In the case of Saudi Arabia, researchers found that the level of education, income and age have a significant impact on the willingness to adopt renewable energy technologies (Mosly and Makki, 2018). Similarly, from the perspective of willingness to invest in renewable energy generation, aside from the profitability of such projects, respondents’ attitudes were impacted by environmental values and their preference for specific energy sources (Karasmanaki et al., 2019).
The main types of fiscal policies and RES support schemes used across the globe are Feed-In-Tariffs and Tradable Green Certificates. Some of these have evolved into Renewable Portfolio Standards and the more recently introduced Renewable Obligations or the tender based Erneuerbare Energien Gesetz. Most studies discussing these policies tend to either assess the impact of these policies in various countries or seek to optimize and propose revisions to the traditional policies already in place (Shen et al., 2020). Mezősi et al. conducted a cost-efficiency benchmarking of RES support schemes across Europe over two decades and identified significant differences in the cost-benefit ratio of different national mechanisms (Mezősi et al., 2018).
The design of policies regarding RES is highly dependent on a thorough analysis of public perceptions and attitudes. This is why concepts such as “social acceptance” or “community acceptance” are becoming more prevalent in studies, whilst policymakers around the world acknowledge that analyses that focus solely on technical and economic factors are not sufficient for the successful implementation of these policies. Wűstenhagen et al. propose a typology of renewable energy acceptance frameworks which includes a political level, a market level and a societal and community level of acceptance (Wűstenhagen et al., 2007). The social acceptance of RES is influenced by several factors, identified usually in the literature as “local externalities”, amongst which we find aesthetics, noise and impact on local ecosystems.
Studies aimed to assert the willingness to accept/adopt RES for the consumers in various countries/regions of the world, the willingness to pay (WTP) for RES, as well as people’s preferences concerning different energy sources and the factors that drive these preferences have grown in number in recent years. The methodology used in the studies is also varied. In the case of Knapp et al. a mixed method approach is used to correlate standardized national surveys in the United States with data regarding voluntary participation in green energy support programmes offered by utility companies (Knapp et al., 2020). Gao et al. implement a meta-regression analysis based on several previous studies in order to determine WTP, which they deem crucial for establishing adequate levels of investment subsidies (Gao et al., 2020). Ntanos at al. apply a survey among Greek citizens in order to identify the factors that influence consumers’ WTP for and their willingness to invest in renewable energy (Ntanos et al., 2018). Balezentis et al. as well as Lee and Heo use contingent valuation in surveys of Lithuanian household consumers and Korean consumers respectively (Lee and Heo, 2016; Balezentis et al., 2021).
2.3 Renewable Energy in Romania
In the case of Romania, the chosen RES support scheme has been a combination of tradable green certificates and a renewable energy quota imposed on electricity suppliers (Zamfir et al., 2016). The price of the certificates could fluctuate within a pre-established interval, depending on market demand. The scheme entered into force in 2011, leading to a rapid expansion of renewable energy projects in the country, as well as a significant increase in electricity prices. As a result, the government decided to implement a downward revision of the support scheme, reducing the number of certificates awarded to green energy producers, thus reducing the overall subsidies offered to the RES sector. This approach seems to have transformed the policy into one of the most cost effective in the EU (Mezősi et al., 2018). Given that the green certificate system was only aimed at medium and large scale producers of electricity, governmental authorities also set up legislation to subsidize the procurement and installation of photovoltaic solar panels by households (Cristea et al., 2020).
Currently, we can identify four avenues of support for renewable energy development in Romania. First, the green certificate and quota system implemented since 2011 is still in force until 2032, albeit in an adjusted format, and it applies for installations that were set up before the end of 2016. Other large scale projects benefit indirectly from both the quota of renewable energy imposed on suppliers, as well as priority transmission to the grid. Second, for smaller producers of renewable energy, Law 184/2018 regulated that “prosumers”, with an installed capacity of up to 27 kW (increased to 100 kW in 2020), can sell the energy they produce to their contractual supplier, who is obligated to purchase the energy at the average weighted price of the Day-Ahead market in the previous year. Third, the Romanian Environment Fund Administration (AFM) launched two programs, with budgets of 115 million euros and 47 million euros respectively, which provided subsidies of up to 4,000 and 5,000 euros respectively for the installation of photovoltaic panels primarily by households (Nazare, 2020). Finally, for larger producers, the Ministry of Energy has recently launched a call for the construction of new wind and solar power plants worth 457.7 million euros financed through the National Recovery and Resilience Plan (Ministry of Energy, 2022). Eligible projects need to have a minimum capacity of at least 0.2 MW and be completed and connected to the network by the middle of 2024. The maximum available funding per applicant is 15 million euros. One noteworthy aspect is that applicant companies do not need to be primarily registered as energy producers. They only have the relevant NACE code (3511—“Electrical energy production”) as one of their registered activities. Thus, the program is also presented as a valuable opportunity for entities, such as farms and factories, which have enough real estate which can be used to install solar panels or wind turbines in order to reduce their energy costs and diversify their revenue streams.
As part of the EU 20-20-20 climate and energy package, the target set for Romania in terms of gross final consumption of energy from renewable sources has been 24%. The country managed to reach this target in 2015, coinciding with a significant decrease in regulatory incentives for RES investments. In the perspective of 2030, Romania has assumed a target of 30.7%, below the 34% level recommended by the European Commission (Nazare, 2020). The current level of development of the RES sector in Romania can be described through dimensions such as installed capacity, production and consumption. In terms of installed capacity, in May 2022, out of a total of 18 542 MW, 35.8% were hydroelectric plants, followed by 16.3% wind, 7.5% solar and 0.6% biomass (a total of 60% of installed capacity is RES). Other production sources include 16.7% coal, 15.4% hydrocarbons (almost all of which is natural gas), and 7.6% nuclear. Negligible capacities of biogas, geothermal and other technologies also exist (ANRE, 2022a). In terms of actual production, given the intermittency of renewables, their total contribution to electricity output in 2021 has been approximately 44.8% (30.8% hydroelectric and 14% non-hydro: 12.1% wind, 1.5% solar and 0.4% biomass), from a total of 54.02 TWh delivered to the grid (ANRE, 2022b). Finally, in terms of consumption, renewable energy represented 24.5% of gross final energy consumption in 2020 (Eurostat, 2022).
The price paid by Romanian households for electricity is determined both by the free market, as well as the regulated tariffs established by the Romanian Energy Regulatory Authority (ANRE) (ANRE, 2021; Pack Energy, 2022). After the energy is produced, the generator sells it to a supplier through one of the various types of transactions available on the market. The energy is then introduced into the national grid owned by the state-controlled company Transelectrica SA. Next, it is sent through the regional networks of the six distributor companies (only one of which is state owned) and is delivered to the end user either through high, medium or low voltage distribution lines. The market based price of the electricity sold to consumers encompasses the cost of generation and the margins of both the producer and the supplier. This component of the tariff is sometimes called active energy and is the component that can be negotiated or adjusted based on the pricing strategy of the supplier. There are also several regulated components of the electricity tariff related to transportation, distribution, green certificates and other taxes. The transportation components include the system price (TS) and the prices for introducing and extracting the energy from the national grid (TG and TL, respectively). The distribution tariffs depend on whether the customer is connected to the high, medium or low voltage lines (low voltage incurs a higher tariff per unit of energy) and is abbreviated as IT, MT or JT, respectively. Finally, other regulated tariffs include the green certificates, the excise and the tax for supporting high efficiency cogeneration. Based on the commercial offers provided to household customers in May 2022 by two of the largest suppliers and the regulated tariffs currently in effect, the green certificates currently represent approximately 4% of the overall electricity bill—between 5 and 10 lei per month for an average household (Electrica Furnizare, 2022; E.; ON, 2022).
Studies of Romanian household consumers’ WTP for renewable energy are very rare in Romania. Most of the research that we have identified is focused on presenting the evolution of the electricity market from a policy and energy mix perspective. Dragomir et al. present the impact that the roll-back of the green certificate scheme had on wind farm investments (Dragomir et al., 2016). Năstase et al. provide an overview of the development of solar photovoltaic energy production in Romania over the last decade (Năstase et al., 2018). We can also find more complex energy system modelling studies, which provide guidelines on how the gradual transition from conventional power generation towards RES can be achieved while maintaining the stability and sustainability of the market and the energy system as a whole (Koltsaklis et al., 2020). The only WTP focused research that we are aware of has been the set of papers developed and published by the authors of the current study over the last six years.
One of the most surprising findings regarding renewable energy in Romania was that RES projects do not seem to have any significant positive impact on rural development in terms of employment, increased revenues to the local budgets, demographics or agriculture (Cebotari et al., 2017). This is in spite of the fact that much of the existing literature presents the socio-economic development of rural communities as one of the positive benefits of RES development (hence our inclusion of rural development as one of the positive societal benefits of renewable energy in the discrete choice experiment). In fact, our findings also seem to confirm that consumers do not consider increased revenues for the local budgets of rural communities as a relevant or desirable benefit of RES.
2.4 Discrete Choice Experiments and Public Preference
Discrete choice experiments (DCEs) have grown in popularity over the last decade due to their versatility and the level of insight they provide on the topics being studied. A DCE works by simulating a choice task that a consumer could make in a real-life scenario. For example, one such study could ask respondents to choose from a set of three vacation packages, each defined by a specific destination, duration, type of activity and price. The packages themselves are called profiles, the four different traits are called attributes, while the specific value of each attribute (e.g., duration of 2, 7 or 10 days) is called a level. The choices are repeated across several such sets of 2–4 profiles, called “choice sets”, in which the attribute levels assigned to each profile vary according to the experimental design. After analysing the data, researchers are able to estimate the utility that respondents assign to each attribute and/or level and thus predict the probability with which a profile/product/offering “i” would be chosen from any specific set of “n” profiles.
As discussed in this section, WTP studies do not need to rely on a DCE. There are several revealed preference methods (hedonic pricing, travel costs) or stated preference methods (contingent valuation, conjoint analysis variants) which can be used to estimate WTP (Accent and RAND Europe, 2010). However, due to the realistic simulation of a real-life choice, DCEs have increasingly been used by researchers in fields such as marketing, healthcare, tourism, public goods, non-marketable environmental goods and ecosystem services, urban green space design and product design and several others (Rakotonarivo et al., 2016; Van Dogen and Timmermans, 2019; Guo et al., 2021; Kemperman, 2021; McPhedran and Toombs, 2021; Rusmevichientong et al., 2021).
DCEs are also used in studies covering the topic of energy and renewable energy development. Some researchers use them in order to determine public preferences for specific attributes of RES projects or electricity services (e.g., location, type of energy, size or even electricity tariff preferences) (Srivastava et al., 2021; Oehlmann et al., 2022). Other studies use DCEs to calculate consumer WTP for the development of RES (Longo et al., 2008; Ku and Yoo, 2010).
3 Methodology
Our study is centred on a discrete choice experiment conducted through the use of an instrument that included both the experimentally designed question items and a series of survey questions. The data was collected from a sample of 602 households from the North-East development region of Romania (the most populous of the country). The sampling procedure was based on two quotas: rural/urban residence and county of residence, considered highly relevant given that the surveyed population is composed of households. The resulting sample insures a proportional spread of the respondents across the region. Data collection and analysis were performed during Q4 2020—Q1 2021. The data was collected online using the Sawtooth Software Lighthouse Studio 6.6 platform. The statistical analyses were performed using IBM SPSS 25 and STATA MP16.
Aside from providing the first large scale implementation of a choice experiment in the field of renewable energy in Romania, the current work is able to provide more layers to the existing DCE and RES literature through unique econometric modelling techniques applied to data concerning the preferences of energy consumers. First, we are able to demonstrate the implementation of a choice modelling approach with two distinct temporal horizons: short term versus medium/long term. Secondly, we have tested and incorporated an energy knowledge scale in the analysis in order to identify whether awareness regarding the functioning of the energy sector impacts consumer preferences. Thirdly, we have also demonstrated the use of an innovative market segmentation procedure using a mix of lifestyle and socio-demographic variables, thus increasing the practical utility of the resulting clusters. Finally, we are able to further expand the results of the study by demonstrating of the use of market simulations in the retail energy sector based on choice preferences.
3.1 Choice Experiment Variables and Design
The attributes chosen for the choice experiment were identified based on an extensive literature review and filtered through the use of a survey among a sample of academics and specialists from the energy field. The full process through which the attributes were chosen is described in (Maxim, 2015a). Our experiment uses a set of five attributes. Four of these refer to societal benefits that can result from an increased share of renewable electricity being produced and consumed at the national level. We also included a price attribute that allows us to determine the WTP of household consumers for these benefits.
The process of establishing adequate levels for the attributes required a specific approach for each of the five items, as described in (Maxim et al., 2021). The cost attribute was scaled based on the average monthly electricity bill for households, the energy independence levels were designed based on the projected substitution of energy imports with internally produced renewable electricity, the number of new jobs is estimated based on current numbers of employees in the energy sector and projected employment increases, pollution effects were evaluated based on the externalities generated by each type of electricity production technology and the increased tax revenue was estimated based on the projected revenue generated by locally based renewable electricity companies and projects. We decided to set a number of four gradual levels of increase from the status quo values of each of the five attributes. The full set of attributes and levels is presented in Table 1.
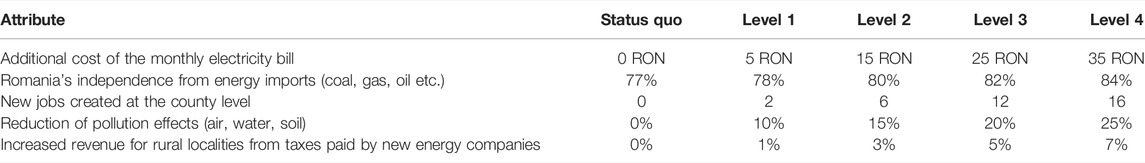
TABLE 1. Summary of the attributes and levels included in the discrete choice experiment.
Based on the number of attributes and levels, the experimental design could incorporate up to 45 offering profiles. In order to generate a high quality fractional factorial design, we utilized the “Balanced Overlap” approach provided by Sawtooth Software’s Lighthouse Studio. Based on the recommendations of Orme, we decided to use a design that incorporates 3 distinct profiles in each choice set, plus an additional status quo option, through which respondents may decide to not pay any additional fees, resulting in no additional societal benefits (Orme, 2014). The use of a status quo option in choice experiments is recommended in order to avoid overestimation of preferences and WTP (Maxim and Roman, 2019).
However, each choice set in the experiment also required respondents to choose their favourite option out of the non-status-quo profiles. This approach is an original contribution that the current study brings to the choice experiment methodological design, and it has been used to generate two different WTP models, a short-term one and a medium/long-term one.
The results of the experiment were analysed through a Conditional Multinomial Logistic regression (cMNL), also known as Conditional Logit, which is based on calculating the utilities of profiles—sets of attributes or traits that a product or service offering provides to consumers (Hauber et al., 2016). The utility is estimated using a linear predictor function, as seen in Eq. 1.
where:
Uin—the utility of profile i perceived by respondent n; Vin—the systematic, explainable component of utility of profile i perceived by respondent n; εin—the random, unexplained component of the utility of profile i perceived by respondent n; xki—the level of attribute k in the case of profile i.
It is assumed that a respondent will choose the profile or offering that provides the highest level of utility out of a set of n profiles. The probability (P) of choosing a specific profile (i) out of a set (n) is shown in Eq. 2. We will later use this formula to generate simulations regarding the retail electricity market.
One of the risks associated with using the cMNL model, is the assumption that respondents’ preference for one profile is independent of all other profiles. This is called the Independence from Irrelevant Alternatives (IIA) assumption, also referred to in practice as the “Red Bus/Blue Bus” problem (Orme, 2014). This issue can only be mitigated through the use of other modelling approaches, such as mixed logit, which relaxes the IIA assumption. However, given that the current experiment uses generic societal benefits and electricity price as attributes (all of which have levels designed on a continuous scale), we expected that the IIA assumption will not have a major influence. After rerunning the analysis using the mixed logit model, we only observed a notable increase in the preference impact of “pollution reduction” compared to the cMNL model. The differences are discussed in section 4.1.
The marginal WTP of respondents for an attribute (or for a distinct attribute level in some cases) is determined by dividing the regression coefficient of that attribute to the negative of the cost coefficient (Orme, 2014).
Thus, in the case of attributes with levels that qualify as continuous intervals (such as price), if a linear relationship is assumed along the different levels, a single regression coefficient will be attributed and used in determining WTP.
Hypothetical bias, taking the form of overestimated WTP values being measured primarily due to respondents providing what they perceive to be socially desirable answers, is an issue that can affect stated preference surveys. In order to avoid the overestimation of respondents’ willingness to commit financial resources for specific goods and services, several ex-ante and ex-post measures can be taken by researchers (Loomis, 2014). We have taken steps to limit hypothetical bias, although it may still have an effect on the presented results. In the case of our study, the approach meant to limit the hypothetical bias falls primarily within the ex-ante category. We use dual questions in the choice experiment component of the survey and provide a choice set model demonstrating the acceptability of the “status quo” answer. The two questions asked to respondents for each choice set are: “Out of A, B and C, I prefer … ” and “If I had to sign a new contract today, I would choose:”, as illustrated in Table 2. In a previous study on this topic where this approach was used, we were able to calculate an average WTP level which was approximately one third lower compared to forcing respondents to choose their initially preferred contract (from the first question), rather than the status quo selected in the second question (Maxim and Roman, 2019). In support of this method, before starting the choice experiment, respondents were presented with a pre-filled choice set model that presented the case of a hypothetical respondent and the options chosen by them. Our hypothetical respondent choose to remain subscribed to their current electricity contract in the case of the second question (status quo), thus demonstrating to the respondents that the status quo option is an acceptable answer. This example also served as a method of ex-post validation of the collected data. One of the profiles in the choice set example included a perfect (unrealistic) combination of at-tributes (i.e., the highest possible benefits for the lowest possible price). Any respondent who did not choose this profile may be flagged as not understanding the choice set or not being attentive when responding to the survey.
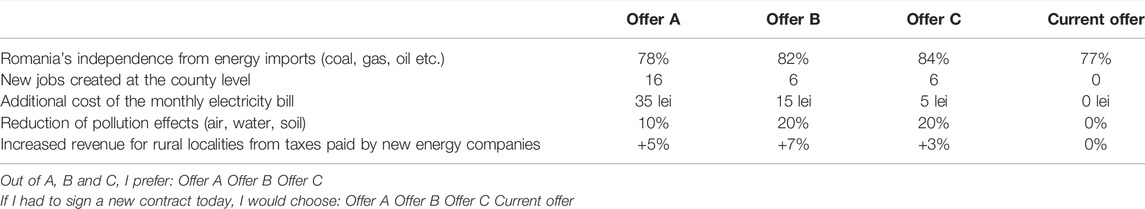
TABLE 2. Example of choice set used in questionnaire.
The results of logit analyses have been proven to be intrinsically robust even when omitting relevant variables (Cramer, 2007). Specialists in the field do not make any specific recommendations on robustness tests for logit models beyond the mitigation of the IIA assumption vulnerability discussed above (Train, 2009; Lancsar et al., 2017).
3.2 Validation of Energy Knowledge Scale
The data was collected using a questionnaire that, aside from the discrete choice experiment, includes several other questions and scales that are meant to identify factors that influence the WTP of household consumers for renewable energy development. We included a series of socio-demographic questions that are meant to test various hypotheses regarding factors that influence consumers’ WTP, as well as two more complex sections: a test of energy sector knowledge and a scale for lifestyle segmentation.
The first of these is a 10 item True/False/Do not know scale that seeks to measure whether the respondent is knowledgeable regarding the energy sector and the electricity market. We hypothesize that the WTP level can be correlated with the respondents’ awareness regarding the issues and inner workings of the energy sector. The 10 items included in the scale were:
• Carbon dioxide is a greenhouse gas;
• Over 80% of the electricity produced in Romania comes from fossil fuels (e.g., coal, natural gas, oil);
• During the process of generating electricity, nuclear power plants do not produce carbon dioxide;
• Production of electricity from renewable sources (wind, solar, hydroelectric, etc.) does not cause significant carbon dioxide emissions;
• Currently, from a legal standpoint, household consumers in Romania can change their electricity supplier;
• The electricity supplier is a company that owns the physical infrastructure through which the home is supplied with electricity;
• The electricity distributor is a company that owns the physical infrastructure through which the home is supplied with electricity;
• The companies E.On, ENEL, CEZ, Electrica, Engie are electricity distributors;
• Tariffs for electricity supplied to homes are set by state authorities;
• Some electricity suppliers offer the possibility of purchasing electricity produced only from renewable sources.
The Cronbach α indicator was used to verify the confidence of the proposed scale, in accordance with the recommendations in the literature on exploratory scales with dichotomous responses (Pallant, 2011). The analysis was performed for two distinct methods of coding the answers: “all or nothing” (the correct answers are marked with 1, and the incorrect ones or “I don’t know” with 0), and “intuitive response”, that acknowledges respondents, who selected the “I don’t know” option in instead of opting for the wrong answer (correct answers are marked with 1, “I don’t know” are marked with 0.5, and incorrect ones are marked with 0). Following the analysis, we determined a Cronbach α value of 0.474 for the “intuitive response” coding with an average inter-item correlation below the minimum level of 0.2 recommended in the reference works. Instead, for the “all or nothing” approach we obtained a Cronbach α value of 0.51, with an average inter-item correlation of 0.204 for a grouping of statements 1, 3, 4 and 6 (three related to greenhouse gasses and one related to the definition of electricity supplier). Despite the relatively low value of the scale confidence indicator, we can say that the combined answers provided in the case of the 4 statements tend to measure the same construct—the level of knowledge about the energy sector. By summing up the answers for each statement, we obtain an interval scale, with values between 0 and 4. This was used in subsequent analyses to verify the impact of “knowledge” on WTP.
3.3 Market Segmentation
Aside from socio-demographic variables and the level of knowledge regarding the energy sector, we hypothesize that WTP is also influenced by the consumer lifestyle. In order to assess whether a lifestyle-based market segmentation can be used to determine groups of consumers with distinct preferences and WTP levels, we used the 19 item life practices scale used successfully in a previous market segmentation study of household electricity consumers (Maxim, 2015b).
After the data collection stage, the 19 lifestyle practices were reduced to a more compact set of dimensions using Principal Components Analysis. The analysis was conducted through several iterations and, in accordance with existing literature on the subject (Malhotra and Birks, 2007; Field, 2009; Pallant, 2011), we identified that “Planning household expenses” and “Religious and spiritual activities” have weak correlations with all other practices. We settled on an optimal solution that could be clearly interpreted, consisting of 6 components. The factor loading matrix presented in Table 3 illustrates how these variables were grouped within the components.
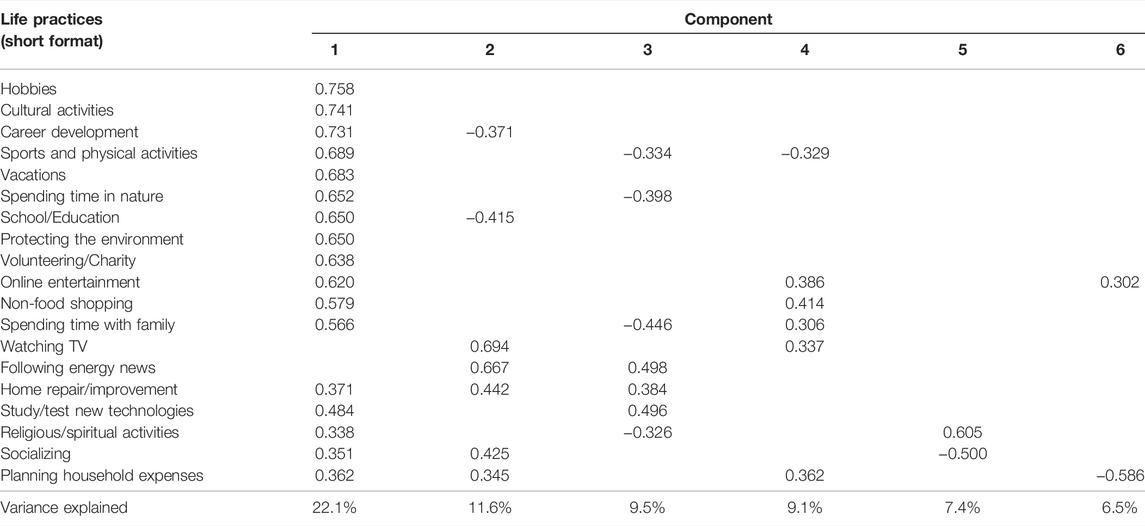
TABLE 3. Lifestyle components resulting from the Principal Components Analysis applied to the life practices scale (Factor loading matrix).
In order to be able to use these components more effectively in the market segmentation analysis, we assigned suggestive labels, which result from the direct and inverse correlations they have with different life practices:
• Component 1: Active careerism;
• Component 2: Proletarianism;
• Component 3: Introverted technologism;
• Component 4: Domestic sedentarism;
• Component 5: Religiosity;
• Component 6: Spontaneity.
The six components provide an eloquent picture of the types of activities which are practiced concurrently or distinctly by the population of the North-East region of Romania. The results of this analysis can also be used to issue future hypotheses in explaining the market behaviours of consumers from the studied population.
In order to identify market segments (groups of respondents with somewhat homogeneous preferences with regard to the electricity market), we utilized the hierarchical cluster analysis. The initial iterations based solely on the 6 lifestyle components mentioned above yielded market segments which were very similar in terms of socio-demographic traits. In order to improve the practical utility of the study, we also incorporated four socio-demographic variables in the analysis: age, education level, income level and rural/urban residence.
Table 4 provides a descriptive illustration of the four clusters generated. The values shown represent the mean or median value of each variable, depending on the type of scale used. The six lifestyle components have values between −2 and +2, depending on the intensity with which that specific component is practiced by each individual. In order to facilitate the identification of the segments during the data analysis process, they were assigned descriptive labels according to the mean/median values of the segmentation variables. The names chosen are: “urban middle class” (Cluster 1), “senior rural” (Cluster 2), “entry level” (Cluster 3), “rural middle class” (Cluster 4).
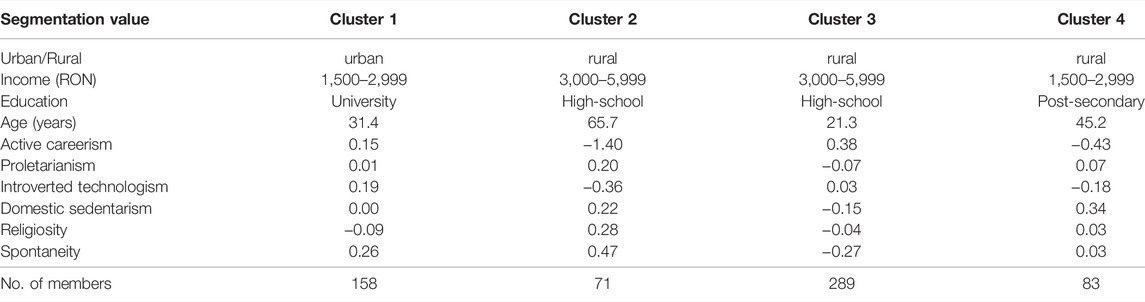
TABLE 4. Segmentation of the household consumer market based on lifestyle and socio-demographic traits (average or median values).
4 Results
The results of the study will be outlined progressively, starting with the estimated values of the households’ willingness to pay, continuing with the factors that influence these values and closing with a simulation of the evolution of the market based on the preferences expressed by the respondents.
4.1 Determining the WTP of Households for Renewable Energy
The descriptive statistics for the five independent variables are presented in Table 5 in two groups: those applicable to all profiles presented to the respondents and those applicable to the profiles chosen by the respondents. As seen in Table 6, after 18,060 experimental observations of choices made by respondents, all five attributes of RES development were found to have a statistically significant impact on consumer choice. This is our main regression model, which takes into consideration all respondents. These results are likely to hold true in the medium to long term, as they are based on a formulation that does not include the “status quo” option, in which consumers can refuse to opt for any of the alternative offerings presented in the experiment.
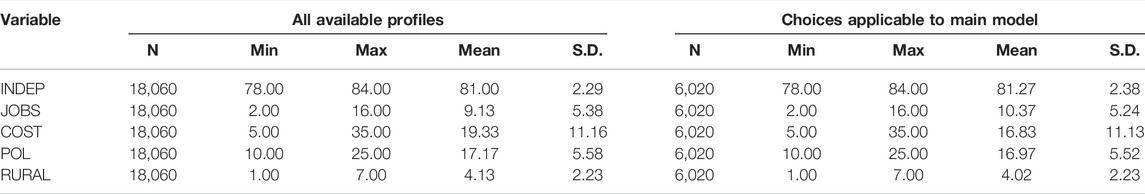
TABLE 5. Descriptive statistics of independent variables.
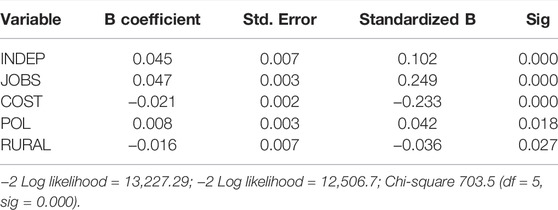
TABLE 6. Main utility model (medium and long term).
INDEP (Romania’s independence from energy imports—coal, gas, oil etc.), JOBS (new jobs created at the county level) and POL (reduction of pollution effects—air, water and soil) have a positive influence on the perceived utility of the electricity supply offerings. COST (additional cost of the monthly electricity bill) and RURAL (increased revenue for rural localities from taxes paid by new energy companies) have a negative impact on utility. Although the negative sign of the COST variable is natural, the result obtained for the RURAL variable is surprising. One possible explanation is that respondents may have a negative perception regarding the taxation of newly established enterprises. Thus, it is possible that respondents perceive this final attribute more as an obstacle in the path of RES development, rather than a societal benefit of the sector’s expansion. In fact, the findings of Cebotari et al. show that, in those rural communities in North-West Romania where RES projects were developed, there were no significant improvements in employment, size of the local budget, population or agriculture (Cebotari et al., 2017).
In order to estimate the short-term preferences and WTP of consumers, we excluded those respondents who are currently renting or who do not own their current dwelling, and thus are much less likely to have a say in the type of energy contract signed by the household in the short term. The model presented in Table 7 did provide respondents with a “status quo” option that does not increase monthly electricity bills and does not generate any societal benefits. This is likely to be a realistic option only in the short term, given the ambitious RES development targets assigned to Romania by the European Commission for the year 2030 (which will require new investments and, consequently, higher costs with green certificates).
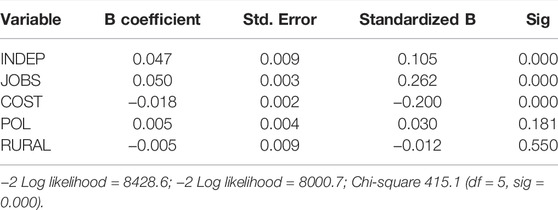
TABLE 7. Short-term utility model.
In the case of the short-term model, the number of experimental observations of choice drops to 11,508. In this formulation, we observe that only INDEP, JOBS and COST have a statistically significant impact on choice. The POL and RURAL variables do not significantly influence the utility of the electricity offerings.
The estimations of households’ marginal WTP for the development of the RES sector are illustrated in Table 8. The values presented assume a linear preference across the various attribute levels—a realistic assumption given that the experimental design used equal distances between these levels. The overall results show a significant increase (up to five times) in absolute terms for JOBS and INDEP compared to a similar study that we conducted six years ago on a smaller and more localized sample of households (Maxim, 2015b). There is also a 15% increase in the WTP for pollution reduction compared to the results of the same study. The results presented in Table 8 also show that the WTP of households for job creation and energy independence is higher in the short term, while the WTP for pollution reduction is not significant within the same time frame. The increased WTP in the short term is a surprising result, given that the inclusion of a non-payment “status quo” option usually leads to a decrease in WTP, as some respondents are allowed to not choose a profile that requires, for example, an increase in the electricity bill.
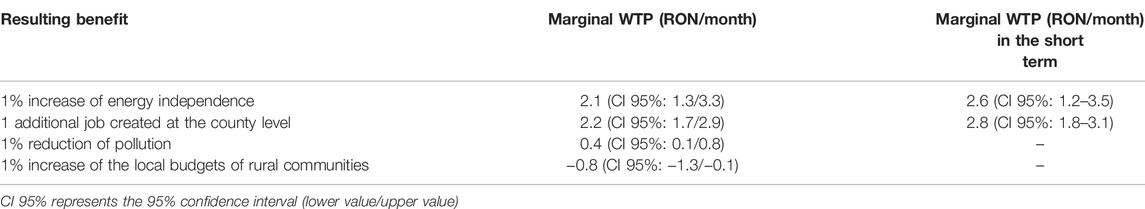
TABLE 8. Households’ marginal WTP for the societal benefits attributable to the development of the RES sector.
As mentioned in section 3.1, a mixed logit model can eliminate the IIA assumption issue specific to cMNL and provide more practically valid results. After running the analysis using a mixed logit procedure, we saw a notable increase of 37% in the marginal WTP for pollution reduction and a 22% decrease in the marginal WTP for jobs in the long term, while rural budget increases lose their statistical significance. In the short term, WTP for pollution reduction becomes statistically significant and is calculated at 0.5 RON/month, while WTP for jobs decreases by 23% compared to the cMNL short term model.
4.2 Identifying the Factors That Influence the WTP of Households for Renewable Energy
All of the variables included in the research instrument that are not part of the choice experiment have been evaluated with regard to their impact on WTP. One common approach of determining influence factors is to include them in the regression model as interaction effects. However, the process of identifying and reporting the results in the case of over 20 variables each potentially impacting one of the four RES attributes would have proved cumbersome to report and interpret. For this reason, we have decided to run the regression analysis on sub-samples of respondents, obtained by filtering the respondents based on each tested variable. By utilizing this approach, we can identify and report the impact on WTP in a clear and comprehensible manner. The results in Table 9 present the relative differences between the WTP for each attribute in the case of the variable filtered sub-sample and the complete sample used for the main regression model. The data only includes those cases for which the regression coefficients or the regression model itself have a statistical significance above 0.05.
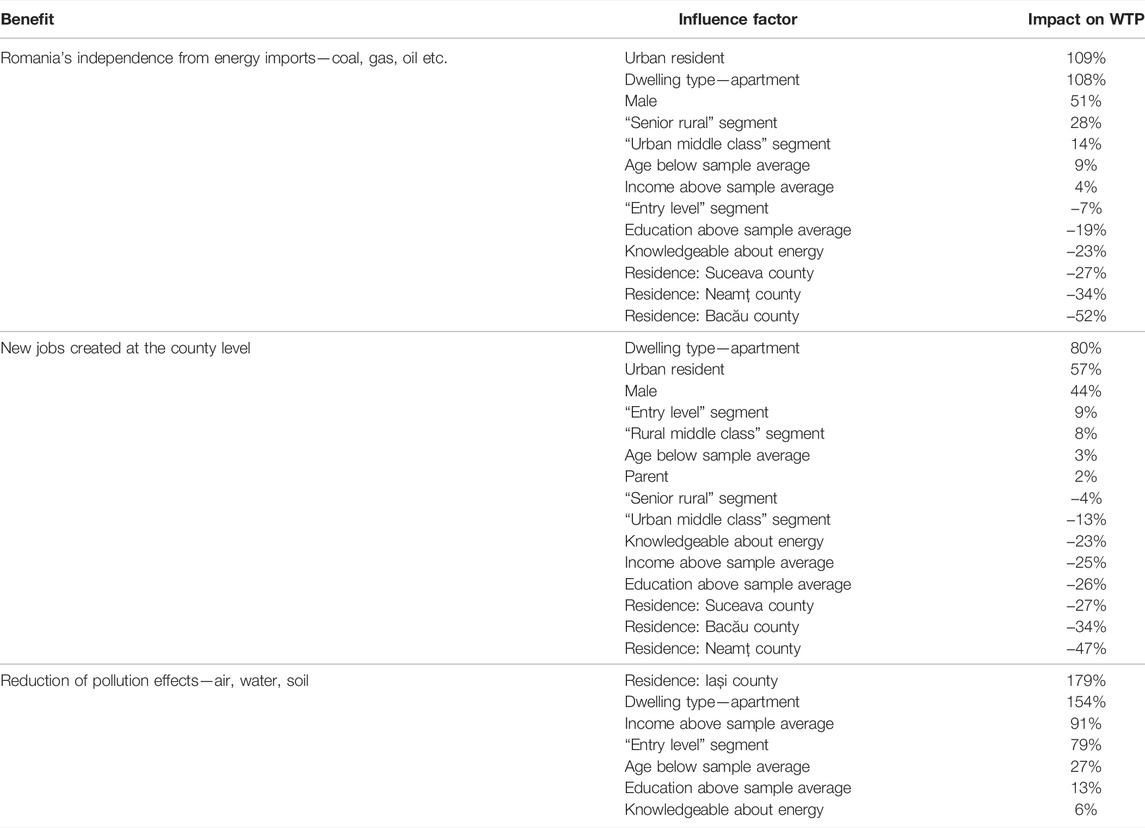
TABLE 9. Identification of factors that have a significant influence on WTP and their estimated impact.
The results presented in Table 9 are meant to indicate influence tendencies and should not be analysed strictly from the perspective of the illustrated values. Based on the table results, we are able to identify those factors which determine increases in WTP for the different societal benefits that can be attributed to RES development. Some of the results can be explained by mediators that are not difficult to intuit. For example, income levels in Iași county are higher compared to the rest of the North-East region, which explains the lower WTP of Bacău, Neamț and Suceava counties. However, other results can help us identify potential causal factors. For example, the much higher WTP of Iași county residents for pollution reduction compared to the rest of the sample is correlated, and likely caused, by the high level of air pollution encountered especially in the area of Iași city.
4.3 Simulating the Retail Electricity Market Based on Consumer Preferences
In order to estimate the market share potential of an electricity offering on a hypothetical market, we can employ the standard probability estimation formula for the cMNL model illustrated in Equation 2. In order to create a hypothetical marketplace for the North-East region of Romania, we constructed a series of realistic electricity offering profiles that focus on different RES benefits. The level of the price attribute was adjusted in order to match the other attributes (i.e. a profile with high levels of benefits has a high cost level). The results of the hypothetical market simulation are illustrated in Table 10.
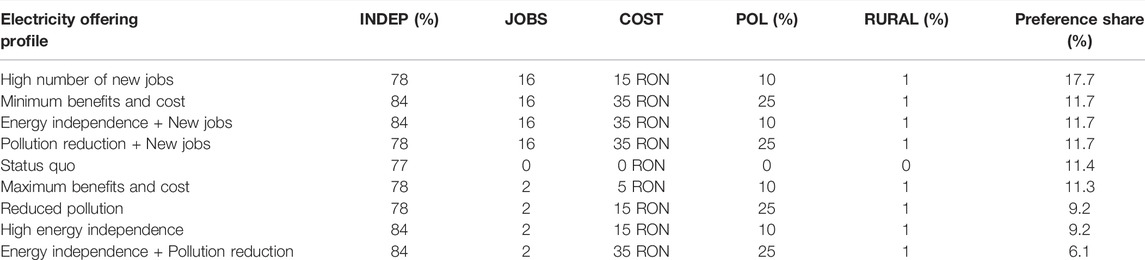
TABLE 10. Market/preference share simulation for competing electricity offerings.
In the hypothetical market presented in Table 10 we can observe the high impact that the price of the offering has on its potential market share. The level of the RURAL attribute was maintained at its lowest level, given its inverse correlation with utility. It is recommended that such an attribute be excluded from the commercial messages constructed by electricity suppliers for households. It should be noted that the “preference share” presented in Table 10 is not a guarantee of the attainable market share, but rather an indication of the probability that a specific offering will be chosen by customers in a specific, simulated, market context.
In spite of maximizing two of the benefits, the “Energy independence + Pollution reduction” offering has the worst share on the market, due to its high price. Contrarily, an average price level combined with the highest level of new jobs obtained the best result on the hypothetical market. Average results are observed in the case of the “Maximum benefits and cost” and the “Minimum benefits and cost” offerings, as well as in the case of maintaining the “Status quo”.
The preference of the population for electricity offerings which provide a high number of new jobs is perhaps not surprising if we take into account the socio-economic realities of the North-East Development Region of Romania. Statistical data regarding economic development and income show that the region is well below EU-27 average levels, but also national levels. In fact, over the last decade, the North-East region has constantly had the lowest GDP per capita (purchasing power standard) out of the 8 development regions of Romania, comprising just 46% of the EU average in 2020 (Eurostat, 2022). In terms of net disposable income at the household level, in 2019, the North-East region was ranked 236th out of 242 NUTS 2 territorial units in the EU-27, below all other regions in Romania—a situation that has not changed since 2015, when the region was ranked 240th. Economic difficulties for households are also evidenced by poverty statistics, with 41.4% of the North-East population at risk of poverty or social exclusion. Surprisingly, between 2015 and 2020, the region had both the lowest unemployment rate among youths (15–29 years of age) and overall unemployment rate out of all regions in Romania. Unemployment among youths has seen an overall downward trend from 7 pp. in 2015 to 6.1 pp. in 2020 (between 40–50% below the national level), while the overall unemployment rate has decreased slightly from 3.9 pp. in 2015 to 3.2 pp. in 2020 (consistently around 40% less than the national average). An overall underdeveloped economy, with low disposable household income and a low unemployment rate could explain the observed household preference for the creation of new jobs in a high income sector such as energy.
Consumers have shown a somewhat limited preference for national energy independence and even less so for the reduction of pollution effects. However, price hikes caused in part and accelerated by energy imports may result in a shift in consumer preferences in the near future. Throughout 2021, Europe has faced rising energy prices, in line with a global upward trend. According to Eurostat (2022) data, the Harmonised index of consumer prices for electricity, gas and other fuels has reached the level of 126.26 at the EU-27 level (with 2015 prices being the base reference of 100). EU Member States have managed to react the situation by agreeing that coordinated and urgent action is needed in order to mitigate the impact of this growth, especially on the most vulnerable households and businesses.
The invasion of Ukraine by Russia in 2022 followed by an ample set of economic and trade sanctions has amplified these trends on the energy markets, leading to further increases in energy prices and genuine concerns about the EU’s security of energy supply. The above mentioned index soared to 138.7 at the EU level by February 2022, with values above 170 in countries such as Italy, Netherlands and Belgium. Russia is currently the main supplier of crude oil, natural gas and solid fossil fuels to the EU, which depends on Russia for about 40% of its natural gas needs. In addition, in 2019, almost a third of crude oil imports from outside the EU came from Russia (27%). Although in Romania the import needs are lower, the talks around the topic of securing energy independence have intensified in the new geopolitical context.
If, in the autumn of 2021, the long-term plans of the EU and Romania regarding the energy future of the European bloc were built around the European Green Pact, the transition to the green economy, the current geopolitical context seems to postpone, at least for the time being, the measures announced in this direction. As a result, the European institutions, as well as the individual Member States, are looking for solutions to limit their energy dependence on Russia, a challenge that overlaps with that which involves protecting consumers from price increases. An agreement with the United States for the supply of liquefied natural gas (LNG) in the EU, the postponement of plans to close coal-fired power plants in some European countries are just some of the solutions currently being developed.
In Romania, one of the solutions discussed during this period to reduce energy dependence on Russia is the exploitation of Black Sea gas deposits, with a new law regarding offshore facilities and exploitation currently under the review of the Parliament. On the other hand, the production capacity of coal-fired power plants has recently been increased. Nuclear power is also a viable alternative, so the completion of the Cernavodă reactors is needed, and the development of other similar capacities could become a priority. At the same time, the import of LNG from the United States, Qatar or the Caspian area are being considered and the discussions have intensified around the need to finalize the BRUA pipeline projected to transport gas from Azerbaijan to Austria, a pipeline which traverses Greece, Bulgaria, Romania and Hungary (Romania Insider, 2022).
Renewable energy seems to have taken a back seat in the immediate strategic planning, or at least in the current political discourse. However, locally produced renewable energy from wind, solar and, crucially, large hydroelectric projects for peak demand, coupled with baseline nuclear production may prove to be the long-term solution given the long-term outlook for the current turn of events in Europe. Regardless of the source, energy prices are likely to remain high for a prolonged period, whilst securing energy independence becomes a new imperative for the countries of the European bloc and a fervent topic of public debate, which will undoubtedly raise the profile of this subject among consumers. As a result, energy independence is likely to become a factor of more significant weight in the coming years within the preferences of the households.
A solid conclusion that can be extracted from the results is that public opinion in the North-East Region of Romania supports renewable energy policies. The support is expressed at both perceptual and attitudinal level. A willingness to pay is expressed and measured. Thus, central authorities should feel more at ease considering the financial burden that the shift towards renewable energy sources requires. Extra taxation for companies that produce energy from renewable sources appears not to be a supported option given the tendency of the associated attribute to generate negative utility, as perceived by the public opinion. Besides, the domain is expected to create new jobs and contribute in a relevant manner to the development of the region. Thus, central authorities could feel encouraged to address rather fiscal facilities to encourage employment and professional reconversion instead.
5 Conclusions and Discussion
Our findings show that the creation of new jobs and the increase of the country’s energy independence, followed by the reduction of air, water and ground pollution are societal benefits that would realistically convince households to pay a premium on their electricity bill in order to support RES development. Increased local budgets for rural communities resulting from the taxation of newly established energy production companies is seen as having a negative utility and is not one of the desired outcomes of ESR development. As expected, respondents with higher than average income and those living in urban areas or apartments have a higher WTP for renewable energy across all attributes. Males have a higher WTP for RES, but only in the case of the new job creation and energy independence attributes. Interestingly, respondents with an above average education level are willing to pay less for new jobs and energy independence, but are willing to pay more for pollution reduction, compared to the WTP of the complete sample of households. Pollution reduction does not have a significant impact on preferences and WTP in the short term.
Theoretically, this study advances existing knowledge primarily from a methodological standpoint. Firstly, by demonstrating the implementation of a choice modelling approach with two distinct temporal horizons: short term versus medium/long term. The approach illustrated in our study is especially useful in designing adequate policies (e.g., fiscal and financial support schemes) after the general strategic direction has already been established (e.g., the share of renewable energy in consumption needs to reach a specific level by 2030). Secondly, we have also demonstrated the use of a market segmentation procedure using a mix of lifestyle and socio-demographic variables, thus increasing the practical utility of the resulting clusters for marketing specialists. Finally, a minor contribution is the demonstration of the use of market simulations in the retail energy sector based on choice preferences.
The policy implications of the study are primarily related to the design of adequate fiscal and support policies. Thus, from the perspective of governmental authorities, outlining the policies that can support the development of renewable energy production may be achieved within the limits of the financial sacrifice that consumers are willing to make, but should be focused on providing those benefits that households are interested in. For example, they should encourage the development of production units that generate a higher number of job-years per GWh, such as solar photovoltaic and thermal, biomass and hydroelectric. According to the results obtained in the current study, as well as the exploratory study conducted in 2015 by the research team, it is likely that a policy based on supporting the development of rural areas by taxing the new energy companies may not be attractive to consumers—in fact it may lead to a rejection of renewables.
The practitioner implications of our study stem primarily from the market segmentation procedure and the identification of WTP influence factors. Our results show that there is a willingness of consumers to pay more for an electricity supply contract, if it will provide a series of societal benefits, such as an increase in the number of local jobs, the reduction of fossil fuel imports and the reduction of pollution (all of which are correlated with an increase in production from renewable sources). These indirect benefits can be used in promotional campaigns for the contract offerings and they can provide avenues through which public relations events and strategies can be developed. Furthermore, by identifying the socio-demographic and behavioural factors that influence WTP, electricity suppliers are able to fine-tune their offerings, advertising and targeting based on the traits of the decision-makers in the households.
Some of the limitations of our study result from the data collection method and, to some extent, the sampling procedure. With regard to data collection, we believe that the online administration of an instrument that contains a set of choice tasks can generate reliability issues. Ordinary respondents may assume that the choice experiment is a regular survey, during which they are not confronted with this type of task. The unusual nature of the request may seem complex or even overwhelming for some respondents, resulting in unreliable responses which cannot be easily identified ex-post. With regard to sampling, although we did use the quota method to insure a diverse set of respondents, the fact that the sample is not representative within the target population makes the absolute WTP values less reliable. Finally, as stated in the paper, one of the risks associated with using the cMNL model is generated by the IIA assumption, which can lead to results that are less valid from a practical standpoint. By using a mixed logit model, which relaxes the IIA assumption, we were able to identify a notable increase in MWTP for pollution reduction, although its impact on overall WTP did not change dramatically. However, we believe that the absolute marginal WTP values for pollution reduction and even job creation resulting from the cMNL model should be used with caution.
Some of the results, such as the fact that males have a higher WTP or the fact that rural development does not have a significant impact on choice are somewhat surprising and should be further explored through more extensive studies on the same population in order to see if the same results apply. Finally, we believe that the overall findings need to be taken into consideration by policy-makers in order to improve public acceptance of the renewable energy transition.
Data Availability Statement
The raw data supporting the conclusion of this article will be made available by the authors, without undue reservation.
Ethics Statement
Ethical review and approval was not required for the study on human participants in accordance with the local legislation and institutional requirements. Written informed consent for participation was not required for this study in accordance with the national legislation and the institutional requirements.
Author Contributions
AM contributed to the conceptualization, methodology, data analysis, validation and manuscript writing. D-TJ contributed to the methodology, validation, data collection and manuscript writing. TR contributed to the conceptualization, methodology, validation and supervision of the research.
Funding
This work was partly supported by a grant of the Romanian Ministry of Research and Innovation, CNCS-UEFISCDI, project number PN-III-P1-1.1-PD-2016-1864, within PNCDI III.
Conflict of Interest
The authors declare that the research was conducted in the absence of any commercial or financial relationships that could be construed as a potential conflict of interest.
Publisher’s Note
All claims expressed in this article are solely those of the authors and do not necessarily represent those of their affiliated organizations, or those of the publisher, the editors and the reviewers. Any product that may be evaluated in this article, or claim that may be made by its manufacturer, is not guaranteed or endorsed by the publisher.
References
Accent and RAND Europe (2010). Review of Stated Preference and Willingness to Pay Methods. London: Accent.
ANRE (2022a). Puterea instalata in capacitatile de productie energie electrica. Available at: https://www.anre.ro/ro/energie-electrica/rapoarte/puterea-instalata-in-capacitatiile-de-productie-energie-electrica (Accessed May 4, 2022).
ANRE (2022b). Raport Privind Rezultatele Monitorizării Pieţei de Energie Electrică în Luna Decembrie 2021. Bucharest: ANRE.
ANRE (2021). Tarife/preturi Reglementate. Available at: https://www.anre.ro/ro/energie-electrica/legislatie/documente-de-discutie-ee1/tarife-preturi-reglementate/(Accessed May 4, 2022).
Balezentis, T., Streimikiene, D., Mikalauskas, I., and Shen, Z. (2021). Towards Carbon Free Economy and Electricity: The Puzzle of Energy Costs, Sustainability and Security Based on Willingness to Pay. Energy 214, 119081. doi:10.1016/j.energy.2020.119081
Cebotari, S., Cristea, M., Moldovan, C., and Zubascu, F. (2017). Renewable Energy's Impact on Rural Development in Northwestern Romania. Energy Sustain. Dev. 37, 110–123. doi:10.1016/j.esd.2017.02.002
Cramer, J. S. (2007). Robustness of Logit Analysis: Unobserved Heterogeneity and Mis-Specified Disturbances. Oxf. Bull Econ Stats 69, 545–555. doi:10.1111/j.1468-0084.2007.00445.x
Cristea, C., Cristea, M., Birou, I., and Tîrnovan, R.-A. (2020). Economic Assessment of Grid-Connected Residential Solar Photovoltaic Systems Introduced under Romania's New Regulation. Renew. Energy 162, 13–29. doi:10.1016/j.renene.2020.07.130
Dragomir, G., Șerban, A., Năstase, G., and Brezeanu, A. I. (2016). Wind Energy in Romania: A Review from 2009 to 2016. Renew. Sustain. Energy Rev. 64, 129–143. doi:10.1016/j.rser.2016.05.080
Electrica Furnizare (2022). Oferte Piață Concurențială. Available at: https://www.electricafurnizare.ro/preturi-si-tarife/oferte-piata-concurentiala/(Accessed May 4, 2022).
European Commission Joint Research Centre (2021). Technical Assessment of Nuclear Energy with Respect to the ‘do No Significant Harm’ Criteria of Regulation (EU) 2020/852 (‘Taxonomy Regulation’) JRC124193. Petten: European Commission Joint Research Centre.
European Union (2019). Special Eurobarometer 490: Climate Change. Available at: https://data.europa.eu/data/datasets/s2212_91_3_490_eng (Accessed December 10, 2021).
Eurostat (2022). Eurostat. Available at: https://ec.europa.eu/eurostat https://www.packenergy.ro/piata-de-energie-electrica/(Accessed May 4, 2022).
Gao, L., Hiruta, Y., and Ashina, S. (2020). Promoting Renewable Energy through Willingness to Pay for Transition to a Low Carbon Society in Japan. Renew. Energy 162, 818–830. doi:10.1016/j.renene.2020.08.049
Genoud, S., and Lesourd, J.-B. (2009). Characterization of Sustainable Development Indicators for Various Power Generation Technologies. Int. J. Green Energy 6, 257–267. doi:10.1080/15435070902880943
Guo, J., Susilo, Y., Antoniou, C., and Pernestål, A. (2021). When and Why Do People Choose Automated Buses over Conventional Buses? Results of a Context-dependent Stated Choice Experiment. Sustain. Cities Soc. 69, 102842. doi:10.1016/j.scs.2021.102842
Hauber, A. B., González, J. M., Groothuis-Oudshoorn, C. G. M., Prior, T., Marshall, D. A., Cunningham, C., et al. (2016). Statistical Methods for the Analysis of Discrete Choice Experiments: A Report of the ISPOR Conjoint Analysis Good Research Practices Task Force. Value Health 19, 300–315. doi:10.1016/j.jval.2016.04.004
Heggy, E., Sharkawy, Z., and Abotalib, A. Z. (2021). Egypt's Water Budget Deficit and Suggested Mitigation Policies for the Grand Ethiopian Renaissance Dam Filling Scenarios. Environ. Res. Lett. 16, 074022. doi:10.1088/1748-9326/ac0ac9
IEA (2020b). Electricity Information. Available at: https://www.iea.org/data-and-statistics/data-product/electricity-information (Accessed on October 5, 2021).
International Renewable Energy Agency (2015). Africa 2030: Roadmap for a Renewable Energy Future. Abu Dhabi: IRENA.
Karasmanaki, E., Galatsidas, S., and Tsantopoulos, G. (2019). An Investigation of Factors Affecting the Willingness to Invest in Renewables Among Environmental Students: A Logistic Regression Approach. Sustainability 11 (18), 5012. doi:10.3390/su11185012
Kemperman, A. (2021). A Review of Research into Discrete Choice Experiments in Tourism: Launching the Annals of Tourism Research Curated Collection on Discrete Choice Experiments in Tourism. Ann. Tour. Res. 87, 103137. doi:10.1016/j.annals.2020.103137
Knapp, L., O'Shaughnessy, E., Heeter, J., Mills, S., and DeCicco, J. M. (2020). Will Consumers Really Pay for Green Electricity? Comparing Stated and Revealed Preferences for Residential Programs in the United States. Energy Res. Soc. Sci. 65, 101457. doi:10.1016/j.erss.2020.101457
Koltsaklis, N. E., Dagoumas, A. S., Seritan, G., and Porumb, R. (2020). Energy Transition in the South East Europe: The Case of the Romanian Power System. Energy Rep. 6, 2376–2393. doi:10.1016/j.egyr.2020.07.032
Ku, S.-J., and Yoo, S.-H. (2010). Willingness to Pay for Renewable Energy Investment in Korea: A Choice Experiment Study. Renew. Sustain. Energy Rev. 14 (8), 2196–2201. doi:10.1016/j.rser.2010.03.013
Lancsar, E., Fiebig, D. G., and Hole, A. R. (2017). Discrete Choice Experiments: A Guide to Model Specification, Estimation and Software. PharmacoEconomics 35, 697–716. doi:10.1007/s40273-017-0506-4
Lee, C.-Y., and Heo, H. (2016). Estimating Willingness to Pay for Renewable Energy in South Korea Using the Contingent Valuation Method. Energy Policy 94, 150–156. doi:10.1016/j.enpol.2016.03.051
Levenda, A. M., Behrsin, I., and Disano, F. (2021). Renewable Energy for Whom? A Global Systematic Review of the Environmental Justice Implications of Renewable Energy Technologies. Energy Res. Soc. Sci. 71, 101837. doi:10.1016/j.erss.2020.101837
Longo, A., Markandya, A., and Petrucci, M. (2008). The Internalization of Externalities in the Production of Electricity: Willingness to Pay for the Attributes of a Policy for Renewable Energy. Ecol. Econ. 67 (1), 140–152. doi:10.1016/j.ecolecon.2007.12.006
Loomis, J. B. (2014). 2013 WAEA Keynote Address: Strategies for Overcoming Hypothetical Bias in Stated Preference Surveys. J. Agric. Resour. Econ. 39, 34–46. doi:10.22004/ag.econ.168258
Malhotra, N. K., and Birks, D. F. (2007). Marketing Research. An Applied Approach. 3rd European ed. London: Prentice-Hall.
Maxim, A. (2015a). “Piața Energiei Electrice Regenerabile: O Abordare Din Perspectiva Consumatorului Casnic,”in Iași Sedcom Libris.
Maxim, A. (2015b). Relevant Attributes of Renewable Energy Development in the Case of Romanian Households. Procedia Econ. Finance 20, 372–382. doi:10.1016/S2212-5671(15)00086-6
Maxim, A., Roman, T., and Jijie, D-T. (2021). “Household Support for Renewable Energy Development - a Choice Experiment and Survey Design,” in Challenges of COVID-19 Pandemics for Economics and Business Administration. Editors C. T. Roman, C. M. Apostoaie, M. Asandului, I. Bilan, E. Cigu, and M. Georgescu (Iași: Iași: Editura Universităţii „Alexandru Ioan Cuza” din Iași), 303–312.
Maxim, A., and Roman, T. (2019). The Status Quo's Role in Improving the Estimation of Willingness to Pay in Choice Experiments. Ejsd 8 (5), 422. doi:10.14207/ejsd.2019.v8n5p422
McPhedran, R., and Toombs, B. (2021). Efficacy or Delivery? an Online Discrete Choice Experiment to Explore Preferences for COVID-19 Vaccines in the UK. Econ. Lett. 200, 109747. doi:10.1016/j.econlet.2021.109747
Mezősi, A., Szabó, L., and Szabó, S. (2018). Cost-efficiency Benchmarking of European Renewable Electricity Support Schemes. Renew. Sustain. Energy Rev. 98, 217–226. doi:10.1016/j.rser.2018.09.001
Ministry of Energy (2022). PNRR. Available at: http://energie.gov.ro/pnrr/(Accessed May 5, 2022).
Mišík, M. (2022). The EU Needs to Improve its External Energy Security. Energy Policy 165, 112930. doi:10.1016/j.enpol.2022.112930
Mosly, I., and Makki, A. (2018). Current Status and Willingness to Adopt Renewable Energy Technologies in Saudi Arabia. Sustainability 10 (11), 4269. doi:10.3390/su10114269
Năstase, G., Șerban, A., Dragomir, G., Brezeanu, A. I., and Bucur, I. (2018). Photovoltaic Development in Romania. Reviewing what Has Been Done. Renew. Sustain. Energy Rev. 94, 523–535. doi:10.1016/j.rser.2018.06.056
Nazare, L. (2020). The Romanian Renewable Energy Sector: A Potential Still Untapped. Bucharest: Bankwatch.
Ntanos, S., Kyriakopoulos, G., Chalikias, M., Arabatzis, G., and Skordoulis, M. (2018). Public Perceptions and Willingness to Pay for Renewable Energy: A Case Study from Greece. Sustainability 10 (3), 687. doi:10.3390/su10030687
Oehlmann, M., Glenk, K., Lloyd-Smith, P., and Meyerhoff, J. (2021). Quantifying Landscape Externalities of Renewable Energy Development: Implications of Attribute Cut-Offs in Choice Experiments. Resour. Energy Econ. 65, 101240. doi:10.1016/j.reseneeco.2021.101240
On, E. (2022). E.ON Start Electric. Available at: https://www.eon.ro/produs-start-electric (Accessed May 3, 2022).
Orme, B. K. (2014). Getting Started with Conjoint Analysis: Strategies for Product Design and Pricing Research. 3rd ed. Manhattan Beach, CA: Research Publishers LLC.
Pack Energy (2022). Prețul Energiei Electrice – Ce Este Și Din Ce Este Compus. Available at: https://www.packenergy.ro/piata-de-energie-electrica/(Accessed May 2, 2022).
Pallant, J. (2011). SPSS Survival Manual: A Step by Step Guide to Data Analysis Using SPSS. 4th ed. Crows Nest: Allen & Unwin.
Paravantis, J. A., Stigka, E., Mihalakakou, G., Michalena, E., Hills, J. M., and Dourmas, V. (2018). Social Acceptance of Renewable Energy Projects: A Contingent Valuation Investigation in Western Greece. Renew. Energy 123, 639–651. doi:10.1016/j.renene.2018.02.068
Pavlakovič, B., Okanovic, A., Vasić, B., Jesic, J., and Šprajc, P. (2022). Small Hydropower Plants in Western Balkan Countries: Status, Controversies and a Proposed Model for Decision Making. Energ Sustain Soc. 12, 9. doi:10.1186/s13705-022-00335-7
Rakotonarivo, O. S., Schaafsma, M., and Hockley, N. (2016). A Systematic Review of the Reliability and Validity of Discrete Choice Experiments in Valuing Non-market Environmental Goods. J. Environ. Manag. 183 (1), 98–109. doi:10.1016/j.jenvman.2016.08.032
RELY (2022). Renewable Energy and Landscape Quality. Available at: http://cost-rely.eu/(Accessed April 29, 2022).
Romania Insider (2022). EC Includes Second Stage of BRUA Pipeline Among Critically Important Projects. Available at: https://www.romania-insider.com/brua-second-stage-ec-imp-projects-nov-2021 (Accessed May 3, 2022).
Roth, M., Eiter, S., Röhner, S., Kruse, A., Schmitz, S., Frantál, B., et al. (2022). Renewable Energy and Landscape Quality. Berlin: Jovis.
Rusmevichientong, P., Jaynes, J., and Chandler, L. (2021). Understanding Influencing Attributes of Adolescent Snack Choices: Evidence from a Discrete Choice Experiment. Food Qual. Prefer. 92, 104171. doi:10.1016/j.foodqual.2020.104171
Sauvageot, E. P. (2020). Between Russia as Producer and Ukraine as a Transit Country: EU Dilemma of Interdependence and Energy Security. Energy Policy 145, 111699. doi:10.1016/j.enpol.2020.111699
Sayed, E. T., Wilberforce, T., Elsaid, K., Rabaia, M. K. H., Abdelkareem, M. A., Chae, K.-J., et al. (2021). A Critical Review on Environmental Impacts of Renewable Energy Systems and Mitigation Strategies: Wind, Hydro, Biomass and Geothermal. Sci. Total Environ. 766, 144505. doi:10.1016/j.scitotenv.2020.144505
Shen, N., Deng, R., Liao, H., and Shevchuk, O. (2020). Mapping Renewable Energy Subsidy Policy Research Published from 1997 to 2018: A Scientometric Review. Util. Policy 64, 101055. doi:10.1016/j.jup.2020.101055
Simionescu, M., Schneider, N., and Gavurova, B. (2022). Decarbonized Energies and the Wealth of Three European Nations: A Comparative Nexus Study Using Granger and Toda-Yamamoto Approaches. Front. Environ. Sci. 9, 817982. doi:10.3389/fenvs.2021.817982
Srivastava, A., Van Passel, S., Valkering, P., and Laes, E. J. W. (2021). Power Outages and Bill Savings: A Choice Experiment on Residential Demand Response Acceptability in Delhi. Renew. Sustain. Energy Rev. 143, 110904. doi:10.1016/j.rser.2021.110904
Suman, S. (2018). Hybrid Nuclear-Renewable Energy Systems: A Review. J. Clean. Prod. 181, 166–177. doi:10.1016/j.jclepro.2018.01.262
Train, K. E. (2009). Discrete Choice Methods with Simulation. Cambridge: Cambridge University Press.
Transelectrica (2022). Avize/Contracte. Available at: https://www.transelectrica.ro/ro/web/tel/avize-contracte (Accessed May 2, 2022).
Tsagarakis, K. P., Mavragani, A., Jurelionis, A., Prodan, I., Andrian, T., Bajare, D., et al. (2018). Clean vs. Green: Redefining Renewable Energy. Evidence from Latvia, Lithuania, and Romania. Renew. Energy 121, 412–419. doi:10.1016/j.renene.2018.01.020
US Department of Energy (2021). 3 Reasons Why Nuclear Is Clean and Sustainable. Available at: https://www.energy.gov/ne/articles/3-reasons-why-nuclear-clean-and-sustainable (Accessed December 10, 2021).
Van Dongen, R. P., and Timmermans, H. J. P. (2019). Preference for Different Urban Greenscape Designs: A Choice Experiment Using Virtual Environments. Urban For. Urban Green. 44, 126435. doi:10.1016/j.ufug.2019.126435
Vecchiato, D., and Tempesta, T. (2015). Public Preferences for Electricity Contracts Including Renewable Energy: A Marketing Analysis with Choice Experiments. Energy 88, 168–179. doi:10.1016/j.energy.2015.04.036
Wüstenhagen, R., Wolsink, M., and Bürer, M. J. (2007). Social Acceptance of Renewable Energy Innovation: an Introduction to the Concept. Energy Policy 35, 2683–2691. doi:10.1016/j.enpol.2006.12.001
Keywords: renewable energy, willingness to pay, discrete choice experiment, lifestyle segmentation, energy independence
Citation: Maxim A, Jijie D-T and Roman T (2022) Why Are Households Willing to Pay for Renewable Energy? Lessons From Romania. Front. Environ. Sci. 10:921152. doi: 10.3389/fenvs.2022.921152
Received: 15 April 2022; Accepted: 30 May 2022;
Published: 17 June 2022.
Edited by:
Martin Thomas Falk, University of South-Eastern Norway (USN), NorwayReviewed by:
Marius Constantin, Bucharest Academy of Economic Studies, RomaniaPavel Atanasoae, Ștefan cel Mare University of Suceava, Romania
Maria Bostenaru Dan, Ion Mincu University of Architecture and Urbanism, Romania
Andreea Zamfir, Bucharest Academy of Economic Studies, Romania
Copyright © 2022 Maxim, Jijie and Roman. This is an open-access article distributed under the terms of the Creative Commons Attribution License (CC BY). The use, distribution or reproduction in other forums is permitted, provided the original author(s) and the copyright owner(s) are credited and that the original publication in this journal is cited, in accordance with accepted academic practice. No use, distribution or reproduction is permitted which does not comply with these terms.
*Correspondence: Alexandru Maxim, maxim.alexandru@uaic.ro