Stable Isotopes from Museum Specimens May Provide Evidence of Long-Term Change in the Trophic Ecology of a Migratory Aerial Insectivore
 Philina A. English
 David J. Green
 Joseph J. Nocera2
- 1Department of Biological Sciences, Simon Fraser University, Burnaby, BC, Canada
- 2Faculty of Forestry and Environmental Management, University of New Brunswick, Fredericton, NB, Canada
Identifying the mechanisms of ecological change is challenging in the absence of long-term data, but stable isotope ratios of museum specimen tissues may provide a record of diet and habitat change through time. Aerial insectivores are experiencing the steepest population declines of any avian guild in North America and one hypothesis for these population declines is a reduction in the availability of prey. If reduced prey availability is due to an overall reduction in insect abundance, we might also expect populations of higher trophic level insects to have declined most due to their greater sensitivity to a variety of disturbance types. Because nitrogen isotope ratios (δ15N) tend to increase with trophic-level, while δ13C generally increases with agricultural intensification, we used δ15N and δ13C values of bird tissues grown in winter (claw) and during breeding (feathers) from museum specimens spanning 1880–2005, and contemporary samples from breeding birds (2011–2013) to test for diet change in a migratory nocturnal aerial insectivore, Eastern Whip-poor-will (Antrostomus vociferus) breeding in Ontario, Canada. To test if environmental baselines have changed as a result of synthetic N fertilizer use, habitat conversion or climate, we also sampled δ15N values of three potential prey species collected from across the same geographic region and time period. Over the past 100 years, we found a significant decline in δ15N in tissues grown on both the breeding and wintering grounds. Prey species did not show a corresponding temporal trend in δ15N values, but our power to detect such a trend was limited due to higher sample variance. Amongst contemporary bird samples, δ15N values did not vary with sex or breeding site, but nestlings had lower δ15N values than adults. These results are consistent with the hypothesis that aerial insectivore populations are declining due to changes in abundance of higher trophic-level prey, but we caution that museum-based stable isotope studies of terrestrial food chains will require new approaches to assessing baseline change. Once addressed, an ability to decode the historical record locked inside museum collections could enhance our understanding of ecological change and inform conservation decisions.
Introduction
Birds have acted as sentinels of environmental threats since canaries were first taken into coalmines. Concurrent population declines among bird species with shared life history traits can help us identify the risks associated with global climate change (Wikelski and Tertitski, 2016). In North America, many of the bird species currently experiencing the steepest population declines are aerial insectivores that migrate long distances (Blancher et al., 2007; Nebel et al., 2010; North American Bird Conservation Initiative Canada, 2012; Smith et al., 2015). Since these species occupy a variety of breeding and wintering habitats, loss of any single habitat type cannot explain the similarities in population trajectories (Smith et al., 2015; Michel et al., 2016). In contrast, all of these species share a diet dominated by the adult life-stages of insects, and have foraging behaviors that are particularly energetically demanding and dependent on weather conditions conducive to insect flight. These similarities in prey choice and behavior suggest that insect availability could be the common factor limiting their populations (Nebel et al., 2010; Smith et al., 2015).
Long-term data on insect abundances in the Americas are sparse, but large reductions in insect abundance have been documented for parts of Europe (Conrad et al., 2006; Hallmann et al., 2017). If overall insect abundances are decreasing, we could expect populations of higher trophic-level insects to decline most quickly (Didham et al., 1998) because these species would be most sensitive to reductions in prey availability at lower trophic levels within their food webs (Pimm and Lawton, 1977; Purvis et al., 2000; Hamer et al., 2015). Consequently, birds that rely on insect prey could be forced to feed at lower trophic levels. Because N and C isotope ratios in the body tissues of consumers reflect isotope ratios in their diet, stable isotope ratios can be used to detect shifts in diet and trophic level. Nitrogen isotope ratios in consumers (δ15N) are influenced by diet and nutritional status, but on average are ~ 3‰ higher than those of their prey due to the lighter isotope of nitrogen (14N) being preferentially excreted in urea (Peterson and Fry, 1987; Sears et al., 2008). In contrast, C isotope ratios (δ13C) are relatively conserved across trophic levels, but vary depending on the photosynthetic pathways and the degree of water stress experienced at the base of the food web (Peterson and Fry, 1987; Still and Powell, 2010; Basu et al., 2015).
For many species, the isotope ratios of museum specimen tissues may provide the only record of dietary change over historic time scales. While initially applied to bone collagen to identify shifts in prehistoric human diets (Ambrose, 1986), this technique has also been applied to animal bones and keratinized tissues to explore changes in marine and terrestrial food webs (Thompson et al., 1995; Fox-Dobbs et al., 2007; Farmer and Leonard, 2011; Crowley et al., 2012; Wiley et al., 2013; Moreno et al., 2016) and linkages between them (Darimont and Reimchen, 2002; Chamberlain et al., 2005; Blight et al., 2015; Matsubayashi et al., 2015). Shifts in diet between types of mammal carrion (marine, terrestrial herbivores, and grain-fed livestock) by California Condors (Gymnogyps californianus; Chamberlain et al., 2005) and from vertebrate herbivores and toward plant materials by Brown Bears (Ursus arctos; Matsubayashi et al., 2015) have been detected by comparing both the δ15N and δ13C values of museum specimen tissues from the predators and potential prey types during different time periods. Like bone, both feather and fur keratins retain the isotopic signatures from the time of growth and remain chemically inert in museum collections, however they have the advantage of being easily sampled from living specimens as well (Mizutani et al., 1990; Hobson, 1999). Indeed, timeseries of feathers including samples from both living birds and museum collections have been used to link population declines in an endangered alcid, Marbled Murrelet (Brachyramphus marmoratus) to reductions in the relative quantity of high trophic-level fish in their diet over the twentieth century (Becker and Beissinger, 2006; Norris et al., 2007; Gutowsky et al., 2009).
Interpretation of stable isotope ratios remains challenging because it relies on knowing the isotopic signatures of the relevant producers in an ecosystem (Ohkouchi et al., 2015). In marine systems, sampling of the phytoplankton or primary consumers, like forage fish, have been used to estimate baseline isotope values for particular food chains (Blight et al., 2015). In terrestrial communities, plant foliage forms the base of many food chains. Foliage isotope values vary across spatial and temporal scales depending on climate, disturbance, and nutrient availability (Amundson et al., 2003; Craine et al., 2009; Pardo and Nadelhoffer, 2010; Popa-Lisseanu et al., 2015; Moreno et al., 2016; Taki et al., 2017) and with physiological differences between plant species, including variation in photosynthetic pathways (Basu et al., 2015; Courty et al., 2015; Taki et al., 2017) and mycorrhizal associations (Evans, 2001; Craine et al., 2009; Hynson et al., 2016). At longer time scales changes in atmospheric baselines, climate, and habitat succession can all cause progressive change in foliage isotopic signatures (Evans and Belnap, 1999; Fox-Dobbs et al., 2007; Wang et al., 2007; Taki et al., 2017). Atmospheric CO2 is becoming increasingly depleted due to the burning of fossil fuels (Keeling, 1979). Because atmospheric CO2 is the sole source of carbon integrated into tissues of producers, we can correct for this change over time (Verburg, 2007). Temperature and rainfall can influence fractionation of carbon between the atmosphere and plant tissues, but the direction of change differs depending on the photosynthetic pathway involved (Basu et al., 2015) and this variation is ~1/10th that of the differences in fractionation between C3 plants than for C4 plants (Peterson and Fry, 1987). Successional changes in mean foliage δ13C values are therefore most likely to represent changes in community composition (Taki et al., 2017). In contrast to carbon, the nitrogen integrated into plant tissues can come from a wide range of sources. To become accessible to plants, nitrogen must first either be fixed naturally by lightning or bacteria, or fixed synthetically and applied as fertilizers. Once integrated into plant or animal tissues, nitrogen is also recycled in the soil by fungal and bacterial decomposers. Synthetic fertilizer has a δ15N value near 0‰ (equal to nitrogen in its atmospheric N2 gas form), while other sources of fixed nitrogen can be enriched or depleted to varying degrees. An ice core sampled in Greenland and lake sediments throughout North America show evidence of declining δ15N values in -NO3 in the atmosphere that has been linked to the use of synthetic fertilizers (Holtgrieve et al., 2011; Felix and Elliott, 2013), but long-term studies of trophic ecology in marine systems have not found evidence of ecosystem wide change in δ15N values (Thompson et al., 1995; Blight et al., 2015). Whether the quantity of synthetically-fixed nitrogen deposited directly from the atmosphere (Li et al., 2016), relative to the nitrogen being fixed naturally and recycled within terrestrial ecosystems, has systematically shifted baseline nitrogen isotope ratio is still unknown. Disturbance initially increases δ15N values of plant foliage and then forest succession results in a subsequent decline, likely due to both a decreasing surplus of nitrogen and increasing dependence on mycorrhizal associations (Wang et al., 2007). All of these factors can influence the stable isotope signatures of organisms near the base of a food web, and therefore also how we interpret the signatures found at higher trophic levels.
Using Eastern Whip-poor-wills (Antrostomus vociferus; hereafter “whip-poor-wills”) as a case study, we explore the utility of museum collections and stable isotope analysis for detecting diet change in long-distance migratory birds reliant on aerial insect prey. Some of the sharpest population declines for avian aerial insectivores have occurred in northeastern North America (Nebel et al., 2010; Smith et al., 2015; Michel et al., 2016). Amongst these, Eastern Whip-poor-will are visual predators that rely on twilight or moonlight to detect prey, which are then captured during short bursts of flight from a perch on the ground or a branch. As a result, low-altitude flying nocturnal and crepuscular moths (~60%) and beetles (~40%) dominate their diet (Garlapow, 2007; Cink et al., 2017). Beetle taxa are more likely to belong to higher tropic-levels than moths (Bennett and Hobson, 2009), and the proportion of beetles relative to other insect groups found in swift (Chaetura spp.) guano accumulated in chimneys has declined in recent decades (Nocera et al., 2012; Pomfret et al., 2014). Whip-poor-wills breed throughout much of eastern North America and winter in the Florida panhandle southwards throughout most of Central America. During breeding, they prefer open-canopy forest habitats and forest edges, where moonlight penetrates the forest canopy and facilitates foraging. Little is known about their winter habitat preferences (Cink et al., 2017). Populations breeding in the northern portion of this range have exhibited declines of ~3.5% per year in recent decades (COSEWIC, 2009) and current distribution and abundance appears associated with insect abundance even in otherwise suitable habitats (English et al., 2017b). We compare temporal trends in δ15N and δ13C values of tissues grown during the breeding and non-breeding seasons with those in potential insect prey over the past 130 years. If beetle population declines are limiting food availability and/or diet quality for whip-poor-wills, this could be reflected in a decline in the δ15N values of whip-poor-will tissues but not in the tissues of their herbivorous insect prey. If a change observed in bird tissues is solely the result of changing baseline δ15N values of continental ecosystems, either due to synthetic nitrogen deposition or large-scale shifts in climate or habitat, we expect a decline in δ15N values over time with a similar slope to that observed in bird tissues to be common also to the prey insects sampled.
Materials and Methods
Tissue Selection
We determined age and sex of individual birds based on plumage characteristics and chose tissues to sample that reflected conditions during different times of year. Starting with flight feathers, whip-poor-will begin molt 1–2 months after arriving on the breeding grounds, often while still incubating or rearing young (personal observation). Because feather molt is energetically costly, both in terms of reduced flight capability and keratin tissue production (Echeverry-Galvis and Hau, 2013), most individuals initiate molt toward the end of their breeding season. This means that isotope signatures in these first feathers in the molt sequence should represent one of the most energetically demanding stages in the annual cycle. Both the primary flight feathers and smaller primary coverts are replaced concurrently, and in sequence starting with the innermost feather. Juvenile flight feathers grow while chicks are still being fed by their parents, and are retained until molted during their first breeding season. Juvenile-grown primary coverts have distinctive buff-colored tips, so all adult birds captured (or collected, in the case of museum specimens) during the breeding season can be classified as either 1-year-old or as older adult birds (Pyle, 2001). Primary covert feathers from 1-year-olds will have stable isotope values that reflect their diet during their nestling period, while older adults will have feathers that reflect their diet during the current or previous breeding season, depending whether they were sampled before or after molt was initiated. Both the carbon and nitrogen isotope ratios of feathers have been shown to depend on diet during the month immediately prior to tissue growth (Bearhop et al., 2002). At all ages, male whip-poor-will are easily distinguished from females because they have bright white outer tail feathers. Female tails are all gray, brown, and beige.
Whip-poor-wills are long-distance migrants that spend more than half of their annual cycle on their non-breeding grounds (Cink et al., 2017). Fortunately, avian claws grow relatively slowly and can retain a winter-dominated stable isotope signature after arrival on the breeding grounds (Bearhop et al., 2003; Mazerolle and Hobson, 2005; Fraser et al., 2008; Ethier et al., 2010). The central toe on whip-poor-will feet bears a pectinate claw, meaning that it is edged with a comb-like structure with 5–9 wide barbs (Supplemental Figure 1). This comb-like portion of the claw appears to grow from the base of the claw at a rate of about one barb per month (personal observation), thus the outer barbs likely have stable isotope signatures that reflect their diet at least 5 months prior to capture.
Study Area and Contemporary Sample Collection
We focused our sample collection on the province of Ontario, Canada due to evidence of a ~50% decrease in the probability of detecting whip-poor-wills over recent decades (Cadman et al., 2007). To establish how contemporary carbon and nitrogen isotope values vary with the age and sex of birds, we sampled primary coverts and claw tissue from individuals captured between 5 May and 25 July in 2011–2013 at three breeding sites situated across the species' range in Ontario: Rainy River district (48° 52′N 94°01-08′W), Norfolk County (42°42′N 80°21-28′W), in Frontenac County (44°28-34′N 76°20-25′W). The Rainy River sites consisted of a 40,000-hectare mosaic of agriculture, poplar (Populus sp.), coniferous forests, logged areas, and wetlands. The Norfolk County site was St. Williams Conservation Reserve, which consists of two forest patches totaling 1035 hectares of pine-oak sand barrens and pine reforestation in a zone of intensive agriculture. The Frontenac County site was Queen's University Biological Station (QUBS), which consists of over 3200 hectares of deciduous forest and abandoned farmland in various stages of succession, both with scattered small rock barrens. Across the whole province both afforestation of abandoned farmland and deforestation for timber harvesting, agriculture and urban development have continued throughout the twentieth century that together result in an overall loss of unimproved farmland and an increase in woodland (Cadman et al., 2007). A concurrent geolocator study established that winter locations of whip-poor-wills from Rainy River and Frontenac overlap throughout southern Mexico and Central America, but that Norfolk birds may winter further north in Mexico or the southern United States (English et al., 2017a). Due to this low connectivity between breeding and wintering locations, we do not assess spatial variation in winter grown tissues because all samples were collected on the breeding grounds.
At each field site, we captured adult male whip-poor-wills at night using song playback and mist nets. We targeted females and juveniles at QUBS, where we were able to capture them when they were incubating, or brooding nestlings, by placing a soft mesh fishnet over them. We identified all birds as male or female, aged them (juvenile, 1-year-old or older adult), recorded weight and wing length, and marked them with a numeric aluminum leg-band issued by the Canadian Wildlife Service. To sample tissue with isotopic signatures representing diet during the breeding season, we clipped one of the first four primary coverts. We sampled from amongst the first few feathers in the molt sequence to limit the seasonal variation in the timing of feather growth between individuals. In total, we collected 51 feathers grown by adults and 15 grown by juveniles (Table 1). To sample a tissue with isotopic signatures representing diet during the non-breeding season, we collected the outermost 2–4 claw barbs from 100 adults. Of these, 24% were 1-year-olds, which had just completed their first full migratory cycle. Capture and tissue sampling of birds followed the safety protocols of the Ornithological Council (Gaunt et al., 1997) and was approved by Environment Canada (sub-permit #10759 AG) and the Simon Fraser University Animal Care Committee (protocol #1001B-11).
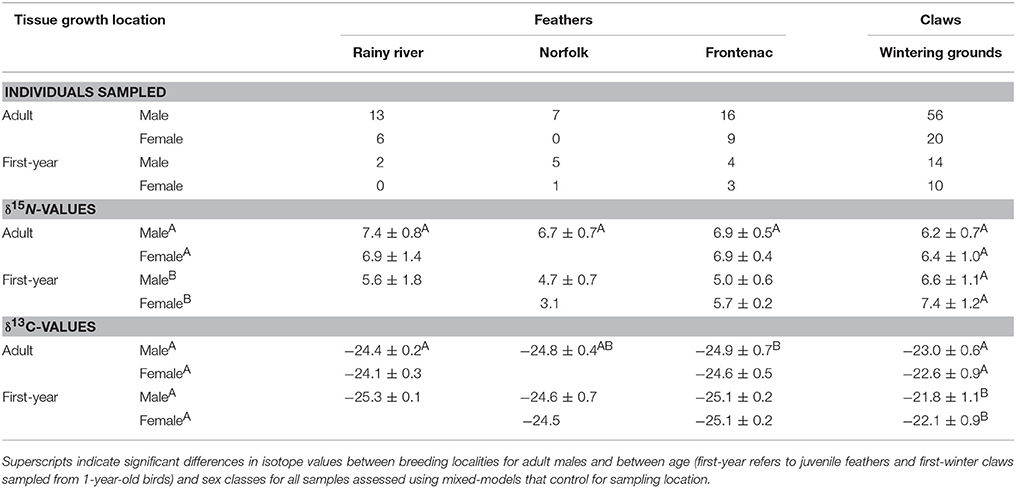
Table 1. Contemporary tissue sample sizes and mean ± standard deviations of isotope values from A. vociferus breeding at three localities in Ontario (see Figure 1).
Museum Sample Collection
Historic whip-poor-will tissue samples were obtained from the collections of the Royal Ontario Museum (Toronto, Canada) and the Canadian Museum of Nature (Ottawa, Canada). We collected samples from a total of 63 whip-poor-wills obtaining adult feathers from 26 individuals (1 unknown sex), juvenile feathers from 25 individuals (4 unknown sex) and claws from 37 individuals. We stratified this sampling as evenly as possible across geographic regions in Ontario, decades (from 1880 to 2006), age classes, and between males and females. We preferentially selected specimens collected between 15 May and 15 August, so that the collection location was more likely to represent the breeding/molt location. Some birds (N = 12) collected during migration periods were also included, but because Ontario is the northern limit of their breeding range the breeding or natal sites of these migrants is also likely to have been within our sampling area.
To test for an underlying shift in historic baseline isotope values, we obtained tissue samples from three insect species likely to represent components of the whip-poor-will diet: Biston betularia, a widespread herbivorous moth of a size likely to be eaten by whip-poor-wills; Phyllophaga anxia, a herbivorous beetle of a genus known to be consumed by whip-poor-wills (personal observation); and Colymbetes sculptilis a small species of predacious diving beetle, a group which disperses nocturnally and therefore could be a source of aquatic derived food for nocturnal aerial insectivores. These species are all widespread in the same regions and habitats as whip-poor-wills and had the best temporal coverage in museum collections. We sampled specimens of each species from most decades between 1880 and 2013 that were collected across the same general regions of Ontario as the birds (with the addition of a few samples from neighboring regions of southern Quebec; Figure 1). Insect tissues were obtained from the Canadian National Collection of Insects (Agriculture and Agri-Food, Ottawa, Canada) and the Royal Ontario Museum. We sampled a single hind leg from each specimen (47 B. betularia; 29 P. anxia; 24 C. sculptilis).
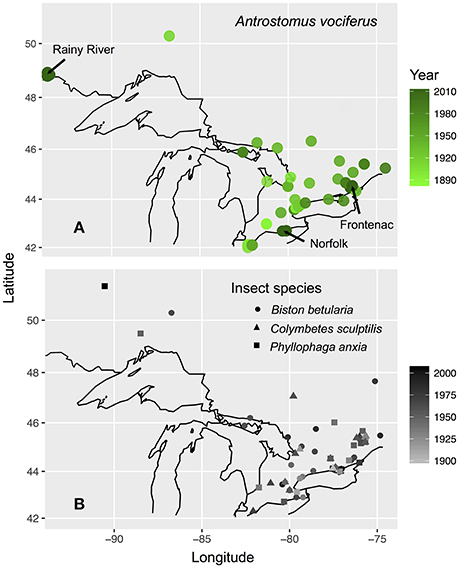
Figure 1. Maps of bird (A) and insect (B) specimen and tissue collection locations in Ontario, Canada. Sites where contemporary sampling was conducted are labeled with arrows on (A). Value shading of points indicates year collected. Black outline shows the Great Lakes and international borders from “mapdata” package (Brownrigg et al., 2016).
Stable Isotope Analysis
We cleaned samples by rinsing with deionized water (Wolf et al., 2011, 2013) and air or oven dried for 48 h. We did not use solvents because there was a risk of losing the tiny claw fragments during more complex cleaning processes, but we acknowledge that this may increase variance due to lipid contamination (Paritte and Kelly, 2009; Valladares et al., 2010). We sampled and minced ~50 μg of the feather barbs, avoiding the rachis. Claw and insect fragments were ground and analyzed whole. All samples were placed in tin capsules. We did not perform any lipid extraction because both feathers and claws have sufficiently low lipid content (confirmed by C:N ratios < 4; Post et al., 2007). We were also primarily interested in temporal change in the δ15N values of their insect prey, and this tends to be less dependent on lipid content (Logan et al., 2008; Kaufman et al., 2014). The University of Waterloo Environmental Isotope Laboratory analyzed all samples using combustion conversion of sample material to gas through an 1108 Elemental Analyzer (Fisons Instruments) coupled to a Delta Plus (Thermo) continuous flow isotope ratio mass spectrometer (CFIRMS). Stable isotope ratios are expressed with the δ notation (parts per thousand—‰) relative to atmospheric N2 and Vienna PeeDee Belemnite for δ15N and δ13C values, respectively. Carbon isotope values were corrected for atmospheric change in δ13C, known as the Suess effect, based on a formula (#4) from Verburg (2007), and reported relative to year 2000 levels for ease of comparison with other ecological studies. Data quality was monitored and corrections made using an certified international reference materials (ammonium sulfate: IAEA-N1 = +0.43‰ and N2 = +20.41‰ δ15N, cellulose: IAEA-CH3 = −24.72‰ δ13C, sucrose: IAEA-CH6 = −10.45‰ δ13C, L-glutamic acid: USGS-40 = −4.52‰ δ15N/−26.39‰ δ13C) and in-house standards (bovine liver: NIST 1577b = +7.72‰ δ15N/−21.60‰ δ13C, cellulose: EIL-72 = −25.5‰ δ13C, ammonium sulfate: EGC-3 = +0.77‰ and JSEC-01 = +20.20‰ δ15N) that were calibrated using the same reference materials. No < 20% of every sample run were standards and reference materials. Laboratory measurement error for these standards were all < ±0.3‰ for nitrogen and ±0.2‰ for carbon. Measurements from the same feather (N = 21), claw (N = 16), and insect leg (N = 12) were repeatable to 0.26 ± 0.15‰, 0.33 ± 0.22‰, and 0.26 ± 0.15‰ respectively for nitrogen and 0.14 ± 0.13‰, 0.39 ± 0.31‰, and 0.20 ± 0.15‰ for carbon. Claw samples were often too small for within sample repeatability estimates so we sampled both feet for 15 birds and found the repeatability between feet to be 0.59 ± 0.50‰ for nitrogen and 0.51 ± 0.48‰ for carbon.
Statistical Analysis
To understand factors underlying individual variation in isotope signatures within contemporary bird tissues, we first examined how δ15N values varied with age, sex, and δ13C, using linear mixed-effect models with sampling location included as a random effect. Both the age and sex may influence metabolism and nutritional states of individuals, which can influence fractionation of nitrogen (Robbins et al., 2005; Caut et al., 2008; Cherel et al., 2014), and δ15N and δ13C values are known to co-vary (Kelly, 2000). Inclusion of sampling location as a random effect allowed us to estimate average coefficient values from which we could make unconditional inferences about other locations. We also used analysis of variance and Tukey HSD tests to determine if feather δ15N and δ13C values differed between the three breeding sites in Ontario for adult males.
To model change in the δ15N values of bird tissues over the past 130 years, we fit models that included tissue growth year, bird age, and δ13C value of the sample as fixed effects, thereby controlling for all the covariates found to influence δ15N values within the contemporary samples (see section Results). We fit separate models for claw tissue grown on the non-breeding grounds and feathers grown in the breeding season. Food deprivation could be more pronounced in younger faster-growing birds, so we tested if an interaction between bird age and year improved model fit using a likelihood ratio test (LRT). Baseline isotope ratios of nitrogen and carbon can co-vary (Kelly, 2000), so we report coefficients for models both with and without the δ13C value as a covariate to determine if estimates of the magnitude of the Suess effect or factors underlying this co-variation could influence our conclusions.
To determine if baseline δ15N of prey on the breeding grounds has changed over the last 130 years, we used a mixed-effect model with collection year as a fixed effect and species as a random effect. Using species as a random effect allows unconditional inferences about other species in the insect community. Without lipid extraction, δ13C values of insects are not reliable when C:N > 4 (Post et al., 2007), so we do not control for δ13C values in the model we report. We did, however, test the effect of controlling for these potentially lipid-biased δ13C values, and doing this does not significantly or qualitatively change our results (see Supplemental Table 2). We test the power of our analysis to detect a slope of the same magnitude using the R package “simr” (Green and MacLeod, 2016), which conducts a power analysis of generalized linear mixed models by simulation.
Finally, because changes in δ13C values (due to shifts in habitat or agricultural practices) could mask changes in trophic level, we tested whether there was any evidence of temporal variation in δ13C within the museum tissues. For each type of whip-poor-will tissue, we fit a model that included growth year, age, and sex as fixed effects. For insects, we used a single linear mixed-effect model with collection year and the ratio of C:N as fixed effects, and species included as a random effect. Because the ratio of C:N can be correlated with lipid content, this ratio can be used to control for variation in lipid content between samples (Post et al., 2007; Logan et al., 2008).
For each tissue type, we checked for non-linearity in the temporal change in δ15N and δ13C values of museum tissues using a generalized additive model (GAM; GAMM for the mixed effects) using an identity link, a cubic regression spline, and cross-validation to choose the optimal amount of smoothing in the R package “mgcv” (Wood and Wood, 2016). In all cases the best model indicated that temporal change was linear, so we used linear models in subsequent analyses. We then incorporated contemporary tissue samples into these linear models before calculating parameter estimates. To account for a much larger number of samples from contemporary bird tissues than from museum collections, we bootstrapped 1,000 samples of 10 from our contemporary samples and refit the model to each sample. Combined, the models provide a distribution of parameter estimates, for which we report a mean and the range that encompasses 95% of the estimates.
We conducted all analyses in R version 3.2.1 (R Development Core Team, 2015). We fit all linear models using either the “gls” (for linear) and “lme” (for linear mixed effects) functions in the R package “nlme” (Pinheiro et al., 2016). For mixed-effect models, we compared models with random slopes and intercepts, vs. random intercepts only using LRTs. Models were fit using maximum likelihood (ML) for comparisons between of models with different fixed effects, but we report parameter estimates and 95% confidence intervals from models fit using restricted maximum likelihood (REML) to reduce the potential for bias due to small sample sizes (Zuur et al., 2009). To facilitate parameter estimation and comparisons between continuous and categorical variables, we centered year variables to 1950, and centered and scaled carbon values by two standard deviations (Schielzeth, 2010). Finally, we inspected the residuals of all models for normality and homogeneity of variance. We found no evidence of spatial autocorrelation in our analyses: residuals were not spatially clustered and there was no pattern in the semivariance with distance between sampling locations (feathers: r = −0.023, p = 0.92; insects: r = −0.39, p = 0.09). We calculated both marginal and conditional R2 for all mixed-effect models (Nakagawa and Schielzeth, 2013) and used Kenward–Roger approximation to estimate p-values (Arnau et al., 2014).
Results
In contemporary bird tissues, we found evidence that δ15N varied with δ13C values and the age, but not the sex, of the bird (Figure 2; Supplemental Table 1). The δ15N values of winter-grown claws increased as δ13C values increased, with a 2 SD increase in δ13C value of claw tissue predicted to increase δ15N values by 0.9‰ (95% CI: 0.6–1.2; Figure 2B). In contrast, δ15N values of feathers grown on the breeding grounds decreased slightly as δ13C value increased, with 2 SD increase in δ13C value predicted to decrease δ15N values by 0.5‰ (95% CI: −0.9 to 0.0). An effect of age on δ15N value was only detected in the feathers. While controlling for variation in δ13C values, δ15N values of nestling-grown feathers were −1.9‰ (95% CI: −2.4 to −1.5) lower than that of feathers from adults (Figure 2A). By the time young birds reached the end of their first winter this difference disappeared, and the δ15N values of claw tissue overlapped with that of older birds (0.4‰, 95% CI: −0.0 to 0.8; Figure 2B). Sexes did not appear to differ in δ15N value of tissues grown during either season (claw: 0.0‰, 95% CI: −0.4 to 0.3; feather: 0.0‰, 95% CI: −0.4 to 0.5). There was no evidence that co-variation between the two isotopes differed between feathers grown at different breeding locations (probability that slopes differed with locality LRT x22 = 0.12, p = 0.94) and the only significant difference in average values of adult male feathers was in the δ13C values of feathers grown in Frontenac County when compared with those grown in Rainy River District [feather δ13C: F(2, 33) = 4.27, p = 0.02; feather δ15N: F(2, 33) = 3.04, p = 0.06; Table 1].
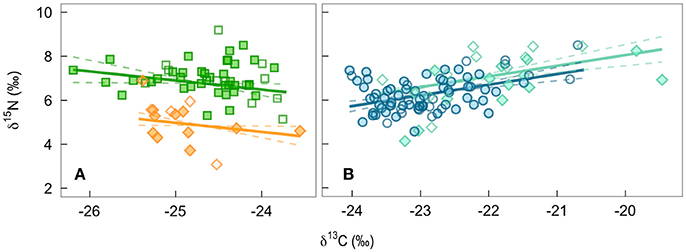
Figure 2. The population level predicted effect on δ15N of a change in δ13C of bird tissues from a mixed-effect model controling for breeding site: (A) feathers grown by adults on the breeding grounds (green squares) or by nestlings being fed by parents (orange diamonds), and (B) winter-grown claw from birds during their first year of life (turquiose diamonds) and older adults (blue circles). Filled symbols are males, open are females.
Whip-poor-will claw and feather δ15N values declined by 2.0 and 2.4‰, respectively over the past 130 years. For winter-grown claws, δ15N values declined by 0.015‰ per year (95% range: −0.011 to −0.018; Figure 3A). For breeding ground-grown feathers, the δ15N values declined by −0.019‰ per year (95% range: −0.016 to −0.022; Figure 3B). Our estimate of change in δ15N value per year on the breeding grounds is slightly larger when δ13C value is not included as a covariate in the model (−0.020‰ per year, 95% range: −0.017 to −0.023), while not controlling for changes in δ13C value has the opposite effect on wintering δ15N values (Supplementary Table 2). Juvenile feathers share a similar rate of change with time (df = 1, LRT = 1.75, p = 0.19), but δ15N values are offset by −1.4‰ (95% range: −1.3 to −1.6) from those of adults.
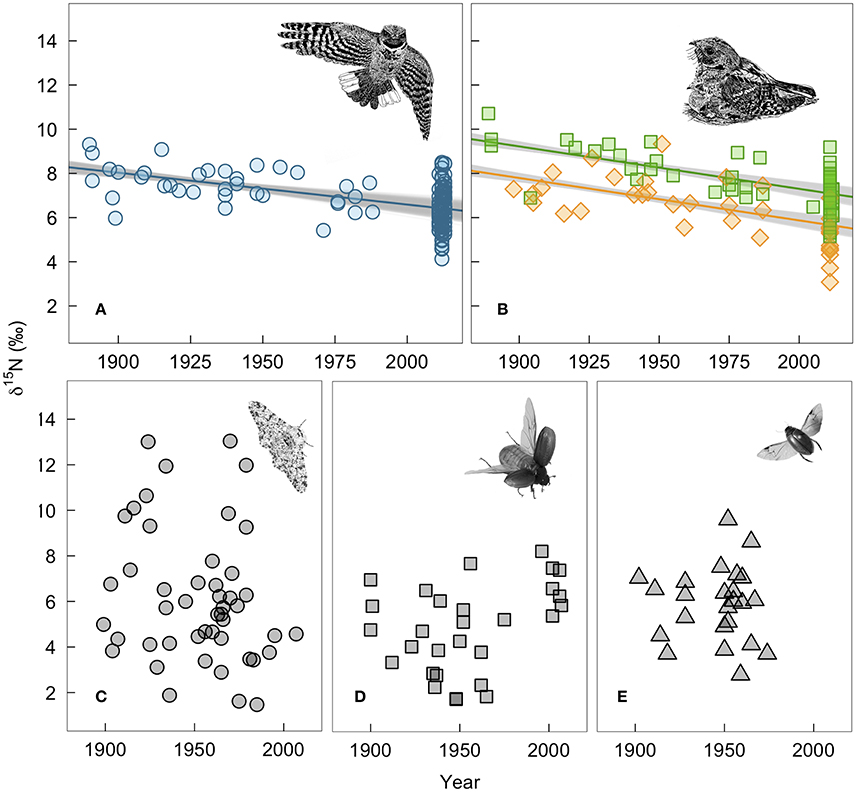
Figure 3. Measured changes in δ15N-values of bird and insect tissues over time: (A) winter-grown A. vociferus claws, (B) A. vociferus feathers grown by adults on the breeding grounds (squares) or juveniles still being feed by parents (diamonds), (C) Biston betularia, (D) Phyllophaga anxia, and (E) Colymbetes sculptilis. The lines show the mean predicted relationship from linear models controlling for δ13C based on all historic samples and 1,000 bootstrapped sub-samples of contemporary bird tissues. The gray shows the variation in predicted slopes. Bird illustrations are courtesy of Marinde Out.
In contrast, there was no evidence of depletion in δ15N values of insect tissues over time (−0.002‰, 95% CI: −0.019 to 0.015; Figures 3C–E). We also found no evidence that temporal change varied among species (LRT x22 = 2.77, p = 0.25). However, individuals had highly variable δ15N values within each species. Therefore, despite collecting a relatively large number of insect samples (N = 100), our power to detect a slope of the same magnitude observed in the whip-poor-will samples was relatively low (62% of 5,000 simulations). The confidence intervals for insects are so broad that they range from a positive slope of 0.015‰ to a negative slope that overlaps with the predicted range we found for bird feathers.
We found some indication of a long-term change in δ13C values of winter-grown bird tissues, which could be associated with changes in habitats or agricultural practices (Figure 4). The δ13C values of claws grown on the wintering grounds increased by 0.010‰ per year (95% range: 0.006–0.013). In contrast, δ13C values of feathers grown on the breeding grounds did not change significantly (0.003‰ per year, 95% range: −0.001 to 0.004). Similarly, there was little evidence of change in δ13C values of insect tissues (0.007‰, 95% CI: −0.003 to 0.018). This lack of change through time in δ13C values of insect tissues was consistent whether or not a significant relationship between C:N ratio and δ13C values (−0.43‰, 95% CI: −0.79 to −0.07; Supplemental Figure 2) was controlled for in the model.
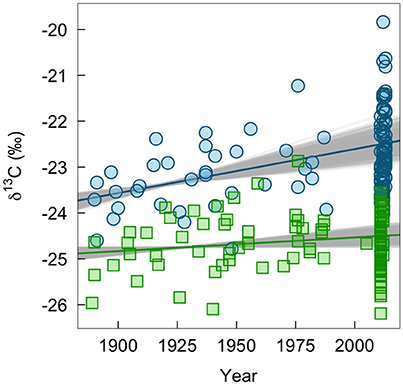
Figure 4. Measured change in δ13C-values of bird tissues over time pooled across ages and sexes (claw, blue circles; feathers, green squares). The lines show the mean predicted relationship from linear models based on all historic samples and 1,000 bootstrapped sub-samples of contemporary bird tissues. The gray shows the variation in predicted slopes.
Discussion
Widespread population declines in aerial insectivores occupying different habitats suggest that insect availability could be the common factor limiting their populations. If insect population declines are limiting food availability or quality for these species, higher trophic level species are likely to disappear from their diet first. Given the absence of long-term data on the abundance of insects, stable isotope ratios of museum specimen tissues provide an indirect record of diet and habitat change through time. Using museum tissues, we found a decline of 1.4–2.8‰ in δ15N values of whip-poor-will tissues over the past 130 years. This result, coupled with the comparative stability of δ15N values in insect tissues, is consistent with contemporary whip-poor-will populations feeding lower in the food web than in the past. This pattern was observed in both adult and juveniles, and was slightly stronger on the breeding grounds than on the wintering grounds. While these results all support the possibility that these population declines are due to changes in abundance of high quality, higher trophic-level prey, we caution that stable isotope studies of terrestrial food chains require additional tests of baseline change and do not exclude other possible drivers of population decline.
Temporal change in δ15N values of animal tissues can arise through a change in the isotope ratio of the nitrogen sources or types of primary producers supporting the prey consumed, or through a change in trophic-level of the species being sampled. While our analysis attempts to tease apart these alternative hypotheses, due to exceptionally high variance in the δ15N values of insect tissues, we cannot reject any hypothesis conclusively. We did not find evidence of a significant change in δ15N values of insect tissues that could indicate a shift in the “baseline” isotopes available to primary producers on a regional scale, but due to the high within-species variance in δ15N values, the confidence interval on this trend overlaps with our estimate of change in birds. This increasing power to detect long-term changes in baselines at higher trophic levels was also found for atmospheric changes in δ13C (Bump et al., 2007). Evidence that foliar δ15N values decline by as much as 2‰ along a successional gradient with up to a century of time since disturbance (Compton et al., 2007; Wang et al., 2007) suggests that afforestation of breeding habitats in the larger study region may produce a baseline shift that would result in the pattern we observed in bird feathers (Foster, 2000; Cadman et al., 2007). In contrast, ongoing deforestation on the wintering grounds makes this mechanism seem less likely to explain the similar rate of depletion found in claws (Wassenaar et al., 2007; FAO, 2011; Aide et al., 2013); however, data regarding wintering habitat use in Central America will be required (English et al., 2017a). Furthermore, although complicated by complex local variation (Bump et al., 2007), tree-ring cores sampled in our study region also fail to show a consistent decline in δ15N over the past 130 years. Instead, tree-rings provide evidence that local deforestation can cause relatively short-term (~20 years) increases in δ15N values (Bukata and Kyser, 2005) and long-term (>100 years) declines of < 1‰ in relatively undisturbed forest (Bukata and Kyser, 2007). Likewise, anthropogenic nitrogen deposition has been implicated in a decline in the δ15N values of bone collagen in Japanese Sika Deer (Cervus nippon), but the magnitude of this change was only 0.4‰ (Matsubayashi et al., 2015). Given our minimum estimate of change in δ15N values of bird tissues is close to the maximum reported for any of these mechanisms, and that none of the insect species sampled showed any similar trend, it appears unlikely that these mechanisms alone have caused this magnitude of change on average across the primary production consumed by all insect prey.
Alternatively, while the baseline δ15N value of the habitat occupied by the insect species we chose to sample may have remained the same, habitats supporting other phytophagous prey species may have changed. Although whip-poor-will forage relative close to the ground, the volant nature of their prey makes it likely that some prey may move in from surrounding habitats that might not appear to be used by whip-poor-wills. In particular, changes in forest cover and agriculture may have shifted ratios of C3 and C4 plants, moisture regimes, and fertilizer use, all of which could influence baseline δ13C or δ15N values (White et al., 2012; Augusto et al., 2015; Popa-Lisseanu et al., 2015). C4 plants (many grasses and crops like corn, sorghum, and sugar cane) have higher δ13C than C3 plants and tend to occur in more disturbed, and therefore more 15N enriched habitats (Kelly, 2000). Therefore, the positive relationship between δ15N and δ13C values across all winter-grown claw tissues (Figure 2B) could be a result of higher proportions of C4 plants growing in the driest, most disturbed habitats that are supporting phytophagous insect prey. Irrigation of C3 plants grown on more disturbed sites, more high trophic level prey originating from wetter habitats, or the addition of low δ15N synthetic fertilizers to C4 crops could dilute, or even reverse, this relationship. Indeed, a weak negative relationship between δ15N and δ13C values of feathers grown on the breeding grounds (Figure 2A) could be related to differences in the amounts of fertilizer applied due to the economic differences between these regions. Regardless of the mechanism, by including the δ13C value of each sample as a covariate in our models of δ15N change in bird tissues, we attempt to control for some of the potential changes in the habitats that support prey insects. As a result, our estimate of change in δ15N values of tissues grown during the breeding season is made more conservative, but does not alter our conclusion that the mean δ15N value of birds has declined over time.
The use of stable isotopes to illuminate trophic ecology of species is a powerful tool, but is complicated by differences in fractionation rate (i.e., discrimination factors) between species, individuals of different nutritional and physiological states, and between tissues within individuals (Robbins et al., 2005; Caut et al., 2008; Cherel et al., 2014). By looking at patterns within tissues of a single species, we can avoid most of these issues. The remaining variance in nutritional and physiological state are both potentially related to the diet we are attempting to assess. The lower δ15N values of juvenile feathers, which are all grown concurrently during the first weeks of life, is likely at least partially the result of reduced discrimination (that can be up to 0.95‰) due to very little nitrogen being wasted under conditions of rapid growth and/or food restriction (Sears et al., 2008; Hertz et al., 2015). Because discrimination factors vary between species and with diet quality (Robbins et al., 2005), it is possible that the offset of 1.4‰ that we observe is still entirely due to extremely rapid growth rates. Alternatively, some of the difference may be due to adults preferentially provisioning juveniles with lower trophic-level lepidopteran prey (Cink et al., 2017). By focusing our sampling on tissues grown at relatively predictable rates and during specific seasons, differences in diet between individuals become more meaningful. Feathers grown concurrently by juveniles and the adults provisioning them represent diet during the period most crucial for determining population growth rates. Lower δ15N values over time in both adult and juvenile feathers could represent either increasing nutritional stress, a shift in the baseline δ15N values of prey types consumed, or a reduction in the trophic level of prey consumed. Assessing temporal changes in the offset between adults and juveniles could help distinguish between these alternatives, however a larger number of tissue samples from the early 1900's would be needed to ensure the statistical power to detect differences in slope.
Long-term monitoring studies are rare, expensive, and most conservation questions are rarely anticipated in time to establish appropriate protocols. Stable isotope studies provide a unique opportunity to harness the ecological history contained in museum collections (Darimont and Reimchen, 2002). However, care must be taken to adequately account for differences in discrimination between tissues and species, seasonal and geographic variation in isotopic baselines, and the physiological state of individual animals. While this opportunity has been explored quite extensively for marine ecosystems, its application to complex terrestrial food webs remains relatively untested. This added complexity is highlighted by our finding of extremely high variability (1.5–13.0‰) in the δ15N values of individuals within a single insect species, B. betularia. This high variability is likely due to this species being relatively generalist in its habitat and host plant choices and each individual insect likely having acquired its dietary nitrogen from a single plant, each of which grew under variable local conditions including moisture regimes and nitrogen sources. As trophic-level and the geographic area over which an organism acquires its nutrition increases, the variance between individuals should decrease (McNabb et al., 2001; Bump et al., 2007; Gibb and Cunningham, 2011). The result of this high variability was that even with 100 insect samples, we only had a 62% chance of finding a significant trend of the same magnitude that we found in the bird feathers. With this in mind, we suggest that rather than attempting to sample lower trophic levels by sampling prey species directly, future studies should use a comparative approach and sample species with different diets, but similar scales of movement and geographic distribution of their food sources (Thompson et al., 1995). Alternatively, as compound-specific stable-isotope analyses become more affordable, it will be possible to determine baseline values and thereby more accurately assess trophic-level from within a single tissue sample (McMahon et al., 2015; Hebert et al., 2016; Ostrom et al., 2017).
Despite these challenges, the ability to decode the historical record of ecological change locked inside museum collections has tremendous potential to inform our understanding of ecological change and aid in conservation decisions. For aerial insectivores, a significant change in dietary isotopes of whip-poor-wills over the past 130 years adds to the mounting evidence that population declines for many of these species may be related to changes in food supply. Insect abundance has previously been shown to predict both the presence and abundance of whip-poor-wills and bats (Wickramasinghe et al., 2004; English et al., 2017b) and changes in insect prey species composition appear correlated with population declines in two species of swift (Nocera et al., 2012; Pomfret et al., 2014). We believe that analysis of temporal trends in stable isotope ratios of other aerial insectivores, and further exploration of potential shifts in terrestrial baselines, will be crucial to assessing the relative importance of diet to the population trajectories of this guild. If population trajectories are indeed linked to changes in diet for most of these species, understanding this will be an important first step toward making effective, data-driven conservation decisions.
Data Availability
Isotope data is included in Supplementary Data Sheet 1.
Author Contributions
PE: conceived the idea; PE, DG, and JN: designed methodology; PE and JN: coordinated data collection; PE: analyzed the data and led the writing of the manuscript; All authors contributed critically to the drafts and gave final approval for publication.
Funding
Funding for sample collection, laboratory analysis, and student support was provided by the Canadian Wildlife Service and Ontario Ministry of Natural Resources and Forestry (OMNRF) Species at Risk Research and Stewardship grants (SARRFO6-10-SFU and 114-11-QUEENSU), NSERC Postgraduate Doctoral Fellowship (PE), NSERC Discovery Grants (JN-55-52035 and DG- 261899), NSERC Early Career Researcher Supplement (JN), the OMNRF Science and Research Branch, Environment and Climate Change Canada, and Simon Fraser University.
Conflict of Interest Statement
The authors declare that the research was conducted in the absence of any commercial or financial relationships that could be construed as a potential conflict of interest.
Acknowledgments
This project would not have been possible without the advice and permission to sample museum specimens provided by M. Peck and C. Darling at the Royal Ontario Museum, M. Gosselin at the Canadian Museum of Nature, and P. Bouchard, J. Skevington, C. Schmidt, and Y. Bousquet at the Canadian National Collection of Insects. We are especially appreciative of the sleepless efforts and good humor of the numerous field assistants who helped collect the contemporary tissue samples including: M. Conboy, M. Timpf, E. Suenaga, C. Freshwater, E. Dobson, A. Zunder, E. Purves, T. Willis, A. Heagy, G. Rand, A. Timpf, and D. Okines. We also extend our thanks to M. Out for the use of her whip-poor-will drawings. Finally, this manuscript benefitted profoundly from conversations with R. Ydenberg, M.-A. R. Hudson, E. Hertz, and V. Rohwer, and from our reviewers' insights and constructive suggestions. A version of this paper forms one chapter of PA English's doctoral dissertation (2017).
Supplementary Material
The Supplementary Material for this article can be found online at: https://www.frontiersin.org/articles/10.3389/fevo.2018.00014/full#supplementary-material
References
Aide, T. M., Clark, M. L., Grau, H. R., López-Carr, D., Levy, M. A., Redo, D., et al. (2013). Deforestation and reforestation of Latin America and the Caribbean (2001–2010). Biotropica 45, 262–271. doi: 10.1111/j.1744-7429.2012.00908.x
Ambrose, S. (1986). Stable carbon and nitrogen isotope analysis of human and animal diet in Africa. J. Hum. Evol. 15, 707–731. doi: 10.1016/S0047-2484(86)80006-9
Amundson, R., Austin, A. T., Schuur, E. A. G., Yoo, K., Matzek, V., Kendall, C., et al. (2003). Global patterns of the isotopic composition of soil and plant nitrogen. Glob. Biogeochem. Cycles 17:1031. doi: 10.1029/2002GB001903
Arnau, J., Bendayan, R., Blanca, M. J., and Bono, R. (2014). Should we rely on the Kenward–Roger approximation when using linear mixed models if the groups have different distributions? Br. J. Math. Stat. Psychol. 67, 408–429. doi: 10.1111/bmsp.12026
Augusto, F. G., Tassoni Filho, M., Ferreira, A., Pereira, A. L., de Camargo, P. B., and Martinelli, L. A. (2015). Land use change in the Atlantic Forest affects carbon and nitrogen sources of streams as revealed by the isotopic composition of terrestrial invertebrates. Biota Neotropica 15:e20140188. doi: 10.1590/1676-06032015018814
Basu, S., Agrawal, S., Sanyal, P., Mahato, P., Kumar, S., and Sarkar, A. (2015). Carbon isotopic ratios of modern C3–C4 plants from the Gangetic Plain, India and its implications to paleovegetational reconstruction. Palaeogeogr. Palaeoclimatol. Palaeoecol. 440, 22–32. doi: 10.1016/j.palaeo.2015.08.012
Bearhop, S., Furness, R. W., Hilton, G. M., Hilton, G. H., and Waldron, S. (2003). A forensic approach to understanding diet and habitat use from stable isotope analysis of (avian) claw material. Funct. Ecol. 17, 270–275. doi: 10.1046/j.1365-2435.2003.00725.x
Bearhop, S., Waldron, S., Votier, S. C., and Furness, R. (2002). Factors that influence assimilation rates and fractionation of nitrogen and carbon stable isotopes in avian blood and feathers. Physiol. Biochem. Zool. Ecol. Evol. Approaches 75, 451–458. doi: 10.1086/342800
Becker, B. H., and Beissinger, S. (2006). Centennial decline in the trophic level of an endangered seabird after fisheries decline. Conserv. Biol. 20, 470–479. doi: 10.1111/j.1523-1739.2006.00379.x
Bennett, P. M., and Hobson, K. (2009). Trophic structure of a boreal forest arthropod community revealed by stable isotope (δ13C, δ15N) analyses. Entomol. Sci. 12, 17–24. doi: 10.1111/j.1479-8298.2009.00308.x
Blancher, P., Cadman, M., Pond, B., Couturier, A., Dunn, E., Francis, C., et al. (2007) “Changes in bird distributions between atlases,” in Atlas of the Breeding Birds of Ontario, 2001-2005, eds M. Cadman, D. Sutherland, G. Beck, D. Lepage, A. Couturier (Toronto, ON: Bird Studies Canada, Environment Canada, Ontario Field Ornithologists, Ontario Ministry of Natural Resources & Ontario Nature), 32–48.
Blight, L. K., Hobson, K. A., Kyser, T. K., and Arcese, P. (2015). Changing gull diet in a changing world: a 150-year stable isotope (δ13C, δ15N) record from feathers collected in the Pacific Northwest of North America. Glob. Change Biol. 21, 1497–1507. doi: 10.1111/gcb.12796
Brownrigg, R., Becker, R. A., and Wilks, A. R. (2016). Mapdata: Extra Map Databases. R package version 2.2-6.
Bukata, A. R., and Kyser, T. (2005). Response of the nitrogen isotopic composition of tree-rings following tree-clearing and land-use change. Environ. Sci. Technol. 39, 7777–7783. doi: 10.1021/es050733p
Bukata, A. R., and Kyser, T. (2007). Carbon and nitrogen isotope variations in tree-rings as records of perturbations in regional carbon and nitrogen cycles. Environ. Sci. Technol. 41, 1331–1338. doi: 10.1021/es061414g
Bump, J. K., Fox-Dobbs, K., Bada, J. L., Koch, P. L., Peterson, R. O., and Vucetich, J. A. (2007). Stable isotopes, ecological integration and environmental change: wolves record atmospheric carbon isotope trend better than tree rings. Proc. R. Soc. Lond. B Biol. Sci. 274, 2471–2480. doi: 10.1098/rspb.2007.0700
Cadman, M., Sutherland, D., Beck, G., Lepage, D., and Couturier, A. (2007). Atlas of the Breeding Birds of Ontario, 2001-2005. Bird Studies Canada, Environment Canada, Ontario Field Ornithologists, Ontario Ministry of Natural Resources & Ontario Nature, Toronto, ON.
Caut, S., Angulo, E., and Courchamp, F. (2008). Discrimination factors (Δ15N and Δ13C) in an omnivorous consumer: effect of diet isotopic ratio. Funct. Ecol. 22, 255–263. doi: 10.1111/j.1365-2435.2007.01360.x
Chamberlain, C. P., Waldbauer, J. R., Fox-Dobbs, K., Newsome, S. D., Koch, P. L., Smith, D. R., et al. (2005). Pleistocene to recent dietary shifts in California condors. Proc. Natl. Acad. Sci. U.S.A. 102, 16707–16711. doi: 10.1073/pnas.0508529102
Cherel, Y., Jaquemet, S., Maglio, A., and Jaeger, A. (2014). Differences in δ13C and δ15N values between feathers and blood of seabird chicks: implications for non-invasive isotopic investigations. Mar. Biol. 161, 229–237. doi: 10.1007/s00227-013-2314-5
Cink, C. L., Pyle, P., and Patten, M. A. (2017) “Eastern Whip-poor-will (Antrostomus vociferus),” in Birds of North America. Available online at: https://birdsna.org/Species-Account/bna/species/whip-p1/introduction (Accessed October 5, 2017).
Compton, J. E., Hooker, T. D., and Perakis, S. (2007). Ecosystem N distribution and δ15N during a century of forest regrowth after agricultural abandonment. Ecosystems 10, 1197–1208. doi: 10.1007/s10021-007-9087-y
Conrad, K. F., Warren, M. S., Fox, R., and Woiwod, I. P. (2006). Rapid declines of common, widespread British moths provide evidence of an insect biodiversity crisis. Biol. Conserv. 132, 279–291. doi: 10.1016/j.biocon.2006.04.020
COSEWIC (2009). COSEWIC Assessment and Status Report on the Whip-Poor-Will Caprimulgus vociferus in Canada. Ottawa, ON: Committee on the Status of Endangered Wildlife in Canada.
Courty, P.-E., Doubková, P., Calabrese, S., Niemann, H., Lehmann, M. F., Vosátka, M., et al. (2015). Species-dependent partitioning of C and N stable isotopes between arbuscular mycorrhizal fungi and their C3 and C4 hosts. Soil Biol. Biochem. 82, 52–61. doi: 10.1016/j.soilbio.2014.12.005
Craine, J. M., Elmore, A. J., Aidar, M. P. M., Bustamante, M., Dawson, T. E., Hobbie, E. A., et al. (2009). Global patterns of foliar nitrogen isotopes and their relationships with climate, mycorrhizal fungi, foliar nutrient concentrations, and nitrogen availability. New Phytol. 183, 980–992. doi: 10.1111/j.1469-8137.2009.02917.x
Crowley, B. E., Godfrey, L. R., Guilderson, T. P., Zermeño, P., Koch, P. L., and Dominy, N. J. (2012). Extinction and ecological retreat in a community of primates. Proc. R. Soc. Lond. B Biol. Sci. 279, 3597–3605. doi: 10.1098/rspb.2012.0727
Darimont, C. T., and Reimchen, T. (2002). Intra-hair stable isotope analysis implies seasonal shift to salmon in gray wolf diet. Can. J. Zool. Ott. 80, 1638–1642 doi: 10.1139/z02-149
Didham, R. K., Lawton, J. H., Hammond, P. M., and Eggleton, P. (1998). Trophic structure stability and extinction dynamics of beetles (Coleoptera) in tropical forest fragments. Philos. Trans. Biol. Sci. 353, 437–451 doi: 10.1098/rstb.1998.0221
Echeverry-Galvis, M. A., and Hau, M. (2013). Flight performance and feather quality: paying the price of overlapping moult and breeding in a tropical highland bird. PLoS ONE 8:e61106. doi: 10.1371/journal.pone.0061106
English, P. A., Mills, A. M., Cadman, M. D., Heagy, A. E., Rand, G. J., Green, D. J., et al. (2017a). Tracking the migration of a nocturnal aerial insectivore in the Americas. BMC Zool. 2:5. doi: 10.1186/s40850-017-0014-1
English, P. A., Nocera, J. J., Pond, B. A., and Green, D. (2017b). Habitat and food supply across multiple spatial scales influence the distribution and abundance of a nocturnal aerial insectivore. Landsc. Ecol. 32, 343–359. doi: 10.1007/s10980-016-0454-y
Ethier, D. M., Kyle, C. J., Kyser, T. K., and Nocera, J. (2010). Variability in the growth patterns of the cornified claw sheath among vertebrates: implications for using biogeochemistry to study animal movement. Can. J. Zool. 88, 1043–1051. doi: 10.1139/Z10-073
Evans, R. (2001). Physiological mechanisms influencing plant nitrogen isotope composition. Trends Plant Sci. 6, 121–126. doi: 10.1016/S1360-1385(01)01889-1
Evans, R. D., and Belnap, J. (1999). Long-term consequences of disturbance on nitrogen dynamics in an arid ecosystem. Ecology 80, 150–160. doi: 10.1890/0012-9658(1999)080[0150:LTCODO]2.0.CO;2
FAO (2011). State of the World's Forests 2011. Rome: Food and Agriculture Organization of the United Nations (FAO).
Farmer, R. G., and Leonard, M. (2011). Long-term feeding ecology of Great Black-backed Gulls (Larus marinus) in the northwest Atlantic: 110 years of feather isotope data. Can. J. Zool. 89, 123–133. doi: 10.1139/Z10-102
Felix, J. D., and Elliott, E. (2013). The agricultural history of human-nitrogen interactions as recorded in ice core δ15N-. Geophys. Res. Lett. 40, 1642–1646. doi: 10.1002/grl.50209
Foster, D. (2000). From bobolinks to bears: interjecting geographical history into ecological studies, environmental interpretation, and conservation planning. J. Biogeogr. 27, 27–30. doi: 10.1046/j.1365-2699.2000.00376.x
Fox-Dobbs, K., Bump, J. K., Peterson, R. O., Fox, D. L., and Koch, P. L. (2007). Carnivore-specific stable isotope variables and variation in the foraging ecology of modern and ancient wolf populations: case studies from Isle Royale, Minnesota, and La Brea. Can. J. Zool. 85, 458–471. doi: 10.1139/Z07-018
Fraser, K. C., Kyser, T. K., Robertson, R. J., and Ratcliffe, L. (2008). Seasonal patterns in hydrogen isotopes of claws from breeding wood-warblers (Parulidae): utility for estimating migratory origins. Avian Conserv. Ecol. 3:2 doi: 10.5751/ACE-00218-030102
Garlapow, R. (2007). Whip-Poor-Will Prey Availability and Foraging Habitat: Implications for Management in Pitch Pine/Scrub Oak Barrens Habitats. M.Sc., thesis, University of Massachusetts.
Gaunt, A. S., Oring, L. W., Able, K. P., Anderson, D. W., Baptista, L. F., Barlow, J. C., et al. (1997). Guidelines to the Use of Wild Birds in Research. Washington, DC: The Ornithological Council.
Gibb, H., and Cunningham, S. (2011). Habitat contrasts reveal a shift in the trophic position of ant assemblages. J. Anim. Ecol. 80, 119–127. doi: 10.1111/j.1365-2656.2010.01747.x
Green, P., and MacLeod, C. (2016). SIMR: an R package for power analysis of generalized linear mixed models by simulation. Methods Ecol. Evol. 7, 493–498. doi: 10.1111/2041-210X.12504
Gutowsky, S., Janssen, M., Arcese, P., Kyser, T. K., Ethier, D., Wunder, M. B., et al. (2009). Concurrent declines in nestling diet quality and reproductive success of a threatened seabird over 150 years. Endanger. Species Res. 9, 247–254. doi: 10.3354/esr00225
Hallmann, C. A., Sorg, M., Jongejans, E., Siepel, H., Hofland, N., Schwan, H., et al. (2017). More than 75 percent decline over 27 years in total flying insect biomass in protected areas. PLoS ONE 12:e0185809. doi: 10.1371/journal.pone.0185809
Hamer, K. C., Newton, R. J., Edwards, F. A., Benedick, S., Bottrell, S. H., and Edwards, D. P. (2015). Impacts of selective logging on insectivorous birds in Borneo: the importance of trophic position, body size and foraging height. Biol. Conserv. 188, 82–88. doi: 10.1016/j.biocon.2014.09.026
Hebert, C. E., Popp, B. N., Fernie, K. J., Ka'apu-Lyons, C., Rattner, B. A., and Wallsgrove, N. (2016). Amino acid specific stable nitrogen isotope values in avian tissues: insights from captive American Kestrels and wild Herring Gulls. Environ. Sci. Technol. 50, 12928–12937. doi: 10.1021/acs.est.6b04407
Hertz, E., Trudel, M., Cox, M. K., and Mazumder, A. (2015). Effects of fasting and nutritional restriction on the isotopic ratios of nitrogen and carbon: a meta-analysis. Ecol. Evol. 5, 4829–4839. doi: 10.1002/ece3.1738
Hobson, K. (1999). Tracing origins and migration of wildlife using stable isotopes: a review. Oecologia 120, 314–326. doi: 10.1007/s004420050865
Holtgrieve, G. W., Schindler, D. E., Hobbs, W. O., Leavitt, P. R., Ward, E. J., Bunting, L., et al. (2011). A coherent signature of anthropogenic nitrogen deposition to remote watersheds of the northern hemisphere. Science 334, 1545–1548. doi: 10.1126/science.1212267
Hynson, N. A., Schiebold, J. M.-I., and Gebauer, G. (2016). Plant family identity distinguishes patterns of carbon and nitrogen stable isotope abundance and nitrogen concentration in mycoheterotrophic plants associated with ectomycorrhizal fungi. Ann. Bot. 118, 467–479. doi: 10.1093/aob/mcw119
Kaufman, T. J., Pajuelo, M., Bjorndal, K. A., Bolten, A. B., Pfaller, J. B., Williams, K. L., and Vander Zanden, H. B. (2014). Mother–egg stable isotope conversions and effects of lipid extraction and ethanol preservation on loggerhead eggs. Conserv. Physiol. 2:cou049. doi: 10.1093/conphys/cou049
Keeling, C. (1979). The Suess effect: 13Carbon-14Carbon interrelations. Environ. Int. 2, 229–300. doi: 10.1016/0160-4120(79)90005-9
Kelly, J. (2000). Stable isotopes of carbon and nitrogen in the study of avian and mammalian trophic ecology. Can. J. Zool. 78, 1–27 doi: 10.1139/z99-165
Li, Y., Schichtel, B. A., Walker, J. T., Schwede, D., Chen, X., Lehmann, C., et al. (2016). Increasing importance of deposition of reduced nitrogen in the United States. Proc. Natl. Acad. Sci. U.S.A. 113, 5874–5879. doi: 10.1073/pnas.1525736113
Logan, J. M., Jardine, T. D., Miller, T. J., and Lutcavage, M. E. (2008). Lipid corrections in carbon and nitrogen stable isotope analyses: comparison of chemical extraction and modelling methods. J. Anim. Ecol. 77, 838–846. doi: 10.1111/j.1365-2656.2008.01394.x
Matsubayashi, J., Morimoto, J. O., Tayasu, I., Mano, T., Nakajima, M., Takahashi, O., et al. (2015). Major decline in marine and terrestrial animal consumption by brown bears (Ursus arctos). Sci. Rep. 5:9203. doi: 10.1038/srep09203
Mazerolle, D. F., and Hobson, K. (2005). Estimating origins of short-distance migrant songbirds in north america: contrasting inferences from hydrogen isotope measurements of feathers, claws, and blood. Condor 107, 280–288. doi: 10.1650/7681
McMahon, K. W., Polito, M. J., Abel, S., McCarthy, M. D., and Thorrold, S. R. (2015). Carbon and nitrogen isotope fractionation of amino acids in an avian marine predator, the Gentoo Penguin (Pygoscelis papua). Ecol. Evol. 5, 1278–1290. doi: 10.1002/ece3.1437
McNabb, D. M., Halaj, J., and Wise, D. (2001). Inferring trophic positions of generalist predators and their linkage to the detrital food web in agroecosystems: a stable isotope analysis. Pedobiologia 45, 289–297. doi: 10.1078/0031-4056-00087
Michel, N. L., Smith, A. C., Clark, R. G., Morrissey, C. A., and Hobson, K. A. (2016). Differences in spatial synchrony and interspecific concordance inform guild-level population trends for aerial insectivorous birds. Ecography 39, 774–786. doi: 10.1111/ecog.01798
Mizutani, H., Fukuda, M., Kabaya, Y., and Wada, E. (1990). Carbon isotope ratio of feathers reveals feeding behavior of cormorants. Auk 107, 400–403. doi: 10.2307/4087626
Moreno, R., Stowasser, G., McGill, R. A. R., Bearhop, S., and Phillips, R. A. (2016). Assessing the structure and temporal dynamics of seabird communities: the challenge of capturing marine ecosystem complexity. J. Anim. Ecol. 85, 199–212. doi: 10.1111/1365-2656.12434
Nakagawa, S., and Schielzeth, H. (2013). A general and simple method for obtaining R2 from generalized linear mixed-effects models. Methods Ecol. Evol. 4, 133–142. doi: 10.1111/j.2041-210x.2012.00261.x
Nebel, S., Mills, A., McCracken, J. D., and Taylor, P. (2010). Declines of aerial insectivores in North America follow a geographic gradient. Avian Conserv. Ecol. 5:1 doi: 10.5751/ACE-00391-050201
Nocera, J. J., Blais, J. M., Beresford, D. V., Finity, L. K., Grooms, C., Kimpe, L. E., et al. (2012). Historical pesticide applications coincided with an altered diet of aerially foraging insectivorous Chimney Swifts. Proc. R. Soc. Lond. B Biol. Sci. 279, 3114–3120. doi: 10.1098/rspb.2012.0445
Norris, D. R., Arcese, P., and Preikshot, D. (2007). Diet reconstruction and historic population dynamics in a threatened seabird. J Appl Ecol 44, 875–884. doi: 10.1111/j.1365-2664.2007.01329.x
North American Bird Conservation Initiative Canada (2012). The State of Canada's Birds 2012. Environment Canada, Ottawa, ON.
Ohkouchi, N., Ogawa, N. O., Chikaraishi, Y., Tanaka, H., and Wada, E. (2015). Biochemical and physiological bases for the use of carbon and nitrogen isotopes in environmental and ecological studies. Prog. Earth Planet Sci. 2, 1. doi: 10.1186/s40645-015-0032-y
Ostrom, P. H., Wiley, A. E., James, H. F., Rossman, S., Walker, W. A., Zipkin, E. F., et al. (2017). Broad-scale trophic shift in the pelagic North Pacific revealed by an oceanic seabird. Proc. R. Soc. B 284:20162436. doi: 10.1098/rspb.2016.2436
Pardo, L. H., and Nadelhoffer, K. (2010). “Using nitrogen isotope ratios to assess terrestrial ecosystems at regional and global scales,” in Isoscapes, eds J. B. West, G. J. Bowen, T. E. Dawson, and K. P. Tu (Dordrecht: Springer), 221–249.
Paritte, J. M., and Kelly, J. (2009). Effect of cleaning regime on stable-isotope ratios of feathers in japanese quail (Coturnix japonica). Auk 126, 165–174. doi: 10.1525/auk.2009.07187
Peterson, B. J., and Fry, B. (1987). Stable isotopes in ecosystem studies. Annu. Rev. Ecol. Syst. 18, 293–320. doi: 10.1146/annurev.es.18.110187.001453
Pimm, S. L., and Lawton, J. (1977). Number of trophic levels in ecological communities. Nature 268:329. doi: 10.1038/268329a0
Pinheiro, J., Bates, D., DebRoy, S., and Sarkar, D. (2016). nlme: Linear and Nonlinear Mixed Effects Models. R package version 3.1-128. Vienna: R Foundation for Statistical Computing.
Pomfret, J. K., Nocera, J. J., Kyser, T. K., and Reudink, M. (2014). Linking population declines with diet quality in Vaux's Swifts. Northwest Sci. 88, 305–313. doi: 10.3955/046.088.0405
Popa-Lisseanu, A. G., Kramer-Schadt, S., Quetglas, J., Delgado-Huertas, A., and Kelm, D. H. Ibáñez, C. (2015). Seasonal variation in stable carbon and nitrogen isotope values of bats reflect environmental baselines. PLoS ONE 10:e0117052. doi: 10.1371/journal.pone.0117052
Post, D. M., Layman, C. A., Arrington, D. A., Takimoto, G., Quattrochi, J., and Montaña, C. G. (2007). Getting to the fat of the matter: models, methods and assumptions for dealing with lipids in stable isotope analyses. Oecologia 152, 179–189. doi: 10.1007/s00442-006-0630-x
Purvis, A., Gittleman, J. L., Cowlishaw, G., and Mace, G. (2000). Predicting extinction risk in declining species. Proc. R. Soc. Lond. B Biol. Sci. 267, 1947–1952. doi: 10.1098/rspb.2000.1234
Pyle, P. (2001). Identification Guide to North American Birds, Part, I. Point Reyes Station, CA: State Creek Press.
R Development Core Team (2015). R: A Language and Environment for Statistical Computing. Vienna: R Foundation for Statistical Computing.
Robbins, C. T., Felicetti, L. A., and Sponheimer, M. (2005). The effect of dietary protein quality on nitrogen isotope discrimination in mammals and birds. Oecologia 144, 534–540. doi: 10.1007/s00442-005-0021-8
Schielzeth, H. (2010). Simple means to improve the interpretability of regression coefficients. Methods Ecol. Evol. 1, 103–113. doi: 10.1111/j.2041-210X.2010.00012.x
Sears, J., Hatch, S. A., and O'Brien, D. (2008). Disentangling effects of growth and nutritional status on seabird stable isotope ratios. Oecologia 159, 41–48. doi: 10.1007/s00442-008-1199-3
Smith, A. C., Hudson, M.-A. R., Downes, C. M., and Francis, C. (2015). Change points in the population trends of aerial-insectivorous birds in North America: synchronized in time across species and regions. PLoS ONE 10:e0130768. doi: 10.1371/journal.pone.0130768
Still, C. J., and Powell, R. (2010). “Continental-scale distributions of vegetation stable carbon isotope ratios,” in Isoscapes: Understanding Movement, Pattern, and Process on Earth through Isotope Mapping, eds J. B. West, G. J. Bowen, T. E. Dawson, and K. P. Tu (Dordrecht: Springer), 179–193.
Taki, H., Ikeda, H., Nagamitsu, T., Yasuda, M., Sugiura, S., Maeto, K., et al. (2017). Stable nitrogen and carbon isotope ratios in wild native honeybees: the influence of land use and climate. Biodivers. Conserv. 26, 3157–3166. doi: 10.1007/s10531-016-1114-x
Thompson, D. R., Furness, R. W., and Lewis, S. (1995). Diets and long-term changes in δ15N and δ13C values in northern fulmars Fulmarus glacialis from two northeast Atlantic colonies. Mar. Ecol. Prog. Ser. 125, 3–11. doi: 10.3354/meps125003
Valladares, S., Moreno, R., Jover, L., and Sanpera, C. (2010). Evaluating cleansing effects on trace elements and stable isotope values in feathers of oiled birds. Ecotoxicology 19:223. doi: 10.1007/s10646-009-0407-1
Verburg, P. (2007). The need to correct for the Suess effect in the application of δ13C in sediment of autotrophic Lake Tanganyika, as a productivity proxy in the Anthropocene. J. Paleolimnol. 37, 591–602. doi: 10.1007/s10933-006-9056-z
Wang, L., Shaner, P.-J. L., and Macko, S. (2007). Foliar δ15N patterns along successional gradients at plant community and species levels. Geophys. Res. Lett. 34:L16403. doi: 10.1029/2007GL030722t=
Wassenaar, T., Gerber, P., Verburg, P. H., Rosales, T., Ibrahim, M., and Steinfeld, H. (2007). Projecting land use changes in the Neotropics: the geography of pasture expansion into forest. Glob. Environ. Change 17, 86–104. doi: 10.1016/j.gloenvcha.2006.03.007
White, A. J., Poulin, R. G., Wissel, B., and Somers, C. M. (2012). Agricultural land use alters trophic status and population density of deer mice (Peromyscus maniculatus) on the North American Great Plains. Can. J. Zool. 90, 868–874. doi: 10.1139/z2012-055
Wickramasinghe, L. P., Harris, S., Jones, G., and Vaughan Jennings, N. (2004). Abundance and species richness of nocturnal insects on organic and conventional farms: effects of agricultural intensification on bat foraging. Conserv. Biol. 18, 1283–1292. doi: 10.1111/j.1523-1739.2004.00152.x
Wikelski, M., and Tertitski, G. (2016). Living sentinels for climate change effects. Science 352, 775–776. doi: 10.1126/science.aaf6544
Wiley, A. E., Ostrom, P. H., Welch, A. J., Fleischer, R. C., Gandhi, H., Southon, J. R., et al. (2013). Millennial-scale isotope records from a wide-ranging predator show evidence of recent human impact to oceanic food webs. Proc. Natl. Acad. Sci. U.S.A. 110, 8972–8977 doi: 10.1073/pnas.1300213110
Wolf, N., Bowen, G. J., and del Rio, C. (2011). The influence of drinking water on the D and 18O values of house sparrow plasma, blood and feathers. J. Exp. Biol. 214, 98–103. doi: 10.1242/jeb.050211
Keywords: Antrostomus vociferus, diet change, museum collections, nightjar, nitrogen fertilizer, population declines, trophic-level, Whip-poor-will
Citation: English PA, Green DJ and Nocera JJ (2018) Stable Isotopes from Museum Specimens May Provide Evidence of Long-Term Change in the Trophic Ecology of a Migratory Aerial Insectivore. Front. Ecol. Evol. 6:14. doi: 10.3389/fevo.2018.00014
Received: 25 September 2017; Accepted: 25 January 2018;
Published: 12 February 2018.
Edited by:
Hervé Bocherens, Universität Tübingen, GermanyReviewed by:
Emilio Pagani-Núñez, Sun Yat-sen University, ChinaKeith Alan Hobson, University of Western Ontario, Canada
Brooke Crowley, University of Cincinnati, United States
Copyright © 2018 English, Green and Nocera. This is an open-access article distributed under the terms of the Creative Commons Attribution License (CC BY). The use, distribution or reproduction in other forums is permitted, provided the original author(s) and the copyright owner are credited and that the original publication in this journal is cited, in accordance with accepted academic practice. No use, distribution or reproduction is permitted which does not comply with these terms.
*Correspondence: Philina A. English, penglish@sfu.ca