Zoning of UNESCO Biosphere Reserves: A Comprehensive Set of Geodata for Europe
 Julia Palliwoda
 Andrea Büermann
 Julia Fischer
 Roland Kraemer
 Matthias Schröter
- 1Department of Computational Landscape Ecology, Helmholtz Centre for Environmental Research—UFZ, Leipzig, Germany
- 2Department of Ecosystem Services, Helmholtz Centre for Environmental Research—UFZ, Leipzig, Germany
- 3Department of Ecosystem Services, German Centre for Integrative Biodiversity Research (iDiv) Halle-Jena-Leipzig, Leipzig, Germany
- 4Geography Department, Humboldt-Universität zu Berlin, Berlin, Germany
- 5Department of Monitoring and Exploration Technologies, Helmholtz Centre for Environmental Research—UFZ, Leipzig, Germany
Introduction
Sustainable management and protection of landscapes are needed to safeguard biodiversity and ecosystem services in line with the UN Sustainable Development Goal 15 (Life on Land, United Nations, 2015). It is generally agreed that protected areas are suitable means to achieve this goal. The post-2020 targets of the Convention on Biological Diversity (UNEP, 2020) aim at a conservation of 30% of land by 2030, a goal which is also addressed in the Biodiversity Strategy of the European Union (EU) (European Commission, 2020). However, degrees of protection, i.e., to what degree human interference in these areas is restricted, can differ considerably. For instance, the IUCN protected area categories IV (Habitat/species management area) and V (Protected Landscape/Seascape) allow for human modification, and hence face human pressure, while more strict categories, such as Ia (Strict Nature Reserve) or II (National Park) face lower pressure (Jones et al., 2018). Strict protection can be in conflict with human interests when it comes to direct use of nature and related ecosystem services, for example, timber extraction that might be limited in protected areas (Oldekop et al., 2016). Cultural services like recreation, however, can be either enhanced (e.g., increased attraction due to absence of disturbance) or constrained (e.g., due to access limitations) depending on the degree of protection (Paracchini et al., 2014). Hence, trade-offs between biodiversity, ecosystem services and human use can occur when designating protected areas. Many protected areas, as a consequence, have been designated “high and far” (Joppa and Pfaff, 2009), i.e., in mountainous, distant areas with low opportunity costs of conservation. There is thus a search for strategies that allow for a balance between sustainable human use and protection (or restoration) of biodiversity in landscapes managed and used by people (Tobón et al., 2017; Kremen and Merenlender, 2018). Based on a zoning approach, UNESCO biosphere reserves are a type of designated area that aim at finding such a balance.
Since 1976, the UNESCO Man and the Biosphere (MAB) programme aims at connecting conservation of biodiversity with the sustainable use of ecosystem services, including sustainable economic development and the protection of cultural diversity (Bridgewater, 2016). To achieve this, biosphere reserves (BRs) implement a zoning approach. Each BR consists of three zones with different functions and degrees of protection: (1) the core area focusing on strict protection and conservation of biodiversity, (2) adjacent buffer zones which allow for ecologically sound activities such as environmental education and training with respect to local knowledge and traditions and limited human interference, and (3) the transition area with least restrictions for sustainable ecosystem service use and socio-culturally sustainable economic and human activity (Price et al., 2010; UNESCO, 2021). As a consequence, distinct levels of human-nature interactions can be expected in the different zones, leading to varying disturbances and ecosystem service provision.
BRs support science by serving as functioning models or laboratories for implementing sustainable development goals and undertaking research on how to connect economic development, human activities and biodiversity conservation, which is aimed for by the MAB programme (UNESCO, 2016; Reed, 2018). The collaboration with research and scientific institutions in order to undertake applied research on sustainable development is an important goal of the Lima Action Plan (UNESCO, 2016). However, spatial data of the zones of BRs are scarce and available openly only for a limited number of BRs and from scattered sources. For instance, the World Database on Protected Areas (WDPA) by UNEP-WCMC (https://www.protectedplanet.net) covers only the outer boundaries of some BRs or in many cases merely point data which roughly indicate the location of a reserve. So far, many studies that analyse biodiversity or ecosystem service potential of BRs, have not taken the zoning into account but rely on BRs outer boundaries or single point data per BR (Plieninger et al., 2013; Harris et al., 2019; Vaz et al., 2020). To the best of our knowledge, to date no comprehensive data set of BRs including demarcation of the different zones exists. Within the course of the project BIOSHARE (from 2019 to 2021) we have created a dataset that contains an almost complete collection of zoning data of BRs in Europe. In this data paper we describe the compilation and production of the European BR zoning dataset and provide recommendations on its use.
Methodology
For the European BR dataset we collected geospatial data on the zoning of BRs that were listed on the UNESCO EuroMAB website in July 2020 (https://en.unesco.org/biosphere/wnbr). We included BRs in EU-member and non-EU member states as well as in EUropean Russia (using the Ural Mountains as eastern margin). BRs which were withdrawn before July 2020 (https://en.unesco.org/biosphere/eu-na) were not included in the dataset. BRs in Turkey, Israel as well as the French BRs Commune de Fakarava and Archipel de la Guadeloupe were not included since their geographical location is less relevant for analyses of Europe. We also excluded BRs which have 100% marine or aquatic core areas (e.g., Kizlyar Bay, Russia).
For data acquisition we first approached different institutions on national, regional or local level as well as individual BR administrations for providing zoning data. In most cases, data were kindly provided by these institutions or authorities (see Supplementary Table 1, column “Source of data”).
In a second step, we systematically searched for online databases providing zoning data of European BRs, including the geodata portal of the Austrian Federal State of Voralberg (https://vogis.cnv.at/geodaten/) and the open data portal of Austria (https://www.data.gv.at/), the Swiss open data portal (https://opendata.swiss/), the French portal of the National Museum of Natural History (http://inpn.mnhn.fr), the Hungarian Geoportal (http://inspire.gov.hu), the Portuguese national information system SNIG (https://snig.dgterritorio.gov.pt/), the geoserver of the Slovak Environment Agency (http://maps.geop.sazp.sk/geoserver/web/), the Geo-Portal of Wales (http://lle.gov.wales/), Scotland's Nature Agency data portal (https://gateway.snh.gov.uk/natural-spaces/), the Latvian OZOLS database (https://ozols.gov.lv/pub), and the Mississippi Geospatial Data Catalog (http://opendata.gis.ms.gov/). In addition, we collected spatial data that single BR authorities or third parties provide on their websites such as in Estonia, Italy, Poland, Portugal, Romania, Slovenia, and Sweden (Supplementary Table 1).
As in some cases zoning data were not available as vector data or was incomplete as we could not reach BR officials, we digitized core area, buffer zone and transition area manually on the basis of maps that were provided on the respective BR websites (Supplementary Table 1, code “manually digitized” in column “Source of data”). To do so, zoning maps were georeferenced to available spatial data of the outer boundary or particular zones (e.g., in cases where spatial data were available only for the core area) in the Lambert azimuthal equal-area projection. BR zones were then created as polygon features on the basis of the georeferenced zoning maps. All spatial data were processed and digitized in ArcMap version 10.8 (ESRI) and projected to Lambert azimuthal equal-area projection (EPSG:3035).
For users of the dataset who might want to include missing BRs we suggest considering the database of the Biosphere Smart foundation (http://www.biospheresmart.org/) which includes several additional BRs.
Interpretation of the Dataset
The dataset consists of 153 European BRs (Figure 1; Supplementary Table 1). Except for three BRs for which only outer boundaries are available (column “Including zonation” in Supplementary Table 1), zoning is provided for each BR. The vector file contains three polygon features for core area (zone 1), buffer zone (zone 2) and transition area (zone 3) for most BRs. The related attribute table contains the following information: “BR_Code” (unique code based on country and name of a BR), “UNESCO_Name” [BR name according to the UNESCO EuroMAB website (https://en.unesco.org/biosphere/eu-na)], “BR_Zone” (1 = core area, 2 = buffer zone, 3 = transition area) and “Area_ha” (area of the BR zone in ha).
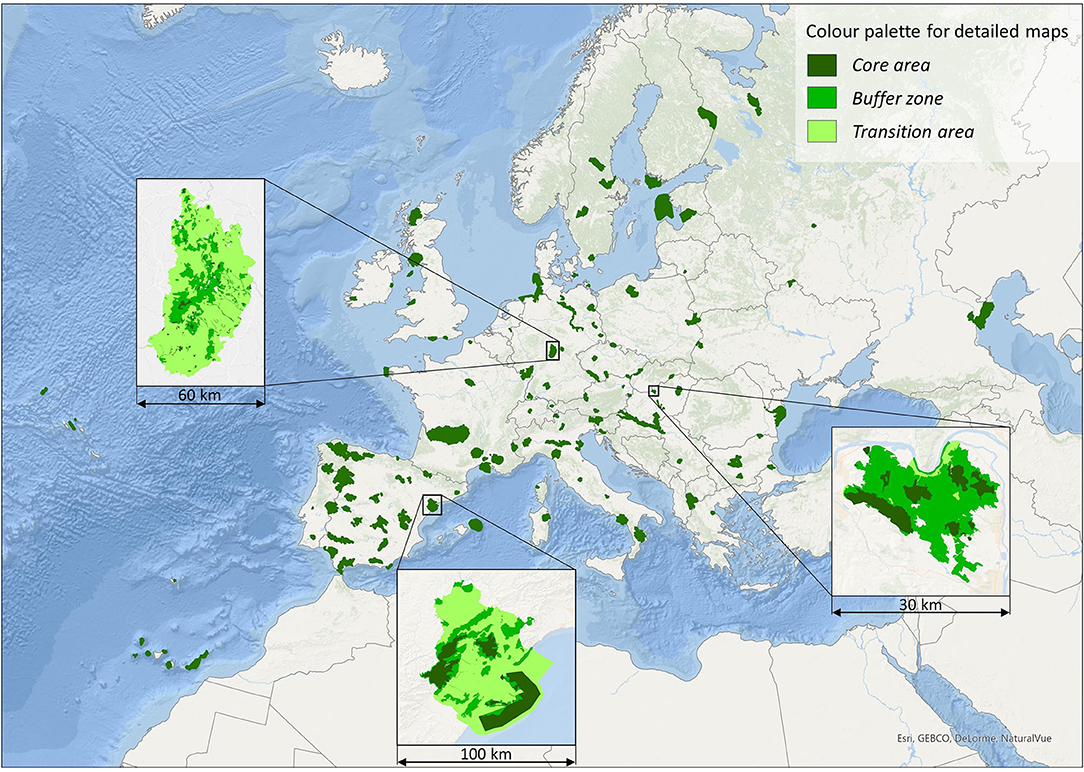
Figure 1. Overview map of 153 European biosphere reserves included in this dataset (dark green areas; no zones depicted due to perceptibility) and detailed maps of the zoning of three exemplary biosphere reserves, Pilis (Hungary), Rhön (Germany), Terres de l'Ebre (Spain). All maps projected in EPSG:3035.
The corresponding data with further detail on the BRs zonation contain the following columns (Supplementary Table 1, csv file in the dataset):
“UNESCO_Name” [BR name according to the UNESCO EuroMAB website (https://en.unesco.org/biosphere/eu-na)], “BR_Code” (unique codes based on country of BR), “Part_of_dataset” (yes/no), “Reason_for_exclusion,” “Including_zonation” (yes or no in case of outer boundary only), “Year_of_zonation_data” (timeliness of available geodata), “Date_of_download,” “Source of data” (source of the spatial data or map data), “Country” (country or countries that the BR is situated in), and “Year_of_designation” (year the BR was designated).
Column “reason_for_exclusion” includes the following categories: “no approval” (when geodata are available but cannot be published), “no data available” (when geodata could not be found, not even upon direct contact with responsible authorities), “sharing only on reasonable request” (when a CC BY-NC 4.0 license for publishing is missing, but geodata is available and can be shared on reasonable request), and “to be delisted by UNESCO.”
Recommendations on Data Use
The dataset comprises spatial information on the extent as well as on the zones for the majority of European BRs and can be used for a variety of trans-European analyses. Such analyses could encompass an assessment of the state or the monitoring of biodiversity and ecosystem services, either between BRs, between BR zones or to compare protected areas within BRs with unprotected areas or with protected areas with a different management (Palliwoda et al., 2021). Furthermore, the dataset can be useful as a complement to the World Database on Protected Areas (WDPA) for analyses on protected areas in Europe.
Limitations
Possible limitations on the use of the dataset are grounded in varying currentness of the zoning data. Any analysis employing such cross-regional data needs to consider this diversity in time references as well as take into account local peculiarities of the environment and the management of the BRs included in the dataset. Any analysis, should take into account that originally designated BR zones can be revised and adapted at any point of time (Price et al., 2010).
Data
In total, the dataset comprises 153 BRs in 31 countries (Supplementary Table 1; Figure 1). We could not find zoning data from 15 European BRs (see Supplementary Table 1, code “no data available” in column “Reason_for_exclusion”). For total BR size the mean is 187,721 ha (sd: 291,271 ha), and the median is 78,484 ha (first quartile: 38,933 ha; third quartile: 241,362 ha). For core area size the mean is 17,004 ha (sd: 25,368 ha), and the median is 7,830 ha (first quartile: 3,306 ha; third quartile: 16,557 ha). For buffer zone size the mean is 59,533 ha (sd: 90,239 ha), and the median is 25,284 ha (first quartile: 12,280 ha; third quartile: 58,455 ha). For transition area size the mean is 113,426 ha (sd: 222,320 ha), and the median is 37,519 ha (first quartile: 11,830 ha; third quartile: 118,534 ha) (Figure 2).
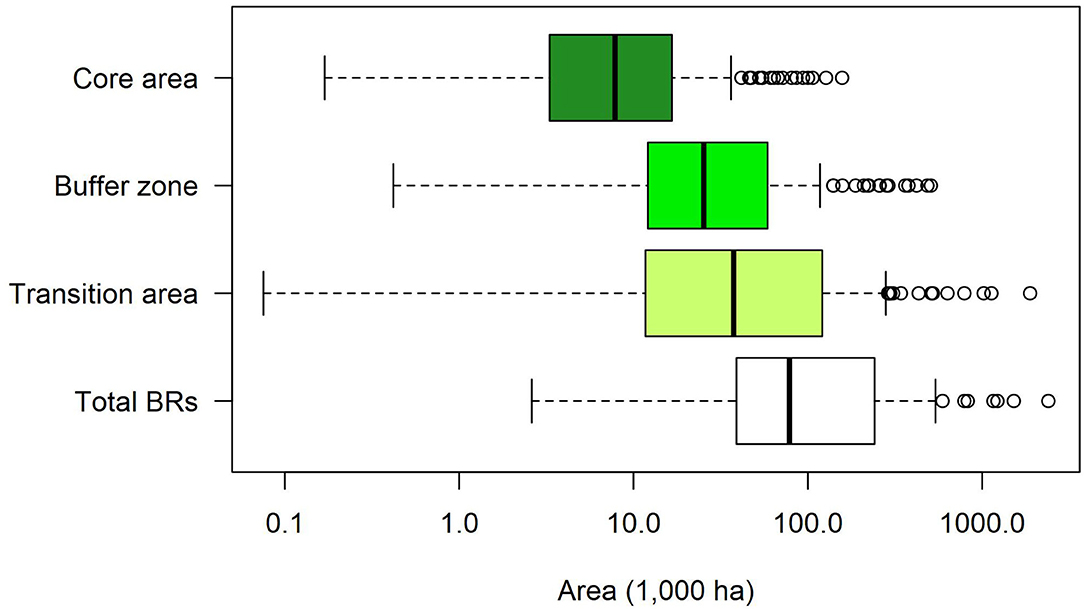
Figure 2. Size distribution of biosphere reserves total area and zones (core area, buffer zone, transition area) across the 153 digitized reserves in Europe. Boxplots depict median values (thick black line) and first and third quartiles (box border).
Data Availability Statement
The dataset generated for this study can be found in the Zenodo repository at https://doi.org/10.5281/zenodo.4905531.
Author Contributions
JP and AB acquired and curated the data. JF and RK curated and analyzed the data. MS designed the study. JP, AB, JF, RK, and MS wrote the manuscript. All authors contributed to the article and approved the submitted version.
Funding
JP, AB, and JF were funded through Klaus Tschira Foundation (KT08, BIOSHARE). RK was supported by the German Federal Ministry of Education and Research (BMBF; no.01LN1705A, Green Equity HEALTH). AB acknowledges support of iDiv funded by the German Research Foundation (DFG-FZT 118, 202548816).
Conflict of Interest
The authors declare that the research was conducted in the absence of any commercial or financial relationships that could be construed as a potential conflict of interest.
Publisher's Note
All claims expressed in this article are solely those of the authors and do not necessarily represent those of their affiliated organizations, or those of the publisher, the editors and the reviewers. Any product that may be evaluated in this article, or claim that may be made by its manufacturer, is not guaranteed or endorsed by the publisher.
Acknowledgments
We thank UNESCO-MAB and UNEP-WCMC for advice on zoning data collection. We thank all national agencies, organizations and reserve administrations for providing data.
Supplementary Material
The Supplementary Material for this article can be found online at: https://www.frontiersin.org/articles/10.3389/fevo.2021.736358/full#supplementary-material
References
Bridgewater, P. (2016). The man and biosphere programme of UNESCO: rambunctious child of the sixties, but was the promise fulfilled? Curr. Opin. Environ. Sustain. 19, 1–6. doi: 10.1016/j.cosust.2015.08.009
European Commission (2020). EU Biodiversity Strategy for 2030. Bringing Nature Back into our Lives. COM(2020) 380 Final. (Brussels: European Commission).
Harris, M., Cave, C., Foley, K., Bolger, T., and Hochstrasser, T. (2019). Urbanisation of protected areas within the european union—an analysis of UNESCO biospheres and the need for new strategies. Sustainability 11:5899. doi: 10.3390/su11215899
Jones, K. R., Venter, O., Fuller, R. A., Allan, J. R., Maxwell, S. L., Negret, P. J., et al. (2018). One-third of global protected land is under intense human pressure. Science 360, 788–791. doi: 10.1126/science.aap9565
Joppa, L. N., and Pfaff, A. (2009). High and far: biases in the location of protected areas. PLoS ONE 4:e8273. doi: 10.1371/journal.pone.0008273
Kremen, C., and Merenlender, A. M. (2018). Landscapes that work for biodiversity and people. Science 362:304. doi: 10.1126/science.aau6020
Oldekop, J. A., Holmes, G., Harris, W. E., and Evans, K. L. (2016). A global assessment of the social and conservation outcomes of protected areas. Conserv. Biol. 30, 133–141. doi: 10.1111/cobi.12568
Palliwoda, J., Fischer, J., Felipe-Lucia, M. R., Palomo, I., Neugarten, R., Büermann, A., et al. (2021). Ecosystem service coproduction across the zones of biosphere reserves in Europe. Ecosyst. People 17, 491–506. doi: 10.1080/26395916.2021.1968501
Paracchini, M. L., Zulian, G., Kopperoinen, L., Maes, J., Schägner, J. P., Termansen, M., et al. (2014). Mapping cultural ecosystem services: a framework to assess the potential for outdoor recreation across the EU. Ecol. Indic. 45, 371–385. doi: 10.1016/j.ecolind.2014.04.018
Plieninger, T., Dijks, S., Oteros-Rozas, E., and Bieling, C. (2013). Assessing, mapping, and quantifying cultural ecosystem services at community level. Land Use Policy 33, 118–129. doi: 10.1016/j.landusepol.2012.12.013
Price, M. F., Park, J. J., and Bouamrane, M. (2010). Reporting progress on internationally designated sites: the periodic review of biosphere reserves. Environ. Sci. Policy 13, 549–557. doi: 10.1016/j.envsci.2010.06.005
Reed, M. G. (2018). The contributions of UNESCO man and biosphere programme and biosphere reserves to the practice of sustainability science. Sustain. Sci. 14, 809–821. doi: 10.1007/s11625-018-0603-0
Tobón, W., Urquiza-Haas, T., Koleff, P., Schröter, M., Ortega-Álvarez, R., Campo, J., et al. (2017). Restoration planning to guide Aichi targets in a megadiverse country. Conserv. Biol. 31, 1086–1097. doi: 10.1111/cobi.12918
UNEP (2020). Zero Draft of the Post-2020 Global Biodiversity Framework. Nairobi: UNEP. Available online at: https://www.cbd.int/conferences/post2020/wg2020-02/documents (accessed August 24, 2021).
UNESCO (2016). Lima Action Plan for UNESCO's Man and the Biosphere (MAB) Programme and its World Network of Biosphere Reserves (2016–2025). Paris, France: UNESCO.
UNESCO (2021). Technical Guidelines for Biosphere Reserves, a new tool for the MAB Programme. Available online at: https://en.unesco.org/news/technical-guidelines-biosphere-reserves-new-tool-mab-programme (accessed February 22, 2021).
United Nations (2015). “Transforming our world: the 2030 agenda for sustainable development. A/RES/70/1,” in Resolution Adopted by the General Assembly (New York, NY).
Keywords: biosphere reserve, nature conservation, sustainable land use, zonation, cultural landscape, geodata, Europe
Citation: Palliwoda J, Büermann A, Fischer J, Kraemer R and Schröter M (2021) Zoning of UNESCO Biosphere Reserves: A Comprehensive Set of Geodata for Europe. Front. Ecol. Evol. 9:736358. doi: 10.3389/fevo.2021.736358
Received: 05 July 2021; Accepted: 13 September 2021;
Published: 08 October 2021.
Edited by:
Péter Ódor, Hungarian Academy of Sciences, HungaryReviewed by:
Miguel Alfonso Ortega-Huerta, National Autonomous University of Mexico, MexicoAlejandro Rescia Perazzo, Complutense University of Madrid, Spain
Copyright © 2021 Palliwoda, Büermann, Fischer, Kraemer and Schröter. This is an open-access article distributed under the terms of the Creative Commons Attribution License (CC BY). The use, distribution or reproduction in other forums is permitted, provided the original author(s) and the copyright owner(s) are credited and that the original publication in this journal is cited, in accordance with accepted academic practice. No use, distribution or reproduction is permitted which does not comply with these terms.
*Correspondence: Matthias Schröter, matthias.schroeter@posteo.de