 Mengmeng Jiang1,2†
 Jieying Chen3†Wenwen Zhang1,2Rui Zhang1Yingnan Ye1Pengpeng Liu1
 Wenwen Yu2
 Feng Wei2Xiubao Ren2
 Jinpu Yu1,2*
- 1Cancer Molecular Diagnostics Core, Tianjin Medical University Cancer Institute and Hospital, National Clinical Research Center for Cancer, Key Laboratory of Cancer Prevention and Therapy, Tianjin’s Clinical Research Center for Cancer, Tianjin, China
- 2Department of Immunology, Tianjin Medical University Cancer Institute and Hospital, National Clinical Research Center for Cancer, Key Laboratory of Cancer Immunology and Biotherapy, Tianjin’s Clinical Research Center for Cancer, Tianjin, China
- 3Department of Urology, Tianjin Medical University General Hospital, Tianjin, China
Interleukin-6 (IL-6) has been reported to stimulate myeloid-derived suppressor cells (MDSCs) in multiple cancers, but the molecular events involved in this process are not completely understood. We previously found that cancer-derived IL-6 induces T cell suppression of MDSCs in vitro via the activation of STAT3/IDO signaling pathway. In this study, we aimed to elucidate the underlying mechanisms. We found that in primary breast cancer tissues, cancer-derived IL-6 was positively correlated with infiltration of MDSCs in situ, which was accompanied by more aggressive tumor phenotypes and worse clinical outcomes. In vitro IL-6 stimulated the amplification of MDSCs and promoted their T cell suppression ability, which were fully inhibited by an IL-6-specific blocking antibody. Our results demonstrate that IL-6-dependent suppressor of cytokine signaling 3 (SOCS3) suppression in MDSCs induced phosphorylation of the JAK1, JAK2, TYK2, STAT1, and STAT3 proteins, which was correlated with T cell suppression of MDSCs in vitro. Therefore, dysfunction in the SOCS feedback loop promoted long-term activation of the JAK/STAT signaling pathway and predominantly contributed to IL-6-mediated effects on MDSCs. Furthermore, IL-6-induced inhibition of SOCS3 and activation of the JAK/STAT pathway was correlated with an elevated expression of IL-6 receptor α (CD126), in which the soluble CD126-mediated IL-6 trans-signaling pathway significantly regulated IL-6-mediated effects on MDSCs. Finally, IL-6-induced SOCS3 dysfunction and sustained activation of the JAK/STAT signaling pathway promoted the amplification and immunosuppressive function of breast cancer MDSCs in vitro and in vivo, and thus blocking the IL-6 signaling pathway is a promising therapeutic strategy for eliminating and inhibiting MDSCs to improve prognosis.
Introduction
Increasing evidence has highlighted the importance of crosstalk between cancer cells and the surrounding microenvironment in the initiation and progression of various cancers (1–3). The tumor microenvironment is composed of multiple immunosuppressive cells, among which myeloid-derived suppressor cells (MDSCs) play a vital role in promoting tumor invasion and metastasis (3).
Myeloid-derived suppressor cells are a heterogeneous population of immature myeloid cells with suppressive effects on both innate and adaptive immunity; therefore, they are regarded as a major obstacle in antitumor immunotherapy (4). Different MDSCs subsets display varied phenotypes in mice or in humans. For example, monocytic MDSCs (M-MDSCs) express CD11b+Ly6G−Ly6Chi in mice and CD11b+HLA-DR−/loCD14+CD15− in human; while polymorphonuclear MDSCs (PMN-MDSCs) express CD11b+Ly6G+Ly6Clo in mice and CD11b+HLA-DR−/loCD14−CD15+ in human. Additionally, early-stage MDSCs (eMDSCs), which comprised more immature progenitors than M-MDSCs and PMN-MDSCs, are defined as specific MDSCs subset expressing Lin−HLA-DR−CD33+ in human tumors (5). In our previous study, we identified a subset of poorly differentiated eMDSCs in breast cancer that expressed an immature phenotype of Lin−HLA-DR−CD45+CD33+CD13+CD14−CD15− and displayed potent suppression of T cells in vitro and in vivo (6). We found that cancer-derived interleukin-6 (IL-6) induces the immunosuppressive ability of MDSCs by activating the STAT3/IDO signaling pathway, but the detailed molecular events are unclear (7).
Interleukin-6 is known as a key regulator of immunosuppression in advanced cancer and is responsible for the development of pro-inflammatory and metastatic tumor microenvironments (8). Numerous studies have reported significant correlations between IL-6 and circulating MDSCs in both human and mouse models (9–14). IL-6 increased circulating CD11b+CD14+HLA−DR− cells in squamous carcinoma of the esophagus (9) and prostate cancer (13). Though previous studies reported that IL-6 restored MDSC accumulation in a mouse model of mammary carcinoma (14), a few studies have focused on the relationship between IL-6 and MDSCs in human breast cancer. Our previous study demonstrated that in breast cancers, IL-6 stimulates STAT3-dependent, nuclear factor-κB-mediated indoleamine 2,3-dioxygenase (IDO) upregulation in MDSCs (7); this triggers immunosuppressive effects of MDSCs in vitro and vivo (6). Although abnormal accumulation of MDSCs via the IL-6/STAT3 pathway was reported in multiple cancers (9, 13, 15), the major regulatory mechanisms remain unclear.
It is well-established that the interaction between IL-6 and IL-6R initiates the activation of the JAK/STAT signaling pathway, which transduces the IL-6 signal in both normal and malignant cells. In contrast to the rapid and reversible activation of STAT proteins in normal cells, phosphorylation of STAT proteins is sustained for a long time in malignant cells (16, 17). The dysfunctional negative feedback loop in the JAK/STAT signaling pathway induces constitutive activation of STAT proteins, oncogenic transformation, tumor invasion, and metastasis (18).
Suppressor of cytokine signaling (SOCS) proteins, particularly SOCS3, are major negative feedback regulators of the JAK/STAT signaling pathway (19). Under physiological conditions, IL-6 stimulates the expression of SOCS3 and inhibits phosphorylation of STAT proteins (20). This attenuates IL-6-induced activation of the JAK/STAT signaling pathway and inhibits expression of downstream functional genes (17, 21). It has been reported that constitutive defects in the expression of SOCS3 protein is frequent in malignant cells and is associated with dysregulation of cell growth, migration, and apoptosis (19).
However, only short-term and reversible suppression of SOCS was detected in certain types of immune cells in cancer, such as tumor-infiltrated T cells, dendritic cells (DCs), and macrophages (22, 23). It has been demonstrated that knockdown of SOCS3 in macrophages is beneficial for inhibiting tumor metastases in mice (24). However, it has also been reported that SOCS3 deficiency in myeloid cells promotes tumor development by inducing MDSCs in the tumor microenvironment (25). Therefore, it is urgent to elucidate the biological significance of SOCS3 deficiency in MDSC development and tumor progression, which may provide insight into potential therapeutic targets for breast cancer.
In this study, we evaluated the expression of SOCS proteins and their effects on IL-6-induced activation of the JAK/STAT signaling pathway in breast cancer MDSCs. We found that more MDSCs were recruited in IL-6 high-expressing breast cancer tissues, in which SOCS3 inhibition was detected. IL-6 promoted the amplification of MDSCs and enhanced their suppressive effects on T cells immunity in vitro. IL-6 stimulated SOCS3 suppression and thus induced long-term activation of the JAK/STAT signaling pathway in breast cancer MDSCs. IL-6-induced SOCS3 dysfunction and sustained activation of the JAK/STAT signaling pathway predominantly contributed to IL-6-mediated effects on MDSCs. Furthermore, we observed that IL-6-induced suppression of SOCS3 and activation of the JAK/STAT pathway were correlated with an elevated expression of IL-6 receptor α (IL-6-Rα, CD126), which was regulated by the soluble CD126-mediated IL-6 trans-signaling pathway. Summarily, we found that IL-6-induced SOCS3 dysfunction and sustained activation of the JAK/STAT signaling pathway promoted the amplification and immunosuppressive function of breast cancer MDSCs in vitro and vivo. Thus, blocking IL-6 signaling pathway is a promising therapeutic strategy for eliminating and inhibiting MDSCs to improve prognosis.
Materials and Methods
Clinical Samples and Healthy Donors
In this study, we collected 253 primary breast cancer tissue samples from two cohorts for immunohistochemistry (IHC) analysis. Cohort 1 included 113 primary breast cancer patients who received surgical resection at the Department of Breast Oncology of Tianjin Medical University Cancer Institute and Hospital from October 2012 to October 2014. Cohort 2 included 140 breast cancer cases whose tumor tissues were assembled on tissue arrays after surgical removal between January 2001 and August 2004 from Shanghai Outdo Biotech Co., Ltd. (Shanghai, China). All patients were women with a median age of 52 years (29–79 years) in cohort 1 and 51 years (29–83 years) in cohort 2. Among the patients, infiltrated mammary-ductal carcinoma accounted for 78.8% (89/113) in cohort 1 and 93.6% (131/140) in cohort 2. Cohort 1 included 9, 72, and 26 patients with histological grade I, II, and III cancer, respectively. Cohort 2 included 19, 111, and 7 patients with histological grade I, II, and III cancer, respectively. Cohort 1 included 18, 65, and 29 patients with clinical stage I, II, and III cancer, respectively. Cohort 2 included 11, 80, and 47 patients with clinical stage I, II, and III cancer, respectively (Table 1). Three patients in cohort 2 were excluded from the study because of non-cancer related death.
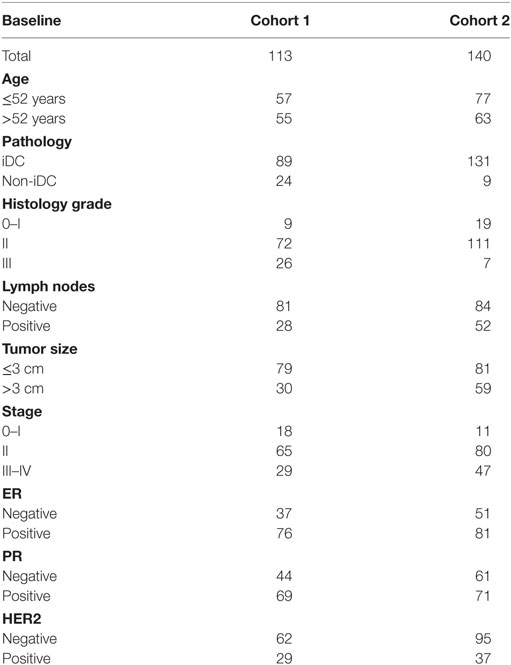
Table 1. Baseline of all patients.
In addition, 20 fresh primary breast cancer tissue samples and the corresponding adjacent tissues were obtained for isolation of primary MDSCs in situ. Peripheral blood (PB) samples (40) from healthy donors were collected to enrich CD3+ T cells to study the immunosuppressive ability of MDSCs in vitro. Additionally, CD33+ and CD14+ cells isolated from healthy donors’ PB samples were employed as myeloid progenitor and differentiated monocyte controls, respectively. This study was approved by the Medical Ethics Committee of Tianjin Medical University. All experiments were performed in accordance with the principles of the Declaration of Helsinki. Written consent was obtained from all patients and healthy donors.
Isolation of Primary MDSCs and CD33+ Progenitors
Twenty primary breast cancer tissues and their adjacent tissues were collected during surgery and cut into small pieces before being ground and filtered using a filter mesh to prepare a single-cell suspension. CD33+ cells were isolated using human CD33 MicroBeads (130-045-501; Miltenyi Biotec, Bergisch Gladbach, Germany) as previously reported (6). The negative-selected cells were defined as breast cancer cells and analyzed for the expression of IL-6. Thirty cases of PB samples were collected from healthy donors for PBMC isolation. CD33+ and CD14+ cells were enriched using human CD33 (130-045-501; Miltenyi Biotec) and human CD14 MicroBeads (130-050-201; Miltenyi Biotec), respectively, according to the manufacturer’s instructions. Trypan blue staining was performed to ensure the full viability of each cell fraction.
IHC Assay
Fresh tissues were immediately fixed with formalin after surgical removal; tissues were made into paraffin embedded blocks and then sliced into 4-µm serial sections. The samples were heated for 1 h at 70°C, deparaffinized in xylene, and rehydrated using graded alcohol. Antigens were retrieved in citrate buffer (pH 6.0) for 2 min. Endogenous peroxidase activity was quenched in 3% hydrogen peroxide for 20 min. We previously examined the expression a series of pan-myeloid and differentiated markers of myeloid linage and confirmed high expression of CD33 and CD13, low expression of HLA-DR and CD14, and negative expression of CD15 on the surface of breast cancer MDSCs (6). We also detected the expression of 3 pan-myeloid markers, including CD33 (26), CD13 (27), and CD11b (28) and found that non-specific staining of CD13 and CD11b on cancer cells, endothelial cells, and fibroblasts interfered with the specific staining on MDSCs (Figures S1B–C in Supplementary Material), indicating the feasibility of using CD33 to detect breast cancer MDSCs in an IHC assay. Therefore, all samples were incubated with mouse anti-human IL-6 (PeproTech, Rocky Hill, NJ, USA) and CD33 (Abcam, Cambridge, UK) monoclonal antibody (McAb) at a concentration of 1 µg/mL overnight at 4°C. A secondary antibody conjugated with streptavidin-horseradish peroxidase (Santa Cruz, Biotech, Dallas, TX, USA) was then added, and the mixture was incubated for 30 min before adding diaminobenzidine staining buffer (Maixin Biotechnology, Fuzhou, China). All images were captured using an Olympus BX51 microscope (Olympus, Tokyo, Japan). Five representative high-power fields (400× magnification) from each tissue section were selected for histology evaluation as previously described (6).
Flow Cytometry Analysis
Primary MDSCs were isolated from primary breast tumor tissues. To assess the proportions of CD45+CD13+CD33+CD14−CD15− MDSCs in cancerous and corresponding adjacent normal tissues, flow cytometry analysis was performed using a BD FACS Canto™ II flow cytometer (BD Biosciences, San Jose, CA, USA). The PerCp-conjugated anti-human CD45, phycoerythrin-conjugated anti-human CD13 and CD33, and fluorescein isothiocyanate-conjugated anti-human CD14 and CD15 (BD Biosciences) antibodies were used to label the MDSCs. An isotype-matched IgG1 antibody (BD Biosciences) was used as a negative control. After incubation, cells were washed and resuspended in buffer, and the expression of cell surface markers was detected using the flow cytometer. The leukocyte population was gated using PerCp-labeled anti-human CD45, and breast cancer MDSCs were defined as CD33+CD13+CD14−CD15− in the CD45+ population. Furthermore, to detect the production of interferon (IFN)-γ and IL-10 in T cells co-cultured with or without MDSCs, we conducted an intracellular staining assay using flow cytometry. After co-culture, T cells were distinguished by allophycocyanin-labeled anti-CD3 McAb and the percentages of IFN-γ positive and IL-10 positive T cells were determined using PE/Cy7-labeled anti-IFN-γ and PE-labeled anti-IL-10 McAbs, respectively.
Cell Line and Cell Culture
The human breast cancer cell line MDA-MB-231 was obtained from the Chinese Academy of Medical Sciences (Resource number: 3111C0001CCC000014). The cell line was cultured in complete RPMI 1640 medium (Gibco BRL, Grand Island, NY, USA) containing 10% fetal bovine serum in a 5% CO2 incubator at 37°C. CD33+ progenitors isolated from PBMCs of healthy donors were co-cultured with breast tumor cells to induce MDSCs with or without IL-6 antibody. CD33+ and CD14+ control cells were cultured in complete RPMI 1640 medium. After co-culture with MDSCs for 3 days, the proliferation, apoptosis, and cytokine secretion of T cells were studied to evaluate the immunosuppressive ability of MDSCs pretreated with or without IL-6 antibody.
Induction of MDSCs In Vitro
CD33+ myeloid progenitors (2 × 10⁶/mL) isolated from healthy PBMCs were added to multi-well plates and co-cultured with MDA-MB-231 breast cancer cells to induce MDSCs with or without IL-6 antibody (EMD Millipore, Billerica, MA, USA) at a concentration of 50 µg/mL. CD33+ progenitors were cultured in RPMI 1640 medium supplemented with 10% fetal bovine serum as negative controls. After 48 h of culture, MDSCs were harvested for further analysis, and the supernatants were collected to detect soluble CD126 using the Human IL-6R ELISA Kit (GenWay Biotech, Inc., San Diego, CA, USA). The phenotype of harvested cells was examined by flow cytometry as previously described; the proportion of CD45+CD13+CD33+CD14−CD15− MDSCs was examined (6).
Cell Counting Kit 8 (CCK8) Assay
Cell Counting Kit 8 assay was used to detect the proliferation of T cells co-cultured with or without MDSCs. CD3+ T cells were isolated from PBMCs of 10 healthy donors using the Human Pan T cell Isolation Kit II (130-091-156; Miltenyi Biotec). Both MDSCs and T cells with viability >95% were used for functional assays. Purified T cells (2 × 10⁵) were plated in a 96-well plate and co-cultured with CD33+ cells or MDSCs in the presence or absence of IL-6 antibody at ratio of 1:3 in triplicate. Cells were cultured in complete medium supplemented with 1,000 IU/mL recombinant human IL-2 (PeproTech) or anti-CD3/CD28 Abs (at bead/cell ratio of 1:1, Gibco) at 37°C in a 5% CO2 incubator for 3 days. Next, 10 µL CCK8 (Dojindo Molecular Technologies, Inc., Rockville, MD, USA) was added to each well and incorporated into living cells during cell proliferation. Blank wells without cells were used as negative controls. T cells stimulated with IL-2 or anti-CD3/CD28 Abs were used as the T cell control. After 4 h of incubation, the optical density at 450 nm was measured using an enzyme immunoassay analyzer (Thermo Fisher Scientific, Waltham, MA, USA). Cell proliferation was evaluated using stimulation index (SI), which was calculated using the following formula: SI = [(experimental counts)/(responder control counts + stimulator control counts)].
Annexin V Assay
Purified T cells (5 × 10⁵) were plated in a 24-well plate and co-cultured with CD33+ cells or MDSCs in the presence or absence of IL-6 antibody at ratio of 1:3 in triplicate. Cells were cultured in complete medium supplemented with 1,000 IU/mL recombinant human IL-2 at 37°C in a 5% CO2 incubator for 3 days. The Annexin V assay was used to detect the apoptosis of T cells. We initially gated lymphocytes according to SSC and FSC features and then gated T cells using allophycocyanin-labeled anti-CD3 McAb (BioLegend, San Diego, CA, USA). The cells were stained with FITC-Annexin V and propidium iodide provided in an Apoptosis Detection Kit (BD Biosciences) as previously described (6). The positive expression of Annexin V and negative expression of PI represent apoptotic T cells.
Enzyme-Linked Immunosorbent Assay (ELISA)
Purified T cells (5 × 10⁵) were plated in a 24-well plate and co-cultured with CD33+ cells or MDSCs in the presence or absence of IL-6 antibody at ratio of 1:3 in triplicate. Cells were cultured in complete medium supplemented with 1,000 IU/mL recombinant human IL-2 or anti-CD3/CD28 Abs (at a bead/cell ratio of 1:1) at 37°C in a 5% CO2 incubator for 3 days. The corresponding T cell culture supernatants were collected to detect cytokine levels in an ELISA assay. Levels of T cell-secreted cytokines, including IFN-γ and IL-10, were analyzed using the ELISA kits (Dakewe Biotech Co., Ltd., Shenzhen, China) as per the manufacturer’s instructions.
Quantitative Real-time RT-PCR (qRT-PCR) Analysis
Interleukin-6, CD126, gp130, SOCS1, SOCS2, SOCS3, ADAM10, and ADAM17 mRNA expression in MDSCs isolated from primary breast cancer tissues and in vitro-induced MDSCs was analyzed by qRT-PCR. The mRNA levels of target genes were quantified using the SYBR Premix Ex Taq TM system (Takara Bio, Shiga, Japan) with an ABI 7500 instrument (Applied Biosystems, Foster City, CA, USA). The primers for IL-6, CD126, gp130, SOCS1–3, ADAM10, ADAM17, and β-actin are shown in Table 2. Relative mRNA levels in each sample were calculated based on their threshold cycle (Ct) values normalized to the Ct value of β-actin using the formula: 2−ΔCt (ΔCt = Cttarget gene − Ctβ-actin). All tests were conducted at least five times.
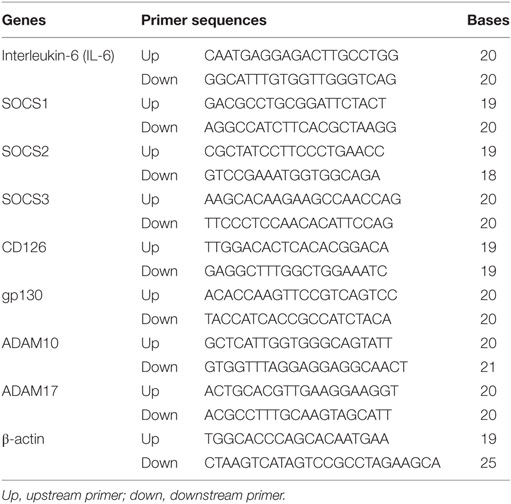
Table 2. The RT-PCR primers of interested genes.
Western Blot Analysis
Western blot analysis was performed to detect the levels of CD126, gp130, ADAM10, ADAM17, and SOCS1–3 proteins, as well as total and phosphorylated JAK1, JAK2, TYK2, STAT1, and STAT3 in MDSCs and CD33+ control cells. Cell lysates were separated by SDS-PAGE and transferred to polyvinylidene difluoride membranes for western blot analysis using mouse anti-human CD126, gp130 (R&D Systems, Inc., Minneapolis, MN, USA), SOCS1 (Medical & Biological Laboratories Co., Ltd., Nagoya, Japan), SOCS2–3 (R&D Systems, Inc.), and β-actin. Rabbit anti-human antibodies were used to detect JAK1, JAK2, TYK2, STAT1, STAT3, p-STAT1, p-JAK1, p-JAK2, p-TYK2, and p-STAT3 (Cell Signaling Technology, Danvers, MA, USA). Membranes were incubated with primary antibodies overnight at 4°C, as described previously (7). Membranes were then incubated with horseradish peroxidase-conjugated anti-mouse or anti-rabbit IgG Ab (Zhongshanjinqiao, Beijing, China), and protein bands were visualized using the SuperSignal West Pico Chemiluminescent Substrate kit (Pierce Biotechnology, Rockford, IL, USA). The relative densities of protein bands were determined by comparing the band densities of proteins of interest to those of β-actin, using Quantity One software. We used the density ratio of phosphorylated protein to total protein to compare the expression of these phosphorylated proteins.
Statistical Analysis
Statistical analyses were performed using the SPSS 20.0 (SPSS, Inc., Chicago, IL, USA) and GraphPad Prism 5.0 software (GraphPad, Inc., La Jolla, CA, USA). Measured data were presented as the mean ± SD; one-way analysis of variance and least significant difference tests were used to compare quantitative data. Categorical data were presented as the median, and the nonparametric χ2 test was used to compare qualitative data. The cumulative survival probability was determined by the Kaplan–Meier method, and the log-rank test was used to compare overall survival (OS) of each subgroup of patients. P-values for each analysis are reported in the figure legends, and the level of statistical significance was set to P < 0.05.
Results
Tumor-Derived IL-6 and Local MDSCs Infiltration Are Significantly Correlated with Lymph Node Metastasis and Poor Prognosis in Breast Cancer Patients
Interleukin-6 was mainly expressed in the cytoplasm of breast cancer cells, as well as in some mesenchymal cells (Figure 1A). Based on the staining intensity and extent of IL-6 expression, breast cancer patients were divided into an IL-6 low expression group (IL-6low) and high expression group (IL-6high). The IL-6high cases accounted for 44.4% (48/108) of patients in cohort 1 and 50.5% (50/99) of patients in cohort 2. CD33+ MDSCs were scattered in the stroma of breast cancer tissues with varying sizes and shapes (Figure 1B). According to the number of CD33+ MDSCs that infiltrated locally, breast cancer patients were divided into lowly infiltrated MDSC group (MDSCslow) and highly infiltrated MDSC group (MDSCshigh). The MDSCshigh cases accounted for 52.0% of patients in cohort 1 and 50.9% of patients in cohort 2.
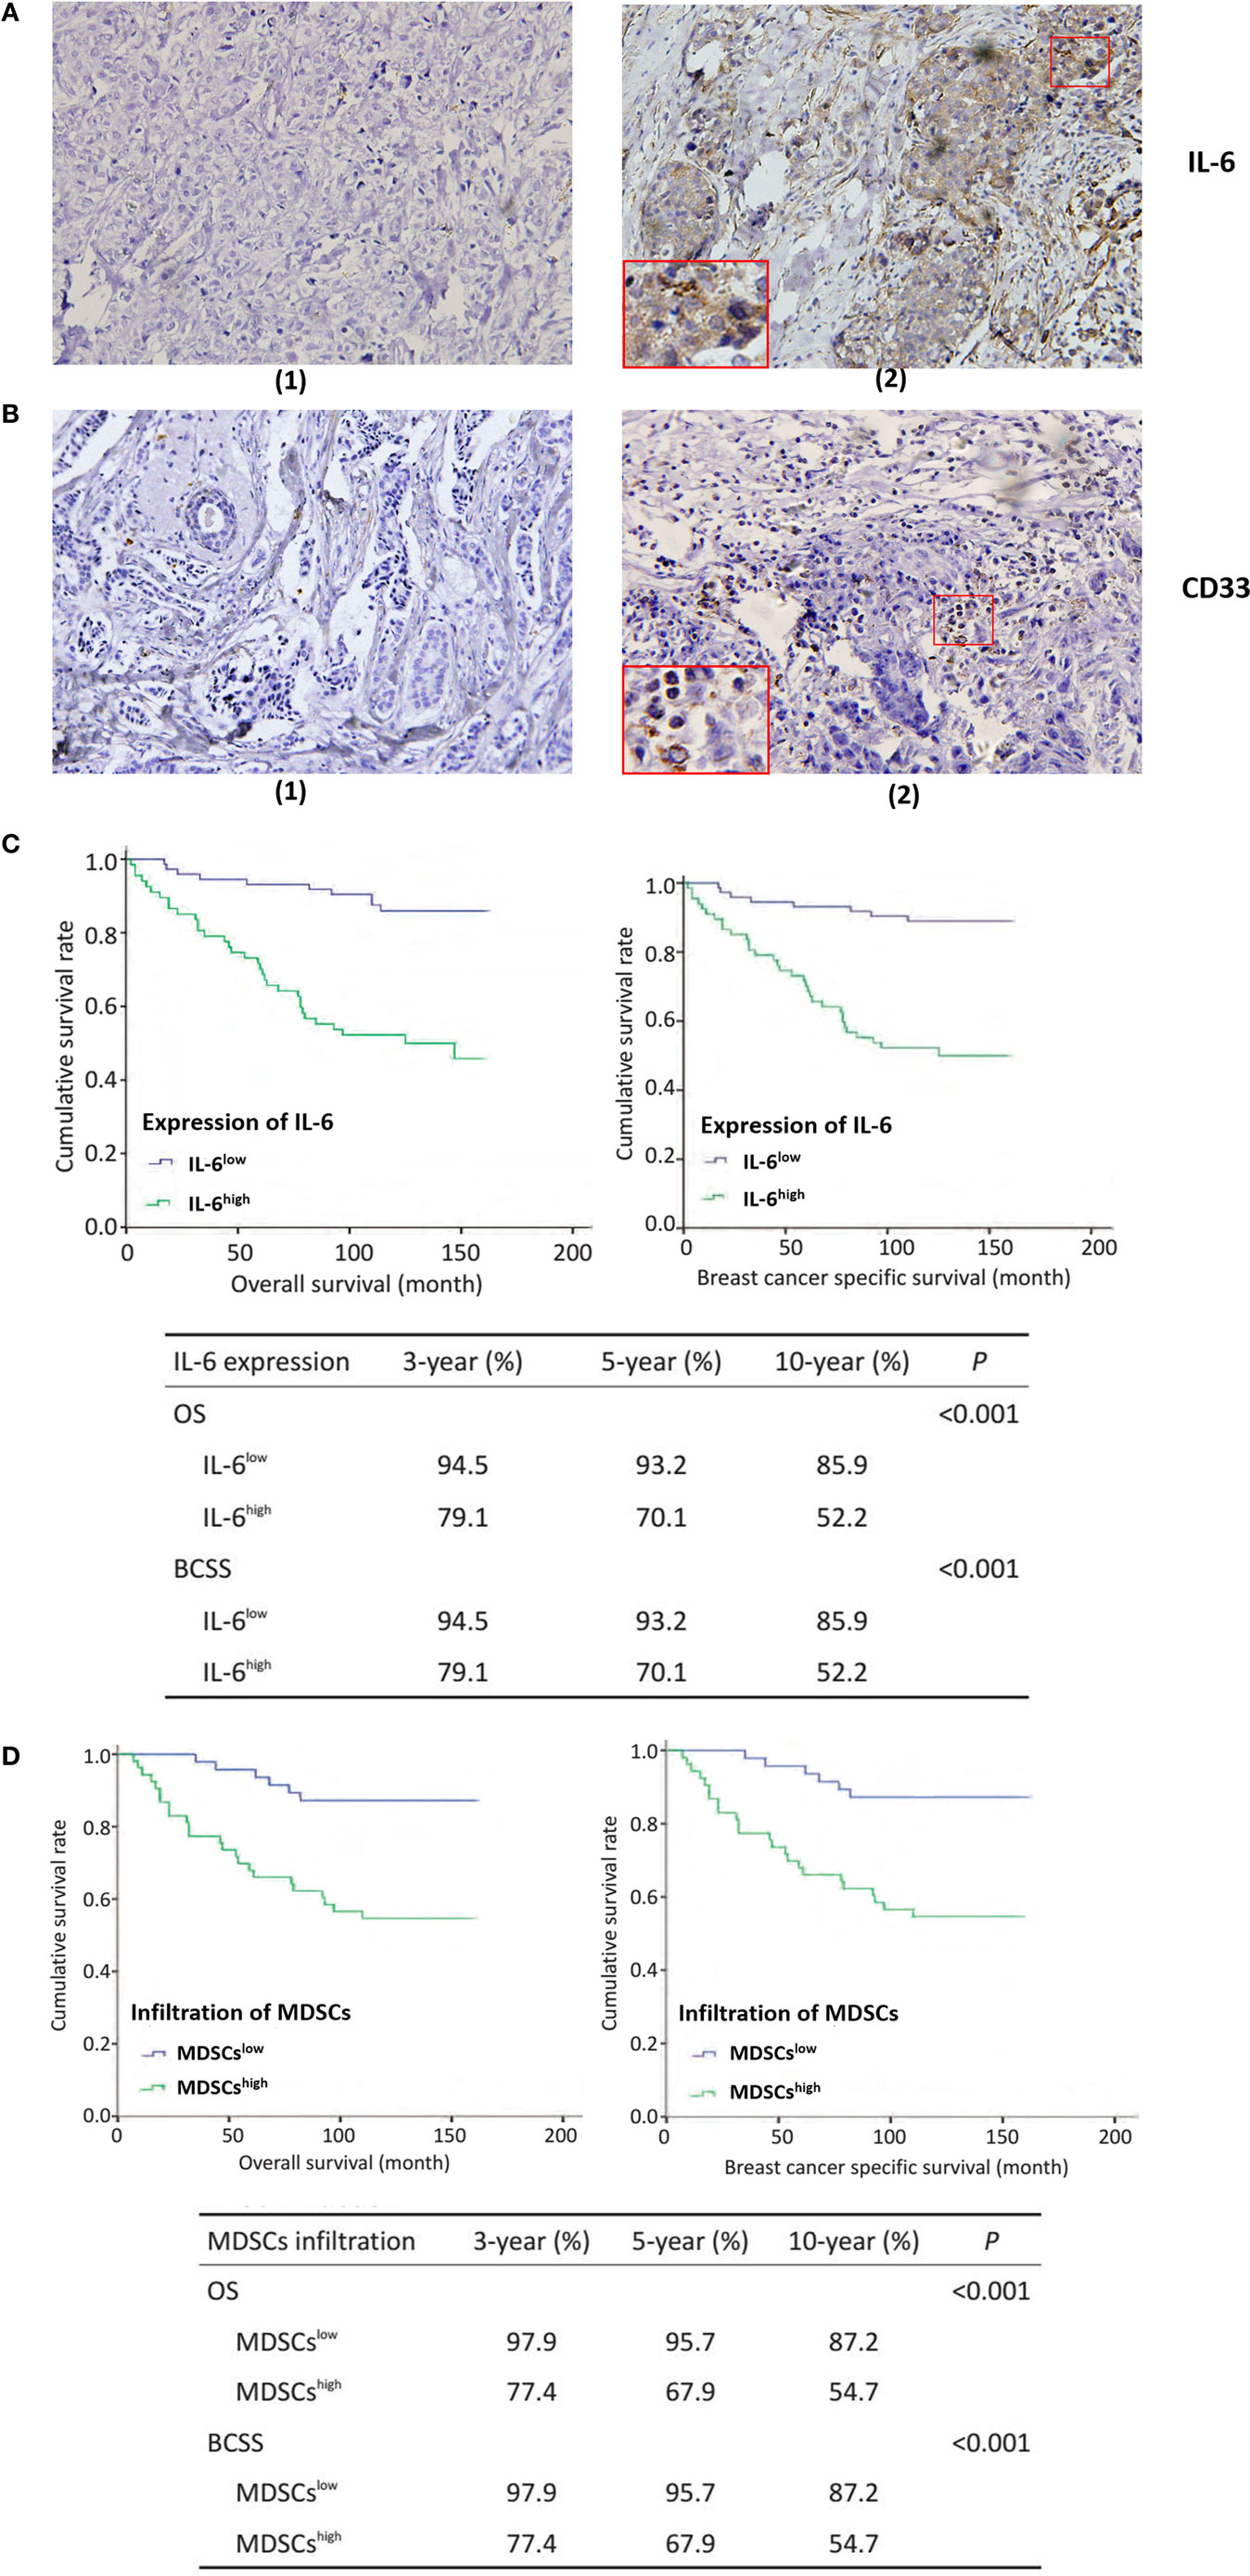
Figure 1. Tumor-derived interleukin-6 (IL-6) and local myeloid-derived suppressor cells (MDSCs) infiltration are significantly correlated with lymph node metastasis and poor prognosis in breast cancer patients. 253 breast cancer patients were selected for immunohistochemistry (IHC) staining of IL-6 and MDSCs, original magnification ×200. Five representative high-power fields (×400) for each tissue section were selected for histology evaluation. (A) (1) Low expression of IL-6; (2) high expression of IL-6. IL-6 was mainly expressed in the cytoplasm of breast cancer cells, as well as in some mesenchymal cells. (B) (1) Low infiltration of MDSCs; (2) The representative high infiltration of MDSCs. We defined the mesenchymal cells expressing CD33 antigen molecules as MDSCs and CD33+ MDSCs were scattered in the stroma of breast cancer tissues with varying sizes and shapes. (C) The overall survival (OS) of the 140 patients in cohort 2 with IL-6 expression and MDSCs infiltration was analyzed using Kaplan–Meier and the Log rank test. The OS, BCSS, 3-, 5-, and 10-year survival rate of IL-6high patients were significantly shorter than those of IL-6low patients (P < 0.001). (D) Similar results were observed in MDSCshigh patients as compared with MDSCslow patients (P < 0.001).
We next compared the correlations between IL-6 expression, MDSCs infiltration, other clinical pathological features (age, agenda, tumor size, tumor pathologic stage, tumor histological grade, and lymph node invasion), and expression of hormone receptors (estrogen receptor, progesterone receptor, and HER2) in the two cohorts. As shown in Table 3, tumor-derived IL-6 expression was significantly correlated with lymph node invasion and tumor histological grade; compared to IL-6low patients, IL-6high patients suffered from more aggressive histological features (cohort 1: P < 0.001; cohort 2: P = 0.001) and a higher risk of early lymph node invasion (cohort 1: P < 0.001; cohort 2: P = 0.012). Similar trends were observed in MDSChigh patients as compared with MDSClow patients, where more infiltrated MDSCs were detected in cancer tissues at more advanced pathological stages, with higher histological grade, more lymph node metastasis, and larger tumor size (P < 0.001, P < 0.001, P = 0.025, P = 0.018; P < 0.001, P = 0.007; P = 0.022, P = 0.032, respectively, Table 4). These results demonstrated that breast cancers with higher IL-6 expression and greater MDSC infiltration possess a higher potential for invasion and metastasis.
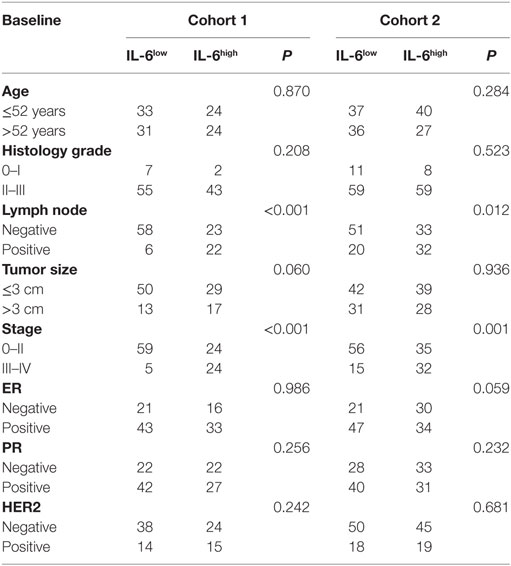
Table 3. Correlations of interleukin-6 (IL-6) with clinicopathological features of breast cancer patients.
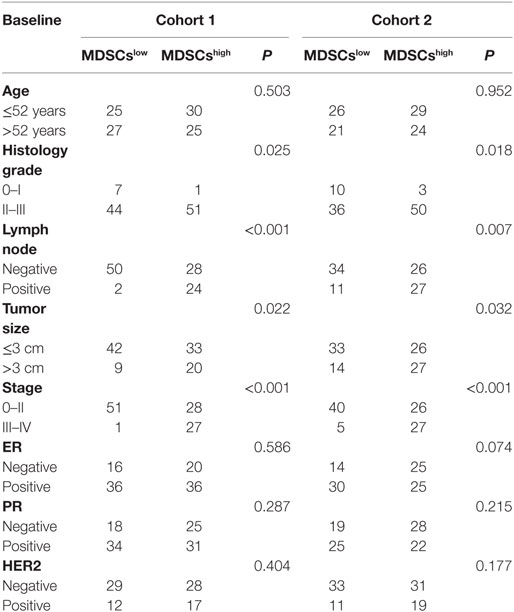
Table 4. Correlations of myeloid-derived suppressor cells (MDSCs) with the clinicopathological characteristics of breast cancer patients.
Next, we compared the OS of the 140 patients in cohort 2 with IL-6 expression and MDSC infiltration. We found that the OS, 3-, 5-, and 10-year survival of IL-6high patients, was significantly shorter than those of IL-6low patients (P < 0.001, Figure 1C). Similarly, IL-6high patients displayed worse overall breast cancer-specific survival, 3-, 5-, and 10-year breast cancer-specific survival compared to IL-6low patients (P < 0.001, Figure 1C). Similar results were observed in MDSChigh patients compared to MDSClow patients (P < 0.001, Figure 1D). Thus, these findings indicate that tumor-derived IL-6 and MDSC infiltration are both unfavorable prognostic factors in breast cancer and are significantly correlated with aggressive tumor behavior and poor clinical outcomes in patients.
Tumor-Derived IL-6 Is Significantly Correlated with the Number of Infiltrated MDSCs In Situ Both at the mRNA and Protein Levels
We compared the correlation between the expression of IL-6 and number of infiltrated MDSCs in situ to evaluate the effects of IL-6 on MDSC accumulation in breast cancer tissues. We first studied the expression of IL-6 protein in 253 paraffin-embedded breast tissues from cohorts 1 and 2 by IHC. We found greater MDSC infiltration in cancer tissues with a high level of IL-6 (Figure 2A). The average number of MDSCs in the IL-6low group was significantly lower than that in the IL-6high group in both cohorts 1 and 2 [(1.95 ± 0.26) vs. (6.40 ± 0.48), P < 0.001; (1.31 ± 0.27) vs. (6.43 ± 0.79), P < 0.001, Figure 2B]. Pearson correlation analysis revealed a positive correlation between the expression of IL-6 and the number of MDSCs in situ in both cohorts (cohort 1, R2 = 0.3974, P < 0.0001; cohort 2, R2 = 0.2812, P < 0.0001, Figure 2B).
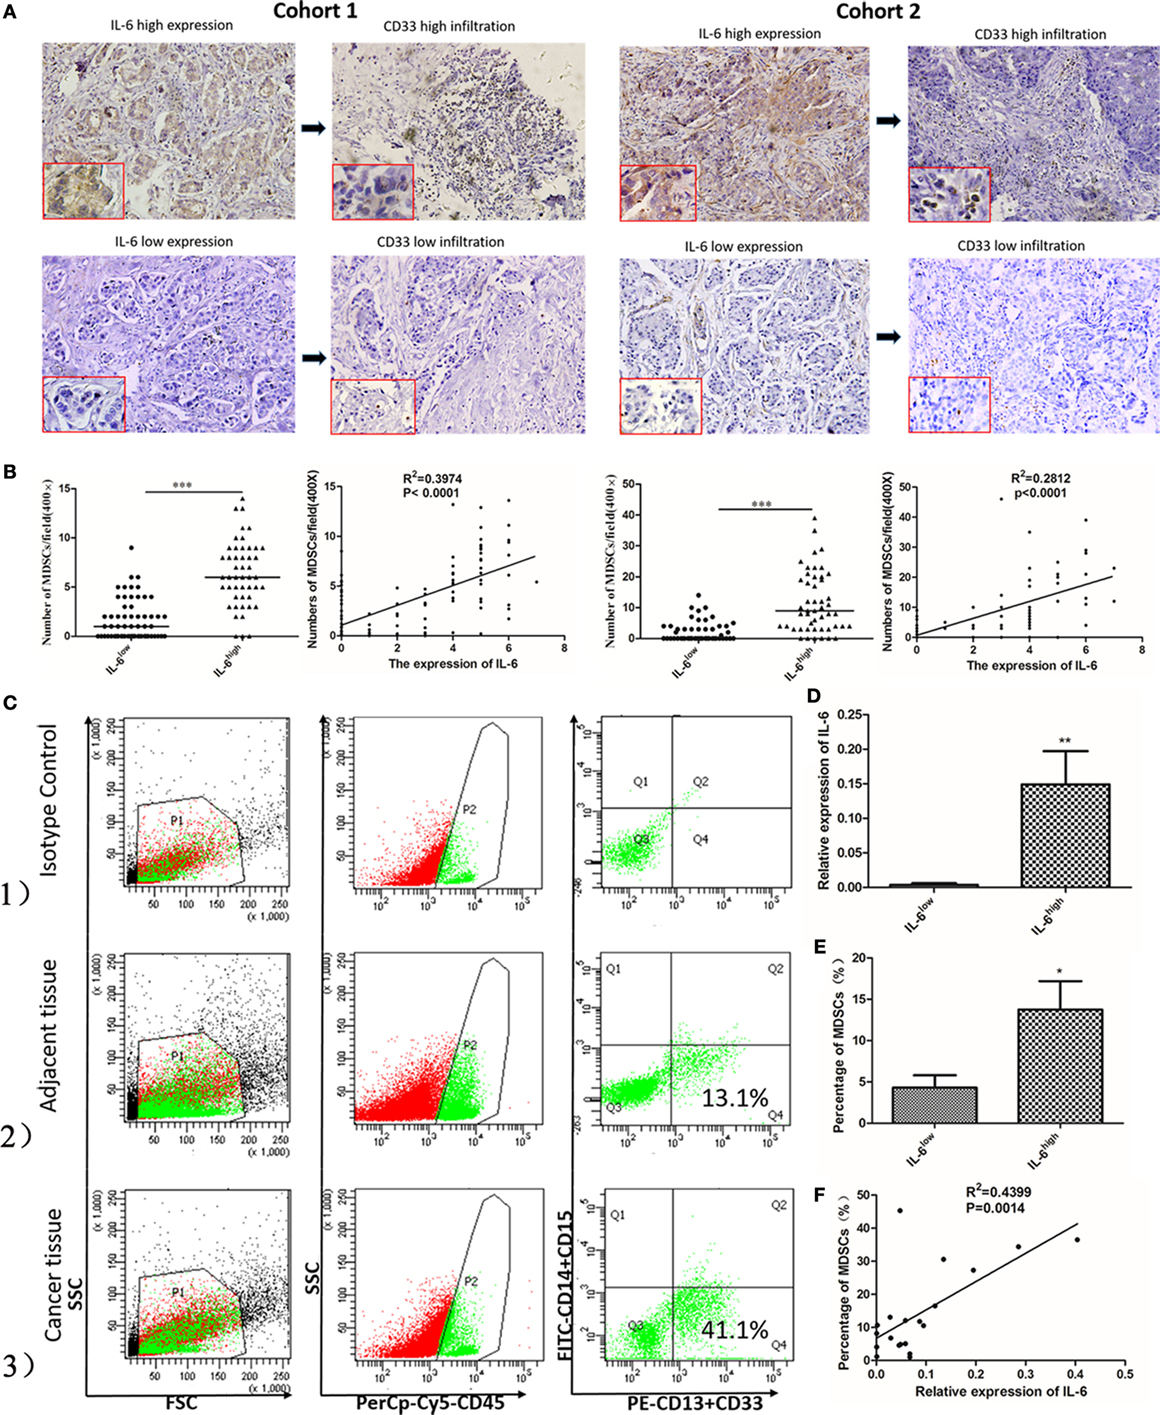
Figure 2. Tumor-derived interleukin-6 (IL-6) is significantly correlated with the number of infiltrated myeloid-derived suppressor cells (MDSCs) in situ both at the mRNA and protein levels. (A) The expression of the IL-6 protein and CD33+ MDSCs infiltration in 253 paraffin-embedded breast tissues from cohort 1 and cohort 2 was studied by immunohistochemistry (IHC). We found greater MDSCs infiltration in cancer tissues with a high level of IL-6. (B) The correlation between the expression of IL-6 and MDSCs was compared both in cohort 1 and cohort 2 in situ (n = 253). The average number of MDSCs in the IL-6low group was significantly lower than that in the IL-6high group in both cohorts 1 and 2. Pearson correlation analysis revealed a positive correlation between the expression of IL-6 and the number of MDSCs in situ in both cohorts. (C) The infiltration percentage of the CD45+CD33+CD13+CD14−CD15− subpopulation in 20 fresh breast cancer tissue samples was detected using flow cytometry. (1) The subpopulation was gated using anti-CD45 mAb and isotype control was used; (2) The CD45+CD33+CD13+CD14−CD15− subpopulation in adjacent normal tissues. (3) The proportion of the interested subpopulation significantly increased in cancer tissues. (D) Based on the median relative RNA level of IL-6, breast cancer samples were divided into IL-6high and IL-6low groups. The average IL-6 mRNA level in the IL-6high group was 37.25-fold higher than that in the IL-6low group (P = 0.0093) (n = 20). (E) A higher frequency of MDSCs was detected in the IL-6high group compared to in the IL-6low group. (F) A correlation analysis on MDSCs number and IL-6 level was carried out (R2 = 0.4399, P = 0.0014) (n = 20). *P < 0.05, **P < 0.01, ***P < 0.001.
Twenty fresh breast cancer tissue samples were collected to study the correlation between RNA levels of tumor-derived IL-6 and percentages of CD45+CD33+CD13+CD14−CD15− MDSCs in breast cancer tissues by flow cytometry analysis. We observed a cluster of CD33+CD13+CD14−CD15− cells in breast cancer tissue, which represented the predominant phenotype of MDSCs in breast cancer (Figure 2C). The percentage of CD45+CD33+CD13+CD14−CD15− MDSCs was 15.3–58.1% with a mean value of 29.82 ± 11.463%. Based on the median relative RNA level of IL-6, breast cancer samples were divided into IL-6high and IL-6low groups. The average IL-6 mRNA level in the IL-6high group was 37.25-fold higher than that in the IL-6low group (P = 0.0093, Figure 2D). Higher frequency of MDSCs was detected in the IL-6high group compared to in the IL-6low group [(13.75 ± 3.44%) vs. (4.31 ± 1.50%), P = 0.03, Figure 2E]. Furthermore, Pearson correlation analysis revealed a strong positive correlation between the expression of IL-6 mRNA and number of MDSCs in fresh breast cancer tissues (R2 = 0.4399, P = 0.0014, Figure 2F).
IL-6 Enhanced the Generation and T Cell Immunosuppressive Ability of MDSCs In Vitro
To mimic the breast cancer cell-conditioned microenvironment in vitro, CD33+ myeloid progenitors were isolated from healthy donors’ PMBCs and co-cultured with MDA-MB-231 breast cancer cells. After 48 h of culture, the proportion of MDSCs possessing the CD45+CD33+CD13+CD14−CD15− phenotype was increased from 15.6 ± 2.6 to 30.83 ± 1.595% (P = 0.015; Figure 3A).
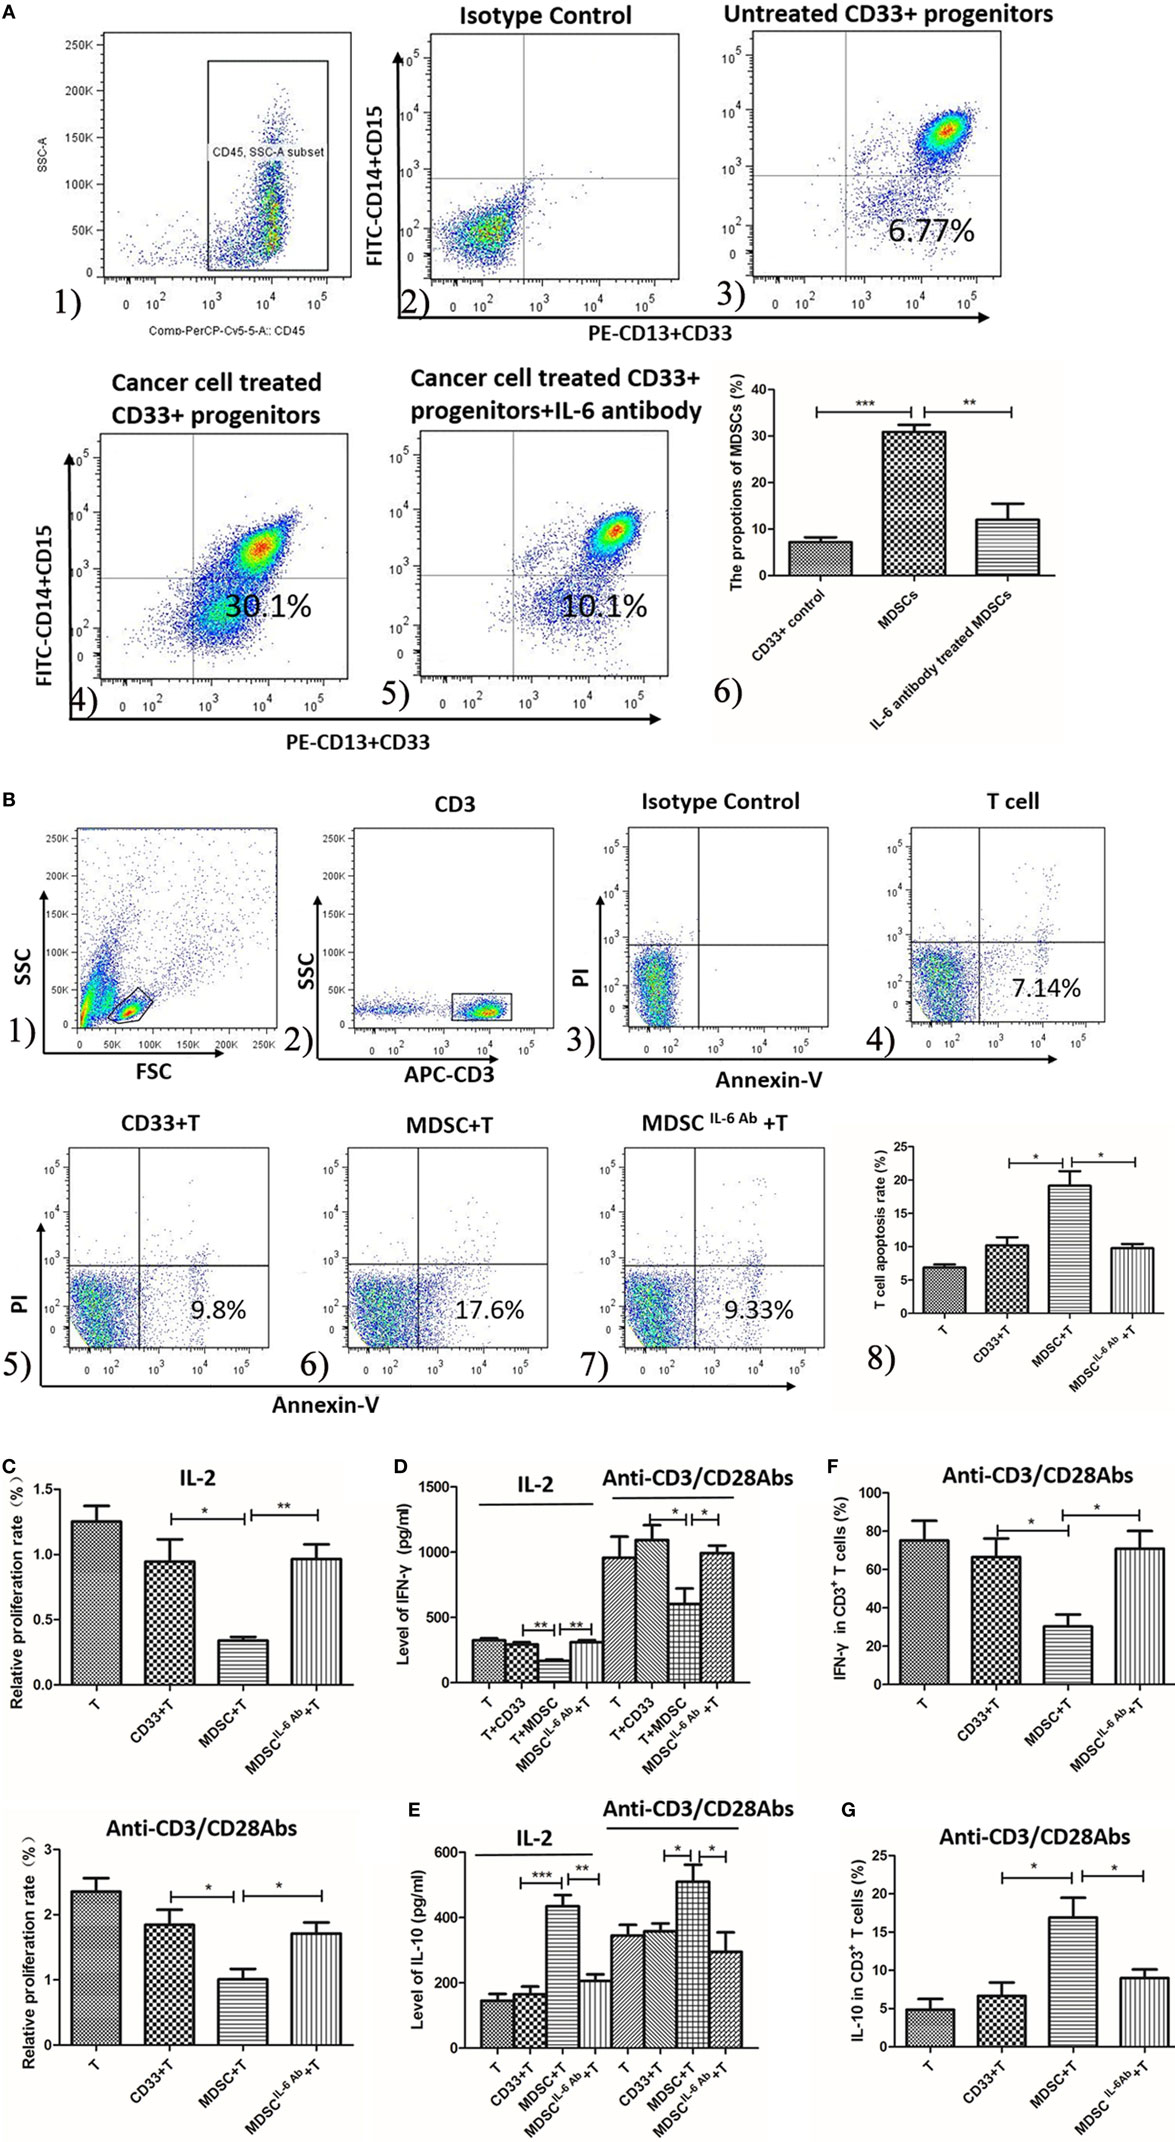
Figure 3. Interleukin-6 (IL-6) enhanced the generation and T cells immunosuppressive ability of myeloid-derived suppressor cells (MDSCs) in vitro. (A) The proportion of healthy people’s untreated CD33+ myeloid progenitors and the treated CD33+ cells was compared using flow cytometry method. Cells in Q4 represent MDSCs. (1) The subpopulation was gated using anti-CD45 mAb; (2) isotype control was used; (3) the proportion range of CD33+ was 15.6 ± 2.6%; (4) when treated with cancer cells the proportion of MDSCs was highly increased which was 30.83 ± 1.595%; (5) an IL-6 neutralizing antibody was added to the cancer-conditioned MDSCs culture and MDSCs decreased to 11.98 ± 3.479%; (6) the result of statistical analysis (n = 6). The effects of MDSCs and CD33+ cells on T cell proliferation, apoptosis and cytokine secretion were examined (B–E). (B) T cells stimulated with 1,000 IU/ml IL-2 were co-cultured with CD33+ control cells or MDSCs at ratio of 1:3 for detecting apoptosis. T cells were gated using APC-labeled anti-CD3 mAb, and apoptotic cells were stained with FITC-labeled Annexin V. Cells in Q4 represent apoptotic T cells. (1) The lymphocytes were gated according to SSC and FSC features; (2) CD3 mAb labeled T cells; (3) isotype control; (4) T cells only; (5) CD33+ controls stimulated T cells; (6) MDSCs stimulated T cells; (7) T cells were co-cultured with MDSCs in the presence of IL-6 antibody; (8) Summary of (4–7) MDSCs stimulated greater T cell apoptosis compared to in CD33+ controls. In addition, the IL-6 antibody dramatically abolished MDSCs-induced T cell apoptosis (n = 5). (C) The proliferation of T cells was detected using CCK8 method. Compared to in CD33+ controls, MDSCs significantly inhibited IL-2 or anti-CD3/CD28 Abs-induced proliferation of T cells at a ratio of 1:3, which was attenuated by IL-6 blocking antibody (n = 5). (D,E) Supernatants were collected for detecting interferon (IFN)-γ and IL-10 level using ELISA assay (n = 5). (D) MDSCs inhibited IL-2 or anti-CD3/CD28 Abs-induced IFN-γ secretion, which was increased after IL-6 antibody pretreatment. (E) In contrast, MDSCs stimulated IL-10 secretion in IL-2 or anti-CD3/CD28 Abs simulated T cells compared to in CD33+ controls, which was dropped significantly after IL-6 blocking. (F) Flow cytometry was used to detect IFN-γ expression by intracellular staining. The proportion of IFN-γ-positive T cells decreased after co-culture with MDSCs compared to in CD33+ controls, but MDSCs-mediated inhibition of IFN-γ production in T cells was reversed by blocking of IL-6 (n = 5). (G) In contrast, the percentages of IL-10-positive T cells increased after co-culture with MDSCs and blocking of IL-6 inhibited IL-10 production in T cells (n = 5). *P < 0.05, **P < 0.01, ***P < 0.001.
To determine whether IL-6 plays a major role in promoting MDSC differentiation in vitro, an IL-6 neutralizing antibody was added to the cancer-conditioned MDSC culture. The proportion of CD45+CD33+CD13+CD14−CD15− cells in IL-6-neutralizing antibody-treated MDSCs (Ab-treated MDSCs) was dramatically decreased compared to in untreated MDSCs (Ab-untreated MDSCs) [(11.98 ± 3.479%) vs. (30.83 ± 1.595%), P = 0.0007, Figure 3A]. These results indicate that breast cancer-induced IL-6 secretion significantly promotes the differentiation and accumulation of MDSCs in vitro.
To examine whether IL-6 regulates MDSCs-mediated immunosuppressive effects on T cells in vitro, we co-cultured both Ab-treated MDSCs and Ab-untreated MDSCs with T cells isolated from exogenous PMBCs and examined the proliferation, apoptosis, and cytokine production of T cells. MDSCs stimulated more apoptotic T cell compared to CD33+ controls [(19.17 ± 2.12%) vs. (10.28 ± 1.26%), P = 0.0240, Figure 3B]. In addition, the IL-6 antibody dramatically abolished MDSCs-induced T cell apoptosis [(9.797 ± 0.6411%) vs. (19.20 ± 2.13%), P = 0.0151, Figure 3B]. Accordingly, compared to CD33+ controls, MDSCs significantly inhibited IL-2-induced proliferation of T cells at a ratio of 1:3 (0.9452 ± 0.1721 vs. 0.3410 ± 0.02694, P = 0.0256, Figure 3C). The IL-6-blocking antibody fully reversed MDSCs-mediated inhibition on T cell proliferation (0.9655 ± 0.1131, P = 0.0058, Figure 3C). Similarly, anti-CD3/CD28 Abs-induced T cell proliferation was significantly inhibited by MDSCs (P = 0.0416), and the IL-6-blocking antibody reversed MDSCs-mediated inhibition on anti-CD3/CD28 Abs-induced T cell proliferation (P = 0.0404, Figure 3C).
Finally, we evaluated whether IL-6 modulates MDSCs-mediated suppression of cytokine secretion in T cells. IFN-γ secretion in IL-2-stimulated T cells was inhibited by MDSCs from 293.7 ± 17.47 to 168.6 ± 9.498 pg/mL (P < 0.01, Figure 3D). However, IL-6 blocking antibody eliminated MDSCs-mediated suppression on IFN-γ secretion, which increased to 310.0 ± 15.57 pg/mL (P = 0.0015, Figure 3D) after IL-6 antibody pretreatment. Consistently, anti-CD3/CD28 Abs-induced IFN-γ secretion of T cells was suppressed (1,094 ± 113.4 vs. 602.0 ± 120.5 pg/mL, P = 0.0410, Figure 3D) by MDSCs, but after IL-6 antibody pretreatment, the secretion of IFN-γ increased (992.8 ± 57.90 pg/mL, P = 0.0238, Figure 3D). In contrast, MDSCs stimulated more IL-10 secretion in IL-2-simulated T cells than CD33+ controls, which increased from 434.8 ± 34.52 to 165.4 ± 23.39 pg/mL (P < 0.001, Figure 3E). However, IL-6-blocking antibody eliminated MDSCs-mediated increase of IL-10, which significantly decreased to 205.7 ± 20.54 pg/mL (P = 0.0013, Figure 3E). Consistently, IL-10 secretion in anti-CD3/CD28 Abs-stimulated T cells was promoted by MDSCs compared to CD33+ controls (345.4 ± 35.68 vs. 509.8 ± 52.25 pg/mL, P = 0.0386, Figure 3E) and IL-6-blocking antibody eliminated MDSCs-mediated effect on IL-10 secretion (295.4 ± 59.25 pg/mL, P = 0.0349, Figure 3E).
Furthermore, we detected IFN-γ and IL-10 production in anti-CD3/CD28 Abs-stimulated T cells using an intracellular staining method. The results showed that the proportion of IFN-γ-positive T cells decreased after co-culture with MDSCs compared to CD33+ controls (72.40 ± 5.771 vs. 42.40 ± 8.965%, P = 0.0481, Figure 3F), but MDSCs-mediated inhibition of IFN-γ production in T cells was reversed by blocking IL-6 (73.20 ± 4.574%, P = 0.0376, Figure 3F). In contrast, the percentages of IL-10-positive T cells increased after co-culture with MDSCs (from 6.650 ± 1.751 to 16.91 ± 2.570%, P = 0.0299, Figure 3G) and blocking IL-6 inhibited IL-10 production in T cells (8.990 ± 1.123%, P = 0.0476, Figure 3G). These results indicate that MDSCs-induced immunosuppressive effects on T cells were IL-6-dependent and could be fully attenuated by blocking IL-6 signaling.
IL-6 Stimulated Sustained Activation of the JAK/STAT Pathway in MDSCs Displaying Persistent Phosphorylation of Downstream STAT Proteins
To elucidate the molecular mechanisms regulating IL-6-induced MDSC differentiation and immunosuppressive activities, we studied the activation status of the JAK/STAT pathway downstream of IL-6 signaling. We assessed the expression and phosphorylation of multiple functional proteins along the JAK/STAT pathway, such as JAK1, JAK2, TYK2, STAT1, and STAT3, using western blot assays. Comparable increases in phosphorylated JAK1, JAK2, TYK2, STAT1, and STAT3 proteins were detected in MDSCs as compared to that in CD33+ controls (Figure 4A). Furthermore, sustained phosphorylation of STAT1 and STAT3 proteins was observed in MDSCs, which was maintained for a longer time than in normal IL-6-stimulated PBMCs (2 vs. 4 h, Figure 4B). In IL-6 (100 ng/mL)-stimulated PBMCs, the levels of phosphorylated STAT1 and STAT3 proteins were increased at 30 min, but decreased at 2 h, disappearing entirely at 4 h (Figure 4B). In contrast, persistent IL-6-induced STAT1 and STAT3 phosphorylation in MDSCs lasted for more than 4 h. After adding an IL-6 blocking antibody, phosphorylation levels of the above proteins were reduced significantly in MDSCs, including p-JAK1 (1.059 ± 0.06000 vs. 0.8431 ± 0.03423, P = 0.0354), p-JAK2 (1.093 ± 0.03076 vs. 0.8486 ± 0.07076, P = 0.0340), p-TYK2 (0.9248 ± 0.08132 vs. 0.6939 ± 0.01329, P = 0.0487), p-STAT1 (1.056 ± 0.07766 vs. 0.8229 ± 0.02599, P = 0.0464), and p-STAT3 (1.074 ± 0.03318 vs. 0.8247 ± 0.04921, P = 0.0137, Figure 4C). These data indicate that enhanced phosphorylation of STAT proteins in MDSCs is IL-6-dependent, although additional factors along the JAK/STAT pathway can manipulate persistent IL-6-induced activation of both STAT1 and STAT3 proteins.
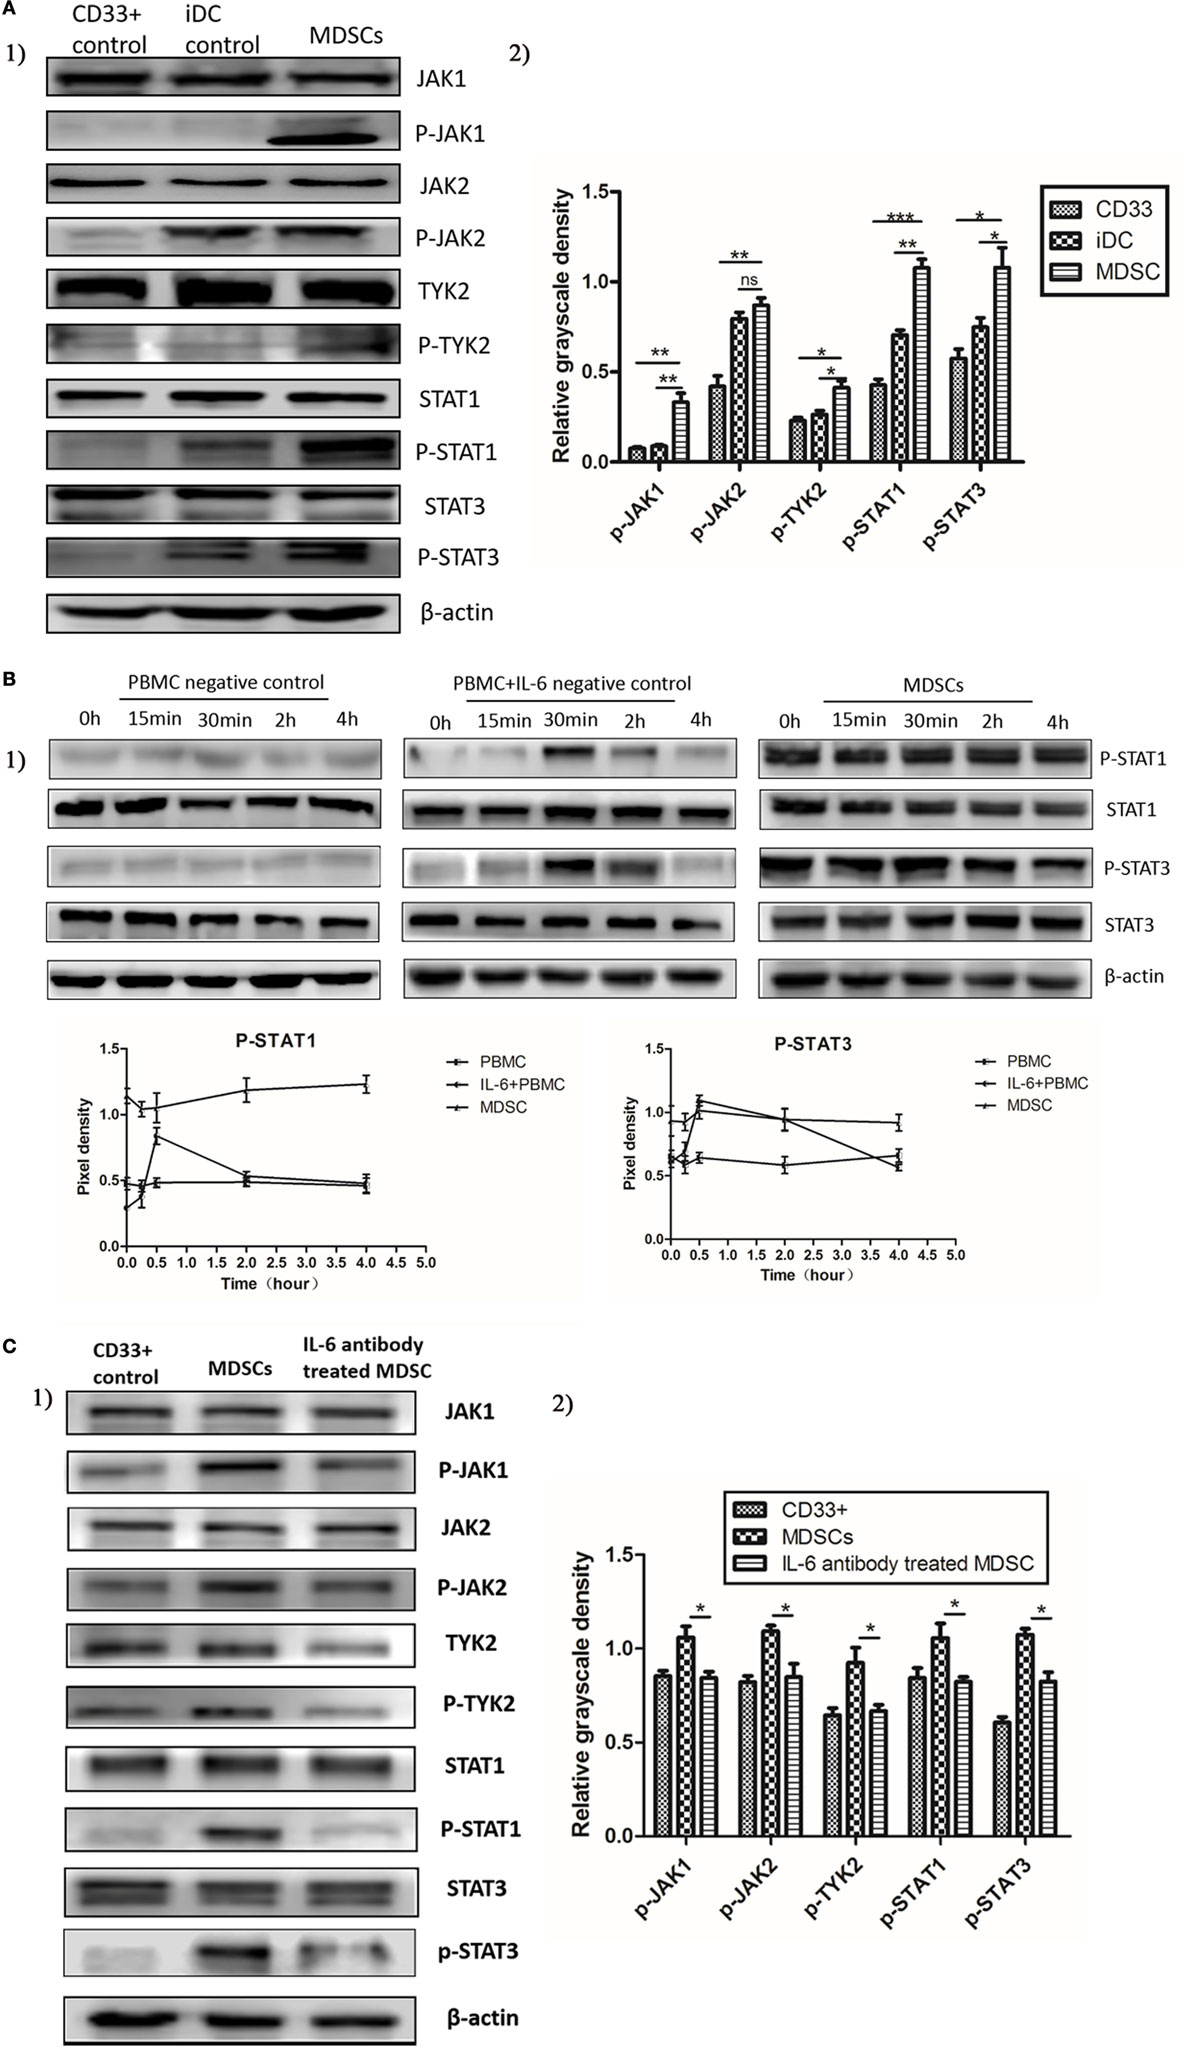
Figure 4. Interleukin-6 (IL-6) stimulated the sustained activation of the JAK/STAT pathway in myeloid-derived suppressor cells (MDSCs) displaying persistent phosphorylation of downstream STAT proteins. The activation status of the JAK/STAT pathway was measured using Western blot. (A) Comparable increases in phosphorylated JAK1, JAK2, TYK2, STAT1, and STAT3 proteins were detected in MDSCs as compared to in CD33+ controls (n = 3). (B) Furthermore, sustained phosphorylation of STAT1 and STAT3 proteins was observed in MDSCs, which was maintained for a longer time than in normal IL-6-stimulated PBMCs. In IL-6 (100 ng/mL)-stimulated PBMCs, the levels of phosphorylated STAT1 and STAT3 proteins were increased at 30 min, but decreased at 2 h, disappearing entirely at 4 h. In contrast, persistent IL-6-induced STAT1 and STAT3 phosphorylation in MDSCs lasted for more than 4 h (n = 3). (C) In contrast, persistent IL-6-induced STAT1 and STAT3 phosphorylation in MDSCs lasted for more than 4 h. After adding an IL-6-blocking antibody, phosphorylation levels of the above proteins were reduced significantly in MDSCs. They were compared using the density ratio of phosphorylated protein to total protein (n = 3). *P < 0.05, **P < 0.01, ***P < 0.001.
IL-6-Induced Suppression of SOCS3 in MDSCs Was Determined at both the mRNA and Protein Levels
Because the loss of SOCS proteins has been reported to induce continuous activation of the JAK/STAT pathway in malignancy, we compared the expression of SOCS1, SOCS2, and SOCS3 between MDSCs and normal myeloid controls at both the mRNA and protein levels. Primary MDSCs isolated from 20 cases of primary breast cancer tissues were studied. CD33+ and CD14+ cells from healthy donors were regarded as normal myeloid-derived cell controls. We first detected the mRNA levels of SOCS1–3 and found that mRNA level of SOCS1 increased in MDSCs compared to in both CD33+ (P = 0.006) and CD14+ (P = 0.003) controls; the mRNA level of SOCS3 significantly decreased in MDSCs compared to in CD33+ (P < 0.001) and CD14+ (P < 0.001, Figure 5A) controls. An undetectable level of SOCS2 mRNA was observed in both MDSCs and controls (Figure 5A). We then compared the mRNA levels of SOCS1–3 between MDSCs from IL-6high tissues (MDSCIL-6h) and MDSCs from IL-6low tissues (MDSCIL-6l). The results demonstrated that the mRNA level of SOCS1 increased in MDSCIL-6h (P = 0.0459), while the mRNA level of SOCS3 decreased in MDSCIL-6h compared to that in MDSCIL-6l (P = 0.0089, Figure 5B). Linear regression analysis demonstrated that IL-6 expression was not correlated with SOCS1 (R2 = 0.09071, P = 0.2102) but was negatively correlated with SOCS3 expression (R2 = 0.2205, P = 0.0367, Figure 5B).
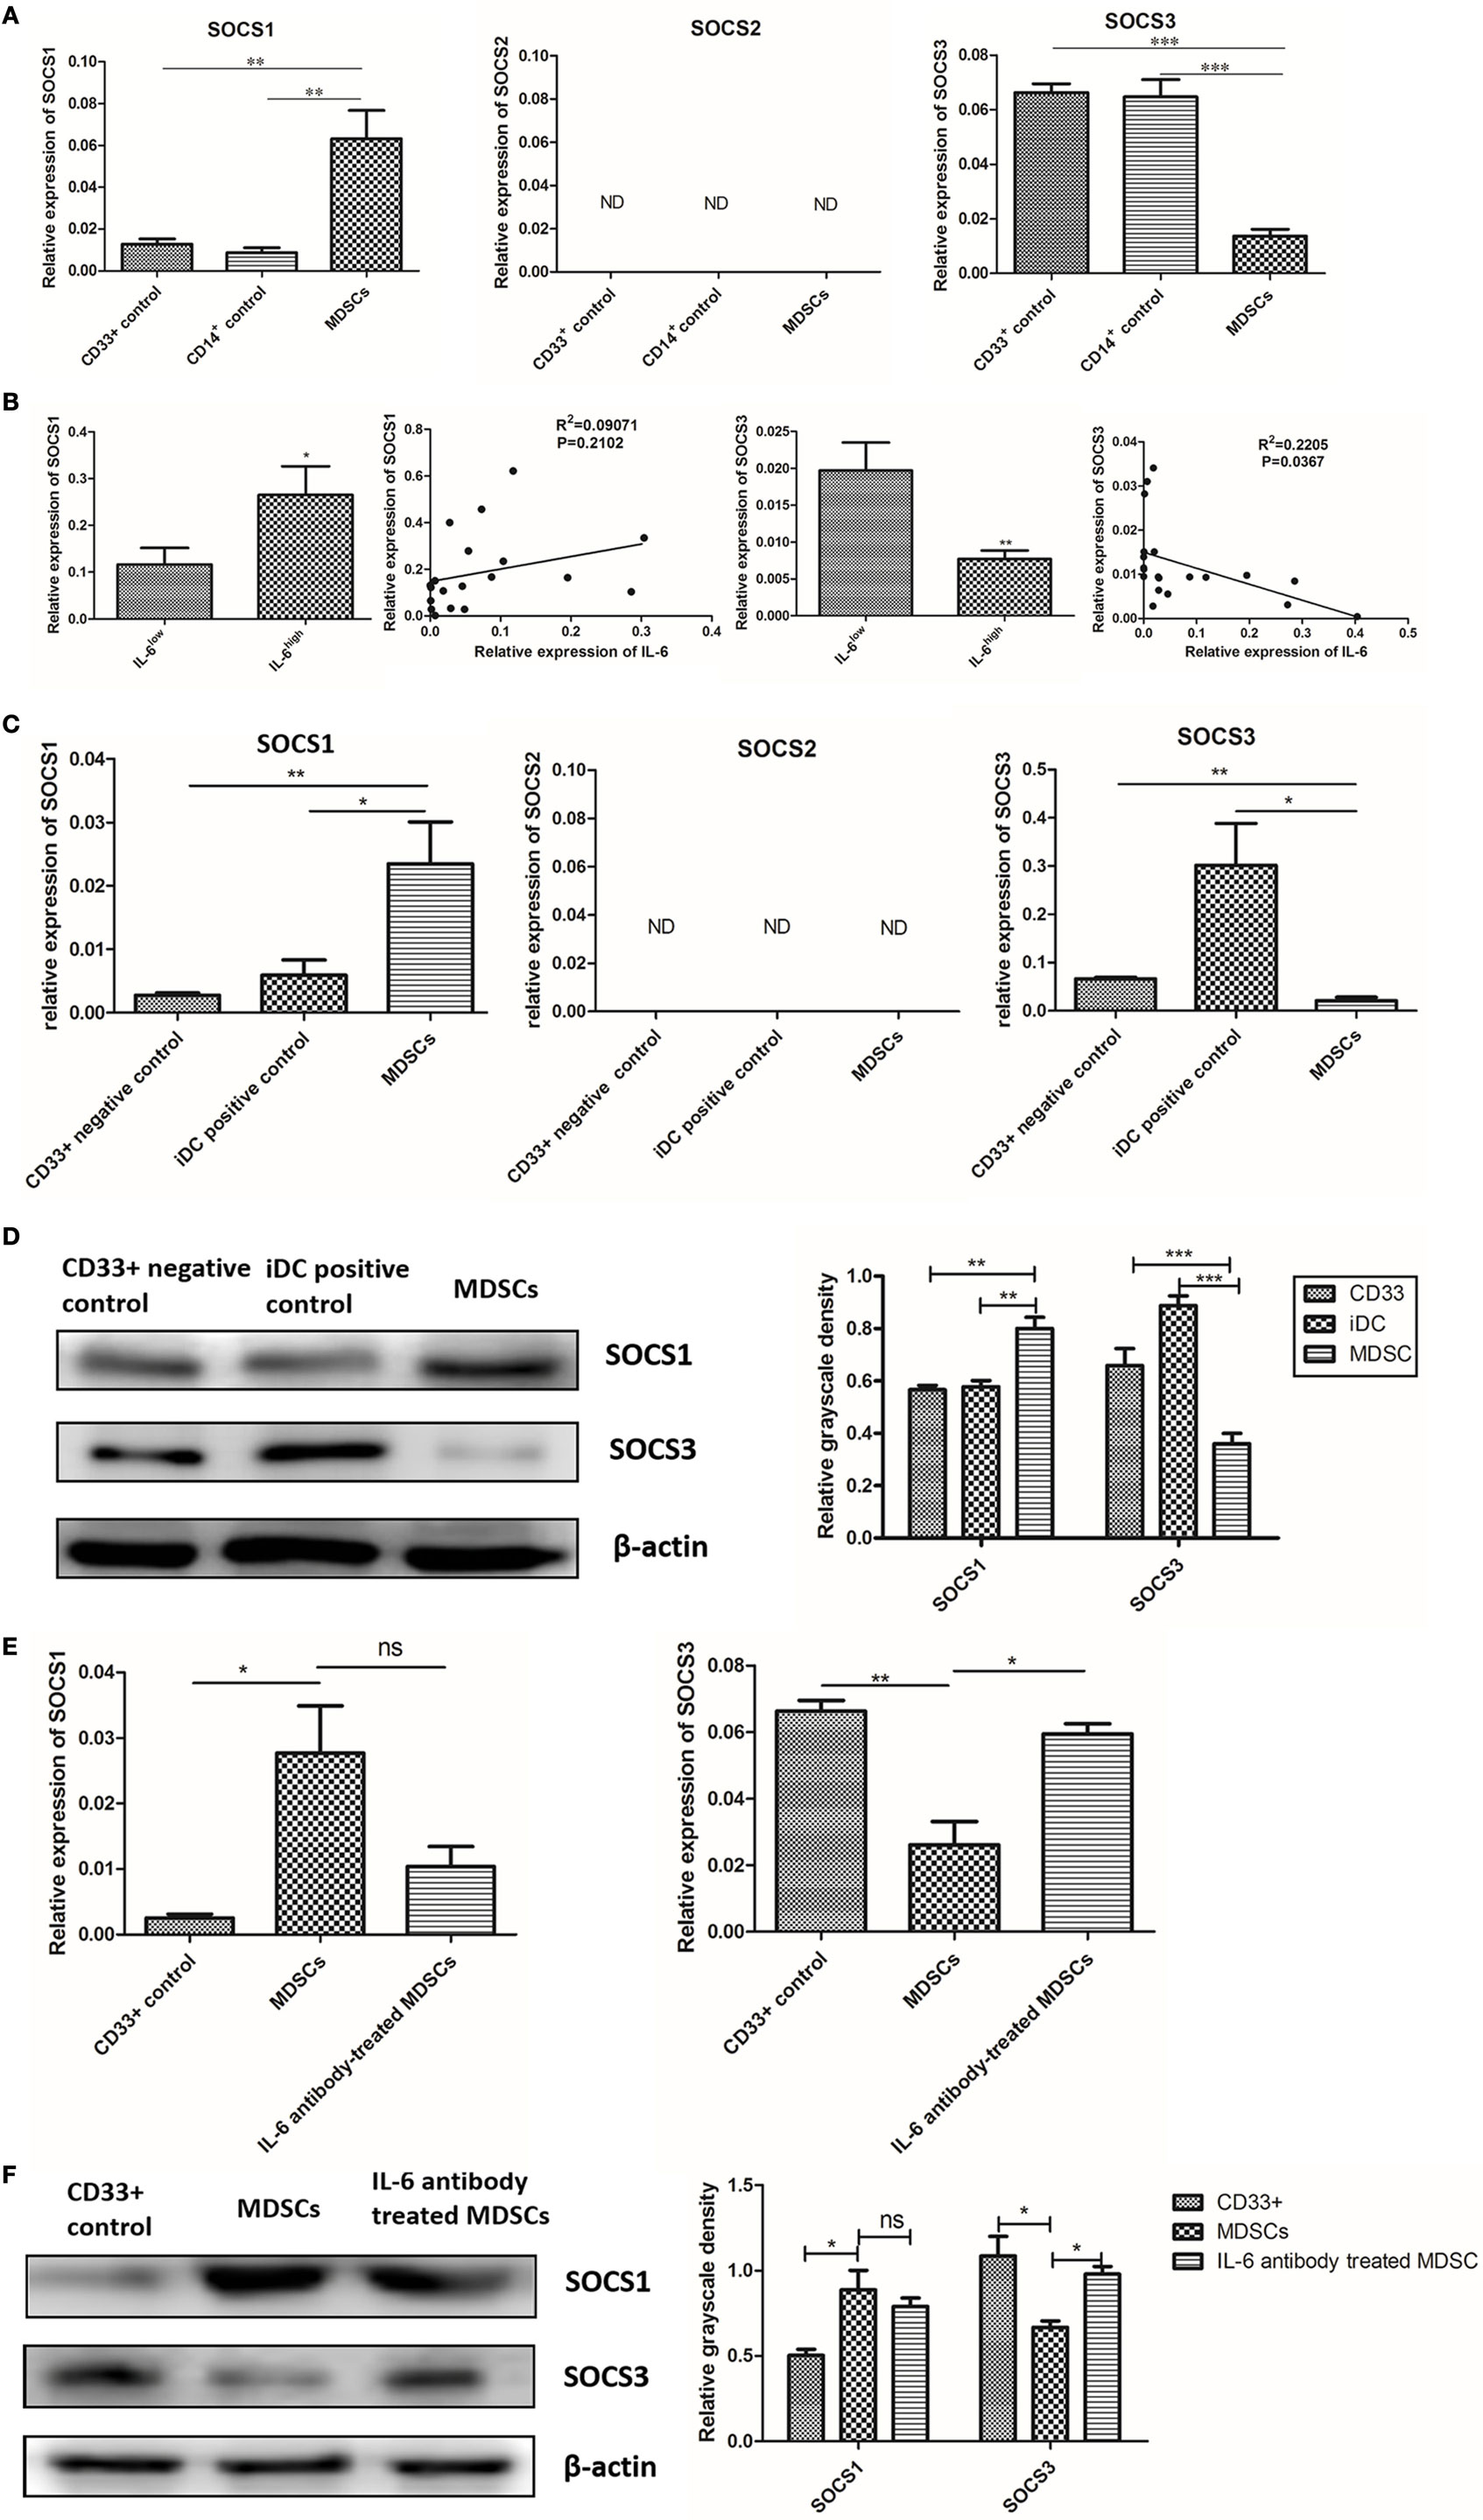
Figure 5. Interleukin-6 (IL-6)-induced suppression of suppressor of cytokine signaling 3 (SOCS3) in myeloid-derived suppressor cells (MDSCs) was determined at both the mRNA and protein levels. (A) RT-PCR result showed mRNA level of SOCS1 was increased and SOCS3 was significantly decreased in MDSCs compared to in both CD33+ and CD14+ controls; an undetectable level of SOCS2 mRNA was observed in both MDSCs and controls (n = 20). (B) The mRNA levels of SOCS1–3 between MDSCs from IL-6high tissues (MDSCIL-6h) and MDSCs from IL-6low tissues (MDSCIL-6l) were compared. The mRNA level of SOCS1 was increased in MDSCIL-6h (P = 0.0459), while the mRNA level of SOCS3 was decreased in MDSCIL-6h compared to in MDSCIL-6l (P = 0.0089). Linear regression analysis demonstrated that IL-6 expression was not correlated with SOCS1 (R2 = 0.09071, P = 0.2102), but demonstrated a significant negative correlation with SOCS3 expression (R2 = 0.2205, P = 0.0367) (n = 20). (C) Then, we detected mRNA levels of SOCS1–3 in induced MDSCs in vitro. The results were consistent with those observed in primary MDSCs, where the mRNA level of SOCS1 was increased, while that of SOCS3 was decreased in MDSCs compared to in the controls (n = 5). (D) The whole cellular lysates were collected for western blot analysis. SOCS1 protein was notably increased, but SOCS3 protein was dramatically decreased in MDSCs as compared with those in CD33+ negative controls and iDC positive controls (n = 5). (E) RT-PCR show that Ab-treated MDSCs displayed slightly decreased mRNA level in SOCS1 (P = 0.0917), but significantly higher mRNA levels in SOCS3 compared to in Ab-untreated MDSCs (P = 0.0117) (n = 5). (F) Consistent results were confirmed at the protein level (n = 5). *P < 0.05, **P < 0.01, ***P < 0.001.
We then detected the mRNA levels of SOCS1–3 in induced MDSCs in vitro. Untreated CD33+ myeloid progenitors were used as negative controls, while CD14+ monocyte-derived immature DCs (iDC) were used as positive controls. The results were consistent with those observed in primary MDSCs, where the mRNA level of SOCS1 increased, while that of SOCS3 decreased in induced MDSCs (Figure 5C). The disparity between SOCS1 and SOCS3 expression was confirmed at the protein level. The expression of SOCS1 protein notably increased, while that of SOCS3 protein dramatically decreased in MDSCs compared to CD33+ negative controls and iDC positive controls (Figure 5D).
To further verify the effect of IL-6 on SOCS3 expression, an IL-6-neutralizing antibody was added to block IL-6 signaling in MDSCs, and the synthesis and expression of SOCS was detected. Ab-treated MDSCs displayed slightly lower mRNA level of SOCS1 (P = 0.0917, Figure 5E), but significantly higher mRNA level of SOCS3 compared to that in Ab-untreated MDSCs (P = 0.0117, Figure 5E). Consistent results were confirmed at the protein level (Figure 5F). Therefore, our study suggests that IL-6 induces inhibition of SOCS3 expression in MDSCs at both the mRNA and protein levels in vivo and vitro.
IL-6-Dependent SOCS3 Suppression and Sustained Activation of the JAK/STAT Pathway Was Correlated with CD126 Upregulation
The IL-6 signal is transduced as a result of the interaction between IL-6 and IL-6R, which includes 2 subunits, CD126 and gp130 (8). We analyzed the expression of CD126 and gp130 in primary MDSCs and found that the mRNA levels of CD126 and gp130 in primary MDSCs were higher than those in CD33+ and CD14+ controls (Figure 6A). Furthermore, the mRNA levels of CD126 and gp130 in primary MDSCsIL-6h were higher than those in MDSCsIL-6l (P = 0.010, Figure 6B). Linear regression analysis demonstrated that CD126, rather than gp130, was positively correlated with IL-6 levels (R2 = 0.6717, P < 0.0001, Figure 6B). Similarly, we examined expression of CD126 and gp130 in induced MDSCs, and found that these MDSCs exhibited higher mRNA levels of CD126 and gp130 than CD33+ controls (P = 0.0145, P = 0.0011, Figure 6C). Similar results were obtained at the protein level, in which CD126 expression was significantly enhanced, while gp130 showed no significant changes in the expression (Figure 6D).
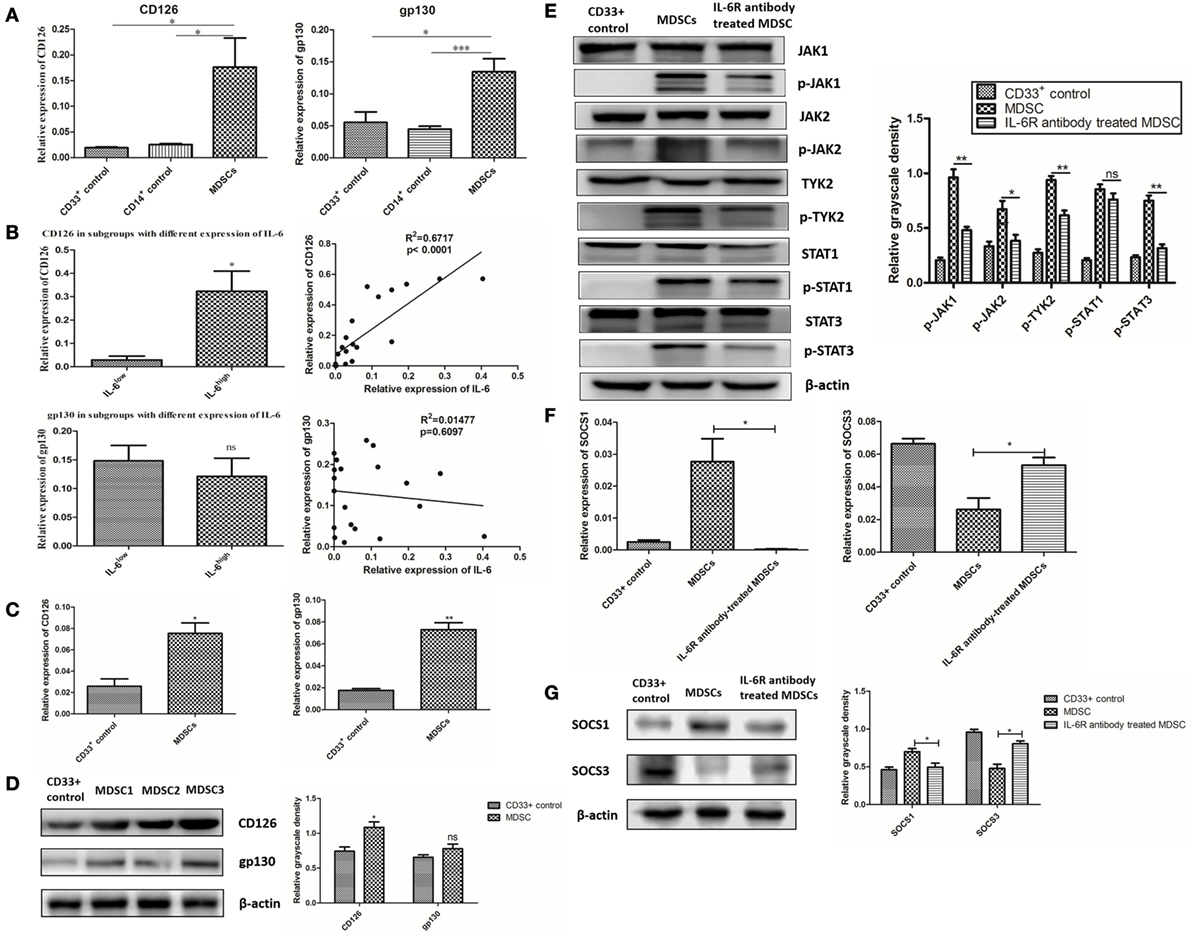
Figure 6. Interleukin-6 (IL-6)-dependent suppressor of cytokine signaling 3 (SOCS3) suppression and sustained activation of the JAK/STAT pathway was correlated with CD126 upregulation. (A) The relative expression of interest genes were indicated by 2−ΔCt(ΔCt = Cttarget gene − Ctβ-actin). We found the mRNA levels of CD126 and gp130 in primary myeloid-derived suppressor cells (MDSCs) were higher than those in CD33+ and CD14+ controls (n = 5). (B) The mRNA levels of CD126 and gp130 in primary MDSCsIL-6h were higher than those in MDSCsIL-6l. Linear regression analysis demonstrated that CD126, rather than gp130, was positively correlated with IL-6 levels (R2 = 0.6717, P < 0.0001) (n = 20). (C) The expressions of CD126 and gp130 in induced MDSCs were also examined. MDSCs exhibited higher mRNA levels of CD126 and gp130 compared to in CD33+ controls (n = 3). (D) Similar results were obtained at the protein level, in which CD126 expression was significantly increased, while gp130 showed no significant changes in the expression (n = 3). (E–G) IL-6R antibody was used to block IL-6 signal and the downstream signaling pathway. (E) Phosphorylation levels of JAK1, JAK2, TYK2, and STAT3 proteins decreased after the addition of the anti-IL-6R neutralizing antibody (n = 3). (F) The mRNA level of SOCS3 was increased, while the mRNA level of SOCS1 was decreased after blocking of CD126 (n = 3). (G) The expression of corresponding proteins in MDSCs displayed the same trend as that of mRNA after CD126 blocking. β-actin blots were used as protein loading controls (n = 3). *P < 0.05, **P < 0.01, ***P < 0.001.
An anti-IL-6R (CD126) neutralizing antibody was used to block the interaction between IL-6 and IL-6R in MDSCs to study the effect of elevated CD126 on the JAK/STAT pathway. Phosphorylation levels of JAK1, JAK2, TYK2, and STAT3 proteins decreased after the addition of the anti-IL-6R neutralizing antibody (Figure 6E). This result indicates that CD126 plays a significant role in IL-6-dependent activation of the JAK/STAT pathway. Furthermore, the mRNA level of SOCS3 increased, while the mRNA level of SOCS1 decreased after blocking CD126 (P = 0.0318, P = 0.0190, Figure 6F). The expression of corresponding proteins in MDSCs displayed the same trend as that of mRNA after CD126 blocking (Figure 6G). These results indicate that suppressed expression of SOCS3 is significantly correlated with CD126 upregulation, which induces long-term activation of the JAK/STAT pathway.
Soluble CD126-Mediated IL-6 Trans-Signaling Regulated IL-6 Dependent SOCS3 Suppression and Sustained Activation of the JAK/STAT Pathway in MDSCs
Signaling through membrane-bound and soluble IL-6R (CD126) is known as the cis- and trans-mediated signaling pathways, respectively (29). To investigate which type of CD126 mainly regulates IL-6-dependent activation of the JAK/STAT pathway, we measured the levels of membrane-bound and soluble CD126 in MDSCs. The results showed that MDSCs expressed lower levels of membrane-bound CD126 (7.667 ± 1.808 vs. 15.63 ± 1.200%, P = 0.0214, Figure 7A), but generated more soluble CD126 than those in CD33+ controls (249.1 ± 24.35 vs. 165.6 ± 21.83 pg/mL, P = 0.0236, Figure 7B). These results demonstrate that soluble CD126 is significantly increased in MDSCs and may play major roles in suppressing SOCS3 expression and activating the JAK/STAT pathway in MDSCs.
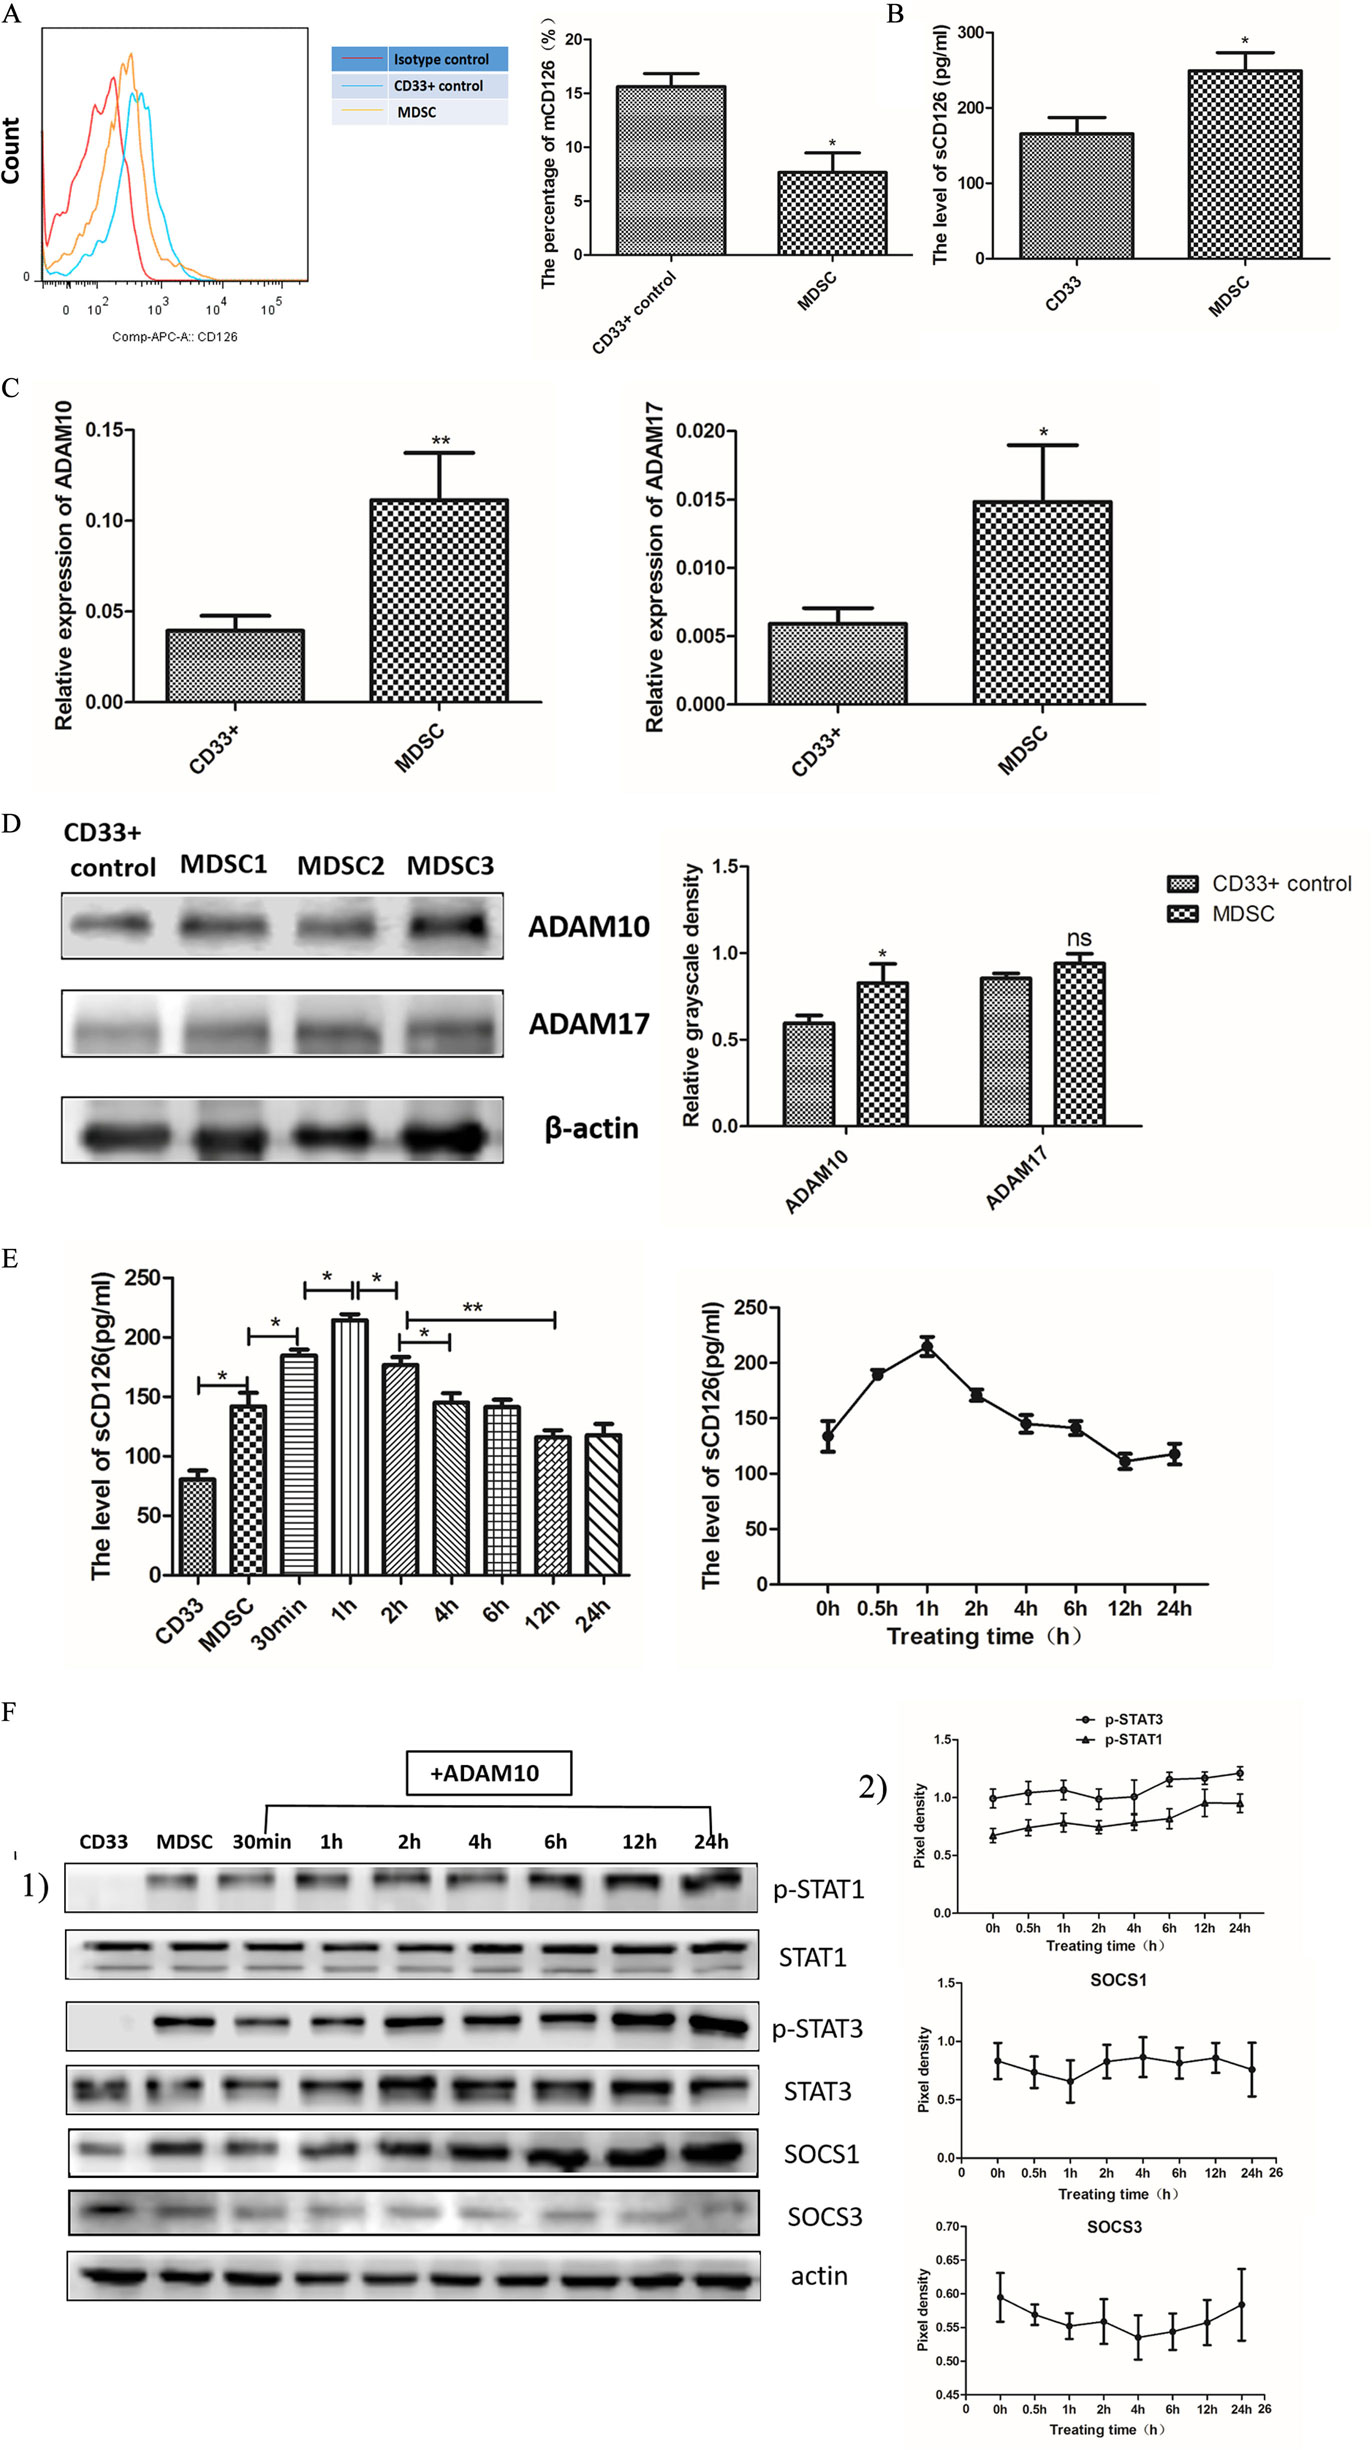
Figure 7. Soluble CD126-mediated interleukin-6 (IL-6) trans-signaling regulated IL-6 dependent suppressor of cytokine signaling 3 (SOCS3) suppression, and sustained activation of the JAK/STAT pathway in myeloid-derived suppressor cells (MDSCs). (A) Flow cytometry showed that MDSCs expressed lower levels of membrane-bound CD126 than those in CD33+ controls (n = 5). (B) The soluble CD126 secretion increased in MDSCs using Elisa assay method (n = 5). (C) RT-PCR method was used to detect ADAM10 and ADAM17 expression. The mRNA levels of ADAM10 and ADAM17 were clearly enhanced in MDSCs compared to in CD33+ controls (n = 3). (D) Protein expression of ADAM10, but not ADAM17, was significantly increased (n = 3). (E) MDSCs were then treated with exogenous recombinant ADAM10 protein, and the change in soluble CD126 at different time points was measured. The level of soluble CD126 in MDSCs was increased at 30 min and decreased to pre-treatment levels at 2 h (n = 3). [(F), 1] The activation of STAT and SOCS in MDSCs at different time points after adding exogenous ADAM10 were detected. We found that the levels of p-STAT1 and p-STAT3 proteins increased after ADAM10 treatment in MDSCs. A slight increase in SOCS1 and decrease in SOCS3 protein were also detected after adding ADAM10 in MDSCs. [(F), 2] Quantification of immunoblot density was performed by normalizing the density of each band to STAT1, STAT3 or β-actin (n = 3). *P < 0.05; **P < 0.01, ***P < 0.001.
To determine if soluble CD126 regulates SOCS3 expression and activation of the JAK/STAT pathway, we added ADAM proteases to the MDSC culture system in vitro. ADAM proteases, particularly ADAM10 and ADAM17, can induce shedding of membrane CD126 (30). We firstly detected the expression of ADAM10 and ADAM17 in MDSCs by RT-PCR and western blotting and found that the mRNA levels of ADAM10 and ADAM17 were clearly enhanced in MDSCs compared to those in CD33+ controls (P = 0.0064; P = 0.0297, Figure 7C). But at the protein level, exclusively ADAM10 rather than ADAM17 significantly increased (Figure 7D). We then treated MDSCs with exogenous recombinant ADAM10 protein and measured the levels of soluble CD126 at different time points. The level of soluble CD126 in MDSCs significantly increased at 30 min (184.7 ± 5.066 vs. 142.0 ± 11.50 pg/mL, P = 0.0273) and decreased to pre-treatment levels at 2 h (125.1 ± 9.050 pg/mL, Figure 7E).
We next detected the activation of STAT and SOCS in MDSCs at different time points after adding exogenous ADAM10. We found that the levels of phosphorylated STAT1 and STAT3 proteins increased after ADAM10 treatment in MDSCs (Figure 7F). A slight increase in SOCS1 and decrease in SOCS3 protein were also detected after adding ADAM10 in MDSCs (Figure 7F). These results revealed that ADAM10 promotes the suppression of SOCS3 expression and phosphorylation of STAT proteins in MDSCs. This indicates that IL-6 trans-signaling is predominately mediated by soluble CD126 to regulate IL-6-dependent SOCS3 suppression and sustained activation of the JAK/STAT pathway in MDSCs, as well as coordinates the differentiation and immunosuppressive activity of MDSCs in breast cancer.
Discussion
Multiple immunocytes recruited into the tumor microenvironment play pivotal roles in tumorigenesis (31). However, MDSCs represent a specific subset of heterogeneous immunosuppressive cells that enable cancer cells to escape immune surveillance and inhibit the host immune system attack on cancer cells (32). Bronte et al. recommended the characterization standards and nomenclature of MDSCs and indicated that MDSCs are often divided into two subtypes in humans: PMN-MDSCs and MO-MDSCs (5). In addition to these MDSCs subtypes, the eMDSC subtype is marked with Lin−HLA-DR−CD33+ and comprised of more immature progenitors than M-MDSCs and PMN-MDSCs (5). However, the MDSC subset is tumor-dependent. Previous studies of breast cancer examined MDSCs in mouse models rather than in humans because of the uncertainty of cell phenotypes and complicated regulatory mechanisms in human MDSCs (33–35). Determining the precise phenotype of breast cancer MDSCs in humans improves the understanding of the crosstalk between cancer cells and the microenvironment in the initiation and progression of breast cancer.
In our previous study, we identified a subset of poorly differentiated eMDSCs in breast cancer displaying potent suppression of T cells in vitro and vivo (6). As a pan-myeloid marker, CD33 is expressed earlier and more extensively in the myeloid lineage, and we found that CD33+HLA-DR− cells rather than CD14+HLA-DR− cells and CD11b+HLA-DR− cells were increased in patient blood samples compared to in healthy donor blood samples (6). We further detected the expression of a series of markers of myeloid linage, including HLA-DR, CD15, CD14, CD13, and CD11b. We confirmed low expression of HLA-DR and CD14, as well as negative expression of CD15 in breast cancer MDSCs. Additionally, both CD13 and CD11b expressed on breast cancer MDSCs, however, non-specific staining on the cancer cells, endothelial cells, and fibroblasts significantly interfered with the specific staining on MDSCs which were consistent with the previous reports (36, 37) (Figures S1B–C in Supplementary Material). Therefore, we defined the phenotype of CD45+CD13+CD33+CD14−CD15− to precisely distinguish breast cancer MDSCs.
In this study, we demonstrated the positive correlations between MDSCs in situ and numbers of metastatic lymph nodes, tumor volume, pathological stage, and histology grade. Furthermore, we confirmed the negative correlation between MDSCs and OS in breast cancer patients and found that patients with more MDSCs showed worse clinical outcomes. Similar findings were reported in other tumors, such as in digestive system malignant tumors (38), prostate cancer (39), and advanced melanoma (40). Our results indicate that MDSCs are unfavorable prognostic factors in breast cancer patients.
Numerous cytokines have been reported to recruit MDSCs in cancer tissues, such as IL-1β, IL-6, IL-4, macrophage colony-stimulating factor, and granulocyte macrophage colony-stimulating factor (3, 14, 32). Among these tumor-derived cytokines, IL-6 has been proposed to be an efficient MDSCs inducer in solid tumors, such as esophageal cancer, prostate cancer, and melanoma (9, 28, 41–43). Circulating CD11b+CD14+HLA−DR− cells were found to be significantly increased in esophageal cancer and were associated with circulating IL-6 levels (9). IL-6 induces MDSCs generation, and inhibition of IL-6 abrogates generation of MDSCs in tumor-bearing mice (13, 42). In this study, we evaluated the correlation between tumor-derived IL-6 and MDSC infiltration in 253 paraffin-embedded primary breast tissues and 20 fresh breast cancer tissues. We found that more MDSCs infiltrated IL-6 high-expressing cancer tissues, and that tumor-derived IL-6 displayed a strong positive correlation with the number of infiltrating MDSCs in situ at both the mRNA and protein levels. Furthermore, we demonstrated that tumor-derived IL-6 was essential for MDSCs amplification and function in vitro, including promoting T cells apoptosis, inhibiting T cell proliferation, decreasing IFN-γ secretion, and increasing IL-10 production. Therefore, determining the detailed molecular mechanisms that regulate IL-6-dependent recruitment and amplification of MDSCs in breast cancer may help screen for potential therapeutic targets to eradicate MDSCs and reverse MDSCs-mediated immune tolerance in breast cancer patients.
Interleukin-6 signals are transduced via the JAK/STAT signaling pathway in most cell types (44–46). Aberrant activation of the JAK/STAT signaling pathway in MDSCs has been reported in pancreatic cancer (15) and multiple myeloma (47). Physiologically, cytokine signal transduction can be switched off by SOCS proteins (48). Therefore, the activation of the JAK/STAT signaling pathway is rapid and reversible in normal cells. However, defects in SOCS expression frequently occur in malignant cells (16, 19), causing sustained phosphorylation of key proteins along the JAK/STAT signaling pathway (16, 17). In this study, we found that tumor-derived IL-6 triggers the differentiation and immunosuppressive activity of MDSCs. This was accompanied by sustained activation of the JAK/STAT signaling pathway, which led to phosphorylation of the STAT1, STAT3, JAK1, JAK2, and TYK2 proteins. Furthermore, the activation of the JAK/STAT signaling pathway in MDSCs was persistent, and lasted longer than that in normal myeloid controls. Accordingly, significant suppression of SOCS3 at both the RNA and protein levels was observed in MDSCs. Therefore, significant defects in the SOCS feedback loop may participate in the regulation of IL-6-dependent, sustained activation of the JAK/STAT signaling pathway in MDSCs.
The SOCS protein family consists of SOCS1–7 and CIS, which are divided into three subgroups: CIS and SOCS1–3, SOCS4/5, and SOCS6/7. CIS and SOCS1–3 are associated with the control of cytokine signaling, whereas the SOCS4–7 subgroup regulates the growth factor-induced receptor tyrosine kinase signaling (19). As reported previously, the expression of SOCS proteins is rapidly upregulated by IL-6, among which SOCS3 is the most important, and in turn, inhibits IL-6 cytokine signaling (48, 49). Numerous reports showed that SOCS3 defects are responsible for sustained IL-6/STAT3 signaling in human cancers (16, 50, 51). However, few studies have examined the expression of SOCS3 in immune cells. SOCS3 can also regulate the activation and differentiation of naïve CD4+ T cells, preferentially by promoting Th2 and inhibiting Th1 differentiation (52). In addition, SOCS3 can regulate the activation of DCs and polarization of macrophages (53, 54). Regarding MDSCs, recent studies demonstrated that SOCS3 negatively regulates the development and function of MDSCs via inhibition of STAT3 activation in prostate cancer (25). SOCS3-deficient mice showed elevated Gr-1+CD11b+ MDSCs in tumors and exhibited heightened STAT3 activation (25). Consistent with the above results, we found that SOCS3 was significantly decreased in primary breast cancer MDSCs and induced MDSCs and was significantly correlated with sustained activation of the JAK/STAT signaling pathway and enhanced T cells immunosuppression in MDSCs. Furthermore, in a co-culture system in vitro, we demonstrated that suppressed expression of SOCS3 was initiated by IL-6. This explains the phenomenon observed in our previous study, which showed that cancer-derived IL-6-induced T cell suppression in primary MDSCs by activating STAT3-dependent, nuclear factor-κB-mediated long-term IDO overexpression (7). Thus, SOCS3 defects may be the main cause of IL-6-induced persistent activation of the JAK/STAT signaling pathway and consequent enhanced differentiation and immunosuppressive activity of MDSCs.
Interestingly, in this study, we also found synchronous yet opposing changes in SOCS1 and SOCS3 expression at both the mRNA and protein levels. In contrast to SOCS3, SOCS1 expression was dramatically increased by IL-6-dependent sustained activation of the JAK/STAT signaling pathway in MDSCs. Both SOCS1 and SOCS3 have been demonstrated to inhibit phosphorylation of gp130, STATs, and JAK proteins along the JAK/STAT signaling pathway (48, 49). However, for IFN-α and IFN-γ secretion, SOCS1 is not as efficient as SOCS3 in inhibiting IL-6-dependent activation of the JAK/STAT signaling pathway (55). SOCS3 is associated with specific phosphotyrosine motifs within the activated IL-6 receptor gp130 (56–58), which directly inhibit the catalytic domains of JAK1, JAK2, and TYK2 (59). This may explain the relative specificity of SOCS3 in inhibiting IL-6 pathways. Therefore, the increase in SOCS1 may be a consequence of sustained IL-6 stimulation, which is consistent with the results of other studies (60, 61).
We further demonstrated that IL-6-induced inhibition of SOCS3 and activation of the JAK/STAT pathway was correlated with the elevated expression of CD126 via the IL-6 trans-signaling pathway. The IL-6 signaling complex assembly is composed of IL-6, CD126, and the shared signaling receptor gp130. CD126 exists in two forms, membrane-bound and soluble CD126. IL-6 signal transduction via membrane-bound CD126 is known as the cis-signaling pathway, while signal transduction via soluble CD126 is known as the trans-signaling pathway (8). The IL-6 cis-signaling pathway is mainly limited to hepatocytes, megakaryocytes, neutrophils, and certain T cell subsets (62). In contrast, the IL-6 trans-signaling pathway can potentially stimulate all types of cells that do not express membrane-bound IL-6R. During IL-6 trans-signaling, the soluble form of CD126 is generated either by alternative splicing or shedding of membrane-bound IL-6R, which is mediated by the metalloproteases ADAM10 and ADAM17 (29, 62, 63).
Previous studies of breast cancer indicated that MDSCs express ADAM-family proteases and IL-6Rα, which contribute to breast cancer cell invasiveness and distant metastasis through the IL-6 trans-signaling pathway in murine models (10). In our study, we compared the expression of IL-6R in MDSCs and found that both CD126 and gp130 were increased in MDSCs. However, while the soluble form of CD126 was increased, membrane-bound CD126 was decreased. Importantly, we reported that MDSCs express higher levels of ADAM10 as compared to that in CD33+ controls. These results indicate that a higher level of soluble CD126 in MDSCs may be derived from enhanced shedding of membrane-bound IL-6R by ADAM10. To verify the effect of ADAM10, we added exogenous ADAM10 to increase the level of soluble CD126. This resulted in enhanced suppression of SOCS3 and phosphorylation of STAT1 and STAT3 in MDSCs. Although a previous study demonstrated that reduced expression of membrane-bound CD126 may result in impaired IL-6 classic signaling, followed by decreased phosphorylation of STAT3 and STAT1 (64), our results indicated that soluble CD126-mediated IL-6 trans-signaling pathway is sufficient for IL-6 signal transduction in MDSCs. Downstream effects include persistent activation of the JAK/STAT pathway and generation of more immunosuppressive MDSCs via suppression of SOCS3.
Taken together, this study provides insight into the cross-talk between breast cancer cells and regulatory immunocytes in local microenvironments. In breast cancer, tumor-derived IL-6 predominantly modulates the differentiation and immunosuppressive ability of MDSCs at both the tissue and cellular levels in which the soluble CD126-mediated IL-6 trans-signaling pathway and SOCS3 suppression are the most crucial molecular events orchestrating IL-6-dependent sustained activation of the JAK/STAT pathway in breast cancer MDSCs. Therefore, blocking the IL-6 signaling pathway is a promising therapeutic strategy for eliminating and inhibiting MDSCs, as well as reversing MDSCs-mediated immune escape in breast cancer.
Ethics Statement
This study was approved by the Medical Ethics Committee of Tianjin Medical University. All experiments were performed in accordance with the principles of the Declaration of Helsinki. Written consents were obtained from all patients and healthy donors.
Author Contributions
MJ performed the research, data analyses, and wrote the manuscript. JC and RZ performed parts of the research and commented on manuscript. WZ, YY, PL, and WY performed parts of the research and data analyses. FW and XR contributed clinical information and samples for the study. JY designed the study and commented on manuscript.
Conflict of Interest Statement
The authors declare that the research was conducted in the absence of any commercial or financial relationships that could be construed as a potential conflict of interest.
Acknowledgments
The authors thank the efforts of Dr. Shixia Li of Department of Preventive Health Center enrollment of sample donors, as well as Dr. Juntian Liu of Department of Breast Oncology provided tumor tissues and corresponding clinical data. The authors also thank professors Xinmin Li and Weijia Zhang provided the constructive opinions for our manuscript.
Funding
This study was supported by National Natural Science Foundation of China (81472473, 81272360), National Key Scientific and Technological Project of China (No. 2015BAI12B12, No. 2015BAI12B15), and Scientific and Technological Project of Tianjin, China (No. 13ZCZCSY20300).
Supplementary Material
The Supplementary Material for this article can be found online at http://www.frontiersin.org/articles/10.3389/fimmu.2017.01840/full#supplementary-material.
References
1. Tahmasebi Birgani M, Carloni V. Tumor microenvironment, a paradigm in hepatocellular carcinoma progression and therapy. Int J Mol Sci (2017) 18(2):E405. doi:10.3390/ijms18020405
2. Velaei K, Samadi N, Barazvan B, Soleimani Rad J. Tumor microenvironment-mediated chemoresistance in breast cancer. Breast (2016) 30:92–100. doi:10.1016/j.breast.2016.09.002
3. Parker KH, Beury DW, Ostrand-Rosenberg S. Myeloid-derived suppressor cells: critical cells driving immune suppression in the tumor microenvironment. Adv Cancer Res (2015) 128:95–139. doi:10.1016/bs.acr.2015.04.002
4. Shou D, Wen L, Song Z, Yin J, Sun Q, Gong W. Suppressive role of myeloid-derived suppressor cells (MDSCs) in the microenvironment of breast cancer and targeted immunotherapies. Oncotarget (2016) 7(39):64505–11. doi:10.18632/oncotarget.11352
5. Bronte V, Brandau S, Chen SH, Colombo MP, Frey AB, Greten TF, et al. Recommendations for myeloid-derived suppressor cell nomenclature and characterization standards. Nat Commun (2016) 7:12150. doi:10.1038/ncomms12150
6. Yu J, Du W, Yan F, Wang Y, Li H, Cao S, et al. Myeloid-derived suppressor cells suppress antitumor immune responses through IDO expression and correlate with lymph node metastasis in patients with breast cancer. J Immunol (2013) 190(7):3783–97. doi:10.4049/jimmunol.1201449
7. YYu J, Wang Y, Yan F, Zhang P, Li H, Zhao H, et al. Noncanonical NF-κB activation mediates STAT3-stimulated IDO upregulation in myeloid-derived suppressor cells in breast cancer. J Immunol (2014) 193(5):2574–86. doi:10.4049/jimmunol.1400833
8. Yao X, Huang J, Zhong H, Shen N, Faggioni R, Fung M, et al. Targeting interleukin-6 in inflammatory autoimmune diseases and cancers. Pharmacol Ther (2014) 141(2):125–39. doi:10.1016/j.pharmthera.2013.09.004
9. Chen MF, Kuan FC, Yen TC, Lu MS, Lin PY, Chung YH, et al. IL-6-stimulated CD11b(+)CD14(+)HLA-DR(−) myeloid-derived suppressor cells, are associated with progression and poor prognosis in squamous cell carcinoma of the esophagus. Oncotarget (2014) 5(18):8716–28. doi:10.18632/oncotarget.2368
10. Oh K, Lee OY, Shon SY, Nam O, Ryu PM, Seo MW, et al. A mutual activation loop between breast cancer cells and myeloid-derived suppressor cells facilitates spontaneous metastasis through IL-6 trans-signaling in a murine model. Breast Cancer Res (2013) 15(5):R79. doi:10.1186/bcr3473
11. Liu Q, Tan Q, Zheng Y, Chen K, Qian C, Li N, et al. Blockade of Fas signaling in breast cancer cells suppresses tumor growth and metastasis via disruption of Fas signaling-initiated cancer-related inflammation. J Biol Chem (2014) 289(16):11522–35. doi:10.1074/jbc.M113.525014
12. Lee BR, Kwon BE, Hong EH, Shim A, Song JH, Kim HM, et al. Interleukin-10 attenuates tumour growth by inhibiting interleukin-6/signal transducer and activator of transcription 3 signalling in myeloid-derived suppressor cells. Cancer Lett (2016) 381(1):156–64. doi:10.1016/j.canlet.2016.07.012
13. Wu CT, Hsieh CC, Lin CC, Chen WC, Hong JH, Chen MF. Significance of IL-6 in the transition of hormone-resistant prostate cancer and the induction of myeloid-derived suppressor cells. J Mol Med (Berl) (2012) 90(11):1343–55. doi:10.1007/s00109-012-0916-x
14. Bunt SK, Yang L, Sinha P, Clements VK, Leips J, Ostrand-Rosenberg S. Reduced inflammation in the tumor microenvironment delays the accumulation of myeloid-derived suppressor cells and limits tumor progression. Cancer Res (2007) 67(20):10019–26. doi:10.1158/0008-5472.CAN-07-2354
15. Mace TA, Ameen Z, Collins A, Wojcik S, Mair M, Young GS, et al. Pancreatic cancer-associated stellate cells promote differentiation of myeloid-derived suppressor cells in a STAT3-dependent manner. Cancer Res (2013) 73(10):3007–18. doi:10.1158/0008-5472.CAN-12-4601
16. Isomoto H, Mott JL, Kobayashi S, Werneburg NW, Bronk SF, Haan S, et al. Sustained IL-6/STAT-3 signaling in cholangiocarcinoma cells due to SOCS-3 epigenetic silencing. Gastroenterology (2007) 132(1):384–96. doi:10.1053/j.gastro.2006.10.037
17. Babon JJ, Varghese LN, Nicola NA. Inhibition of IL-6 family cytokines by SOCS3. Semin Immunol (2014) 26(1):13–9. doi:10.1016/j.smim.2013.12.004
18. Haura EB, Turkson J, Jove R. Mechanisms of disease: insights into the emerging role of signal transducers and activators of transcription in cancer. Nat Clin Pract Oncol (2005) 2(6):315–24. doi:10.1038/ncponc0195
19. Jiang M, Zhang WW, Liu P, Yu W, Liu T, Yu J. Dysregulation of SOCS-mediated negative feedback of cytokine signaling in carcinogenesis and its significance in cancer treatment. Front Immunol (2017) 8:70. doi:10.3389/fimmu.2017.00070
20. Heinrich PC, Behrmann I, Haan S, Hermanns HM, Müller-Newen G, Schaper F. Principles of interleukin (IL)-6-type cytokine signalling and its regulation. Biochem J (2003) 374(Pt 1):1–20. doi:10.1042/bj20030407
21. Croker BA, Krebs DL, Zhang JG, Wormald S, Willson TA, Stanley EG, et al. SOCS3 negatively regulates IL-6 signaling in vivo. Nat Immunol (2003) 4(6):540–5. doi:10.1038/ni931
22. Shen L, Evel-Kabler K, Strube R, Chen SY. Silencing of SOCS1 enhances antigen presentation by dendritic cells and antigen-specific anti-tumor immunity. Nat Biotechnol (2004) 22(12):1546–53. doi:10.1038/nbt1035
23. Yoshimura A, Suzuki M, Sakaguchi R, Hanada T, Yasukawa H. SOCS, inflammation, and autoimmunity. Front Immunol (2012) 3:20. doi:10.3389/fimmu.2012.00020
24. Hiwatashi K, Tamiya T, Hasegawa E, Fukaya T, Hashimoto M, Kakoi K, et al. Suppression of SOCS3 in macrophages prevents cancer metastasis by modifying macrophage phase and MCP2/CCL8 induction. Cancer Lett (2011) 308(2):172–80. doi:10.1016/j.canlet.2011.04.024
25. Yu H, Liu Y, McFarland BC, Deshane JS, Hurst DR, Ponnazhagan S, et al. SOCS3 deficiency in myeloid cells promotes tumor development: involvement of STAT3 activation and myeloid-derived suppressor cells. Cancer Immunol Res (2015) 3(7):727–40. doi:10.1158/2326-6066.CIR-15-0004
26. Szeberényi JB, Rothe G, Pállinger E, Orsó E, Falus A, Schmitz G. Multi-color analysis of monocyte and dendritic cell precursor heterogeneity in whole blood. Immunobiology (2000) 202(1):51–8. doi:10.1016/S0171-2985(00)80052-2
27. Creutzig U, Harbott J, Sperling C, Ritter J, Zimmermann M, Löffler H, et al. Clinical significance of surface antigen expression in children with acute myeloid leukemia: results of study AML-BFM-87. Blood (1995) 86(8):3097–108.
28. Gabrilovich DI, Ostrand-Rosenberg S, Bronte V. Coordinated regulation of myeloid cells by tumours. Nat Rev Immunol (2012) 12(4):253–68. doi:10.1038/nri3175
29. Lacroix M, Rousseau F, Guilhot F, Malinge P, Magistrelli G, Herren S, et al. Novel insights into interleukin 6 (IL-6) Cis- and trans-signaling pathways by differentially manipulating the assembly of the IL-6 signaling complex. J Biol Chem (2015) 290(45):26943–53. doi:10.1074/jbc.M115.682138
30. Arnold P, Boll I, Rothaug M, Schumacher N, Schmidt F, Wichert R, et al. Meprin metalloproteases generate biologically active soluble interleukin-6 receptor to induce trans-signaling. Sci Rep (2017) 7:44053. doi:10.1038/srep44053
31. Coussens LM, Werb Z. Inflammation and cancer. Nature (2002) 420(6917):860–7. doi:10.1038/nature01322
32. Zhao Y, Wu T, Shao S, Shi B, Zhao Y. Phenotype, development, and biological function of myeloid-derived suppressor cells. Oncoimmunology (2015) 5(2):e1004983. doi:10.1080/2162402X.2015.1004983
33. Sinha P, Clements VK, Bunt SK, Albelda SM, Ostrand-Rosenberg S. Cross-talk between myeloid-derived suppressor cells and macrophages subverts tumor immunity toward a type 2 response. J Immunol (2007) 179(2):977–83. doi:10.4049/jimmunol.179.2.977
34. Yang L, Huang J, Ren X, Gorska AE, Chytil A, Aakre M, et al. Abrogation of TGFβ signaling in mammary carcinomas recruits Gr-1+CD11b+ myeloid cells that promote metastasis. Cancer Cell (2008) 13(1):23–35. doi:10.1016/j.ccr.2007.12.004
35. Ozao-Choy J, Ma G, Kao J, Wang GX, Meseck M, Sung M, et al. The novel role of tyrosine kinase inhibitor in the reversal of immune suppression and modulation of tumor microenvironment for immune-based cancer therapies. Cancer Res (2009) 69(6):2514–22. doi:10.1158/0008-5472.CAN-08-4709
36. Gunaydin G, Kesikli SA, Guc D. Cancer associated fibroblasts have phenotypic and functional characteristics similar to the fibrocytes that represent a novel MDSC subset. Oncoimmunology (2015) 4(9):e1034918. doi:10.1080/2162402X.2015.1034918
37. Di Matteo P, Arrigoni GL, Alberici L, Corti A, Gallo-Stampino C, Traversari C, et al. Enhanced expression of CD13 in vessels of inflammatory and neoplastic tissues. J Histochem Cytochem (2011) 59(1):47–59. doi:10.1369/jhc.2010.956644
38. Gabitass RF, Annels NE, Stocken DD, Pandha HA, Middleton GW. Elevated myeloid-derived suppressor cells in pancreatic, esophageal and gastric cancer are an independent prognostic factor and are associated with significant elevation of the Th2 cytokine interleukin-13. Cancer Immunol Immunother (2011) 60(10):1419–30. doi:10.1007/s00262-011-1028-0
39. Idorn M, Køllgaard T, Kongsted P, Sengeløv L, Thor Straten P. Correlation between frequencies of blood monocytic myeloid-derived suppressor cells, regulatory T cells and negative prognostic markers in patients with castration-resistant metastatic prostate cancer. Cancer Immunol Immunother (2014) 63(11):1177–87. doi:10.1007/s00262-014-1591-2
40. Weide B, Martens A, Zelba H, Stutz C, Derhovanessian E, Di Giacomo AM, et al. Myeloid-derived suppressor cells predict survival of patients with advanced melanoma: comparison with regulatory T cells and NY-ESO-1- or melan-A-specific T cells. Clin Cancer Res (2014) 20(6):1601–9. doi:10.1158/1078-0432.CCR-13-2508
41. Gabrilovich DI, Nagaraj S. Myeloid-derived suppressor cells as regulators of the immune system. Nat Rev Immunol (2009) 9(3):162–74. doi:10.1038/nri2506
42. Meyer C, Sevko A, Ramacher M, Bazhin AV, Falk CS, Osen W, et al. Chronic inflammation promotes myeloid-derived suppressor cell activation blocking antitumor immunity in transgenic mouse melanoma model. Proc Natl Acad Sci U S A (2011) 108(41):17111–6. doi:10.1073/pnas.1108121108
43. Youn JI, Kumar V, Collazo M, Nefedova Y, Condamine T, Cheng P, et al. Epigenetic silencing of retinoblastoma gene regulates pathologic differentiation of myeloid cells in cancer. Nat Immunol (2013) 14(3):211–20. doi:10.1038/ni.2526
44. Catlett-Falcone R, Landowski TH, Oshiro MM, Turkson J, Levitzki A, Savino R, et al. Constitutive activation of Stat3 signaling confers resistance to apoptosis in human U266 myeloma cells. Immunity (1999) 10(1):105–15. doi:10.1016/S1074-7613(00)80011-4
45. Grivennikov S, Karin E, Terzic J, Mucida D, Yu GY, Vallabhapurapu S, et al. IL-6 and Stat3 are required for survival of intestinal epithelial cells and development of colitis-associated cancer. Cancer Cell (2009) 15(2):103–13. doi:10.1016/j.ccr.2009.01.001
46. Yu H, Pardoll D, Jove R. STATs in cancer inflammation and immunity: a leading role for STAT3. Nat Rev Cancer (2009) 9(11):798–809. doi:10.1038/nrc2734
47. Wang J, De Veirman K, De Beule N, Maes K, De Bruyne E, Van Valckenborgh E, et al. The bone marrow microenvironment enhances multiple myeloma progression by exosome-mediated activation of myeloid-derived suppressor cells. Oncotarget (2015) 6(41):43992–4004. doi:10.18632/oncotarget.6083
48. Starr R, Willson TA, Viney EM, Murray LJ, Rayner JR, Jenkins BJ, et al. A family of cytokine-inducible inhibitors of signalling. Nature (1997) 387(6636):917–21. doi:10.1038/43206
49. Naka T, Narazaki M, Hirata M, Matsumoto T, Minamoto S, Aono A, et al. Structure and function of a new STAT-induced STAT inhibitor. Nature (1997) 387(6636):924–9. doi:10.1038/43219
50. Flowers LO, Subramaniam PS, Johnson HM. A SOCS-1 peptide mimetic inhibits both constitutive and IL-6 induced activation of STAT3 in prostate cancer cells. Oncogene (2005) 24(12):2114–20. doi:10.1038/sj.onc.1208437
51. Lesina M, Kurkowski MU, Ludes K, Rose-John S, Treiber M, Klöppel G, et al. Stat3/Socs3 activation by IL-6 trans-signaling promotes progression of pancreatic intraepithelial neoplasia and development of pancreatic cancer. Cancer Cell (2011) 19(4):456–69. doi:10.1016/j.ccr.2011.03.009
52. Egwuagu CE, Yu CR, Zhang M, Mahdi RM, Kim SJ, Gery I. Suppressors of cytokine signaling proteins are differentially expressed in Th1 and Th2 cells: implications for Th cell lineage commitment and maintenance. J Immunol (2002) 168(7):3181–7. doi:10.4049/jimmunol.168.7.3181
53. Jackson SH, Yu CR, Mahdi RM, Ebong S, Egwuagu CE. Dendritic cell maturation requires STAT1 and is under feedback regulation by suppressors of cytokine signaling. J Immunol (2004) 172(4):2307–15. doi:10.4049/jimmunol.172.4.2307
54. Yu J, Sun J, Wang SE, Li H, Cao S, Cong Y, et al. Upregulated expression of indoleamine 2, 3-dioxygenase in primary breast cancer correlates with increase of infiltrated regulatory T cells in situ and lymph node metastasis. Clin Dev Immunol (2011) 2011:469135. doi:10.1155/2011/469135
55. Alexander WS, Starr R, Fenner JE, Scott CL, Handman E, Sprigg NS, et al. SOCS1 is a critical inhibitor of interferon γ signaling and prevents the potentially fatal neonatal actions of this cytokine. Cell (1999) 98(5):597–608. doi:10.1016/S0092-8674(00)80047-1
56. Schmitz J, Weissenbach M, Haan S, Heinrich PC, Schaper F. SOCS3 exerts its inhibitory function on interleukin-6 signal transduction through the SHP2 recruitment site of gp130. J Biol Chem (2000) 275(17):12848–56. doi:10.1074/jbc.275.17.12848
57. Eyckerman S, Broekaert D, Verhee A, Vandekerckhove J, Tavernier J. Identification of the Y985 and Y1077 motifs as SOCS3 recruitment sites in the murine leptin receptor. FEBS Lett (2000) 486(1):33–7. doi:10.1016/S0014-5793(00)02205-5
58. Hörtner M, Nielsch U, Mayr LM, Johnston JA, Heinrich PC, Haan S. Suppressor of cytokine signaling-3 is recruited to the activated granulocyte-colony stimulating factor receptor and modulates its signal transduction. J Immunol (2002) 169(3):1219–27. doi:10.4049/jimmunol.169.3.1219
59. Babon JJ, Kershaw NJ, Murphy JM, Varghese LN, Laktyushin A, Young SN, et al. Suppression of cytokine signaling by SOCS3: characterization of the mode of inhibition and the basis of its specificity. Immunity (2012) 36(2):239–50. doi:10.1016/j.immuni.2011.12.015
60. Zhang J, Li H, Yu JP, Wang SE, Ren XB. Role of SOCS1 in tumor progression and therapeutic application. Int J Cancer (2012) 130(9):1971–80. doi:10.1002/ijc.27318
61. Diehl S, Anguita J, Hoffmeyer A, Zapton T, Ihle JN, Fikrig E, et al. Inhibition of Th1 differentiation by IL-6 is mediated by SOCS1. Immunity (2000) 13(6):805–15. doi:10.1016/S1074-7613(00)00078-9
62. Scheller J, Garbers C, Rose-John S. Interleukin-6: from basic biology to selective blockade of pro-inflammatory activities. Semin Immunol (2014) 26(1):2–12. doi:10.1016/j.smim.2013.11.002
63. Matthews V, Schuster B, Schütze S, Bussmeyer I, Ludwig A, Hundhausen C, et al. Cellular cholesterol depletion triggers shedding of the human interleukin-6 receptor by ADAM10 and ADAM17 (TACE). J Biol Chem (2003) 278(40):38829–39. doi:10.1074/jbc.M210584200
Keywords: breast cancer, interleukin-6, myeloid-derived suppressor cells, suppressor of cytokine signaling 3, the JAK/STAT signaling pathway, trans-signaling pathway
Citation: Jiang M, Chen J, Zhang W, Zhang R, Ye Y, Liu P, Yu W, Wei F, Ren X and Yu J (2017) Interleukin-6 Trans-Signaling Pathway Promotes Immunosuppressive Myeloid-Derived Suppressor Cells via Suppression of Suppressor of Cytokine Signaling 3 in Breast Cancer. Front. Immunol. 8:1840. doi: 10.3389/fimmu.2017.01840
Received: 01 September 2017; Accepted: 05 December 2017;
Published: 15 December 2017
Edited by:
Salem Chouaib, Institut Gustave Roussy, FranceReviewed by:
Pin Wu, Zhejiang University, ChinaViktor Umansky, Deutsches Krebsforschungszentrum (DKFZ), Germany
Copyright: © 2017 Jiang, Chen, Zhang, Zhang, Ye, Liu, Yu, Wei, Ren and Yu. This is an open-access article distributed under the terms of the Creative Commons Attribution License (CC BY). The use, distribution or reproduction in other forums is permitted, provided the original author(s) or licensor are credited and that the original publication in this journal is cited, in accordance with accepted academic practice. No use, distribution or reproduction is permitted which does not comply with these terms.
*Correspondence: Jinpu Yu, yujinpu@tjmuch.com
†These authors have contributed equally to this work.