Gaps in Protection of Important Ocean Areas: A Spatial Meta-Analysis of Ten Global Mapping Initiatives
 Natasha J. Gownaris
 Christine M. Santora
 John B. Davis
 Ellen K. Pikitch
- 1Department of Environmental Studies, Gettysburg College, Gettysburg, PA, United States
- 2School of Marine and Atmospheric Sciences, Institute for Ocean Conservation Science, Stony Brook University, Stony Brook, NY, United States
- 3OCTO (Open Communications for The Ocean), Woodinville, WA, United States
To safeguard biodiversity effectively, marine protected areas (MPAs) should be sited using the best available science. There are numerous ongoing United Nations and non-governmental initiatives to map globally important marine areas. The criteria used by these initiatives vary, resulting in contradictions in the areas identified as important. Our analysis is the first to overlay these initiatives, quantify consensus, and conduct gap analyses at the global scale. We found that 55% of the ocean has been identified as important by one or more initiatives, and that individual areas have been identified by as many as seven overlapping initiatives. Using our overlay map and data on current MPA coverage, we highlight gaps in protection of important areas of the ocean. We considered any area identified by two to four initiatives to be of moderate consensus. Over 14% of the ocean fell under this category and most of this area (88%) is not yet protected. The largest concentrations of medium-consensus areas without protection were found in the Caribbean Sea, Madagascar and the southern tip of Africa, the Mediterranean Sea, and the Coral Triangle. Areas of high consensus (identified by five to seven initiatives) were almost always within MPAs, but their no-take status was often unreported. We found that nearly every marine province and nearly every exclusive economic zone contained area that has been identified as important but is not yet protected. Much of the identified area lies within contiguous stretches of >100,000 km2; it is unrealistic to expect that all this area be protected. Nonetheless, our results on areas of consensus provide initial insight into opportunities for further ocean protection.
Introduction
There is currently a convergence of global interest in ocean science and conservation. Some examples of this interest include the United Nations (UN) declaration of 2021–2030 as the “Decade of Ocean Science for Sustainable Development”; the convening of five global, high-level Our Oceans conferences; the adoption of the first UN Sustainable Development Goal devoted exclusively to ocean issues (SDG 14); and the focus on implementation of the Convention on Biological Diversity’s (CBD) Aichi Targets. Both the SDG and CBD targets (specifically, SDG 14.5 and Aichi Target 11) call for protection of at least 10% of the ocean by the year 2020.
Scientists have argued that adequately protecting biodiversity and meeting socioeconomic goals is likely to require a much higher level of protection than 10%, with estimates that 30–50% of the ocean should be set aside in Marine Protected Areas (MPAs) (IUCN, 2016: WCC-2016-Res-050-EN; O’Leary et al., 2016; Wilson, 2016). Discussions are underway to determine the next set of targets and activities under CBD’s Post-2020 Biodiversity Framework, including those for MPAs. All signs point to the likelihood that targets for 2021 and beyond will exceed the current agreed targets for 2020 (Campbell and Gray, 2019).
Scientific evidence that MPAs can help to maintain and restore fish populations (Sala and Giakoumi, 2017; Aalto et al., 2019), increase ecosystem resilience (Mellin et al., 2016; Roberts et al., 2017), and provide socio-economic benefits (Bennett and Dearden, 2012; Ban et al., 2017; Rodríguez-Rodríguez et al., 2019) continues to build. These benefits are only realized, however, if MPAs are appropriately sited, strongly protected, and effectively managed (Watson et al., 2016; Ban et al., 2017; Gill et al., 2017; Giakoumi et al., 2018; Jantke et al., 2018; Rees et al., 2018; Sala et al., 2018). Many of the world’s MPAs fail to meet quality standards (Barnes et al., 2018; Sala et al., 2018; Zupan et al., 2018; da Silva, 2019) and MPA siting has not always been based on the best available science (Jantke et al., 2018; Fischer et al., 2019). The United Nations Environment World Conservation Monitoring Centre estimated that 7.59% of the ocean was covered by protected areas as of March 2019 (UNEP-WCMC and IUCN, 2019a). However, only 4.8% of the ocean is in implemented and actively managed MPA and only 2.2% is in strongly protected MPAs or no-take marine reserves (Marine Conservation Institute, 2019b).
There are numerous ongoing UN and non-governmental (NGO) initiatives to map important marine regions, each of which involves extensive research and expert opinion (Supplementary Appendix S3: Supplementary Table S1). The value of several of these initiatives as roadmaps for future protection has been explicitly recognized by the CBD (e.g., CBD, 2008: UNEP/CBD/COP/DEC/IX/20; CBD, 2016: UNEP/CBD/SBSTTA/20/INF/43). Here, we present a spatial meta-analysis of ten UN and NGO initiatives that vary in purpose, scope, and selection criteria. As noted by similar initiatives in terrestrial systems, differences in criteria and scope among these marine initiatives may result in contradictory maps and lack of a clear message about which regions should be prioritized (Mace et al., 2000; Soutullo et al., 2008). Our overlay is a direct response to discussions among scientists, MPA practitioners, and diplomats during and following a 2016 workshop in Rome, where policymakers expressed uncertainty over which map should be used as a starting point for future protection (Supplementary Appendix S1: Rome Call to Action). By overlaying maps from ten of the major global initiatives, we seek to highlight areas that are consistently identified as important despite differences in the criteria used.
There have been several spatial meta-analyses focused on initiatives identifying important terrestrial regions (Brooks et al., 2006; Soutullo et al., 2008; Schmitt et al., 2009; Iwamura et al., 2013). The criteria used to identify important terrestrial and marine regions have also been extensively discussed elsewhere (Brooks et al., 2006; Gilman et al., 2011; Marchese, 2015; Briscoe et al., 2016). However, the identification of important marine areas has lagged similar initiatives for terrestrial areas (Briscoe et al., 2016) and our analysis is the first to overlay these initiatives, quantify consensus, and conduct gap analyses at the global scale. We identify gaps in protection of previously identified important areas and examine the strength of protection where it does exist. We also consider gaps in protection of regions identified as important in the context of biogeographic representativeness. Our aim is to provide a starting point for future protection by focusing attention on areas of the ocean that have been identified as important but that remain unprotected.
Materials and Methods
Initiatives
To be considered in our analysis, initiatives had to: (1) be conducted under the auspices of a UN agency or an NGO; (2) identify important marine regions at the global scale; and (3) have spatial data available online. Application of these criteria resulted in selection of 10 initiatives that varied in purpose, scope, and methodology (Table 1). Among those initially considered, Mission Blue Hope Spots was the only global initiative that we did not include in the final analysis, as the boundaries of Hope Spots were not sufficiently defined for use in spatial analysis.
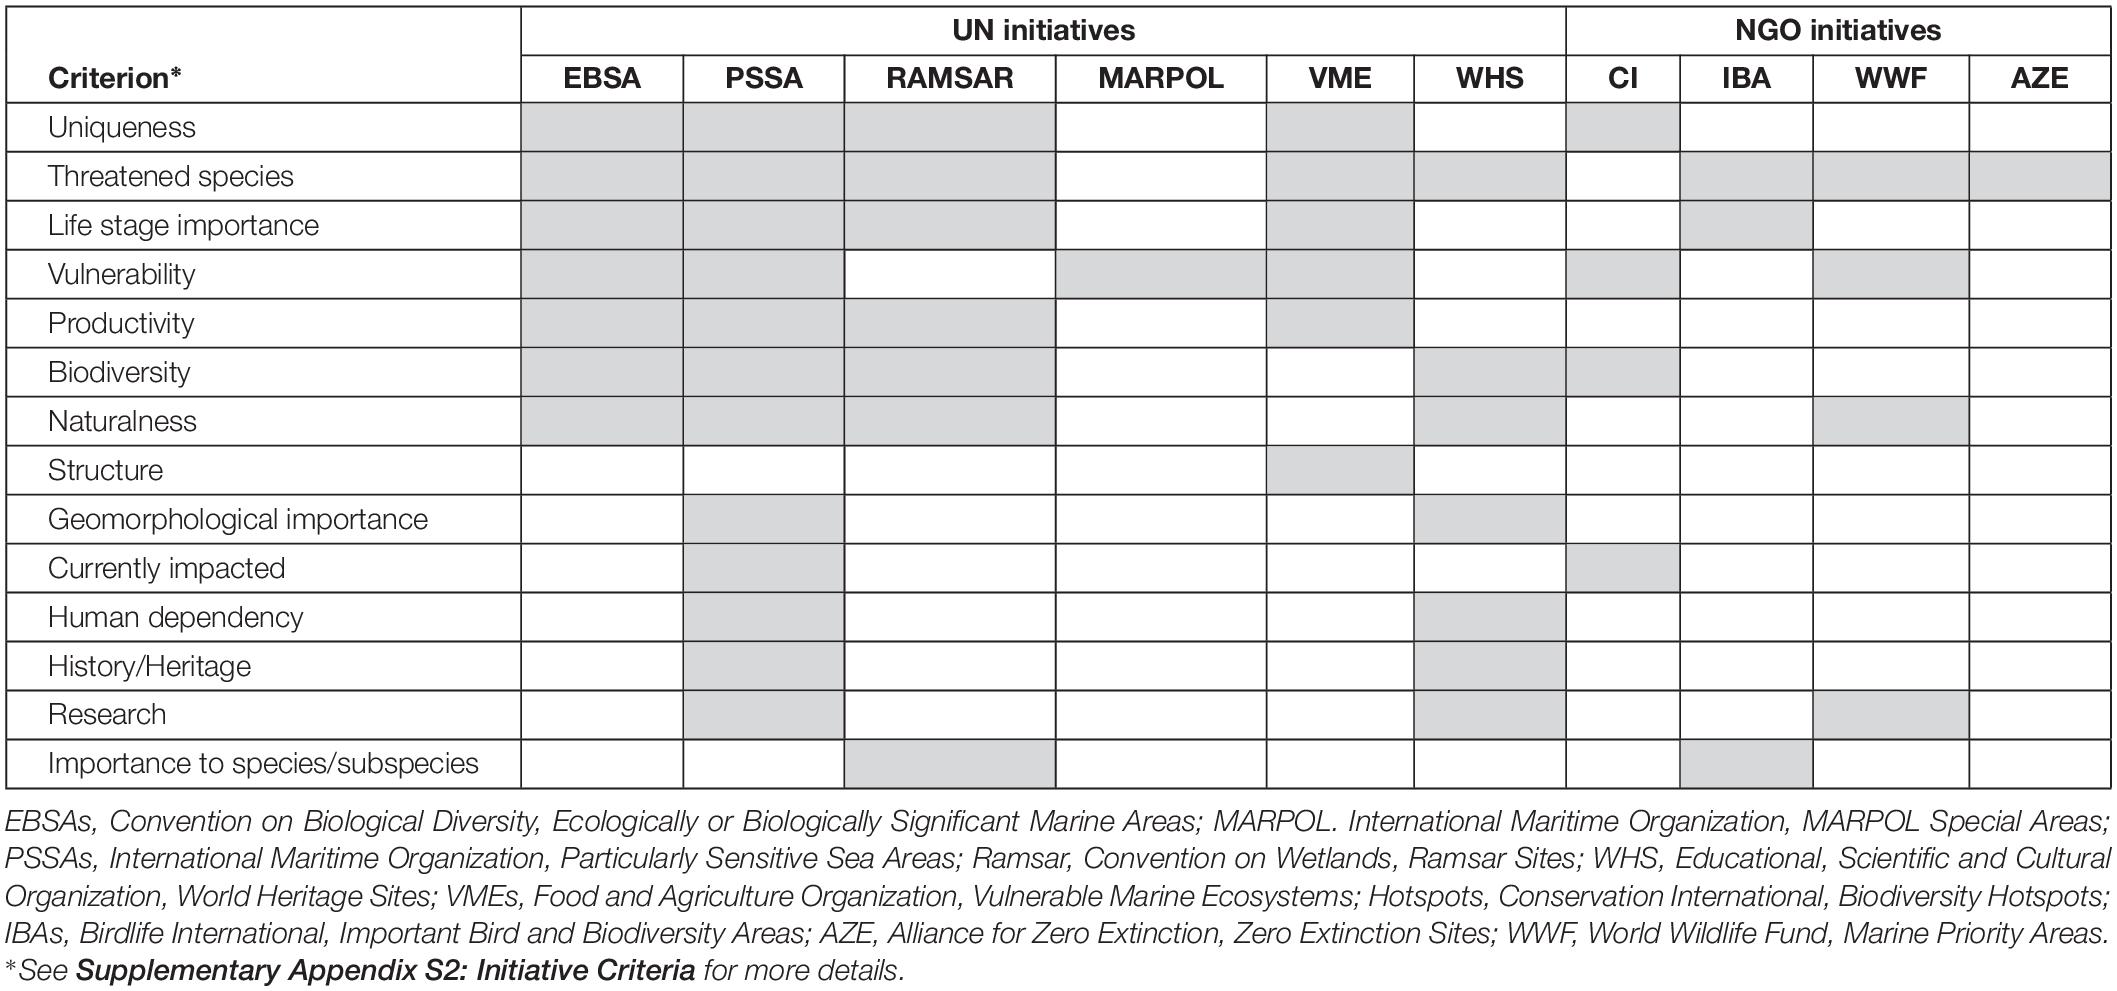
Table 1. Criteria used by ten initiatives to map important marine areas.
In each initiative we collated, the number of sites identified as important ranged from under 20 to over 200, with a total area per initiative ranging from approximately 60 thousand km2 to over 80 million km2 (Supplementary Table S1). Some initiatives included both terrestrial and marine regions (e.g., World Heritage Sites, WHS), while others included only marine regions (e.g., Vulnerable Marine Ecosystems, VMEs). A few initiatives focused on (e.g., VMEs) or included (e.g., Ecologically or Biologically Significant Marine Areas, EBSAs) areas beyond national jurisdiction (ABNJ), while others were based on proposals by member states and, to date, have focused solely on exclusive economic zones (EEZs) (e.g., Particularly Sensitive Sea Areas, PSSAs: Roberts et al., 2010; Fletcher et al., 2017; WHS: Laffoley and Freestone, 2017).
The motivation for identifying marine areas of importance also varied greatly by initiative. Myers et al. (2000), for example, originally suggested that the long-standing Biodiversity Hotspots (updated in Mittermeier et al., 2011), be used to prioritize use of limited conservation funds. Though identified based on terrestrial biodiversity, the boundaries of these regions also enclose important marine areas such as coral diversity hotspots (Roberts et al., 2002) and coastal marshes (Myers, 2003), and Conservation International has established marine programs within these regions. By comparison, MARPOL Special Areas were not established to prioritize conservation funds, but to impose special restrictions on ship pollution in ecologically vulnerable ocean areas (International Maritime Organization [IMO], 2002). We use the term “important” to refer to identified regions, acknowledging that what qualifies as important varies with initiative.
Spatial data for most initiatives examined in this study were available online as occurrence polygons, through either organizational websites or the ArcGIS data portal (Supplementary Appendix S3: Supplementary Table S1). For EBSAs, we compiled a complete spatial database by merging the 275 individual EBSA files available on the CBD website as of October 2017. For databases that had not been updated for several years (e.g., Alliance for Zero Extinction sites, AZE), we contacted the relevant organization to verify that updated data were not available prior to analysis. We thoroughly reviewed each initiative’s available documentation to determine which criteria were used when important marine areas were identified and how these criteria were defined (Supplementary Appendix S2: Initiative Criteria).
Additionally, we collated academic studies that aimed to identify important marine regions at a global scale (e.g., Selig et al., 2014; Klein et al., 2015; Martin et al., 2015; Jenkins and Van Houtan, 2016; Ramírez et al., 2017; Fischer et al., 2019) but ultimately did not include them in our analysis. Academic papers typically present results for a snapshot of time, while most UN and NGO initiatives are ongoing. Furthermore, while our analysis relied on occurrence polygons, many academic studies produce raster data (e.g., geomorphic feature diversity: Fischer et al., 2019). Because raster data are continuous, defining occurrence polygons based on these data would have required us to decide subjectively which raster values constituted important regions, which would have been beyond the scope of our study.
Overlay Analysis
We conducted all analyses in ArcGIS Desktop 10.5 (ESRI, 2016). To allow for consistent global calculations of area, we first projected all spatial data to Eckert IV. For global-level maps, Eckert IV is the equal-area projection system with the lowest weighted mean error of scale distortion (Canters, 2002; Šavrič et al., 2016; Jenny et al., 2017). We clipped all initiative layers to the Natural Earth 10 m Ocean polygon prior to analysis (Ocean Version 4.1.0: Natural Earth, 2018b) to ensure that they had the same spatial extent.
To conduct our overlay analysis, we merged all ten initiatives into one layer (“merged polygons layer”) and identified regions of overlap using a modification of the Count Overlapping Polygons tool (Honeycutt, 2012). Our application of this tool was as follows: (1) Create a new layer (Feature to Polygon tool) with separate polygons showing either single initiatives or regions where initiatives intersected (“overlap polygons layer”); (2) Calculate the centroid for each overlap polygon (Feature to Point tool); (3) Spatially join (one-to-one join) the centroid data to the merged polygons layer and count the number of polygons overlapping with each centroid; and (4) Join the centroid count data back to the overlap polygons layer.
The result of this overlay was a map consisting of over 134,000 occurrence polygons (“overlay map”), each including information on the number of initiatives (“overlapping initiatives”) identifying that specific region as important. Hereafter, we refer to areas identified by one or more initiatives as “identified areas.” Within that, we refer to areas identified by two to four initiatives as “moderate-consensus areas” and by five to seven initiatives as “high-consensus areas.”
Because the initiatives we included varied substantially in the size and number of regions identified, we conducted a sensitivity analysis. We repeated the steps outlined above ten times, removing one initiative prior to each run and recalculating the area identified at each level of overlap. We also tested for interdependence of initiatives, i.e., one initiative identifying an area based solely on identification by a prior initiative. For example, spatial data on Important Bird Areas (IBSs) were considered at EBSA workshops (Bax et al., 2016), which were also attended by members of several conservation organizations that have produced global maps of important marine areas, including Birdlife International and World Wildlife Fund (Johnson et al., 2018). To examine the degree of interdependence, we iteratively clipped each initiative by each other initiative and calculated pairwise percent overlap.
Gap Analysis
Current Marine Protected Area Coverage
To identify gaps in protection of important marine regions, we considered our overlay map in the context of current global MPA coverage (Figure 1). There are two databases commonly used to track global MPA coverage, MPAtlas (Marine Conservation Institute, 2019b) and the World Database on Protected Areas (WDPA; UNEP-WCMC and IUCN, 2019a). The WDPA is a joint project between UN Environment (UNEP) and the International Union for Conservation of Nature (IUCN). MPAtlas builds on WDPA, providing additional fact-checking on reported statistics and additional information on MPA status and protection level (Marine Conservation Institute, 2019b).
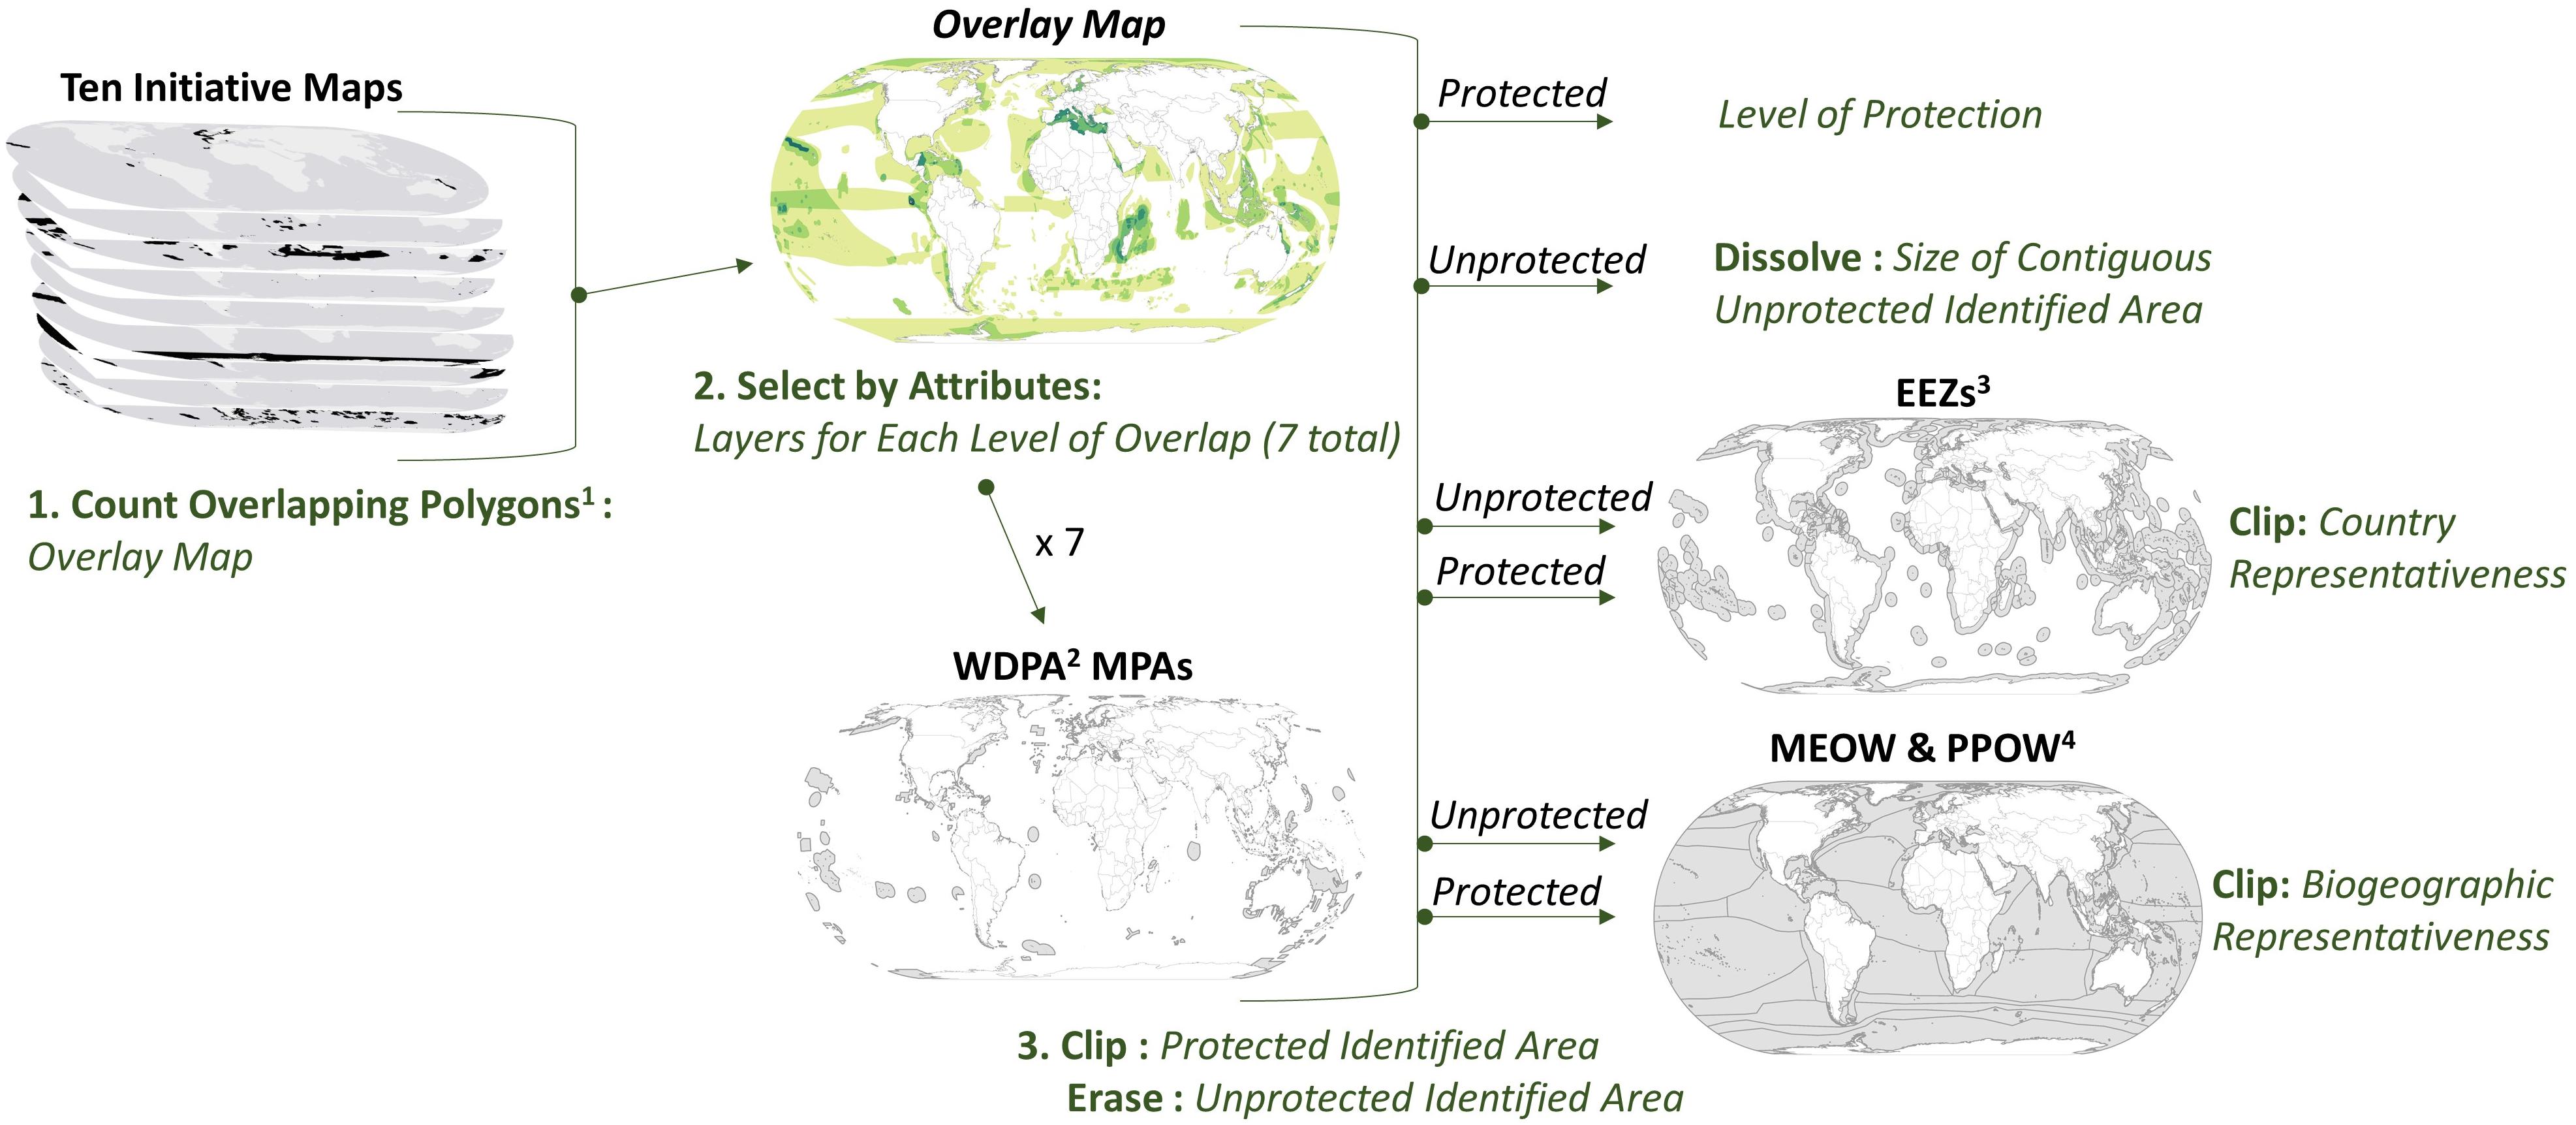
Figure 1. Conceptual diagram showing spatial analysis workflow. Names of data layers resulting from our analysis are italicized. (1) Count Overlapping Polygons Tool (Honeycutt, 2012), (2) World Database on Protected Areas (UNEP-WCMC and IUCN, 2019a), (3) Exclusive Economic Zones (Flanders Marine Institute, 2018), (4) Marine Ecoregions of the World (Spalding et al., 2007) and Pelagic Provinces of the World (Spalding et al., 2012).
We used the marine dataset of the January 2019 World Database on Protected Areas (WDPA; UNEP-WCMC and IUCN, 2019a) to conduct our gap analysis because the WDPA is the official entity to which all member states report progress on protected area coverage under both CBD Aichi Target 11 and Sustainable Development Goal 14.5. Following the WDPA’s methodology for calculation of current coverage (UNEP-WCMC and IUCN, 2018a) and other recent academic studies (Jantke et al., 2018; Johnson et al., 2018; O’Leary et al., 2018), we did not include UNESCO Man and Biosphere Reserves or MPAs with a status of “proposed” or “not reported” as currently protected in our analysis. In most analyses, except for when information on specific MPAs was required (e.g., level of protection), we dissolved the WDPA prior to analysis to prevent double counting of overlapping polygons (UNEP-WCMC and IUCN, 2018b).
Size
Using a meta-analysis of 87 global MPAs, Edgar et al. (2014) found that sites covering at least 100 km2 were more effective in conserving biodiversity than those that were smaller. Given the relationship between MPA size and effectiveness, we calculated and considered the size distribution of identified areas without current protection, using the dissolve tool to combine contiguous areas (Figure 1). Exploratory analysis of the resulting data suggested that our analyses resulted in sliver polygons, defined by Delafontaine et al. (2009) as “a polygon, resulting from the combination of at least two different geographical layers, of which the boundary is supposed to coincide with a line, but does not because of position errors and/or uncertainties.” In our data, for example, one of the identified marine areas is Port Davey, Australia, which is part of the larger Tasmanian Wilderness WHS. However, clipping the WHS layer to the ocean layer also resulted in 670 polygon “slivers” less than 10 km2 in size, 634 of which were less than 0.01 km2 in size.
Sliver polygons are common in spatial analyses that combine datasets created by different organizations and can sometimes be identified based on geometric properties such as area, perimeter-to-area ratio, and thinness ratio (Delafontaine et al., 2009). Preliminary analysis of our data, however, suggested that none of these properties could be used to systematically identify sliver polygons. Area and perimeter to area ratio both had a strong positive skew across polygons and were normally distributed when log-transformed, so did not indicate thresholds with which to define polygons as slivers. Thinness ratio showed a uniform distribution, so similarly did not provide any clear thresholds for identifying slivers. We therefore report results for all polygons in our study. Sliver polygons represent a very small fraction of the total unprotected area of identified regions; less than 0.02% of the total area, for example, was found in polygons of less than 10 km2.
Exclusive Economic Zones
Although protecting marine ABNJ is of growing interest (e.g., UN General Assembly Resolution 72/249; Heffernan, 2018; United Nations General Assembly, 2018; Wright et al., 2018), most MPA creation continues to take place within EEZs (UNEP-WCMC and IUCN, 2019a). Immediate marine protection is likely to be most feasible at the national level, as global negotiations on a legally binding treaty to protect marine biodiversity in international waters will conclude in 2020 at the earliest (High Seas Alliance, 2019). We therefore focused part of our gap analysis on EEZs (Flanders Marine Institute, 2018; Figure 1). Following Fischer et al. (2019), we excluded disputed and joint regimes from our analysis and considered all Antarctic territories as one EEZ managed by the Commission for the Conservation of Antarctic Marine Living Resources (CCAMLR), resulting in a total of 230 EEZ polygons. We clipped the resulting EEZ layer by a layer representing all identified areas, protected identified areas, and unprotected identified areas, respectively, to calculate the area-weighted average overlap, percent identified area protected, and total unprotected identified area.
Biogeographic Representativeness
Ecological representativeness of MPAs is explicitly called for in Aichi Target 11 and remains a challenge in the global MPA network (Jantke et al., 2018). We examined gaps in biogeographic representativeness using spatial data on marine provinces as defined by the Marine Ecoregions of the World (MEOWs: Spalding et al., 2007) and the Pelagic Provinces of the World (PPOWs: Spalding et al., 2012). These are complementary, non-overlapping classifications; MEOWs and PPOWs represent coastal regions (<200 m depth contour) and pelagic regions (>200 m depth contour), respectively. Nearly all MEOW area is located within EEZs, but EEZs also contain PPOWs. We used MEOW’s 62 provinces and PPOW’s 37 provinces as our biogeographic units (Figure 1). As with EEZs, we calculated the area-weighted average overlap, percent identified area protected, and total unprotected identified area for each MEOW and PPOW province.
Results
Overlay Analysis
Approximately 55% of the global ocean was identified as important by one or more UN and/or NGO initiative(s). Within this 55%, the number of overlapping initiatives ranged from one to as many as seven, with the following area covered by each: 40% of the ocean by one initiative, 12% by two initiatives, 2% by three initiatives, 0.7% by four initiatives, and <0.5% by five or more initiatives (Figure 2). Some high-consensus areas were small and distinct, such as the ocean surrounding the Galápagos Islands. This was the only area with seven overlapping initiatives, the highest-observed level of overlap. Large areas of moderate- and high-consensus also occurred in the Caribbean Sea, Madagascar and the southern tip of Africa, the Mediterranean Sea, and the Coral Triangle (Figure 2).
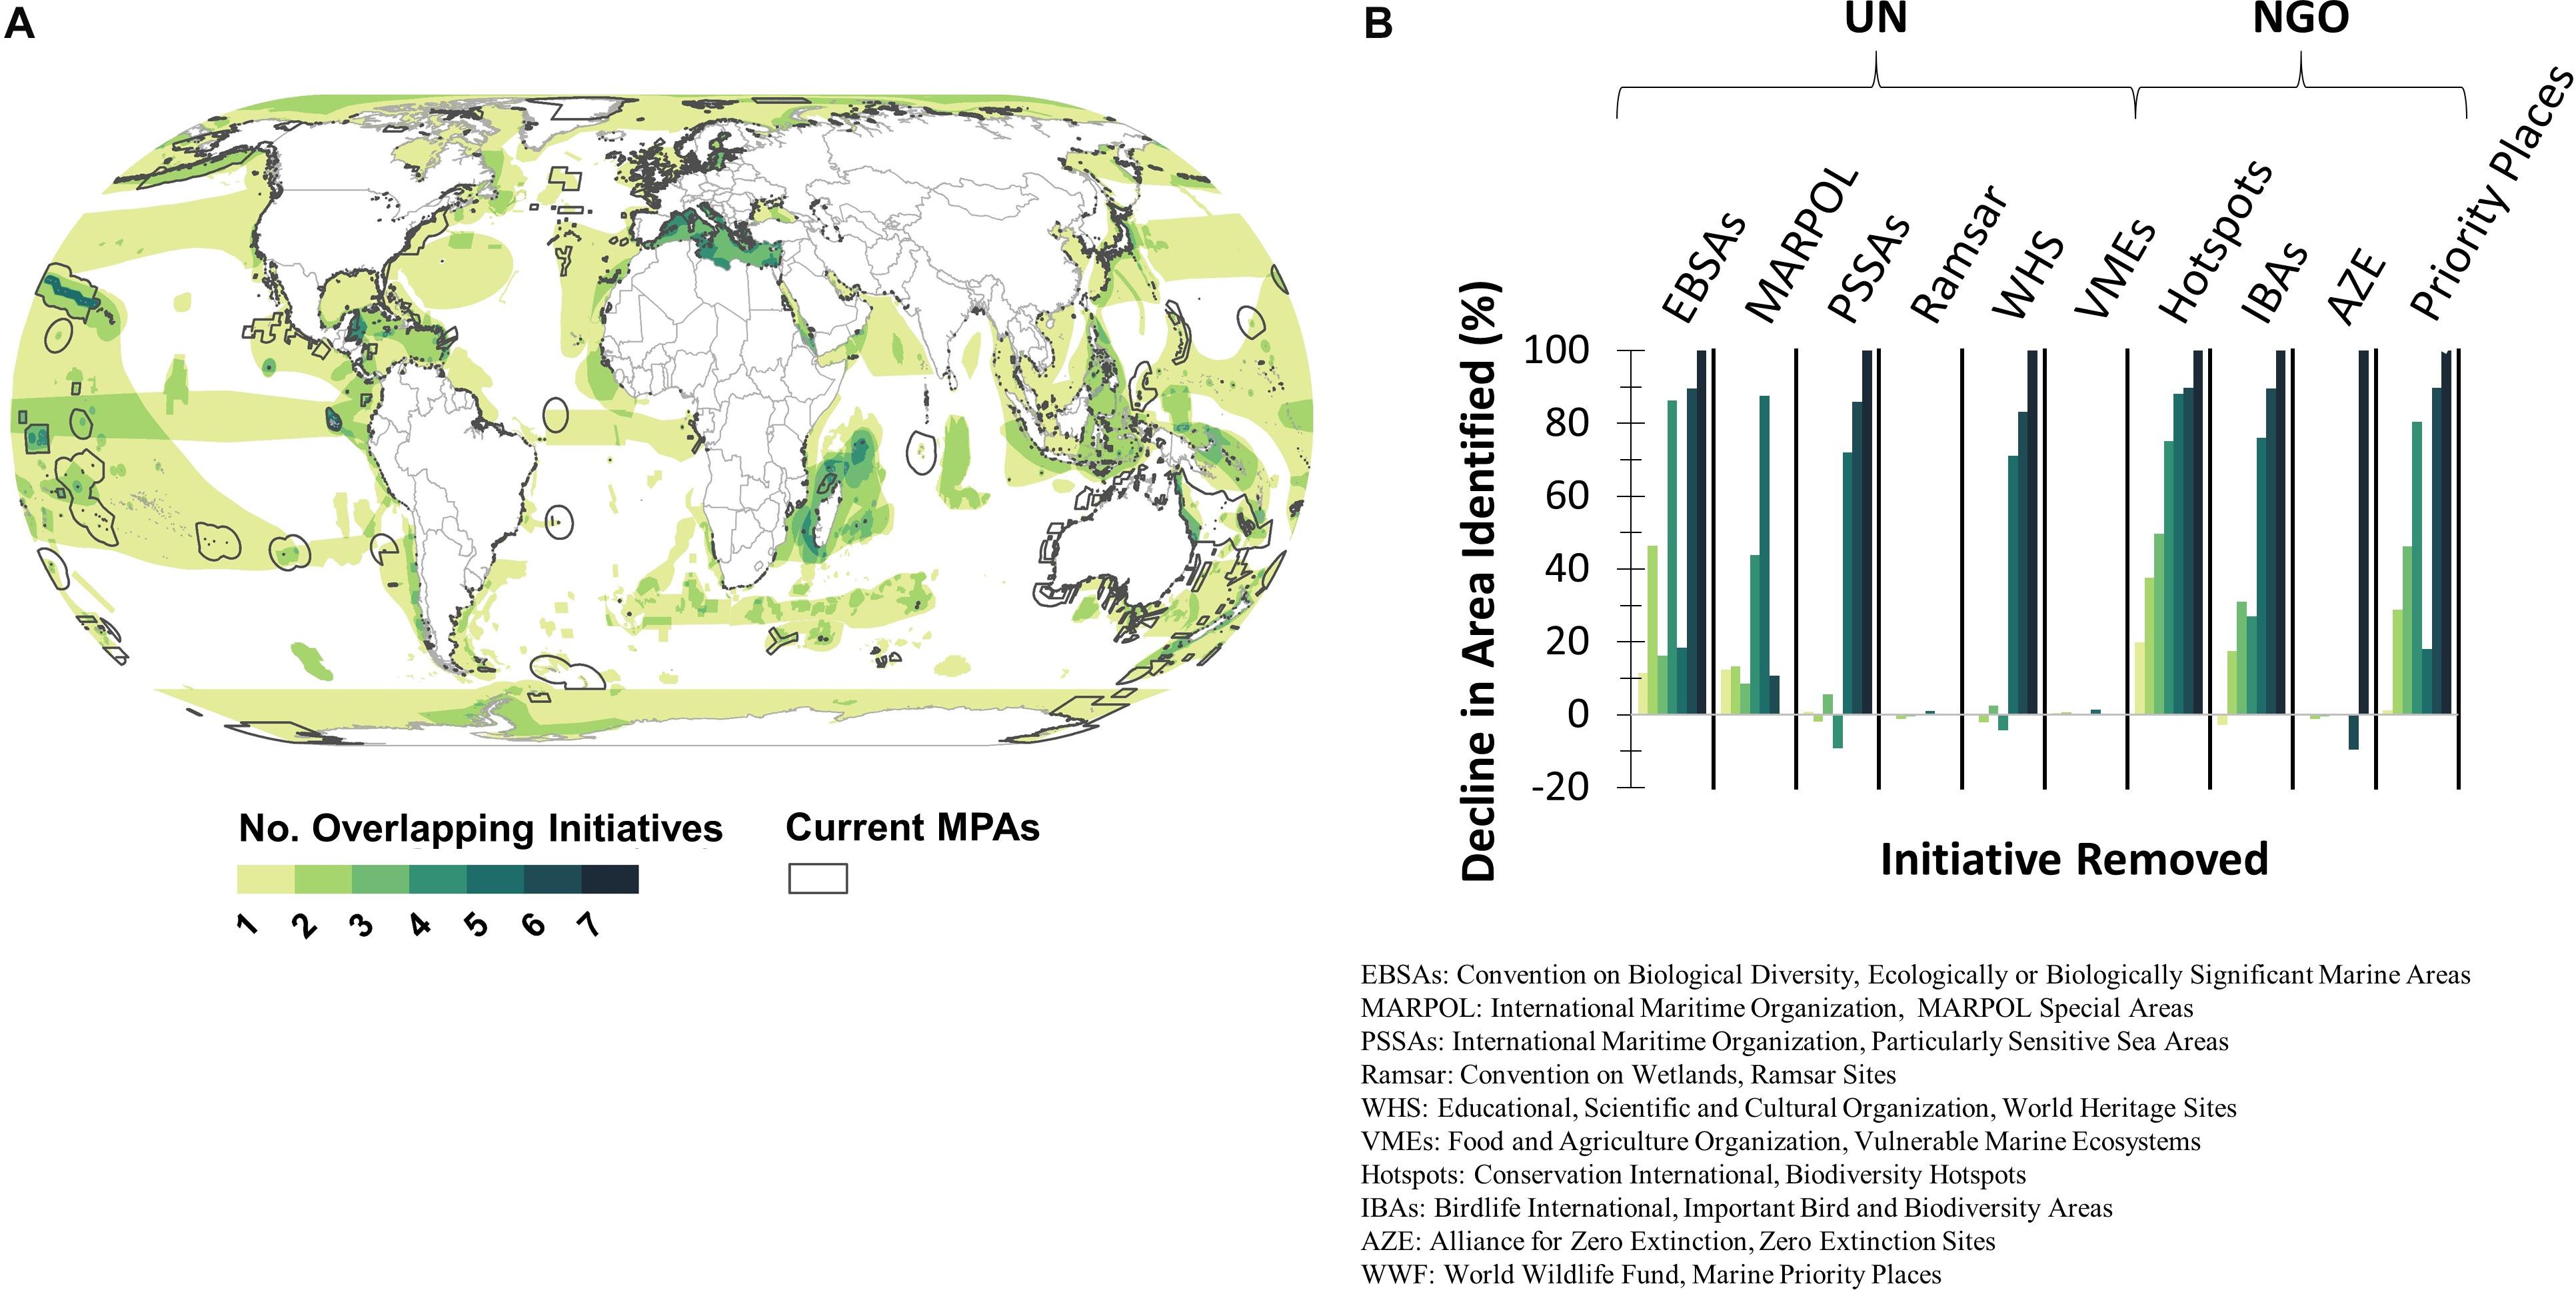
Figure 2. Results of overlay analysis for marine areas identified as important by six United Nations and four non-governmental organization initiatives. The number of overlapping initiatives in each region is mapped in (A) and the impact of each initiative on the area identified at each level of overlap is shown in (B). Initiatives identified 55% of the ocean as important, with up to seven initiatives overlapping. Overlap map (A) also shows current marine protected area coverage (World Database on Protected Areas, January 2019: UNEP-WCMC and IUCN, 2019a); most areas identified as important are not currently protected, except for areas identified by at least five initiatives (A). Areas with overlap of at least two initiatives are concentrated in the Caribbean, the Mediterranean, the Coral Triangle, Madagascar and surrounding islands, and the Galápagos and surrounding islands (A). The two initiatives with the largest impact on the area were Convention on Biological Diversity EBSAs and Conservation International Hotspots (B). Countries are displayed using data provided by Natural Earth (Admin 0 Countries 4.1.0; Natural Earth, 2018a).
Initiatives varied substantially in the number of criteria used to identify important areas, from one criterion for some initiatives (AZE Zero Extinction Sites: presence of threatened/endangered species; MARPOL Special Areas: system vulnerability/fragility/sensitivity) to 12 criteria for PSSAs (Table 1 and Supplementary Appendix S2: Initiative Criteria). However, within an initiative, not all criteria were necessarily met for a region to be considered important. For example, some EBSAs were identified based only on one “critically important” criterion (Johnson et al., 2018). The most commonly used criterion across initiatives was the presence of threatened or endangered species, used by seven of ten initiatives. Other commonly used criteria (each used by five or six initiatives) included naturalness, biodiversity, vulnerability, uniqueness/rarity, and importance to life stages (Table 1 and Supplementary Appendix S2: Initiative Criteria).
When considered as two categories, the area identified by at least one NGO initiative or by at least one UN initiative covered 37 and 28%, respectively, of the ocean (Supplementary Appendix S3: Supplementary Figure S1). However, the overlap between areas identified by at least one UN initiative and areas identified by at least one NGO initiative was low (Supplementary Appendix S3: Supplementary Figure S1). The low overlap can be attributed, in part, to differences in how UN and NGO initiatives identified important areas. While UN initiatives relied on an average of 6.5 criteria (range 1–12), NGO initiatives relied on an average of three criteria (range 1–4). There were also differences in which criteria were most often used to identify important areas; for example, while four UN initiatives included the criterion of “naturalness,” only one NGO initiative did (WWF Priority Areas) (Table 1 and Supplementary Appendix S2: Initiative Criteria).
Among the initiatives examined, areas identified by the CBD initiative (EBSAs) had the greatest total marine extent (Table 1). Our sensitivity analysis showed that removing EBSAs and Hotspots led to the largest decline in total area identified, with declines of 20 and 26%, respectively (Figure 2). Half of the initiatives had little (<1% of total area) impact on the area identified (VMEs, PSSAs, WHS, Ramsar Sites, AZE Sites). The areas identified by these initiatives were small and often overlapped with those identified by several other initiatives, i.e., were found in high-consensus areas (Supplementary Appendix S3: Supplementary Table S2). Removing PSSAs, WHS, Ramsar sites, or AZE sites therefore led to declines of between 72.6 and 88.5% in high-consensus area (Figure 2).
The average pairwise overlap in areas identified by two initiatives was 14.2% (range of 0.00–69.30% across pairs; Supplementary Appendix S3: Supplementary Table S2). WHS had the highest and most variable overlap with areas identified by other initiatives (30.9% overlap across pairs); these sites had no overlap with VMEs but a 69.30% overlap with Hotspots (Supplementary Appendix S3: Supplementary Table S2). MARPOL Special Areas showed the lowest overlap with areas identified by other initiatives (average of 5.57%, range of 0.00–19.24% overlap across pairs), overlapping by more than 6% with only Hotspots and Priority Places (Supplementary Appendix S3: Supplementary Table S2).
Gap Analysis
Current Protected Area Coverage
A total of 7.75% of the area identified as important by a single initiative was protected, 11.7% of moderate-consensus area (two to four overlapping initiatives) was protected, and 94.7% of the high-consensus area (five to seven overlapping initiatives) was protected (Figure 3). Here and throughout our results and discussion, we use the term “protected” to refer to all MPAs included in our analysis, regardless of their level of protection. Approximately 66% of current MPA coverage overlaps with areas identified by the initiatives examined in this analysis (Figure 2).
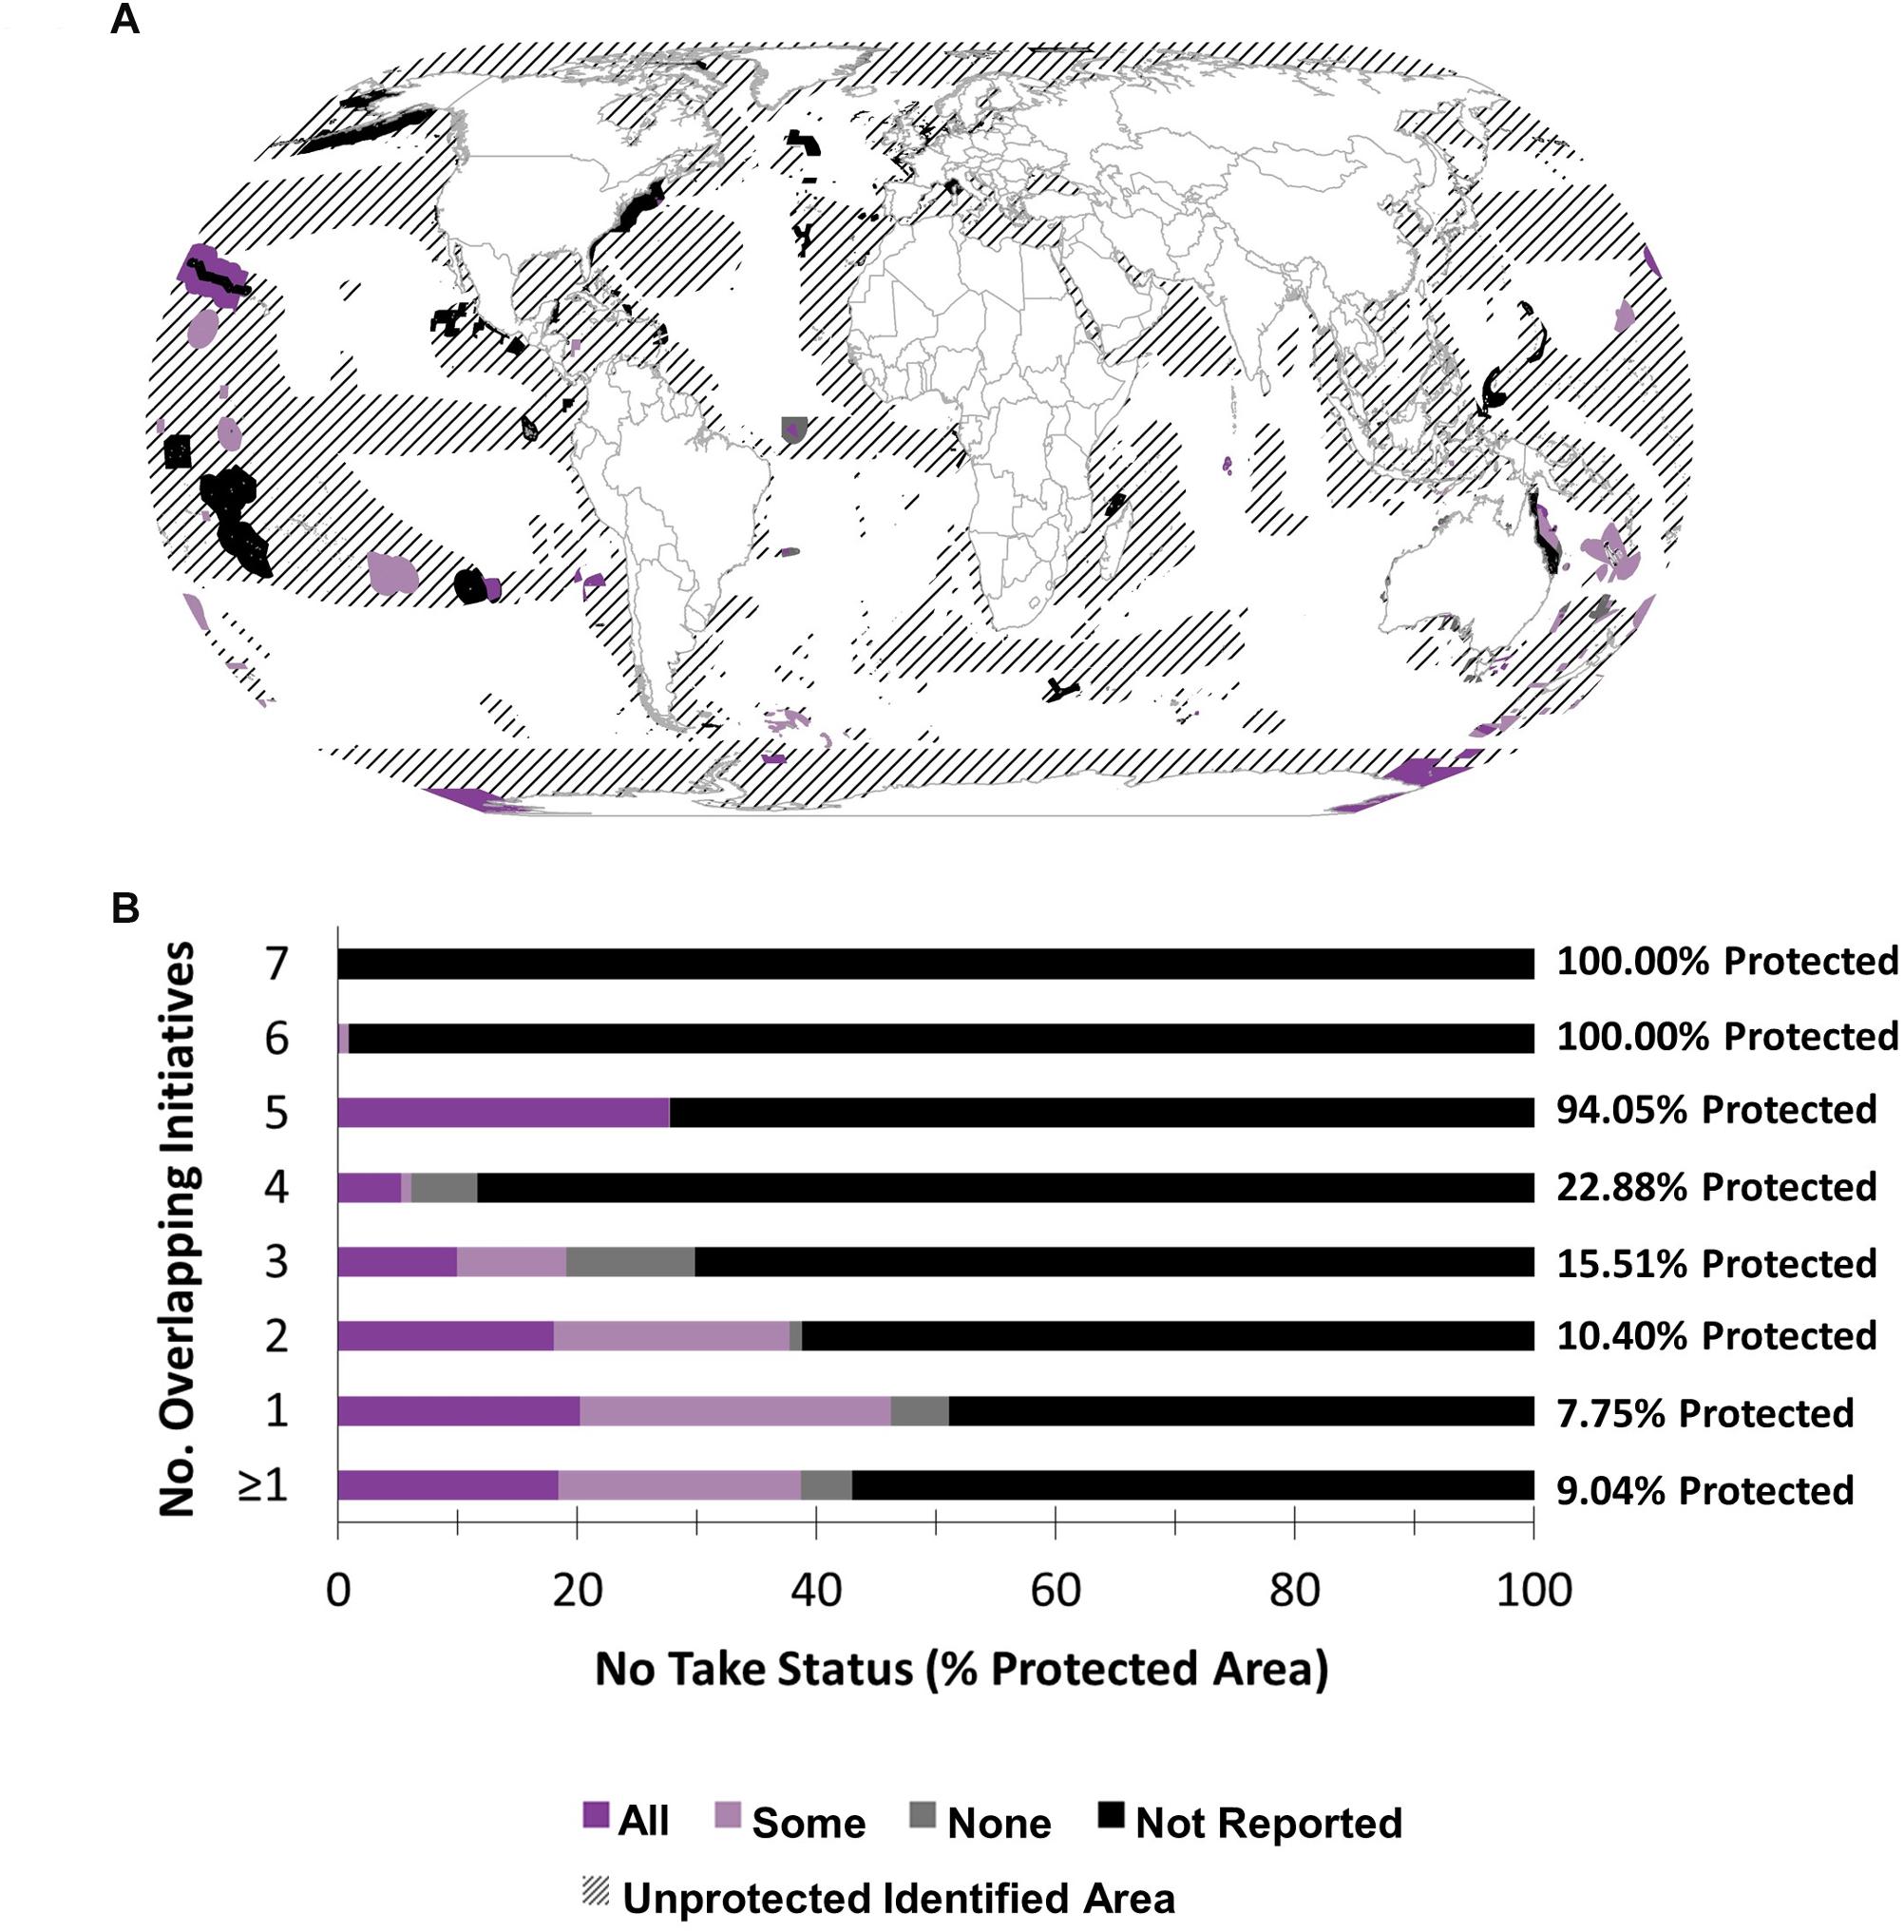
Figure 3. Map showing the protection level of areas identified as important based on the World Database on Protected Areas (UNEP-WCMC and IUCN, 2019b). Identified areas outside of marine protected areas (MPAs) are shown using hatching and areas within MPAs are colored based on their no-take status (A). Areas were identified as important by six United Nations and four non-governmental organization initiatives that vary in purpose and scope. The percent protection at each level of overlap and the no-take status of this protection is shown in (B). As the number of overlapping initiatives in an area increased, so did the likelihood that the area was already within an MPA (B). However, only 18.4% of all identified area that was protected fell within no-take MPAs and the no-take status of many protected identified areas was unknown (A,B). Countries are displayed using data provided by Natural Earth (Admin 0 Countries 4.1.0; Natural Earth, 2018a).
Of the identified area that was protected, 18.4% fell within MPAs listed by the WDPA as “all no-take” and 20.3% was listed as “part no-take” (i.e., having a combination of fishing and non-fishing zones). Therefore, approximately 39% of identified area that was protected was within MPAs with at least some no-take area (Figure 3). Most of the remaining identified area that was protected (57.1%) was within MPAs with an unreported no-take status; only 4.2% fell within MPAs that were reported as having no no-take area. Although areas of high-consensus were most likely to be protected, they were least likely to have their no-take status reported (Figure 3).
Size
Over 99.9% of the total area identified by the initiatives we examined was within continuous areas of at least 100 km2, for a total of 341 areas above the size threshold defined by Edgar et al. (2014) (Supplementary Appendix S3: Supplementary Figure S2). Of these large areas, 40 covered greater than 100,000 km2 (Supplementary Appendix S3: Supplementary Figure S2) and could be further examined as potential sites for new, very large-scale MPAs (O’Leary et al., 2018) and/or networks of MPAs (Green et al., 2015). The five largest contiguous areas were located in the Pacific Ocean (two areas each greater than 34 million km2), in the Arctic (over 17.9 million km2), in the Antarctic (over 19.3 million km2), and in the Mediterranean Sea/northwest coast of Africa (12.6 million km2).
Exclusive Economic Zones
We found that approximately 58% of the total area identified was located within EEZs, and that over 97% of the moderate- to high-consensus area was located within EEZs. While 42% of the total area identified was located within ABNJ, <10% of the protected identified area was within ABNJ. These protected areas fell within just eight MPAs.
Of particular relevance to UN SDG 14.5, 198 of 230 EEZs had at least 10% of their waters within an area that was identified as important by at least one initiative but not currently protected (Figure 4). Just two EEZs had no identified area (Kazakhstan and Turkmenistan). Only 58 EEZs had at least 10% of their identified area protected, and 28 EEZs had 0% of their identified area protected. In contrast, 13 EEZs protected 98% or more of their identified area.
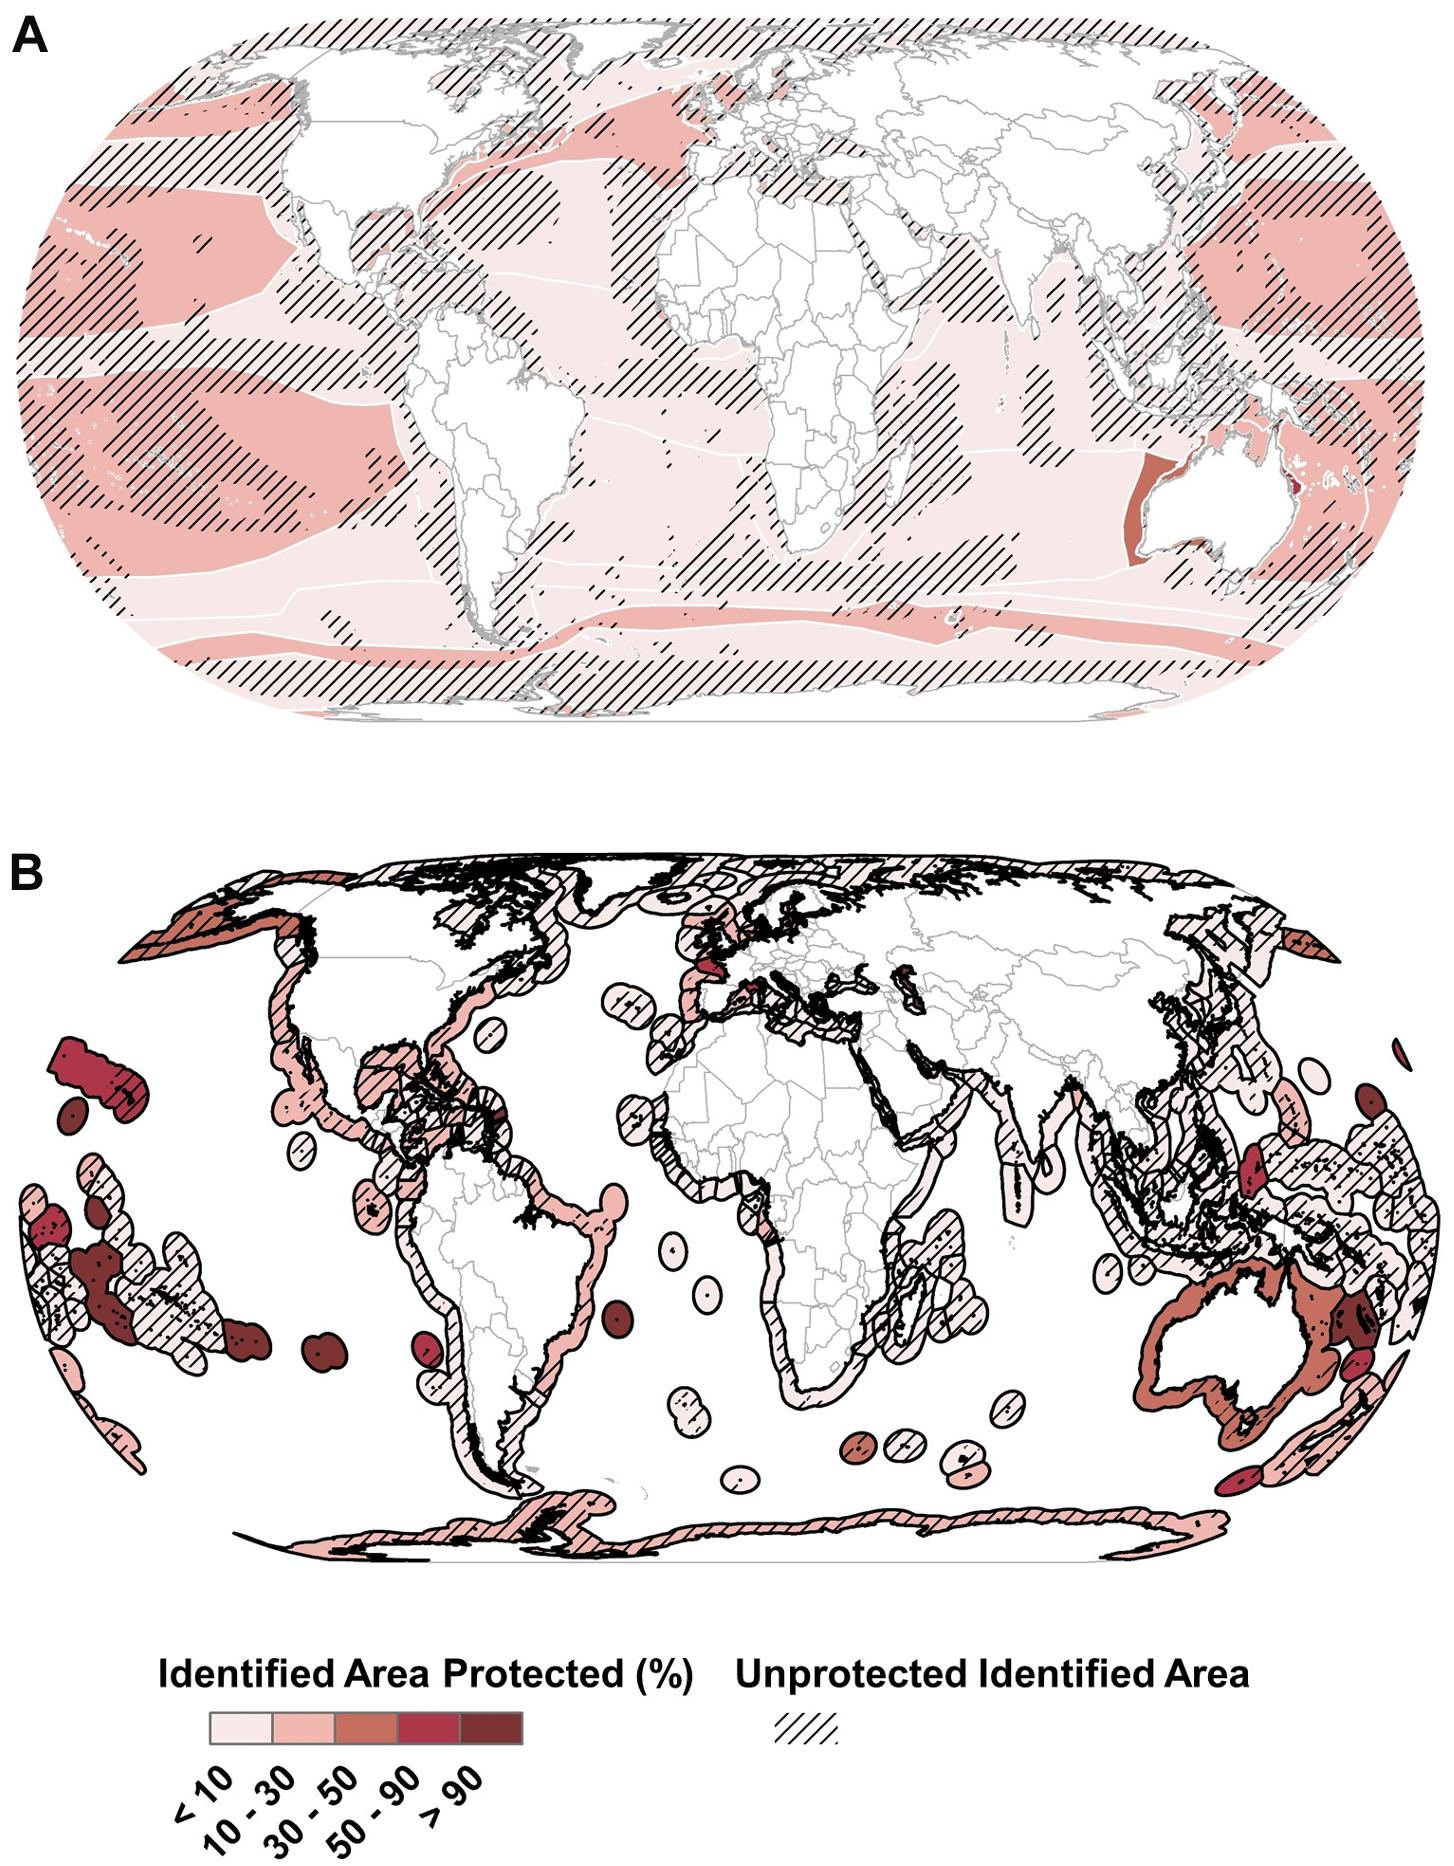
Figure 4. Map showing what percent of area identified as important is currently within a marine protected area by (A) marine province (MEOWs, Marine Ecoregions of the World: Spalding et al., 2007; PPOWs, Pelagic Provinces of the World: Spalding et al., 2012) and (B) Exclusive Economic Zone (EEZs, Exclusive Economic Zones: Flanders Marine Institute, 2018). Areas were identified as important by six United Nations and four non-governmental organization initiatives that vary in purpose and scope. The boundaries of provinces in (A) are outlined in white and of EEZs in (B) are outlined in black; due to the spatial scale of the map, most MEOWs are not discernable. Representativeness, measured as the percent of identified area that was protected within each EEZ or MEOW/PPOW, was low: fewer than a quarter of EEZs and a half of marine provinces had at least 10% of their identified area protected (lightest shade of pink). Every marine province and nearly every EEZ has areas identified as important but not currently protected (hatched area). Countries are displayed using data provided by Natural Earth (Admin 0 Countries 4.1.0; Natural Earth, 2018a).
The EEZs with the largest area identified as important and not yet protected were French Polynesia (4.7 million km2), Indonesia (5.1 million km2), Canada (5.7 million km2), and Russia (6.2 million km2), as well as parts of the 200 nm zone around the continent of Antarctica (7.5 million km2).
Biogeographic Representativeness
Area was identified within every MEOW and PPOW province and had greater coverage in MEOWs (average of 62.8%, range of 0.23–100.00% cover across provinces) than in PPOWs (average of 57.5%, range of 0.44–100.00% cover across provinces). However, because PPOW provinces cover a much larger total area (91.5% of the ocean) than do MEOW provinces, most of the identified area fell within PPOW provinces (86.7% of the total area).
The average area-weighted overlap in identified areas was less than two was less than two for 86 provinces and was three or greater for four provinces: the Mediterranean (PPOW), the Mediterranean Sea (MEOW), Hawaii (MEOW), and the Galápagos (MEOW). Areas identified within MEOW provinces had a greater average overlap (1.63, range of 1.00–6.02 initiatives across provinces) than did those within PPOW provinces (1.37, range of 1.00–3.40 initiatives across provinces).
Areas identified within MEOWs were more likely to be protected (13.1% of total area protected; average of 21.9%, range of 0.00–100.00% across provinces) than those within PPOWs (8.1% of total area protected; average of 6.66%, range of 0.00–49.11% across provinces). Over 50% of the total protected identified area fell within just four provinces, all of which were PPOW provinces (in decreasing order of area: South Central Pacific Gyre, North Central Pacific Gyre, Antarctic, Non-gyral Southwest Pacific); 25% of the total protected identified area was within just one province, the South Central Pacific Gyre.
The only province with 100% protection of the identified area was the Galápagos (MEOW). In contrast, 60 provinces had <10% of their identified area protected, and 16 provinces had <1% of their identified area protected, including seven provinces for which no identified area was protected (PPOW provinces: Black Sea, Benguela Current, Guinea Current, Malvinas Current, North Pacific Transitional, Somali Current; MEOW province: Marquesas) (Figure 4).
Discussion
The past decade has been marked by a growing recognition of the need for enhanced protection of marine ecosystems, including the setting of numerical targets for ocean protection by the CBD Aichi Targets and UN Sustainable Development Goals. Positive and measurable action toward meeting such targets has been made through commitments at global venues such as the Our Oceans Conferences, the UN General Assembly, the CBD Conference of the Parties, and the UN Ocean Conference. A recent study quantified the impact of MPA commitments made at the first four Our Ocean Conferences, showing that over five million km2, or 1.4% more of the ocean, is now in implemented MPAs as a result (Grorud-Colvert et al., 2019).
Despite this progress, concerns have been raised regarding the “perverse outcomes” (Barnes et al., 2018) that can arise from numerical targets. These concerns include how MPA sites are chosen (e.g., protecting areas of low biodiversity value for political expediency) and how they are managed, or not, once they are designated (Watson et al., 2016; Jantke et al., 2018; Rees et al., 2018; Fischer et al., 2019). To meet global conservation goals, protection must be “based on the best available scientific information” (SDG 14.5) and placed in “areas of particular importance for biodiversity and ecosystem services” (Aichi Target 11).
We leveraged the extensive effort that UN and NGO organizations have put into identifying important areas of the ocean to provide a starting point for locating future MPA sites. While the ten initiatives we considered varied greatly in purpose and scope, they do show commonalities. At least five initiatives relied on one or more of the following to identify important areas: presence of threatened species, naturalness, high biodiversity, vulnerability, and/or irreplaceability. These criteria are also commonly used by initiatives to identify important terrestrial areas (e.g., Brooks et al., 2006; Gilman et al., 2011). In general, these initiatives were developed to prioritize limited conservation funding (e.g., Marchese, 2015; Briscoe et al., 2016), though not necessarily to recommend sites for future protected area placement. For example, although originally motivated by a need to identify potential ABNJ MPAs, EBSAs are explicitly described as a “scientific exercise that should not be conflated with any potential management requirements” (Dunn et al., 2014). Regardless, the criteria used by these initiatives highlight regions of high ecological value and/or vulnerability and therefore may inform the MPA selection process (Diz et al., 2018).
Our overlay of these initiatives showed that at least 49% percent of the ocean has been identified as important and is not currently protected (Figure 2). It is encouraging that as the number of overlapping initiatives increased, so did the likelihood that the region was already within an MPA. This protection includes nearly all the areas identified as “high consensus”. Only two-thirds of the current area covered by MPAs falls within regions that have been identified by the ten mapping initiatives; i.e., one-third of the current MPA area is not located within an identified area. Although we did not use maps from academic studies in our overlay, the areas we identified as “high consensus” – including the Galápagos Islands, the Caribbean Sea, Madagascar and the southern tip of Africa, the Mediterranean Sea, and the Coral Triangle – have also been identified by academic studies using diverse approaches and criteria (Selig et al., 2014; Klein et al., 2015; Martin et al., 2015; Jenkins and Van Houtan, 2016; Ramírez et al., 2017; Fischer et al., 2019).
Gaps in Current Protection
We focused our analysis on two major gaps in the current protection of identified marine areas: effectiveness of protection and representativeness of protection.
Effectiveness of Protection
No-take marine reserves are much more effective at achieving conservation goals than are other protected areas (Sala and Giakoumi, 2017; Zupan et al., 2018), yet we found that only 18% of the identified area was within MPAs reported as fully no-take. As a whole, only 2.2% of the ocean is strongly protected within no-take reserves (Marine Conservation Institute, 2019b), which is much lower than the IUCN-recommended level of at least 30% (IUCN, 2016). High-consensus areas were mostly protected on paper, but only 25% of the MPA area in these regions had a reported no-take status in WDPA. Though particularly evident in high-consensus areas, this was generally true for all identified areas; 57% of the total identified area did not have a no-take status and an additional 20% had a no-take status of “some.”
Once an MPA is implemented, regardless of its no-take status, its conservation benefit is contingent on effective management and sustainable financing (Gill et al., 2017; Bohorquez et al., 2019). Factors like local buy-in, management capacity, and cost effectiveness are not part of the process of identifying important marine areas but are necessary considerations when choosing candidate sites for protection (Gilman et al., 2011; Schmitt, 2011). Improvements to and standardization of measures used to track the success of existing MPAs are also urgently needed (Fox et al., 2014; Woodcock et al., 2016; Giakoumi et al., 2018; Scianna et al., 2019). Though several tools exist for tracking effectiveness (e.g., How is your MPA doing? Pomeroy et al., 2004; Management Effectiveness Tracking Tool: Stolton and Dudley, 2016), evaluation of MPAs lags that of terrestrial protected areas (Global Database on Protected Area Management Effectiveness, 2019). Voluntary standards and certification schemes (e.g., IUCN Green List; Global Ocean Refuge System, 2019; IUCN, 2019), similar to Marine Stewardship Council for fisheries, may provide incentive to improve and track management in a greater number of MPAs.
The Galápagos province provides an example of a high-consensus area for which protection could be strengthened (Figure 5). Parts of the Galápagos were identified as important by seven of the ten initiatives we considered (EBSAs, PSSAs, WHS, AZE sites, IBAs, CI Biodiversity Hotspots, and WWF Priority Places). The province is also fully within an MPA, the Galápagos Marine Reserve, which includes subzones for conservation, tourism, and fishing (Castrejón and Charles, 2013). However, the no-take status of this reserve is unreported in WDPA. Ineffective enforcement and a lack of compliance within the reserve have been documented as limiting its ecological benefits (Castrejón and Charles, 2013; Buglass et al., 2018; Moity, 2018) and the reserve does not cover important habitat of several endangered species in the region (Ventura et al., 2019). Therefore, although the Galápagos province is fully covered by an MPA on paper, actual protection of this region appears insufficient.
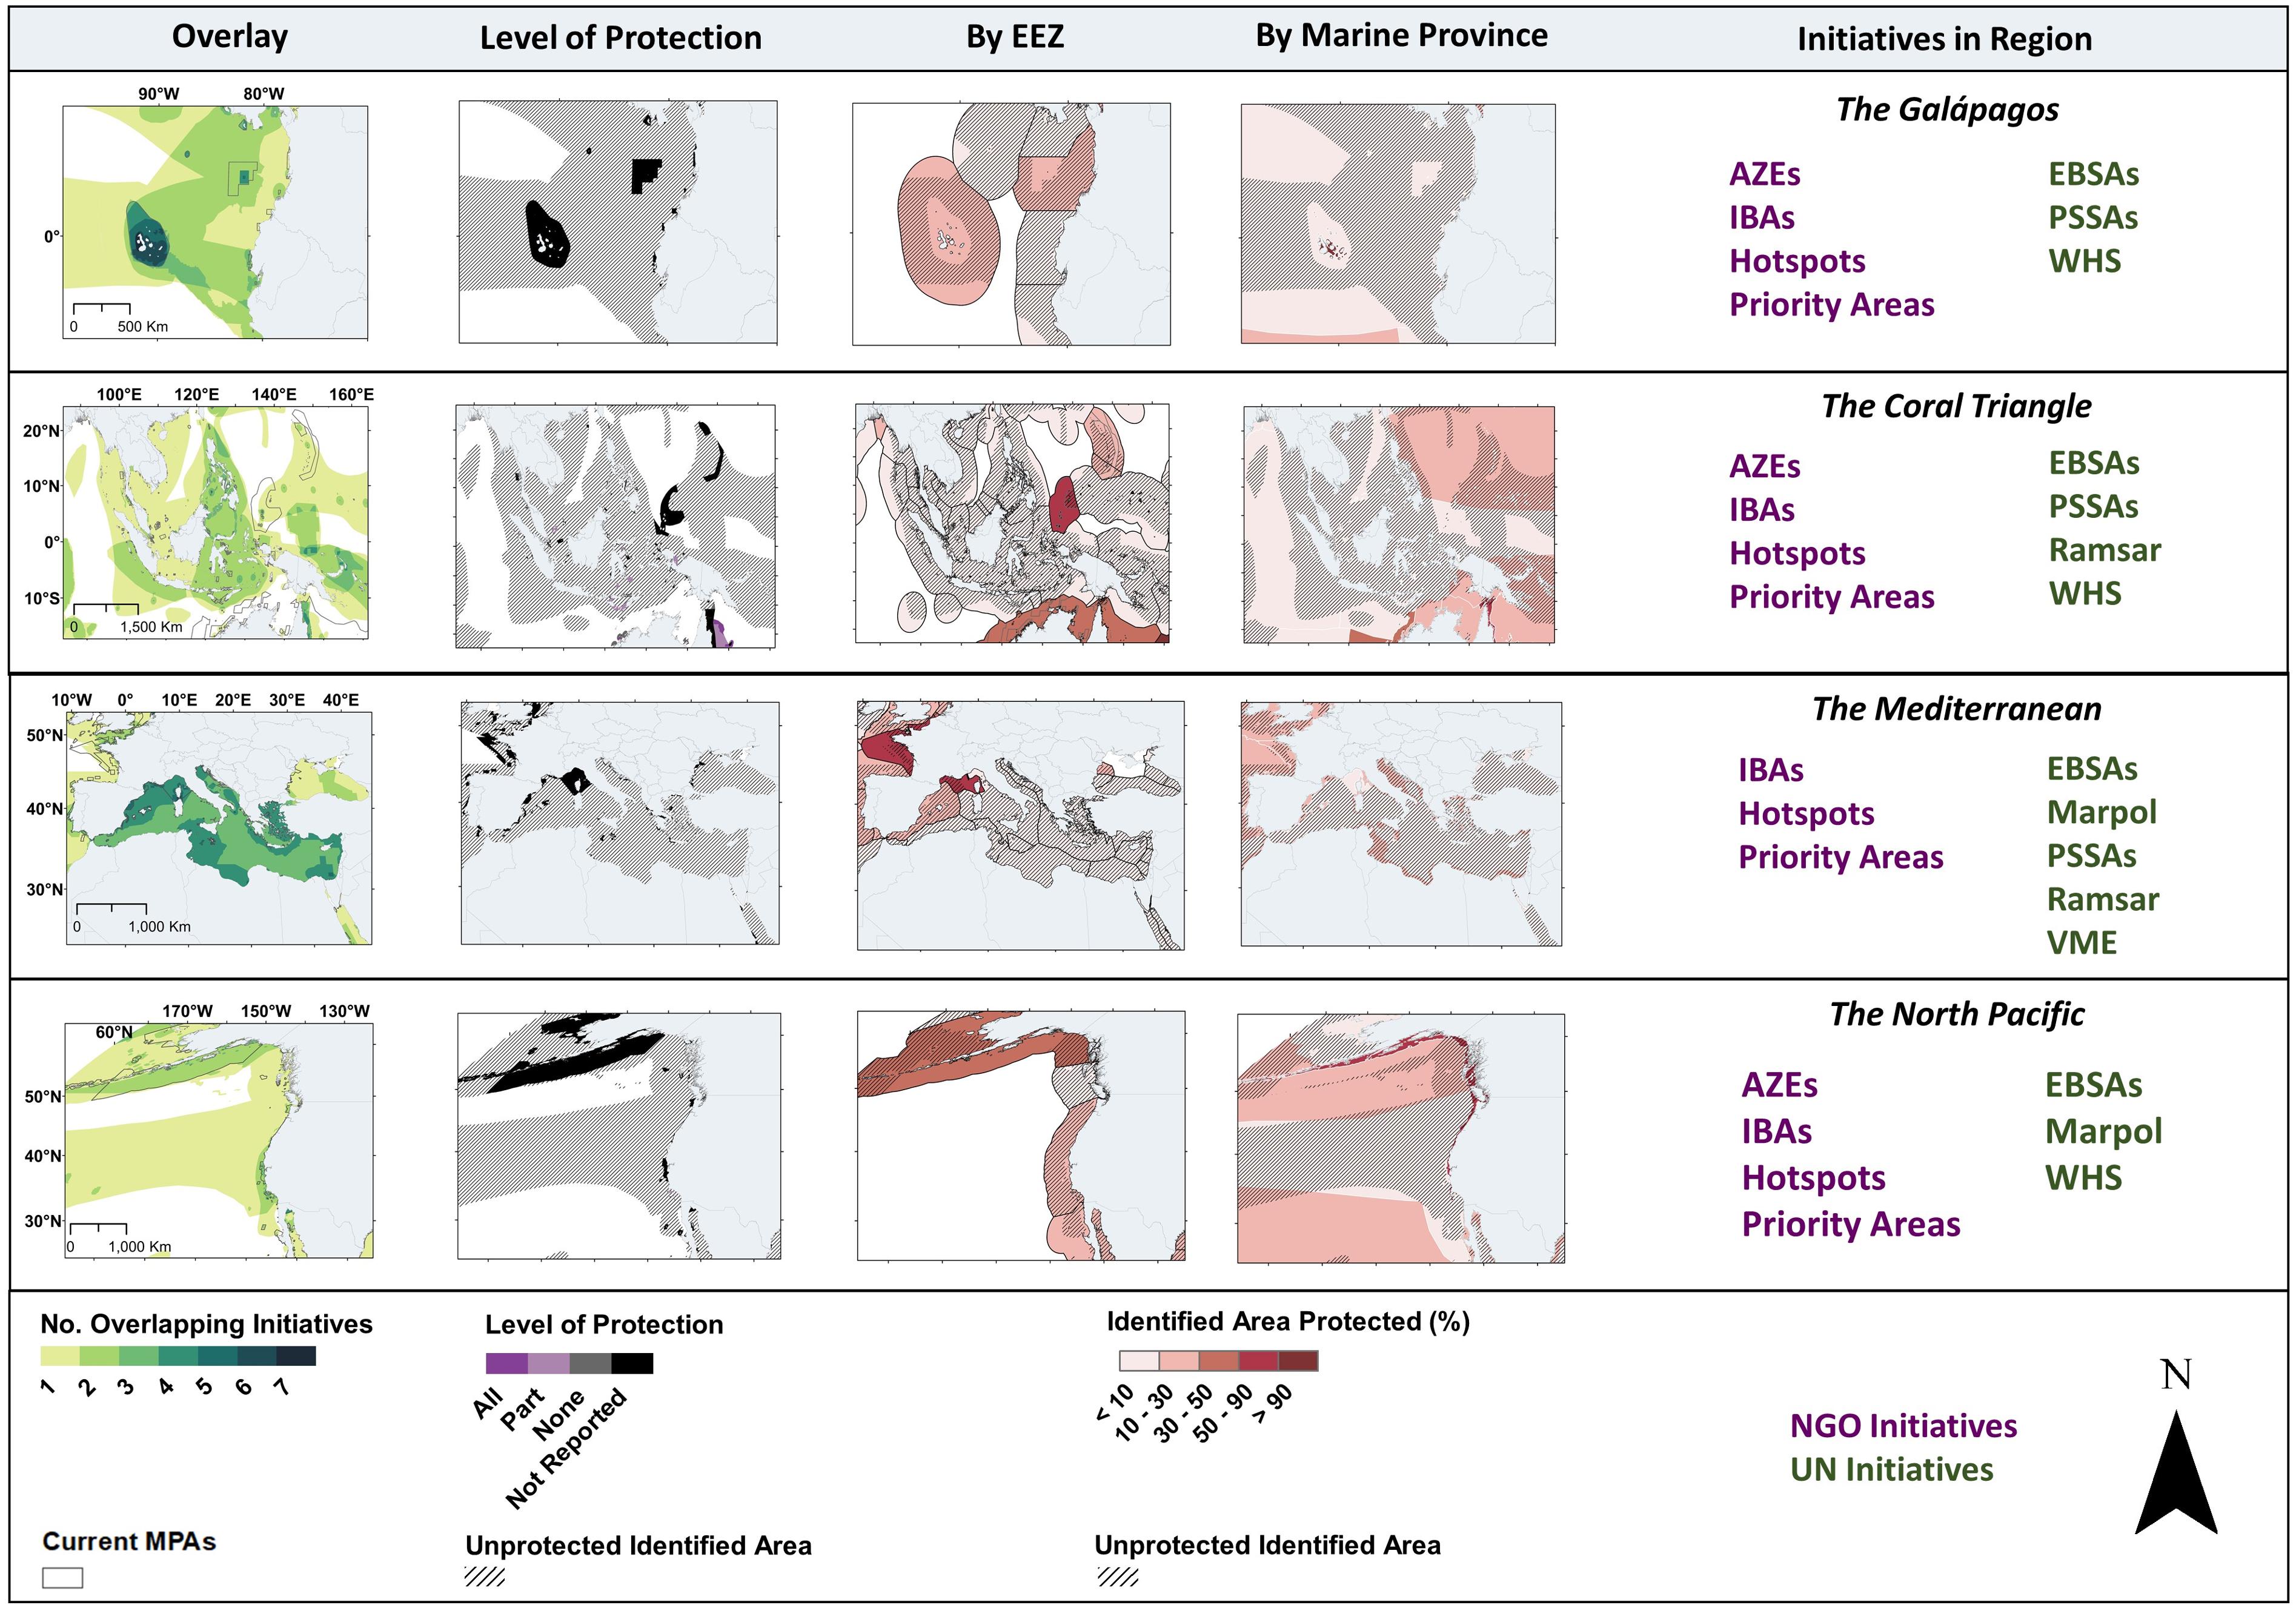
Figure 5. Examples of important marine areas with opportunities for stronger, more representative, and/or more widespread protection. Areas were identified as important by six United Nations and four non-governmental organization initiatives that vary in purpose and scope. For each region, information is provided on the number of overlapping initiatives, on the strength of current protection, on identified areas within marine provinces (MEOWs, Marine Ecoregions of the World; Spalding et al., 2007; PPOWs, Pelagic Provinces of the World: Spalding et al., 2012), and on identified areas within exclusive economic zones (EEZs, Exclusive Economic Zones; Flanders Marine Institute, 2018). Countries are displayed using data provided by Natural Earth (Admin 0 Countries 4.1.0; Natural Earth, 2018a).
Representativeness of Protection
All 99 of the ocean’s provinces contained regions identified as important. However, over 50% of the protected identified area fell within just four provinces and more than half of all provinces had less than 10% of their identified area protected (Figure 4). These findings echo those of recent studies examining representativeness, which show that more than half of marine ecoregions fall short of the 10% protection target (Jantke et al., 2018), protection of the ocean’s remaining wilderness is highly skewed toward a few biogeographic realms (Jones et al., 2018), and the ocean’s geomorphic features and benthic habitat diversity are poorly represented in current MPAs (Fischer et al., 2019). We found similar results when considering representativeness across EEZs, with only a quarter of EEZs protecting at least 10% of their identified area.
Two regions we identified as moderate- to high-consensus with low rates of current protection were the Central Indo-Pacific and the Mediterranean Sea (Figure 5). Regions of the Central Indo-Pacific have been identified by both UN (EBSAs, PSSAs, WHS) and NGO (AZE Sites, CI Hotspots, IBAs) initiatives. Most of the MEOW and PPOW provinces in this region have an area-weighted average overlap of greater than one but protection levels of <5% (e.g., Eastern Coral Triangle, Indonesian Throughflow, Java Transitional). Additionally, several EEZs in the Central Indo-Pacific have <1% of their identified area protected (e.g., East Timorian, Malaysian, Papua New Guinea, Solomon Island EEZs).
The six Coral Triangle countries (Indonesia, Malaysia, Papua New Guinea, Philippines, Solomon Islands, and Timor-Leste), located in the Central Indo-Pacific, have developed their own regional initiative, the Coral Triangle MPA System. This initiative sets targets of protecting 10% of critical marine habitats in no-take reserves and 20% of critical marine habitats in some form of MPA by the year 2020 (White et al., 2014). Our analysis suggests that, according to WDPA’s records, substantial progress must still be made to reach these targets (Figure 5). It is important to note that previous research has demonstrated discrepancies between various global and regional databases tracking Coral Triangle MPAs (White et al., 2014). With the help of regional studies on spatial protection priorities (Asaad et al., 2018a, b), our results can provide guidance on selecting new candidates for protection.
In the Mediterranean, nearshore identified areas have relatively high rates of protection (14.4%) and an area-weighted average overlap of 3.8 (Figure 5). In contrast, deeper waters, which make up most of the Mediterranean and have a high average overlap (3.4), have very low rates of protection (3.6%). Among the many EEZs that fall within the Mediterranean, ten have <1% of their identified area protected. Shortcomings in the Mediterranean network of MPAs have been previously noted, including a low coverage of areas that prohibit all extractive activities (0.1% as of 2016), the predominance of small MPAs (<50 km2), and a lack of effective management (Bastari et al., 2016; Rodríguez-Rodríguez et al., 2016a). However, there is also recognition that large portions of the Mediterranean (∼61% of the total area) are closed to bottom trawling and, while this protection may not currently count toward global conservation targets, it is likely to have ecological benefits (Rodríguez-Rodríguez et al., 2016b).
There is growing interest in management of ABNJ and negotiations are underway to develop legally binding conservation measures for these areas under the United Nations Convention on the Law of the Sea (UNCLOS) (UN General Assembly Resolution 72/249; Heffernan, 2018; Wright et al., 2018; Tiller et al., 2019). A focus of these negotiations is area-based management. To date, ABNJ MPAs have only been possible through sectoral organization designation, including designations by CCAMLR or the Convention for the Protection of the Marine Environment of the North-East Atlantic (the OSPAR Convention) (Smith and Jabour, 2017; Tiller et al., 2019). A unified selection process has been noted as a need for the establishment of ABNJ MPAs (Smith and Jabour, 2017), and our study highlights over 76 million km2 of unprotected ABNJ that have already been identified as important and that can act as a starting point for future deliberations.
Study Caveats
The “best available science” is often imperfect science. Geographic and taxonomic data gaps (Gilman et al., 2011) and other limitations of the initiatives we collated influenced our results. For example, current prioritization initiatives might be missing important regions of the ocean by focusing primarily on species-level diversity, ignoring biodiversity “coldspots” and genetic diversity as a result (Marchese, 2015). We are constantly improving our knowledge of marine ecosystems. Global initiatives to identify important marine regions should therefore be an ongoing process that take these new data and insights into account.
Here, we use the EBSA identification process to illustrate some of these caveats, as this process has been well-documented (Dunn et al., 2014; Bax et al., 2016; Johnson et al., 2018). EBSA workshops rely on the input of a wide range of stakeholders who undergo a pre-workshop training process and collate all relevant global and regional spatial data (Bax et al., 2016). As of early 2018, 291 EBSA workshops had been held around the world (Johnson et al., 2018). The resulting EBSA map is one of the most comprehensive initiatives we considered in our study.
Several regions were excluded in the EBSA process at the request of State parties (e.g., United States EEZ) or because national governments were not represented at workshops (e.g., the Pitcairn Islands) (Johnson et al., 2018). Relevant spatial data were notably lacking in some of the considered regions (e.g., Southern Indian Ocean) or habitats (e.g., pelagic zones) (Johnson et al., 2018). There were several taxonomic groups underrepresented in this process, including corals, elasmobranchs, structure-forming plant habitats, and large cold-blooded reptiles (Johnson et al., 2018). As with other prioritization initiatives, there were also gaps in the types of habitats considered during the identification process (Briscoe et al., 2016). The first map of global mesopelagic biogeographic zones was published less than 2 years ago (Sutton et al., 2017) and will be considered in future EBSA workshops (Johnson et al., 2018). Lastly, IBAs were part of the EBSA decision-making process, leading to some redundancy. IBAs and EBSAs overlapped in 18% of the total area we found to be of moderate or high consensus.
Prioritization initiatives are based on historical abundance information, which is generally collected over a short time period (Gilman et al., 2011). Biodiversity data collected over limited time scales can mislead prioritization in systems that are highly variable over space and time (Piacenza et al., 2015) and do not account for the future state of the ocean. The ocean is changing rapidly due to climate change and other anthropogenic impacts (Halpern et al., 2015; Jones et al., 2018). Although MPAs can increase ecosystem resilience in the face of climate change (Roberts et al., 2017; Sala and Giakoumi, 2017), marine habitats and species are likely to migrate in coming decades as a result of changing ocean conditions (e.g., thermal stress: Fredston-Hermann et al., 2018 but see Davies et al., 2017). Under business-as-usual emissions, sea surface temperature and oxygen concentrations will fluctuate beyond their natural limits by 2050 in 42% of MPAs (Bruno et al., 2018). Climate change may unevenly affect the areas identified by initiatives depending on the criteria used to identify them. For example, in terrestrial systems, criteria related to rarity correlate with how robust “hotspots” are to climate change; this correlation likely exists because regions with stable environments foster specialists, so are more likely to fit these selection criteria (Iwamura et al., 2013).
Lastly, the accuracy of our gap analysis is dependent on timely and accurate reporting to the WDPA by member states. There are often lags between the designation of protected areas and their inclusion in the WDPA, although the length of these lags is decreasing (UNEP-WCMC and IUCN, 2018b). There have been documented issues with under-estimation (Visconti et al., 2013) and over-estimation of some MPAs in the past (Smallhorn-West and Govan, 2018). The process for country reporting to the WDPA can be improved in various ways, but the dataset itself is updated monthly, well managed, and continually being improved. For example, Smallhorn-West and Govan (2018) raised concerns about the overreporting of Tonga’s MPA coverage. The country’s MPA area represented in the WDPA subsequently decreased from over 10,000 km2 in January 2018 to 35 km2 in January 2019 (Smallhorn-West and Govan, 2018).
We did not consider proposed MPAs, i.e., sites for which policymakers have announced their intent to designate an MPA, in our gap analysis. MPA pledges currently identified by the WDPA (as of March 2019) account for 7.4% of the global ocean, in addition to the 7.6% of the ocean that exists in MPAs that are already implemented. Spatial data do not yet exist for most proposed MPAs. However, the Marine Conservation Institute (2019a) provides a general map of regions with ongoing campaigns seeking additional protection. Several of these campaigns fall in regions revealed to be of moderate- or high-consensus in our analysis, including regions in the Mediterranean, in the Coral Triangle, in the Caribbean, surrounding Madagascar, and along the coasts of Chile and Argentina (Marine Conservation Institute, 2019a).
Next Steps
The initiatives we considered varied greatly in purpose and scope, but all relied on specific criteria and expert review processes to identify important areas (e.g., Dunn et al., 2014; Diz et al., 2018). Even areas identified by one initiative (40% of the ocean) could provide an opportunity for regional efforts to identify new MPAs. Additionally, 14.5% of the ocean (52.5 million km2) has consensus among two to four initiatives, and most of this area remains unprotected (Figure 2). To identify new MPA sites, however, our overlay map must first be refined for smaller geographic scales using data collected at higher spatial resolution.
Much of the area identified lies within contiguous stretches of >100,000 km2; it is unrealistic to propose that all this area be protected. Because these areas are large, however, they provide flexibility in adding to a global network of small and large MPAs to meet the following criteria: representativeness, replication, ecological connectivity, size, and refugia from climate change-related effects (Gilman et al., 2011; Green et al., 2014). Furthermore, nearly every EEZ and biogeographic province has area identified as important but not currently protected. Regions we identified as moderate consensus, i.e., areas with agreement among two to four mapping initiatives, are of particular interest. In some cases, these regions lie in areas dominated by one EEZ (e.g., the Madagascan EEZ). In many cases they occur in areas consisting of several EEZs, which could provide opportunities for regional collaboration toward ocean conservation.
In some of the large identified areas, large MPAs would be difficult to enforce or have excessively negative socioeconomic impacts, so networks of small MPAs would be the most ecologically beneficial (e.g., in the Coral Triangle: Walton et al., 2014). Our overlay map would need to be combined with detailed information on the movement patterns of species in the region to guide MPA size, shape, location, and spacing (e.g., Green et al., 2014; Munguia-Vega et al., 2018). For example, movement distances across 210 species of coral reef fish range from less than 0.5 km to greater than 1,000 km (Green et al., 2015).
Large MPAs, which are not without criticism (Leenhardt et al., 2013), can complement networks of small MPAs because they provide unique benefits such as buffering against uncertainty, especially in the case of climate change-induced shifts in species’ ranges (Davies et al., 2017; O’Leary et al., 2018). Large MPAs are likely to be most appropriate in pelagic habitats, where they can benefit highly migratory species (Davies et al., 2018) and provide protection of oft-ignored oceanographic features like fronts and eddies (Briscoe et al., 2016). For example, Harrison et al. (2018) found that 18 migratory species collectively visited EEZs of 37 separate countries within the Pacific Ocean and that nearly half of all individuals tracked spent time in ABNJ. Two of the largest identified areas we found were located in the Pacific Ocean (Figure 5) and, when combined with other data (e.g., Tagging of Pelagic Predators project1), could be used to identify new candidates for large-scale MPAs.
In the case of either MPA networks or large-scale MPAs, analyses such as ours cannot account for regional complexities associated with MPA designation and management, as alluded to in our examples of the Galápagos, Coral Triangle, and Mediterranean. On-the-ground realities of how marine areas are used will be important when considering where to designate new MPAs and how to protect areas of high ecological value. However, the global MPA network is rapidly changing, and the map resulting from our analysis can act as an immediate starting point for systematic conservation planning (Margules and Pressey, 2000; Ban et al., 2009; Watts et al., 2017). For example, “From the Vision to the Ground” is a guide produced by WWF (Loucks et al., 2004) that outlines the steps that should be taken to scale global conservation initiatives down to the landscape level. This process includes mapping social landscapes and working with a diverse set of stakeholders to develop conservation plans (Loucks et al., 2004).
Conclusion
It is imperative that protected areas be based on the best science available, and this sentiment is contained in ocean protection targets. Over the past two decades, various UN and NGO groups have put substantial effort into identifying areas of the ocean that warrant special consideration. As nations and international bodies seek to achieve numerical protection targets, they will look to the resulting maps for guidance. Our study was conceived after discussions with policy makers who requested direction on how to reconcile multiple global maps. While further information will need to be incorporated at national and regional scales to identify MPA sites and networks, we hope that the mapping overlay presented here will provide valuable insights into where there are already areas of consensus and opportunity.
Data Availability Statement
The spatial data resulting from this study are available on request to the corresponding author. The spatial data used as inputs to the study can be found online or by contacting the organization that created the data. Links to the input data sources can be found in Supplementary Appendix S3: Supplementary Table S1.
Author Contributions
EP conceived of the study. NG conducted the data analysis. EP, CS, and JD provided guidance and feedback on data analysis. NG, EP, CS, and JD wrote and revised the manuscript. EP and CS obtained funding for the work.
Funding
Our study was made possible by the generous support of the Italian Ministry of the Environment and the Ocean Sanctuary Alliance.
Conflict of Interest
The authors declare that the research was conducted in the absence of any commercial or financial relationships that could be construed as a potential conflict of interest.
Acknowledgments
We thank K. P. Wellington and M. Grima for providing technical support for this project. The two reviewers provided valuable feedback on the interpretation of our results. Our research was greatly informed by discussions with diplomats and scientists at the Rome Conference on Marine Protected Areas (March 2016), at the United Nations Oceans Conference (June 2017), and at the Fifth International Marine Conservation Congress (June 2018). We thank L. Morgan in particular for providing recommendations on additional analyses that strengthened our manuscript. The Rome Conference on Marine Protected Areas was co-convened by the Italian Ministry of Foreign Affairs, the Mission of Italy to the United Nations, UN Environment Programme, and the Ocean Sanctuary Alliance and we are grateful for the support of this activity, which led to initiation of the current study. We thank the curators of the spatial data we relied on for our analysis, including the World Database on Protected Areas, the ten United Nations and intergovernmental initiatives we collated, and spatial data on political and biogeographic boundaries.
Supplementary Material
The Supplementary Material for this article can be found online at: https://www.frontiersin.org/articles/10.3389/fmars.2019.00650/full#supplementary-material
Footnotes
References
Aalto, E. A., Micheli, F., Boch, C. A., Espinoza Montes, J. A., Woodson, C. B., and De Leo, G. A. (2019). Catastrophic mortality, Allee effects, and marine protected areas. Am. Nat. 193, 391–408. doi: 10.1086/701781
Asaad, I., Lundquist, C. J. L., Erdmann, M. V., and Costello, M. J. (2018a). Delineating priority areas for marine biodiversity conservation in the Coral Triangle. Biol. Conserv. 222, 198–211. doi: 10.3390/ijerph120201069
Asaad, I., Lundquist, C. J. L., Erdmann, M. V. E., Hooidonk, V., Van Hooidonk, R., and Costello, M. J. (2018b). Designating spatial priorities for marine biodiversity conservation in the Coral Triangle. Front. Mar. Sci. 5:400. doi: 10.3389/fmars.2018.00400
Ban, N. C., Davies, T. E., Aguilera, S. E., Brooks, C., Cox, M., Epstein, G., et al. (2017). Social and ecological effectiveness of large marine protected areas. Global Environ. Chang. 43, 82–91. doi: 10.1371/journal.pone.0050074
Ban, N. C., Hansen, G. J., Jones, M., and Vincent, A. C. (2009). Systematic marine conservation planning in data-poor regions: socioeconomic data is essential. Mar. Policy 33, 794–800. doi: 10.1016/j.marpol.2009.02.011
Barnes, M. D., Glew, L., Wyborn, C., and Craigie, I. D. (2018). Prevent perverse outcomes from global protected area policy. Nat. Ecol. Evol. 2, 759–762. doi: 10.1038/s41559-018-0501-y
Bastari, A., Micheli, F., Ferretti, F., Pusceddu, A., and Cerrano, C. (2016). Large marine protected areas (LMPAs) in the Mediterranean Sea: the opportunity of the Adriatic Sea. Mar. Policy 68, 165–177. doi: 10.1016/j.marpol.2016.03.010
Bax, N. J., Cleary, J., Donnelly, B., Dunn, D. C., Dunstan, P. K., Fuller, M., et al. (2016). Results of efforts by the convention on biological diversity to describe ecologically or biologically significant marine areas. Conserv. Biol. 30, 571–581. doi: 10.1111/cobi.12649
Bennett, N., and Dearden, P. (2012). From outcomes to inputs: what is required to achieve the ecological and socioeconomic potential of marine protected areas? Mar. Policy 50, 96–110. doi: 10.1016/j.marpol.2014.05.005
Bohorquez, J., Dvarskas, A., and Pikitch, E. K. (2019). Filling the data gap - a pressing need for advancing MPA sustainable finance. Front. Mar. Sci. 6:45. doi: 10.3389/fmars.2019.00045
Briscoe, D. K., Maxwell, S. M., Kudela, R., Crowder, L. B., and Croll, D. (2016). Are we missing important areas in pelagic marine conservation? Redefining conservation hotspots in the ocean. Endanger. Species Res. 29, 229–237. doi: 10.3354/esr00710
Brooks, T. M., Mittermeier, R. A., da Fonseca, G. A., Gerlach, J., Hoffmann, M., Lamoreux, J. F., et al. (2006). Global biodiversity conservation priorities. Science 313, 58–61.
Bruno, J. F., Bates, A. E., Cacciapaglia, C., Pike, E. P., Amstrup, S. C., van Hooidonk, R., et al. (2018). Climate change threatens the world’s marine protected areas. Nat. Clim. Chang. 8, 499–503. doi: 10.1038/s41558-018-0149-2
Buglass, S., Reyes, H., Ramirez-González, J., Eddy, T. D., Salinas-de-León, P., and Jarrin, J. M. (2018). Evaluating the effectiveness of coastal no-take zones of the Galápagos marine reserve for the red spiny lobster, Panulirus penicillatus. Mar. Policy 88, 204–212. doi: 10.1016/j.marpol.2017.11.028
Campbell, L. M., and Gray, N. J. (2019). Area expansion versus effective and equitable management in international marine protected areas goals and targets. Mar. Policy 100, 192–199. doi: 10.1016/j.marpol.2018.11.030
Castrejón, M., and Charles, A. (2013). Improving fisheries co-management through ecosystem-based spatial management: the Galápagos marine reserve. Mar. Policy 38, 235–245. doi: 10.1016/j.marpol.2012.05.040
CBD, (2008). “Decision adopted by the conference of the parties to the convention on biological diversity at its ninth meeting. UNEP/CBD/COP/DEC/IX/20,” in Proceedings of the 9th Meeting on Conference of the Parties to the Convention on Biological Diversity, Bonn.
CBD, (2016). “Protected areas: facilitating achievement of aichi biodiversity targets 11. UNEP/CBD/SBSTTA/20/INF/43,” in Procedings of the Convention on Biological Diversity Subsidiary Body on Scientific, Technical, and Technological Advice, Montreal.
da Silva, A. P. (2019). Brazilian large-scale marine protected areas: other “paper parks”? Ocean Coast. Manag. 169, 104–112. doi: 10.1016/j.ocecoaman.2018.12.012
Davies, T., Maxwell, S., Kaschner, K., Garilao, C., and Ban, N. (2017). Large marine protected areas represent biodiversity now and under climate change. Sci. Rep. 7:9569. doi: 10.1038/s41598-017-08758-5
Davies, T. E., Epstein, G., Aguilera, S. E., Brooks, C. M., Cox, M., Evans, L. S., et al. (2018). Assessing trade-offs in large marine protected areas. PLoS one 13:e0195760. doi: 10.1371/journal.pone.0195760
Delafontaine, M., Nolf, G., Van de Weghe, N., Antrop, M., and de Maeyer, P. (2009). Assessment of sliver polygons in geographical vector data. Int. J. Geograph. Inform. Sci. 23, 719–735. doi: 10.1080/13658810701694838
Diz, D., Johnson, D., Riddell, M., Rees, S., Battle, J., Gjerde, K., et al. (2018). Mainstreaming marine biodiversity into the SDGs: the role of other effective area-based conservation measures (SDG 14.5). Mar. Policy 93, 251–261. doi: 10.1016/j.marpol.2017.08.019
Dunn, D. C., Ardron, J., Bax, N., Bernal, P., Cleary, J., Cresswell, I., et al. (2014). The convention on biological diversity’s ecologically or biologically significant areas: origins, development, and current status. Mar. Policy 49, 137–145. doi: 10.1371/journal.pone.0171591
Edgar, G. J., Stuart-Smith, R. D., Willis, T. J., Kininmonth, S., Baker, S. C., Banks, S., et al. (2014). Global conservation outcomes depend on marine protected areas with five key features. Nature 506, 216–220. doi: 10.1038/nature13022
Fischer, A., Bhakta, D., Macmillan-Lawler, M., and Harris, P. (2019). Existing global marine protected area network is not representative or comprehensive measured against seafloor geomorphic features and benthic habitats. Ocean Coast. Manag. 167, 176–187. doi: 10.1016/j.ocecoaman.2018.10.001
Flanders Marine Institute, (2018). EEZ Boundaries. [Online]. Available at: http://www.marineregions.org (accessed April 20, 2019).
Fletcher, R., Scrimgeour, R., Rogalla von Bieberstein, K., Barritt, E., Gjerde, K., Hazin, C., et al. (2017). Biodiversity Beyond National Jurisdiction: Legal Options for a New International Agreement. Cambridge: UNEP-WCMC.
Fox, H. E., Holtzman, J. L., Haisfield, K. M., McNally, C. G., Cid, G. A., Mascia, M. B., et al. (2014). How are our MPAs doing? Challenges in assessing global patterns in marine protected area performance. Coast. Manag. 42, 207–226. doi: 10.1080/08920753.2014.904178
Fredston-Hermann, A., Gaines, S. D., and Halpern, B. S. (2018). Biogeographic constraints to marine conservation in a changing climate. Ann. N. Y. Acad. Sci. 1429, 5–17. doi: 10.1111/nyas.13597
Giakoumi, S., McGowan, J., Mills, M., Beger, M., Bustamante, R., Charles, A., et al. (2018). Revisiting “success” and “failure” of marine protected areas: a conservation scientist perspective. Front. Mar. Sci. 5:223. doi: 10.3389/fmars.2018.00223
Gill, D. A., Mascia, M. B., Ahmadia, G. N., Glew, L., Lester, S. E., Barnes, M., et al. (2017). Capacity shortfalls hinder the performance of marine protected areas globally. Nature 543, 665–669. doi: 10.1038/nature21708
Gilman, E., Dunn, D., Read, A., Hyrenbach, K. D., and Warner, R. (2011). Designing criteria suites to identify discrete and networked sites of high value across manifestations of biodiversity. Biodivers. Conserv. 20, 3363–3383. doi: 10.1007/s10531-011-0116-y
Global Database on Protected Area Management Effectiveness, (2019). GD-Pame. [Online]. Available at: pame.protectedplanet.net (accessed March 12, 2019).
Global Ocean Refuge System, (2019). GLORES. [Online]. Available at: https://globaloceanrefuge.org/ (accessed (June 23, 2019).
Green, A. L., Fernandes, L., Almany, G., Abesamis, R., McLeod, E., Aliño, P. M., et al. (2014). Designing marine reserves for fisheries management, biodiversity conservation, and climate change adaptation. Coast. Manag. 42, 143–159. doi: 10.1080/08920753.2014.877763
Green, A. L., Maypa, A. P., Almany, G. R., Rhodes, K. L., Weeks, R., Abesamis, R. A., et al. (2015). Larval dispersal and movement patterns of coral reef fishes, and implications for marine reserve network design. Biol. Rev. 90, 1215–1247. doi: 10.1111/brv.12155
Grorud-Colvert, K., Constant, V., Sullivan-Stack, J., Dziedzic, K., Hamilton, S. L., Randell, Z., et al. (2019). High-profile international commitments for ocean protection: empty promises or meaningful progress? Mar. Policy 105, 52–66. doi: 10.1016/j.marpol.2019.04.003
Halpern, B. S., Frazier, M., Potapenko, J., Casey, K. S., Koenig, K., Longo, C., et al. (2015). Spatial and temporal changes in cumulative human impacts on the world’s ocean. Nat. Commun. 6:7615. doi: 10.1038/ncomms8615
Harrison, A.-L., Costa, D. P., Winship, A. J., Benson, S. R., Bograd, S. J., Antolos, M., et al. (2018). The political biogeography of migratory marine predators. Nat. Ecol. Evol. 2, 1571–1578. doi: 10.1038/s41559-018-0646-8
Heffernan, O. (2018). How to save the high seas. Nature 557, 154–156. doi: 10.1038/d41586-018-05079-z
High Seas Alliance, (2019). High Seas Alliance. [Online]. Available at: http://www.highseasalliance.org/ (accessed June 27, 2019).
Honeycutt, D. (2012). More Adventures in Overlay: Counting Overlapping Polygons With Spaghetti and Meatballs. [Online]. Available at: https://www.esri.com/arcgis-blog/products/arcgis-desktop/analytics/more-adventures-in-overlay-counting-overlapping-polygons-with-spaghetti-and-meatballs/ (accessed February 21, 2018).
International Maritime Organization [IMO] (2002). Guidelines for the designation of special areas under MARPOL 73/78 and guidelines for the identification and designation of particularly sensitive sea areas. Resolution A.927(22). London: IMO, 22.
IUCN (2016). Increasing Marine Protected Area Coverage for Effective Marine Biodiversity Conservation. Resolution WCC-2016-Red-050-EN. Hawai’i: International Union for Conservation of Nature.
IUCN (2019). IUCN Green List of Protected and Conserved Areas [Online]. Available at: https://www.iucn.org/theme/protected-areas/our-work/iucn-green-list-protected-and-conserved-areas (accessed June 23, 2019).
Iwamura, T., Guisan, A., Wilson, K. A., and Possingham, H. P. (2013). How robust are global conservation priorities to climate change? Glob. Environ. Change 23, 1277–1284. doi: 10.1016/j.gloenvcha.2013.07.016
Jantke, K., Jones, K. R., Allan, J. R., Chauvenet, A. L., Watson, J. E., and Possingham, H. P. (2018). Poor ecological representation by an expensive reserve system: evaluating 35 years of marine protected area expansion. Conserv. Lett. 11:e12584. doi: 10.1111/conl.12584
Jenkins, C. N., and Van Houtan, K. S. (2016). Global and regional priorities for marine biodiversity protection. Biol. Conserv. 204, 333–339. doi: 10.1016/j.biocon.2016.10.005
Jenny, B., Šavrič, B., Arnold, N. D., Marston, B. E., and Preppernau, C. A. (2017). “A guide to selecting map projections for world and hemisphere maps,” in Choosing a Map Projection, eds M. Lapaine, and E. L. Usery, (New York, NY: Springer), 213–228. doi: 10.1007/978-3-319-51835-0_9
Johnson, D. E., Froján, C. B., Turner, P. J., Weaver, P., Gunn, V., Dunn, D. C., et al. (2018). Reviewing the EBSA process: improving on success. Mar. Policy 88, 75–85. doi: 10.1016/j.marpol.2017.11.014
Jones, K. R., Klein, C. J., Halpern, B. S., Venter, O., Grantham, H., Kuempel, C. D., et al. (2018). The location and protection status of Earth’s diminishing marine wilderness. Curr. Biol. 28, 2506–2512.
Klein, C. J., Brown, C. J., Halpern, B. S., Segan, D. B., McGowan, J., Beger, M., et al. (2015). Shortfalls in the global protected area network at representing marine biodiversity. Sci. Rep. 5:17539. doi: 10.1038/srep17539
Laffoley, D., and Freestone, D. (2017). A world of difference-opportunities for applying the 1972 world heritage convention to the high seas. Aquat. Conserv.: Mar. Freshwat. Ecosyst. 27, 78–88. doi: 10.1002/aqc.2813
Leenhardt, P., Cazalet, B., Salvat, B., Claudet, J., and Feral, F. (2013). The rise of large-scale marine protected areas: conservation or geopolitics? Ocean Coast. Manag. 85, 112–118. doi: 10.1016/j.ocecoaman.2013.08.013
Loucks, C., Springer, J., Palminteri, S., Morrison, J., and Strand, H. (2004). From the Vision to the Ground: a Guide to Implementing Ecoregion Conservation in Priority Areas. Washington, DC: World Wildlife Fund.
Mace, G. M., Balmford, A., Boitani, L., Cowlishaw, G., Dobson, A. P., Faith, D., et al. (2000). It’s time to work together and stop duplicating conservation effort. Nature 405:393. doi: 10.1038/35013247
Marchese, C. (2015). Biodiversity hotspots: a shortcut for a more complicated concept. Glob. Ecol. Conserv. 3, 297–309. doi: 10.1016/j.gecco.2014.12.008
Marine Conservation Institute, (2019b). MPAtlas [Online]. Seattle, WA: Marine Conservation Institute.
Marine Conservation Institute (2019a). Current Proposals [Online]. Seattle, WA: Marine Conservation Institute.
Martin, C., Tolley, M., Farmer, E., Mcowen, C., Geffert, J., Scharlemann, J., et al. (2015). A global map to aid the identification and screening of critical habitat for marine industries. Mar. Policy 53, 45–53. doi: 10.1016/j.marpol.2014.11.007
Mellin, C., Aaron MacNeil, M., Cheal, A. J., Emslie, M. J., and Julian Caley, M. (2016). Marine protected areas increase resilience among coral reef communities. Ecol. Lett. 19, 629–637. doi: 10.1111/ele.12598
Mittermeier, R. A., Turner, W. R., Larsen, F. W., Brooks, T. M., and Gascon, C. (2011). “Global biodiversity conservation: the critical role of hotspots,” in Biodiversity Hotspots, eds F. E. Zachos, and J. C. Habel, (Berlin: Springer), 3–22. doi: 10.1007/978-3-642-20992-5_1
Moity, N. (2018). Evaluation of no-take zones in the Galápagos marine reserve, zoning plan 2000. Front. Mar. Sci. 5:244. doi: 10.3389/fmars.2018.00244
Munguia-Vega, A., Green, A. L., Suarez-Castillo, A. N., Espinosa-Romero, M. J., Aburto-Oropeza, O., Cisneros-Montemayor, A. M., et al. (2018). Ecological guidelines for designing networks of marine reserves in the unique biophysical environment of the Gulf of California. Rev. Fish Biol. Fish. 28, 749–776. doi: 10.1007/s11160-018-9529-y
Myers, N., Mittermeier, R. A., Mittermeier, C. G., Da Fonseca, G. A., and Kent, J. (2000). Biodiversity hotspots for conservation priorities. Nature 403, 853–858. doi: 10.1038/35002501
Natural Earth, (2018b). Ocean Version 4.1.0 [Online]. Available at: https://www.naturalearthdata.com/downloads/10m-physical-vectors/10m-ocean/ (accessed May 21, 2018).
Natural Earth (2018a). Admin 0 - Countries Version 4.1.0 [Online]. Available at: https://www.naturalearthdata.com/downloads/110m-cultural-vectors/110m-admin-0-countries/ (accessed May 21, 2018).
O’Leary, B. C., Ban, N. C., Fernandez, M., Friedlander, A. M., García-Borboroglu, P., Golbuu, Y., et al. (2018). Addressing criticisms of large-scale marine protected areas. Bioscience 68, 359–370. doi: 10.1093/biosci/biy021
O’Leary, B. C., Winther-Janson, M., Bainbridge, J. M., Aitken, J., Hawkins, J. P., and Roberts, C. M. (2016). Effective coverage targets for ocean protection. Conserv. Lett. 9, 398–404. doi: 10.1111/conl.12247
Piacenza, S. E., Thurman, L. L., Barner, A. K., Benkwitt, C. E., Boersma, K. S., Cerny-Chipman, E. B., et al. (2015). Evaluating temporal consistency in marine biodiversity hotspots. PLoS One 10:e0133301. doi: 10.1371/journal.pone.0133301
Pomeroy, R. S., Parks, J. E., and Watson, L. M. (2004). How is Your MPA Doing? A Guidebook of Natural and Social Indicators for Evaluating Marine Protected Area Management Effectiveness. Gland: IUCN.
Ramírez, F., Afán, I., Davis, L. S., and Chiaradia, A. (2017). Climate impacts on global hot spots of marine biodiversity. Sci. Adv. 3:e1601198. doi: 10.1126/sciadv.1601198
Rees, S. E., Foster, N. L., Langmead, O., Pittman, S., and Johnson, D. E. (2018). Defining the qualitative elements of aichi biodiversity target 11 with regard to the marine and coastal environment in order to strengthen global efforts for marine biodiversity conservation outlined in the United Nations sustainable development goal 14. Mar. Policy 93, 241–250. doi: 10.1016/j.marpol.2017.05.016
Roberts, C. M., McClean, C. J., Veron, J. E., Hawkins, J. P., Allen, G. R., McAllister, D. E., et al. (2002). Marine biodiversity hotspots and conservation priorities for tropical reefs. Science 295, 1280–1284. doi: 10.1126/science.1067728
Roberts, C. M., O’Leary, B. C., McCauley, D. J., Cury, P. M., Duarte, C. M., Lubchenco, J., et al. (2017). Marine reserves can mitigate and promote adaptation to climate change. Proc. Natl. Acad. Sci. U.S.A. 114, 6167–6175. doi: 10.1073/pnas.1701262114
Roberts, J., Chircop, A., and Prior, S. (2010). Area-based management on the high seas: possible application of the IMO’s particularly sensitive sea area concept. J. Mar. Coast. Law 25, 483–522. doi: 10.1163/157180810x525403
Rodríguez-Rodríguez, D., Merkohasanaj, M., and López, I. (2019). Social and economic sustainability of multiple-use marine protected areas in Spain: a mixed methods, multi-scale study. Ocean Coast. Manag. 171, 47–55. doi: 10.1016/j.ocecoaman.2019.01.013
Rodríguez-Rodríguez, D., Rodríguez, J., and Malak, D. A. (2016a). Development and testing of a new framework for rapidly assessing legal and managerial protection afforded by marine protected areas: mediterranean Sea case study. J. Environ. Manag. 167, 29–37. doi: 10.1016/j.jenvman.2015.11.016
Rodríguez-Rodríguez, D., Rodríguez, J., Malak, D. A., Nastasi, A., and Hernández, P. (2016b). Marine protected areas and fisheries restricted areas in the Mediterranean: assessing “actual” marine biodiversity protection coverage at multiple scales. Mar. Policy 64, 24–30. doi: 10.1016/j.marpol.2015.11.006
Sala, E., and Giakoumi, S. (2017). No-take marine reserves are the most effective protected areas in the ocean. ICES J. Mar. Sci. 75, 1166–1168. doi: 10.1371/journal.pone.0096028
Sala, E., Lubchenco, J., Grorud-Colvert, K., Novelli, C., Roberts, C., and Sumaila, U. R. (2018). Assessing real progress towards effective ocean protection. Mar. Policy 91, 11–13. doi: 10.1016/j.marpol.2018.02.004
Šavrič, B., Jenny, B., and Jenny, H. (2016). Projection wizard–An online map projection selection tool. Cartogr. J. 53, 177–185. doi: 10.1080/00087041.2015.1131938
Schmitt, C. B. (2011). “A tough choice: approaches towards the setting of global conservation priorities,” in Biodiversity Hotspots, eds F. E. Zachos, and J. C. Habel, (Berlin: Springer), 23–42. doi: 10.1007/978-3-642-20992-5_2
Schmitt, C. B., Burgess, N. D., Coad, L., Belokurov, A., Besançon, C., Boisrobert, L., et al. (2009). Global analysis of the protection status of the world’s forests. Biol. Conserv. 142, 2122–2130.
Scianna, C., Niccolini, F., Giakoumi, S., Di Franco, A., Gaines, S., Bianchi, C. N., et al. (2019). Organization science improves management effectiveness of marine protected areas. J. Environ. Manag. 240, 285–292. doi: 10.1016/j.jenvman.2019.03.052
Selig, E. R., Turner, W. R., Troëng, S., Wallace, B. P., Halpern, B. S., Kaschner, K., et al. (2014). Global priorities for marine biodiversity conservation. PLoS One 9:e82898. doi: 10.1371/journal.pone.0082898
Smallhorn-West, P., and Govan, H. (2018). Towards reducing misrepresentation of national achievements in marine protected area targets. Mar. Policy 97, 127–129. doi: 10.1016/j.marpol.2018.05.031
Smith, D., and Jabour, J. (2017). MPAs in ABNJ: lessons from two high seas regimes. ICES J. Mar. Sci. 75, 417–425. doi: 10.1093/icesjms/fsx189
Soutullo, A., De Castro, M., and Urios, V. (2008). Linking political and scientifically derived targets for global biodiversity conservation: implications for the expansion of the global network of protected areas. Divers. Distrib. 14, 604–613. doi: 10.1111/j.1472-4642.2007.00445.x
Spalding, M. D., Agostini, V. N., Rice, J., and Grant, S. M. (2012). Pelagic provinces of the world: a biogeographic classification of the world’s surface pelagic waters. Ocean Coast. Manage. 60, 19–30. doi: 10.1016/j.ocecoaman.2011.12.016
Spalding, M. D., Fox, H. E., Allen, G. R., Davidson, N., Ferdana, Z. A., Finlayson, M., et al. (2007). Marine ecoregions of the world: a bioregionalization of coastal and shelf areas. Bioscience 57, 573–583. doi: 10.1641/b570707
Stolton, S., and Dudley, N. (2016). METT Handbook: A Guide to Using the Management Effectiveness Tracking Tool (METT). Woking: World Wildlife Fund.
Sutton, T. T., Clark, M. R., Dunn, D. C., Halpin, P. N., Rogers, A. D., Guinotte, J., et al. (2017). A global biogeographic classification of the mesopelagic zone. Deep Sea. Res. Part 1 Oceanogr. Res. Pap. 126, 85–102. doi: 10.1016/j.cub.2016.09.031
Tiller, R., De Santo, E., Mendenhall, E., and Nyman, E. (2019). The once and future treaty: towards a new regime for biodiversity in areas beyond national jurisdiction. Mar. Policy 99, 239–242. doi: 10.1016/j.marpol.2018.10.046
UNEP-WCMC and IUCN (2018b). The Lag Effect in the World Database on Protected Areas. Cambridge: UNEP-WCMC and IUCN.
UNEP-WCMC, and IUCN, (2019a). Marine Protected Planet, March 2019 [Online]. Cambridge: UNEP-WCMC and IUCN.
UNEP-WCMC, and IUCN, (2019b). Marine Protected Planet, January 2019 [Online]. Cambridge: UNEP-WCMC and IUCN.
United Nations General Assembly (2018). UN General Assembly Resolution 72/249 Seventy-Second Session of the United Nations General Assembly. New York, NY: United Nations General Assembly.
Ventura, F., Matthiopoulos, J., and Jeglinski, J. W. E. (2019). Minimal overlap between areas of high conservation priority for Galapagos pinnipeds and the conservation one of the Galapagos marine reserve. Aquat. Conserv. 29, 115–129.
Visconti, P., Di Marco, M., Álvarez-Romero, J., Januchowski-Hartley, S., Pressey, R., Weeks, R., et al. (2013). Effects of errors and gaps in spatial data sets on assessment of conservation progress. Conserv. Biol. 27, 1000–1010. doi: 10.1111/cobi.12095
Walton, A., White, A. T., Tighe, S., Aliño, P. M., Laroya, L., Dermawan, A., et al. (2014). Establishing a functional region-wide coral triangle marine protected area system. Coast. Manag. 42, 107–127. doi: 10.1080/08920753.2014.877765
Watson, J. E., Darling, E. S., Venter, O., Maron, M., Walston, J., Possingham, H. P., et al. (2016). Bolder science needed now for protected areas. Conserv. Biol. 30, 243–248. doi: 10.1111/cobi.12645
Watts, M. E., Stewart, R. R., Martin, T. G., Klein, C. J., Carwardine, J., and Possingham, H. P. (2017). “Systematic conservation planning with Marxan,” in Learning Landscape Ecology, eds S. E. Gergel, and M. G. Turner, (Berlin: Springer), 211–227. doi: 10.1007/978-1-4939-6374-4_13
White, A. T., Aliño, P. M., Cros, A., Fatan, N. A., Green, A. L., Teoh, S. J., et al. (2014). Marine protected areas in the coral triangle: progress, issues, and options. Coast. Manag. 42, 87–106. doi: 10.1080/08920753.2014.878177
Woodcock, P., O’Leary, B. C., Kaiser, M. J., and Pullin, A. S. (2016). Your evidence or mine? Systematic evaluation of reviews of marine protected area effectiveness. Fish Fish. 17, 668–681. doi: 10.1111/faf.12196
Wright, G., Gjerge, K. M., Johnson, D. E., Finkelstein, A., Adelaide, M. F., Dunn, D. C., et al. (2018). Marine spatial planning in areas beyond national jurisdiction. Mar. Policy 61, 134–148. doi: 10.1098/rspb.2019.1472
Keywords: areas beyond national jurisdiction, Aichi Target 11, marine protected area, overlay analysis, hotspots, representativeness, Sustainable Development Goal 14, World Database on Protected Areas
Citation: Gownaris NJ, Santora CM, Davis JB and Pikitch EK (2019) Gaps in Protection of Important Ocean Areas: A Spatial Meta-Analysis of Ten Global Mapping Initiatives. Front. Mar. Sci. 6:650. doi: 10.3389/fmars.2019.00650
Received: 27 March 2019; Accepted: 04 October 2019;
Published: 25 October 2019.
Edited by:
Trevor John Willis, Stazione Zoologica Anton Dohrn, ItalyReviewed by:
Alan T. White, Tetra Tech, United StatesAnnette Breckwoldt, Leibniz Centre for Tropical Marine Research (LG), Germany
Copyright © 2019 Gownaris, Santora, Davis and Pikitch. This is an open-access article distributed under the terms of the Creative Commons Attribution License (CC BY). The use, distribution or reproduction in other forums is permitted, provided the original author(s) and the copyright owner(s) are credited and that the original publication in this journal is cited, in accordance with accepted academic practice. No use, distribution or reproduction is permitted which does not comply with these terms.
*Correspondence: Natasha J. Gownaris, ngownaris@gmail.com