You Are What You Eat, Microplastics in Porbeagle Sharks From the North East Atlantic: Method Development and Analysis in Spiral Valve Content and Tissue
 Thomas Maes1,2*
  Jael van Diemen de Jel2
  A. Dick Vethaak2,3
  Marieke Desender1 Victoria A. Bendall1 Martin van Velzen2
  Heather A. Leslie2
- 1Lowestoft Laboratory, The Centre for Environment, Fisheries and Aquaculture Science, Lowestoft, United Kingdom
- 2Department of Environment and Health, Vrije Universiteit Amsterdam, Amsterdam, Netherlands
- 3Marine and Coastal Systems, Deltares, Delft, Netherlands
Researchers worldwide are studying the environmental distribution and impacts of manufactured or environmentally fragmented small pieces of plastics, so called microplastics (<5 mm). These microplastics eventually build up in the marine environment, threatening marine ecosystems. The magnitude, fate and effects of these microplastics across the food web are largely unknown. Here, we measured digested microplastics in a top predator and critically endangered species, the North-East Atlantic Porbeagle shark (Lamna nasus), and compared this with general health conditions. A method for quantifying microplastics in spiral valves of porbeagle sharks was developed. Microplastics were detected in all spiral valves, up to 10.4 particles per g wet weight (w.w.) content and 9.5 particles per g w.w. tissue. This equates to individual microplastics loads as high as 3850 particles per spiral valve, most likely a result of trophic transfer. No statistically significant correlations were found between the average number of plastic particles in spiral valve content and tissue and the Condition and Hepatosomatic Index of porbeagle sharks. The results of this research show that North-East Atlantic porbeagle sharks ingest and digest microplastics and that there is a potential for microplastic biomonitoring using this species. More research is needed to detect possible health effects of microplastic contamination in these apex predators.
Introduction
Concerns about plastics in the environment are mounting. Plastic items of all sizes end up in marine waters by inappropriate waste disposal and human behavior, resulting in ever-increasing marine litter concentrations (Jambeck et al., 2015). The anthropogenic litter currently floating at sea, according to estimates, accounts for at least 5.25 trillion particles of plastic (Eriksen et al., 2014) and can be found in the most remote marine (Lusher et al., 2015b) and fresh water systems (Eerkes-Medrano et al., 2015). They have a wide range of sizes, causing impacts across the entire food web. The larger sized items, such as the macroplastics (>20 mm diameter) and mesoplastics (5–20 mm), are known to cause entanglement and/or obstruction of the gut when ingested (Jacobsen et al., 2010; Foekema et al., 2013; Lusher et al., 2013, 2015a). The smaller particles, microplastics (<5 mm), are available to the smallest marine organisms, building up in food webs (Setälä et al., 2014), causing amongst other things abrasion, blockage of digestive tracts, starvation (Werner et al., 2016), and death (Maes et al., 2020). Laboratory studies have shown that plastic particles in the lower micro- and nano-sized range can cross cell membranes, causing tissue damage (Browne et al., 2008; UNEP, 2016). In addition, the easily ingestible microplastics can form a pathway in the entry of chemical contaminants. These chemicals are either leached from the plastic material itself (e.g., additives) or adsorbed to plastic from the surrounding water and thus taken up together with the plastic by the organism when ingested (Teuten et al., 2009; Koelmans et al., 2014; Yeo et al., 2017). The chemical concentrations of these persistent pollutants accumulate in biota and are often higher at the top of the food chain (Whitacre, 2010; Bendall et al., 2014; Nicolaus et al., 2016).
Microplastic ingestion has been reported in a wide range of marine organisms, such as sea cucumbers, mussels, lobsters, amphipods, lugworms, barnacles, and zooplankton (GESAMP, 2015a; UNEP, 2016). In addition, it has been reported in higher trophic levels, such as fish (e.g., herring), birds (e.g., Northern Fulmars) and marine mammals (e.g., whales) (Van Franeker et al., 2011; Foekema et al., 2013; Lusher et al., 2013, 2016; Besseling et al., 2015; Bellas et al., 2016; Steer et al., 2017; Nelms et al., 2018). It is suggested that the larger marine animals obtain the microplastics directly via ingestion (e.g., filter feeding) (Sampaio et al., 2018) or indirectly by trophic transfer via fish which consumed microplastics (Lusher et al., 2015a; Fossi et al., 2017).
Therefore, the impact of microplastics might be an additional problem for a critically endangered species, such as the North East Atlantic top- predator porbeagle shark (Bendall et al., 2014; IUCN, 2015; Nicolaus et al., 2016). Porbeagle sharks, Lamna nasus (Bonnaterre, 1788), are stout-bodied sharks with large black eyes and pointed snouts attaining a maximum length of about 355 cm (total length) (Francis et al., 2009). They are mostly found in the cold-temperate areas in the upper pelagic zone of the North Atlantic, South Atlantic and South Pacific oceans. Their diet consists of small to medium-sized pelagic and ground fishes, such as lancet fish, herring, mackerel, lance, lumpfish, flounders, hake, and cod, but feed also on squid and invertebrate (Joyce et al., 2002). Their low fecundity, late maturation age and prolonged gestation period makes them susceptible to overfishing (Bendall et al., 2012). In addition, they are long-lived species and are therefore potential targets for contaminant accumulation, such as mercury (Bendall et al., 2014; Nicolaus et al., 2016). Moreover, these sharks might be subject to direct or indirect plastic ingestion, as they reside in marine waters with reported high levels of plastic debris (Pham et al., 2013; Eriksen et al., 2014; Woodall et al., 2015b; Hartley et al., 2018), including microplastics (Lusher et al., 2014; van Sebille et al., 2015; Maes et al., 2017b), and the presence of microplastics in their prey (Foekema et al., 2013; Lusher et al., 2013, 2016; GESAMP, 2015b).
The concerns about the ecological impact of microplastics match the increasing trend in microplastic studies and publications of the last 4–5 years (Barboza and Gimenez, 2015; Barboza et al., 2018). One of the main topics of these studies is the development of analytical techniques and detection methods for the presence of microplastics that can be applied to sediment, water and biota samples (GESAMP, 2019). Differences in biota types, sample size and a range of other parameters (e.g., feeding behavior) have led to a variety of procedures for the analysis of microplastics in biota (GESAMP, 2019). Different steps to clean-up biota samples without affecting the microplastics (i.e., removal of biological tissues, sediment grains, and other non-plastic organic fractions) make harmonization difficult. A standard procedure that can be applied to different organisms is, therefore, not yet available (GESAMP, 2019). Moreover, most research has been conducted on small amounts of soft tissue and opts to exclude particles of certain sizes (Besseling et al., 2019; GESAMP, 2019). Harmonization in applied methodologies is needed to improve the comparison between studies (Karlsson, 2014), but methodologies should also be stretchable in order to obtain more knowledge of the magnitude, fate and effects of microplastic particles in marine organisms throughout the food web (GESAMP, 2019).
Macro debris ingestion and entanglement has been commonly observed in a range of sharks species (Cliff et al., 2002; Bernardini et al., 2018; Sampaio et al., 2018; Smith, 2018; Barreto et al., 2019). There are only few published studies identifying plastics and/or microplastics in sharks (Diana et al., 2014; Fossi et al., 2014, 2017; Cartes et al., 2016; Panti et al., 2016; Alomar and Deudero, 2017; Bernardini et al., 2018; Sampaio et al., 2018; Smith, 2018). Available microplastic studies mostly analyzed small types of Elasmobranches where the entire stomach and intestines was dissected and/or digested for subsequent microscopic analysis (Alomar and Deudero, 2017; Smith, 2018). Studies dealing with larger sharks are limited to stomach content analysis and report only macro litter items (Sampaio et al., 2018) and/or microplastics within the range 5–1 mm (Bernardini et al., 2018). There are many opportunities for bias in estimating diets from the stomach contents of elasmobranches in the field (Cortés, 1997; Bucking, 2015). Predatory fish frequently regurgitate their stomach contents (Hyslop, 1980; Cortés, 1997), potentially removing part of the plastic load. To reduce such monitoring bias and to focus on the ingested and digested microplastic fraction, we only analyzed the spiral valve content and tissue.
In this study we aim to assess the impact of microplastics on the general health condition of marine top predators, Porbeagle sharks (Lamna nasus) from the North-East Atlantic Ocean. Existing studies focus on ingestion rather than digestion and use stomach, instead of spiral valve, contents. Different existing methods were adapted and tested to extract the spiral valve content and analyze this content for microplastics. The best performing method was then applied to test the hypotheses that (i) porbeagle sharks ingest and digest microplastic and (ii) the uptake of microplastics adversely affects the general health condition (as assessed by Condition Index and Hepatosomatic Index) of Lamna nasus sharks.
Materials and Methods
Sampling and Study Design
General Health Indications and Observations
Cefas, the Centre for Environment, Fisheries and Aquaculture Science, received 53 dead porbeagle sharks provided by commercial fishers for research purposes. These specimens were captured as seasonal by-catch in Celtic Sea gillnet fisheries with nearly all fish captured between August and October 2014 (Ellis and Bendall, 2015; Nicolaus et al., 2016). Individual specimens were frozen after being brought ashore and were subsequently transferred to Cefas (Lowestoft) for processing, where they were sexed, measured and weighed (Ellis and Bendall, 2015; Figures 1A–D). Body length was determined by the Total Length and refers to the length measured from the tip of the snout to the top of the upper lobe of the caudal fin in a flexed down position, with this measurement made in a direct line under the body (Ellis and Bendall, 2015). After examination and opening of the internal cavity, samples of the spiral valve were tightened at the top and bottom (Bernardini et al., 2018) with cotton strings before cutting, bagged separately and stored in the freezer (Figures 2A–D). The spiral valve, part of the intestinal tract, was made available for research on microplastics. Due to the large size of each porbeagle spiral valve, time and budget limitations, 13 randomly chosen frozen spiral valves were sent to The Vrije Universiteit Amsterdam for further microplastic analysis. The spiral valves were inspected, and measurements were taken while collecting the content and tissue. Background information on the digestive tract of the porbeagle shark is found in Supporting Information.
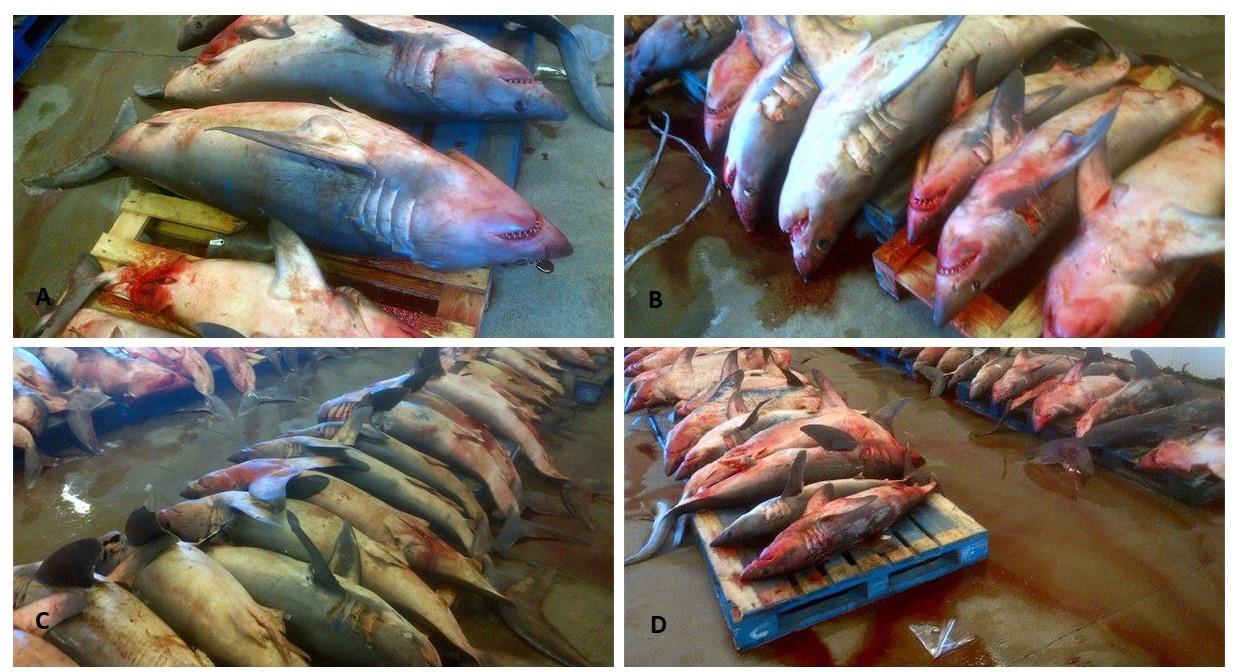
Figure 1. The 53 porbeagle sharks, captured as seasonal by-catch in gillnet fisheries. Individual specimens were frozen and transferred to Cefas (Lowestoft) for research. All porbeagle sharks were sexed, measured and weighed (A–D). After examination, the sharks were dissected and spiral valve removed for microplastic analysis.
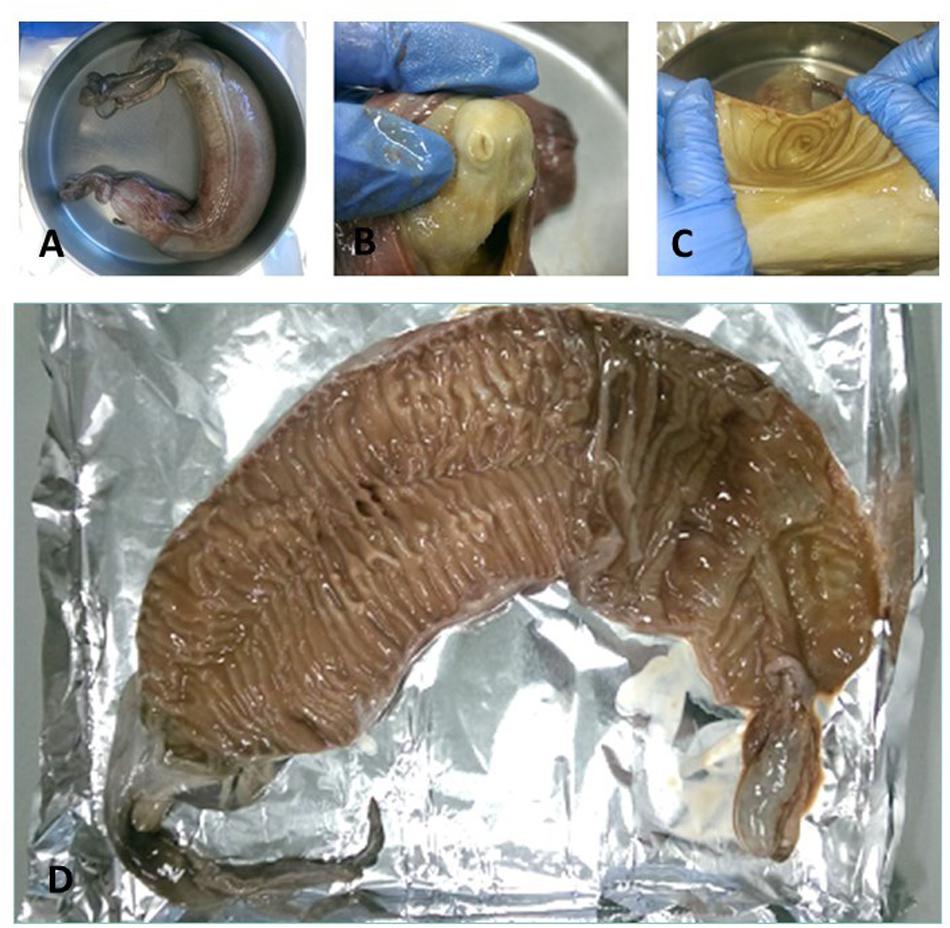
Figure 2. (A) A spiral valve tied with strings, (B) inside opening at the top of spiral valve (duodenum to spiral valve), (C) lower part of the spiral valve cut open as seen from below, (D) one of the test spiral valves cut open from bottom (right) to top (left).
Method Development
Sample Collection
The frozen spiral valves were put in a lukewarm water bath for approximately 3 h to speed up the thawing process, with 2 additional zip lock plastic bags to prevent the risk of leaking. The spiral valve was weighed (Sartorius CP2202S) before and after excess material was cut away (part of gonads, rectal gland and blood vessel remains). Other remaining material was removed from the exterior tissue with milliQ water.
To determine the presence of microplastics, the content of each spiral valve and the inside tissue of the valve were examined. Abnormalities, such as tissue damage and the presence of parasites, were also noted before subsampling, the valve content was homogenized by 1 min hand-stirring with a metal spoon. Spiral valve tissue samples were used to estimate the amounts of plastic particles trapped inside.
Four methods to collect the spiral valve content were explored (Figures 3A–D) on 4 individual spiral valves, the best method was then used on the remaining 9 spiral valves. In the first two methods, the content material was recovered from the spiral valves by hanging the spiral valve vertically from a tripod. In the first method, the spiral valve was hung above six different sieves (1 mm, 710, 500, 355, 200, and 100 μm) to separate the collected content immediately based on size. A glass funnel was used to keep the top part of the spiral valve open and 1 L of milliQ water was flushed through the spiral valve to rinse the remaining content from the spiral valve. In the second method, the spiral valve was hung on the tripod without the funnel and sieves. The content was forced out of the spiral valve by squeezing the spiral valve from top to bottom in downwards strokes, collecting the content in a glass bowl (Figure 4). In the third method, the spiral valve was cut open to scrape out the content with a metal spoon. For the fourth method, the spiral valve was cut open in a glass bowl with 200 mL of milliQ water to collect the content through washing. The collected content of all spiral valves was stored separately in glass bottles and the weight was determined. The bottles were covered with aluminum foil and stored in a freezer at minus 20°C. The weight of the emptied spiral valve was determined afterward.
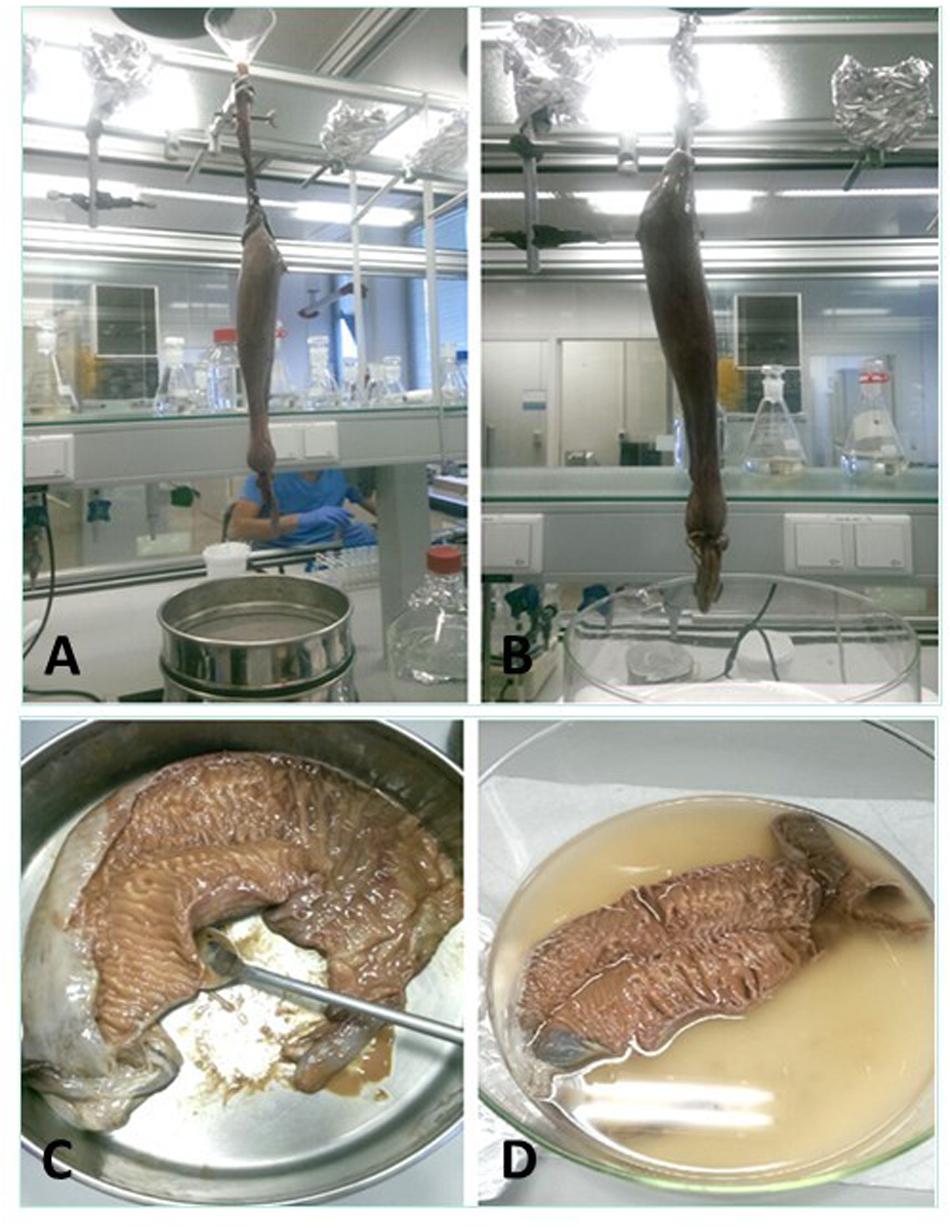
Figure 3. The four different methods for the content collection. (A) Spiral valve hung above sieves and held open with a glass funnel to wash out contents, (B) spiral valve hung above glass bowl, ready for massaging, (C) opened spiral valve in a metal bowl to scrape out the content, (D) opened spiral valve in glass bowl filled with milliQ water to wash out content.
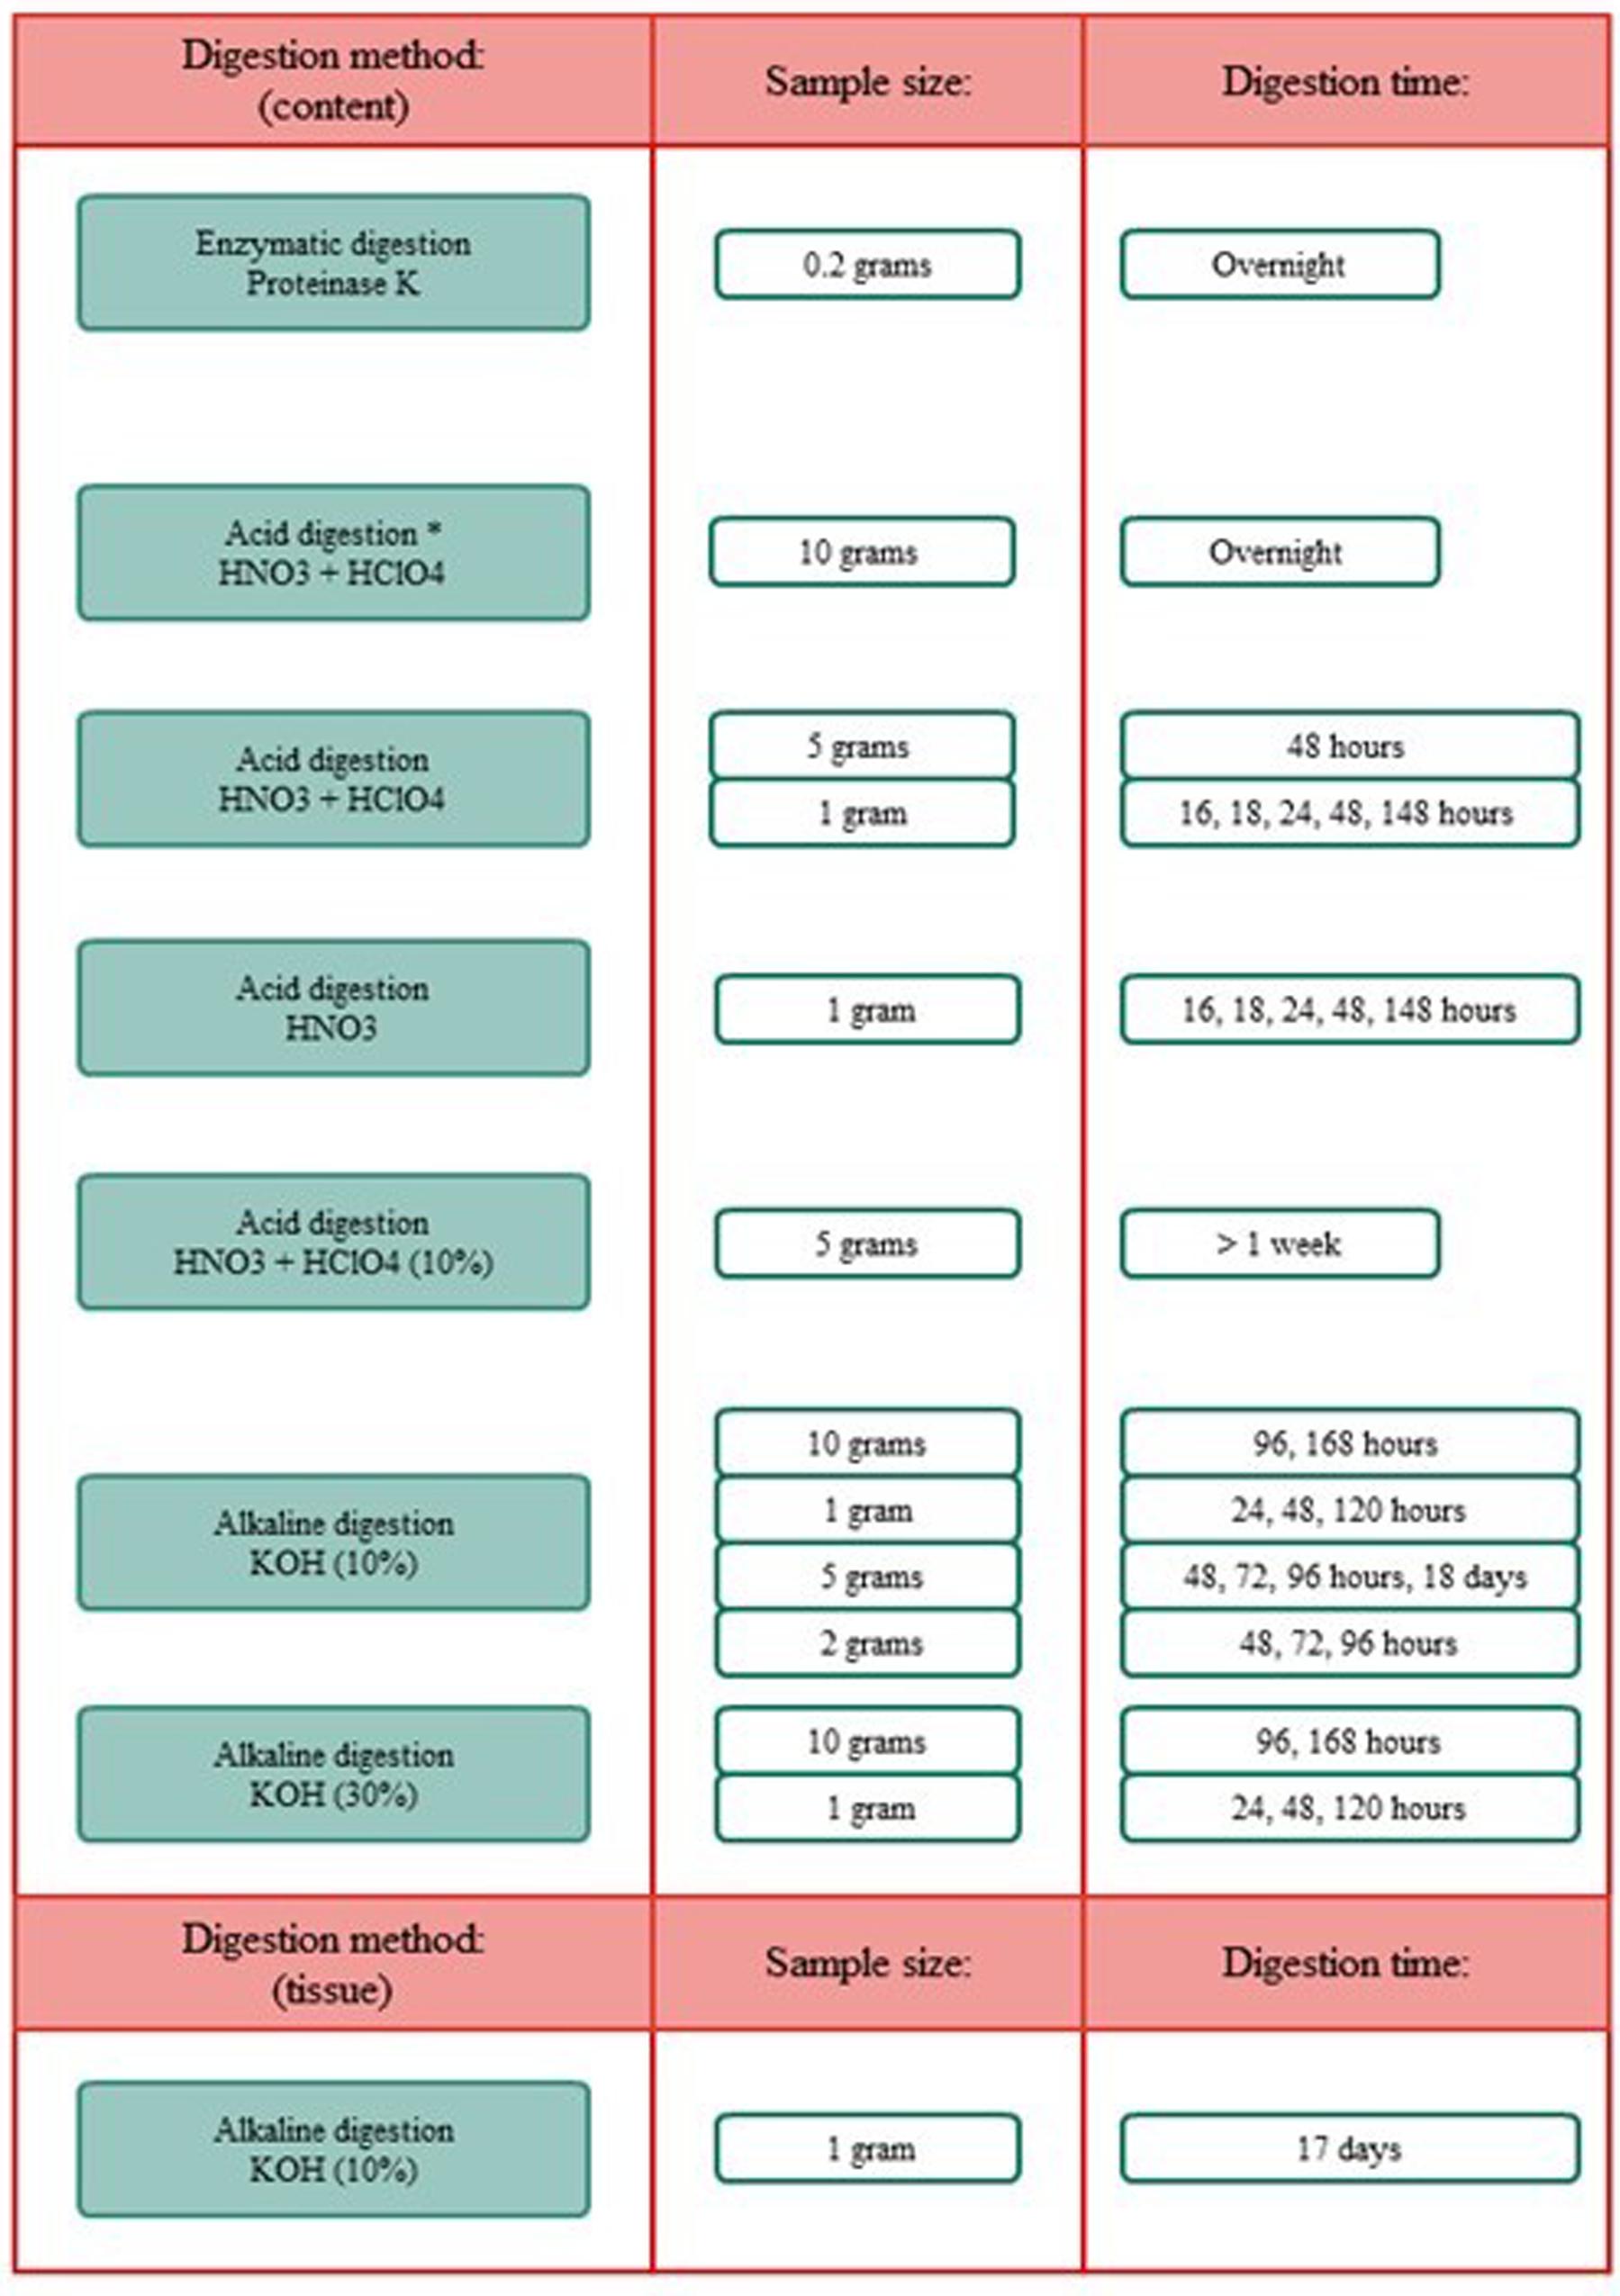
Figure 4. Overview of the different digestion methods, sample sizes, and digestion time frames. *Included boiling.
The emptied spiral valve was cut open with scissors from the rectum up to the top part of the spiral valve. Pieces of the inside tissue were collected by cutting small fractions of the top, middle (2×) and lower pleat-shaped chambers. The 1 g tissue samples were placed in separate 25 mL glass containers, covered with foil and stored in the freezer at − 20°C.
Digestion and Validation
Different methodologies for the digestion of spiral valve content and tissue were tested. The procedures tested included an enzymatic (Cole et al., 2014; Karlsson, 2014), acid (De Witte et al., 2014) and alkaline (Foekema et al., 2013; Enders et al., 2017; Kühn et al., 2017; Thiele et al., 2019) digestion. In addition to these selected procedures some further acid and alkaline digestion tests, using different sample volumes and/or digestion times, were performed. An overview of all digestion tests is given in Figure 5, more methodological details can be found in Supporting Information. Different types of microplastic particles were also subjected to the different digestion methods to assess whether plastic particles could be recovered and/or were affected by the digestion procedures. After exposure to the acid and alkaline solutions, recovery and changes in color and shape of the 12 tested plastic types were evaluated under the microscope. In addition, the best performing digestion procedure was further validated, by assessing the impact of the digestion procedure on the weight of the spiked plastic material (Supporting Information). All chemicals were purchased from Sigma-Aldrich unless stated otherwise.
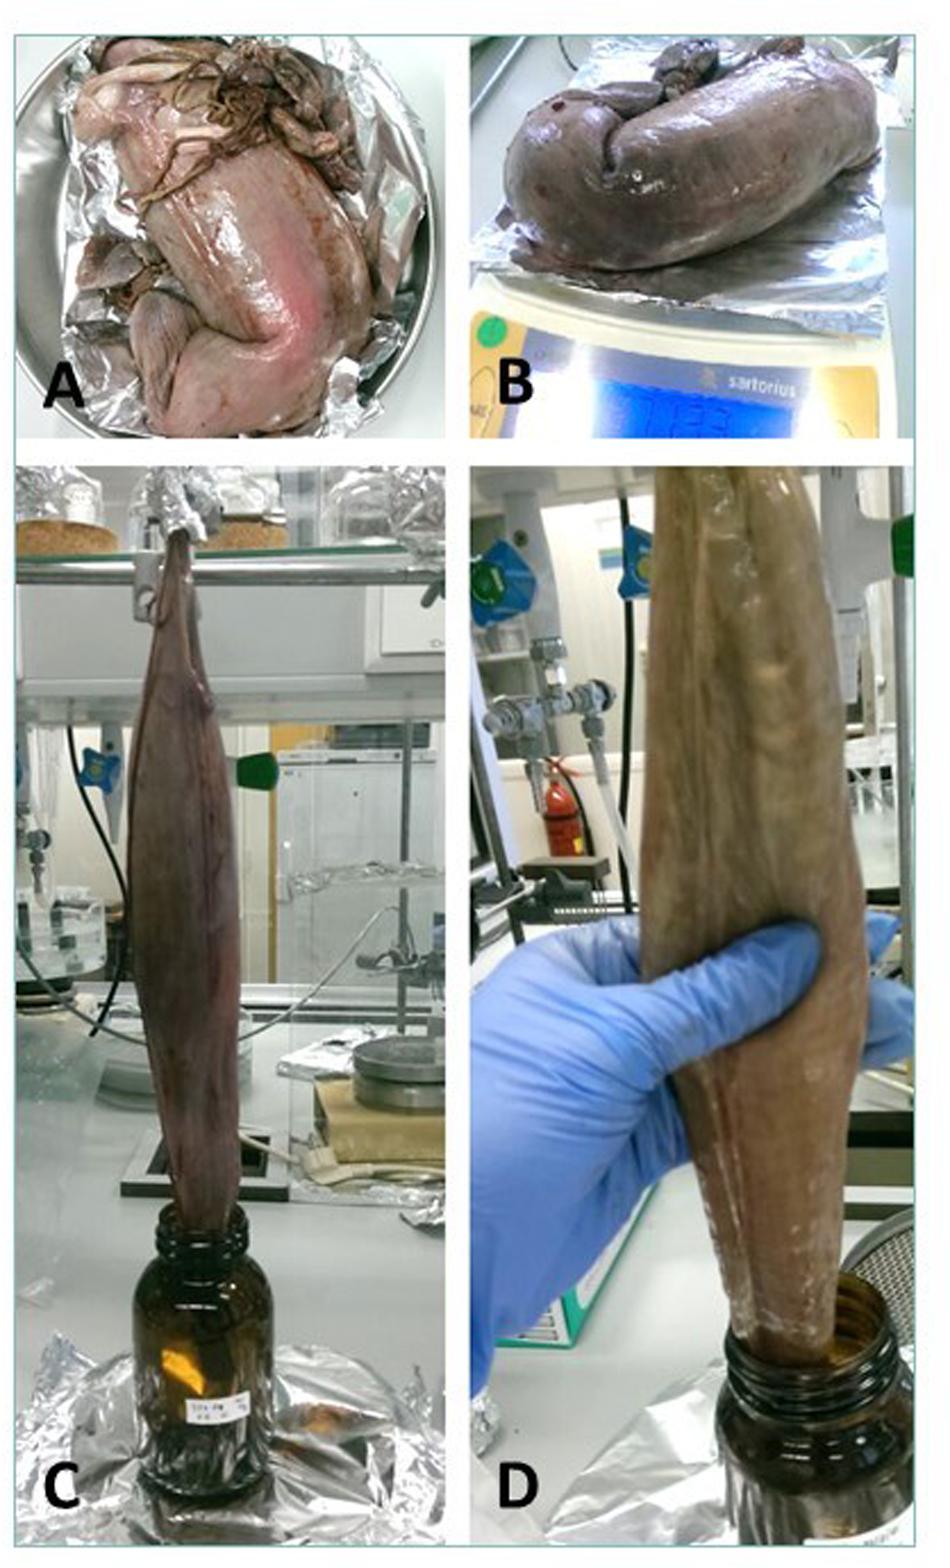
Figure 5. The chosen method and different steps to remove spiral valve content. (A) Thawing, (B) Weighing, (C) Hanging, (D) Massaging.
Following the results of method testing, the alkaline potassium hydroxide (KOH, Riedel-de Haën, 10%) method (Foekema et al., 2013; Enders et al., 2017; Kühn et al., 2017; Thiele et al., 2019) was adopted to extract microplastics from the spiral valve content and tissue. The removed content of each spiral valve was homogenized and five subsamples of 2 g were taken from each spiral valve. The subsamples were added into 25 mL glass containers and a 6 mL solution of 10% KOH was added. The samples were incubated in a fume hood at room temperature for 2–9 days. Of each spiral valve, four tissue samples of 1 g were placed into 25 mL glass containers and a 3 mL solution of 10% KOH was added. The tissue samples were incubated for 17 days. During the digestion procedures, parasites were included in the subsamples. When only one parasite was found in a spiral valve, the parasite was digested with one of the subsamples. When multiple parasites were found, they were homogenized with the contents and included in the samples. To provide some additional information on microplastics in parasites, the content of one rectal gland (1.2 g), where high amounts of parasites were observed, was incubated with a 3.6 mL solution of 10% KOH for 3 days and one sample with nine small parasites, individually picked from the spiral valves, was incubated with a 2 mL solution of 10% KOH for 2 days.
Filtration
With digestion completed, samples were vacuum filtered through a Whatman GF/F filter (pore size 0.7 μm, Ø 47 mm) to retain the microplastics (Claessens et al., 2013). The emptied glass containers were rinsed with milliQ water and vacuum filtered again. The effect of combining KOH with an additional alkaline solution (e.g., bleach or soap) to remove lipid residues was tested (Enders et al., 2017). To simplify existing procedures (Foekema et al., 2013; Lusher et al., 2016; Enders et al., 2017), after filtration, the filter was covered with 2.5 mL 20% Extran® (MA 01 liquid, alkaline soap) for a maximum of 30 min to decrease the amount of digest. After adding the soap, the glassware was rinsed three times to make sure all sample was filtered through. A total of 50 mL of filtered milliQ water was used for every sample. Samples of both the content and tissue were filtered separately. When a filter became clogged, multiple filters were used. The difference between filters of various tests was determined by visual and microscopic inspection. Filters were stored and frozen in a petri-dish until further analysis.
Microplastic Analysis
Quality Control
An essential aspect of this study was the monitoring and prevention of contamination and an adequate recovery of microplastics from the sample matrix. Therefore, all tests were performed in a closed environment (e.g., fume hood), except for spiral valve weighing and the microscope analysis. The fume hood was cleaned regularly throughout the study with ethanol. A cotton lab coat was worn, and blue nitrile gloves were used during the sample collection, digestion and filtration procedures. Only sterile glassware was used and thoroughly rinsed three times with milliQ water prior to use. Metal spoons and scissors were acetone-washed prior to use and all equipment and samples were covered with aluminum foil or glass. In between filtrations, glassware was cleaned with milliQ water. In addition to these steps, it is important to note that all samples were processed by a single researcher. Although Quality Assurance and Quality Control (QA/QC) tools and certified reference materials are lacking for this emerging field (GESAMP, 2019), some additional precautionary steps were introduced to prevent and control contamination (Woodall et al., 2015a). To eliminate any contamination from the chemical solutions, all solutions were filtered on GF/F filters (pore size 0.7 μm, Ø 47 mm) before use. Only GF/F (pore size 0.7 μm, Ø 47 mm) filtered milliQ water was used to make up solutions or clean glassware. The fume hood was cleaned before every procedure. Potential airborne contamination for processes in the fume hood was determined by leaving 3 clean GF/F filters (pore size 0.7 μm, Ø 47 mm) in 3 open petri-dishes for 30 min (the maximum time needed to collect the content and tissue samples in one spiral valve). To determine air contamination during sample weighing, 3 GF/F filters (pore size 0.7 μm, Ø 25 mm) were exposed for 2 min (blank control samples). All filters were visually checked for microplastic contamination with a microscope after exposure. During the digestion and filtration steps, for every two spiral valves, blank samples were included for both spiral valve content and tissue analyses. The concentrations of microplastics in spiral valve content and tissue were corrected for the average value of the blank samples. The Limit of Detection (LoD) was defined as 3 × the Standard Deviation (SD) of the blank results. The Limit of Quantification (LoQ) is defined as 3.3 × LOD or 10 × SD of the blank results. The LoD and LoQ are reported for the spiral valve content and spiral valve tissue separately (Supplementary Table SC), they give an indication of the level of significance of the results (LOW < LoD, MEDIUM < LoQ and HIGH > LoQ).
Identification and Classification
In this study, microplastics were defined as plastic items between 10 μm and 5 mm in size. Based on the anatomy of the digestive tract of the porbeagle shark and their potential to regurgitate larger items, it was expected that items larger than 5 mm were not present in the spiral valve. All filters were analyzed under a light microscope (Olympus CX31 – 4×) to evaluate the performance of the digestion and the presence of microplastics. Following recommendations of Ferreira (Ferreira, 2014), microplastics were categorized according their physical characteristics: size, shape and color. Plastic particles were categorized in size bins of approximately 100 μm (20–100, 101–200, etc.) and were measured using MicroCamLab for Microsoft Windows. Their shape was described as: fragments, pellets (spheres), fibers, plastic films, foamed plastic and granulates. A needle was used to carefully turn the particle and to help identify the shape when there was uncertainty. Results of the microscopic analysis were reported as number of microplastic particles per g w.w.
Validation
Raman spectroscopy (Renishaw® inVia Raman Microscope) was used to determine the polymer type (Koenig, 1999). The results of this technique were compared with existing references of (virgin) polymers and non-polymer particles. Only the distinguishable items, clearly visible under the microscope (>80 μm), were selected for the Raman analyses. We did not analyze the particles below 80 μm with Raman spectroscopy, because they proved extremely difficult to transfer from the GF/F to the edge filters for Raman spectroscopy without introducing contamination. In addition, the blue nitrile gloves and blue plastic from the filter packaging was analyzed with Raman to examine their potential role in contamination. Items were located with a magnification lens of 20×, illuminated with a red (785 nm) or green (532) laser at an intensity laser power from 0.5 up to 20%, and imaged with a Philips SP1030NC webcam.
Statistical Correlation Between Ingested Microplastics and General Health Indices
Plastic ingestion was defined as the average plastic particle per g w.w. content and the average plastic particle per g w.w. tissue of spiral valve. The general health condition of the porbeagle shark is determined by the Condition Index [K = fish body weight (g)/length (cm)3 × 100] (Goede and Barton, 1990). In addition, the Hepatosomatic Index [IH = liver weight (kg)/body weight (kg) × 100] (Goede and Barton, 1990), also an indication of the status of energy reserve, was used as an additional general health estimate (Goede and Barton, 1990). Higher numbers for both variables indicate a good fitness condition and general health. Correlations were controlled for the Fullness Index [IF = weight of spiral valve contents (kg)/weight of fish (kg) × 10,000], because it is hypothesized that a fuller spiral valve results in a higher amount of plastic. Simple statistics were performed in Microsoft Excel 2010. The correlation analyses were performed with IBM SPSS Statistics 21 and statistical significance was set at p < 0.05. To determine the correlation between plastic ingestion and the Condition Index of the porbeagle shark, normal distribution was tested with Shapiro-Wilk test and Spearman’s rho test was used on blank subtracted results from the microplastic analyses. To determine the correlation between plastic ingestion and the Hepatosomatic Index of the porbeagle shark, a Pearson correlation test was performed. To control the Fullness Index, only partial correlation tests were performed. By holding this third variable constant, the influence of the fullness of the spiral valve could be eliminated.
Results
Sampling and Study Design
General Health Indications and Observations
Overall, the spiral valves and their contents looked similar. The dark brown/reddish colored content was a thick sticky substance and contained no large items (>5 mm). However, some contained small gray unidentified fragments which may have been remains of bones. Parasites were found in 50% of the spiral valves (Supplementary Table SA). They were assigned, with some uncertainty, to one tapeworm species, Dinobothrium septaria and one unidentified nematode species. The tapeworms were approximately 8 cm long and the nematodes were approximately 3 cm long (Supplementary Figure SE). In addition, parts of arthropod exoskeleton and appendages of different organisms were observed during microscope inspection (Supplementary Figure SF). An overview of the collected measurements during the sampling and during the sample collection is given in Table 1. Condition Index and Hepatosomatic Index, together with other general health indicators are included.
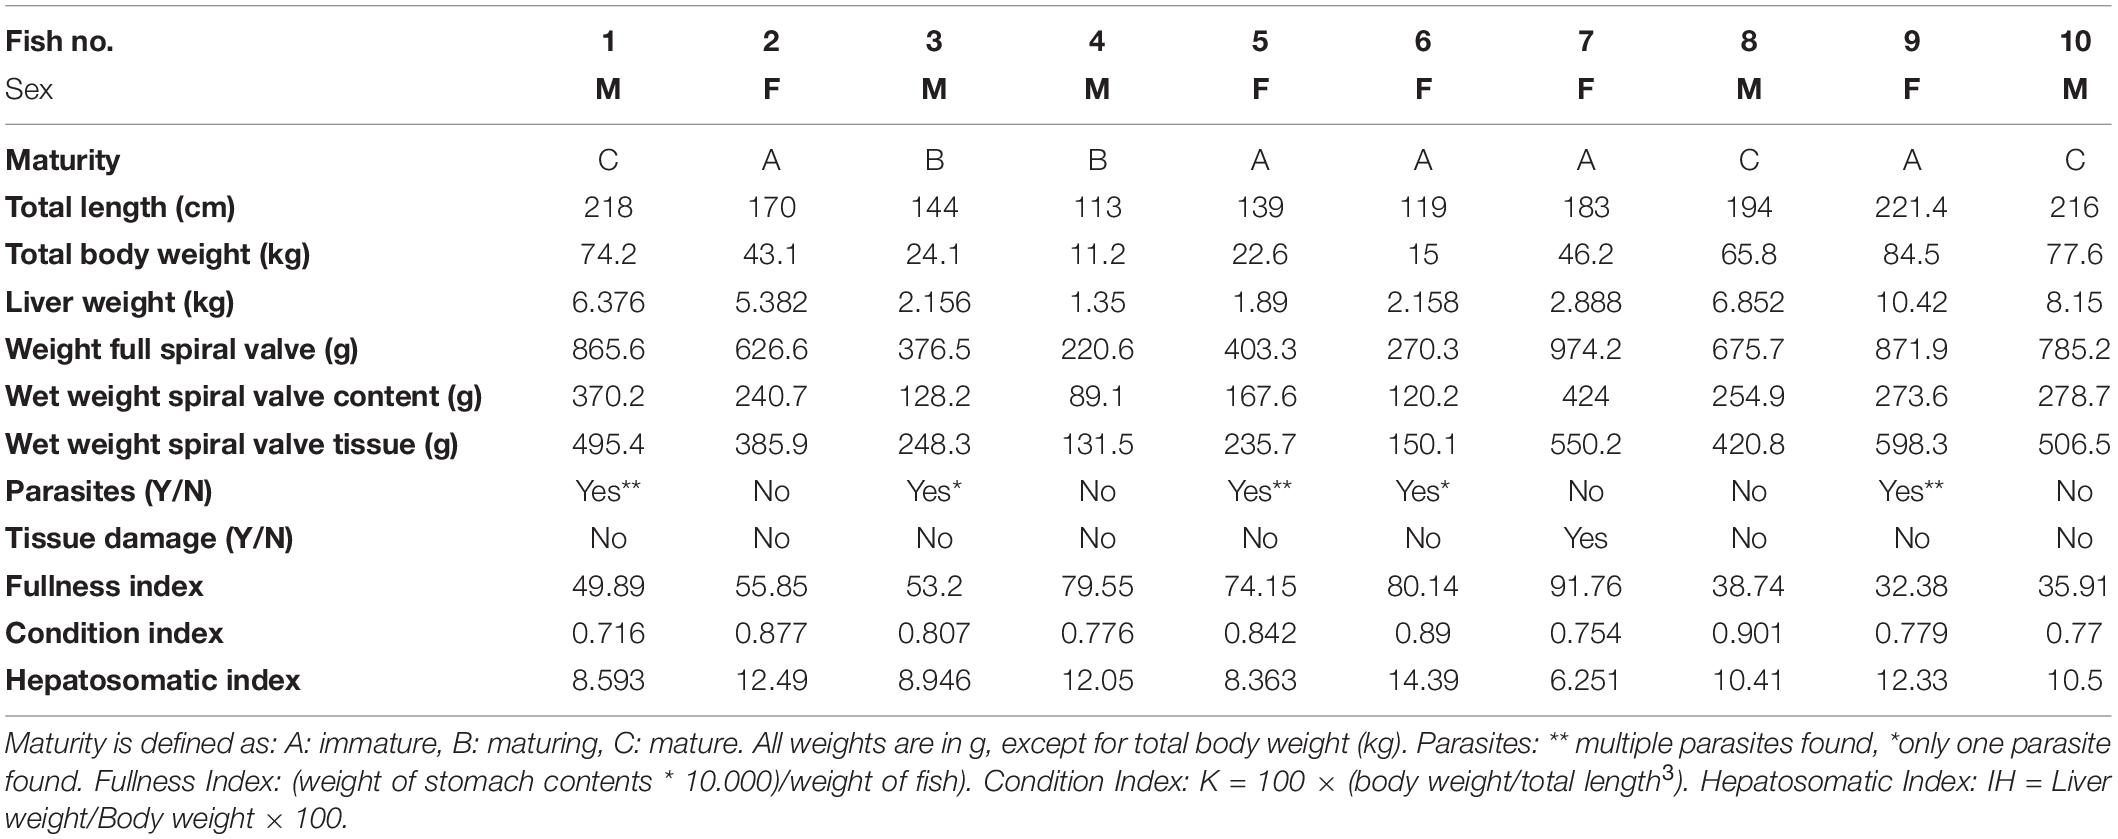
Table 1. Overview of measurements during sampling and sample collection.
Method Development
Sample Collection
Four spiral valves were used to test four different procedures (Nock and Caira, 1988; Dailey and Vogelbein, 1990; Curran and Caira, 1995; Henderson et al., 2002; Alarcos et al., 2006; Beveridge and Justine, 2007) for the collection of spiral valve content. This included hanging of the spiral valve and collecting the content via sieves (1) or massaging into a glass bowl (2), scraping the content out with a metal spoon (3) or washing the content out with milliQ water (4) (Figure 3). Although most of the content could be collected with the use of milliQ water, one of the main issues with the use of milliQ water is that the w.w. of the content cannot be determined. An additional problem was that some water was residing in the spiral valve. Therefore, it seemed inappropriate to flush the spiral valve with milliQ water and wash the content out of the spiral valve. Multiple problems occurred when using the sieves. Most of the content stuck to the sieves and clogged the mesh. This made it impossible to collect the content from the sieves and separate fractions based on size. To remove the content from the sieves, large volumes of hydrogen peroxide (30%) were used and (wet) weight of the spiral valve content could again not be measured. The hanging of the spiral valve seemed the most effective, part of the content was collected passively using gravity. In addition, actively squeezing aided to retrieve the remaining content. Cutting open and collecting content by scraping or washing the spiral valve seemed to be ineffective because of the potential issues it caused in relation to content loss or contamination. Therefore, it was decided that the remaining spiral valves would be by hung of a tripod and massaging would be applied to retrieve the content. The glass bowl was replaced with a glass bottle with a smaller opening to decrease the risk of air borne contamination. The lower part of the spiral valve was placed in the glass bottle to prevent spilling of the content. An overview is shown in Figure 4. After collecting the spiral valve content, tissue samples were taken from the empty spiral valve. Any content that could still be retrieved was added to the already collected content with a metal spoon. The blank filters were analyzed with a microscope after the exposure. No microplastics were detected. Therefore, it was assumed that airborne contamination in the fume hood was of low concern while sampling and weighing spiral valve content and tissue.
Digestion and Validation
To extract microplastics from spiral valve content and tissue samples, different digestion methods, sample sizes and time frames were explored and compared. These included enzymatic digestion, acid digestion and alkaline digestion techniques (Supplementary Figure S1.1). Their performance was determined by how well the sample could consequently be filtered through a glass fiber filter and how much residual content was observed by visual and microscopic inspection after filtration. The results are summarized below, more methodological details and pictures can be found in Supplementary Figures S1.1, S1.2). The filters using the acid digestions were covered with digest residue and could therefore cover possibly microplastics (Supplementary Figure S1.2). The enzymatic digestion was an effective method for small samples, but inappropriate for larger samples, such as spiral valve content and tissue, due to the high costs of Proteinase K. The 10% KOH solution seemed to perform best with a spiral valve content sample of 2 g and a tissue sample of 1 g, leaving a minimal digest residue on the filter (Figure 6). Some filters were stained brownish and/or contained gray fragments, most likely dietary remains. The gray fragments were not considered a problem during the identification as they could be crushed into a powder with a needle, making them distinguishable from plastic. The filters were increasingly covered when using larger sample sizes. Still, larger volumes or even better, a large series of smaller replicate samples would provide a better representation of the total spiral valve contents which ranged from approximately 90–424 g w.w. (Table 1). Concerning the most efficient timeframe, there did not seem to be a clear improvement with longer digestion times. The results of the KOH digestion differed, however, between spiral valves. Most likely due to different diets and stages of digestion at the time of death. The composition of the remaining spiral valves was unknown, therefore, it was decided to digest the content samples of the next spiral valves slowly over a period of several days until contents were, homogenous and fluid, ready for filtration (Figure 7).
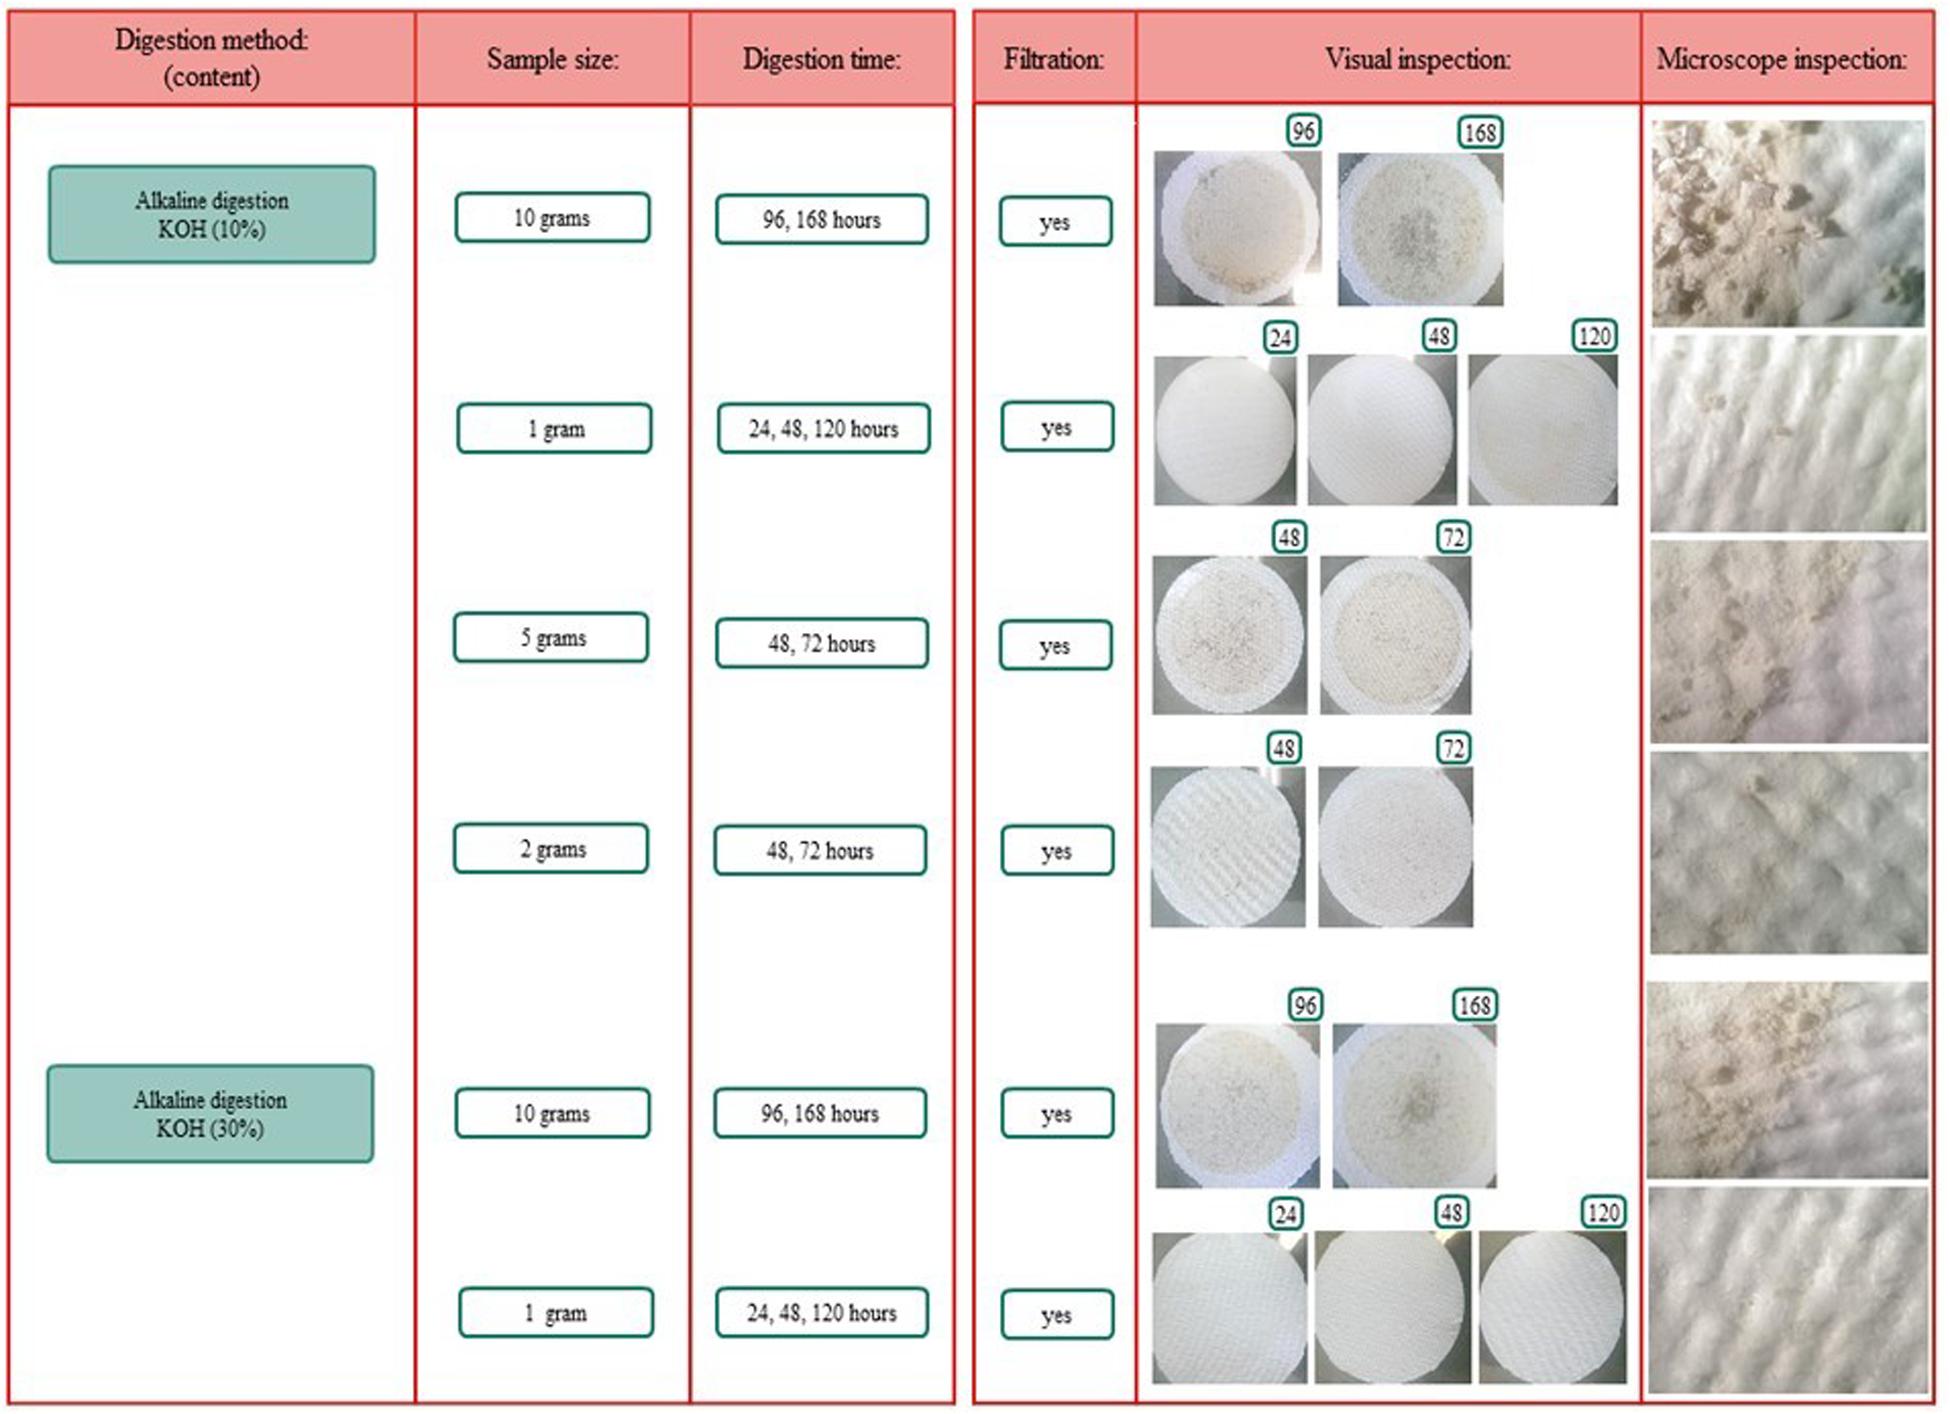
Figure 6. Alkaline digestion test results.
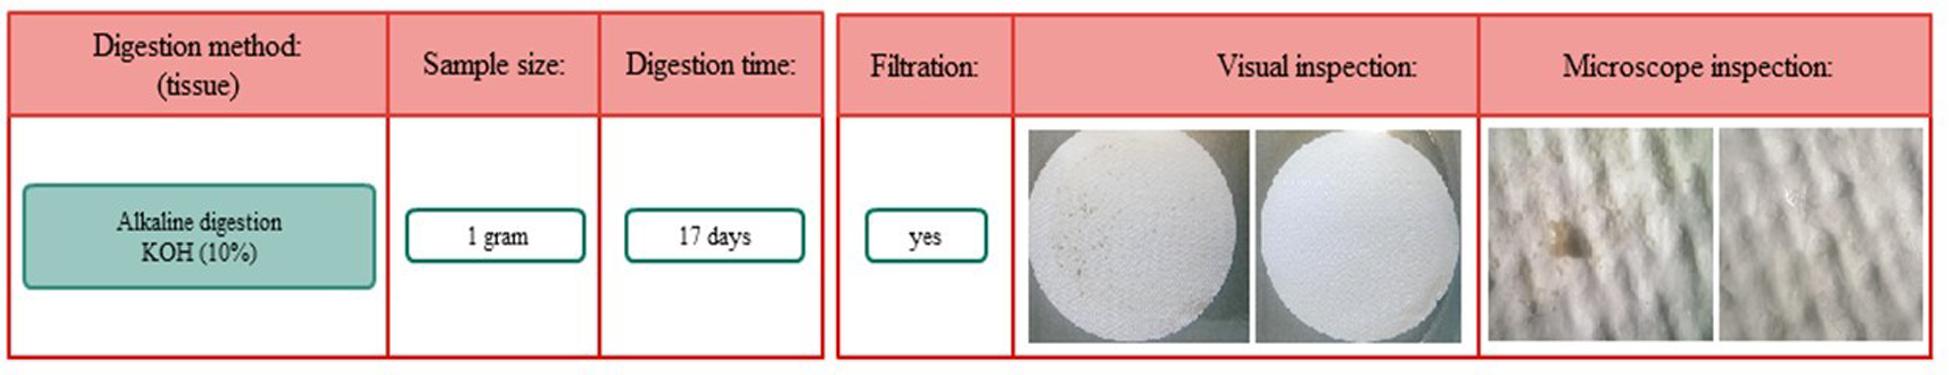
Figure 7. Alkaline test results for tissue samples.
Almost all tested particles (8 types of plastic, 12 particles each) could be recovered with the KOH content (94.8%) and tissue (98%) method. Unrecovered particles were attributed to the rinsing procedure (transparent plastics stuck on the glassware wall) and not to the digestion method. In addition, the spiked PVC particles were difficult to count and to filter as a result of their small size. No apparent changes in color and shape of the spiked plastics occurred as a result of the KOH digestion (Supplementary Figure SC). Also, no particles were stuck together. In addition, the use of 10% KOH and extended digestion times (>24 h) was further validated on 100 spiked particles, by assessing recovery and weight disparities. The recovery for all plastics was 100%, except for PET (99%) due to the loss of one PET particle before weighing. The weight of the plastics increased at first due to the dried KOH residue on the particles. After a milliQ rinsing step, the average weight of the particles did not differ significantly (Supporting Information) from the weight before the digestion. Only the mean differences in weight for PA at all 3 exposures and PVC after 9 days exposure were significantly higher after the KOH digestion. The average weight difference of the spiked plastics before and after 10% KOH digestion together with the significance levels is shown in Supplementary Tables S6.1–S6.4).
Filtration
Filters that were rinsed by covering them with a layer of 2.5 mL solution of 20% Extran® appeared visually cleaner than the ones which were only rinsed with milliQ water. Therefore, the use of the alkaline soap (prefiltered) was added to the filtration procedure. The difference between simply milliQ rinsed filters and milliQ with soap rinsed filters tested on 5 and 2 g samples can be seen in Supplementary Figure SD.
Microplastic Analysis
Quality Control
The blank measurements showed contamination of mostly fibers and blue fragments but were not consistent. The average number of plastic particles in the content blanks was 6.6 ± 6.5 particles and for the tissue 1 ± 0.7. Supplementary Figure SG illustrates also the range in number of particles per blank sample.
For spiral valve content, the LoD (3 × SD of the average plastic particle in the blanks) was 19.6 and the LoQ (3.3 × LoD) was 64.8. For the spiral valve tissue, the LoD was 2.1 and the LoQ was 7.0. Supplementary Table SC shows the LoD and LoQ described for 1 g and includes blue fragments, fibers, black fragments and other plastics.
Concentration of Plastic Particles
A total of 878 plastic particles were identified by visual identification. These were identified as fragments (65.9%), fibers (32.9%), pellets (0.9%), and films (0.5%). The most abundant colors were blue (44.8%), black (23.7%), red (9.6%), and transparent (6.5%). Other colors that were present were orange, brown, green, gray, yellow, purple, white, pink, or multicolored (all < 5%). Almost all particles were below 100 μm (fibers excluded) and the largest plastic particle identified was approximately 930 μm long (Supplementary Figure SH). An overview of the average number of blue fragments, fibers, black fragments, other and total plastic particles is given in Table 2 and Figure 8. It also includes the standard deviation (SD) per spiral valve content and tissue, before and after correction with the blank values (adjusted per type). One spiral valve (1) was not included in the analysis due to the presence of large amounts of sand particles in its content which interfered with the detection of microplastics. Instead of analyzing the entire sample, the total amount of microplastics per spiral valve was recalculated by multiplying the subsample concentrations with total weight of content and tissue and adding both together (Table 3). In the content of the rectal gland (1.2 g) three blue fibers were found, but after blank subtraction, no plastics can be reported. Also, nine parasitic nematodes were examined, but no plastic particles were discovered within. A raw data file is presented in Supporting Information.
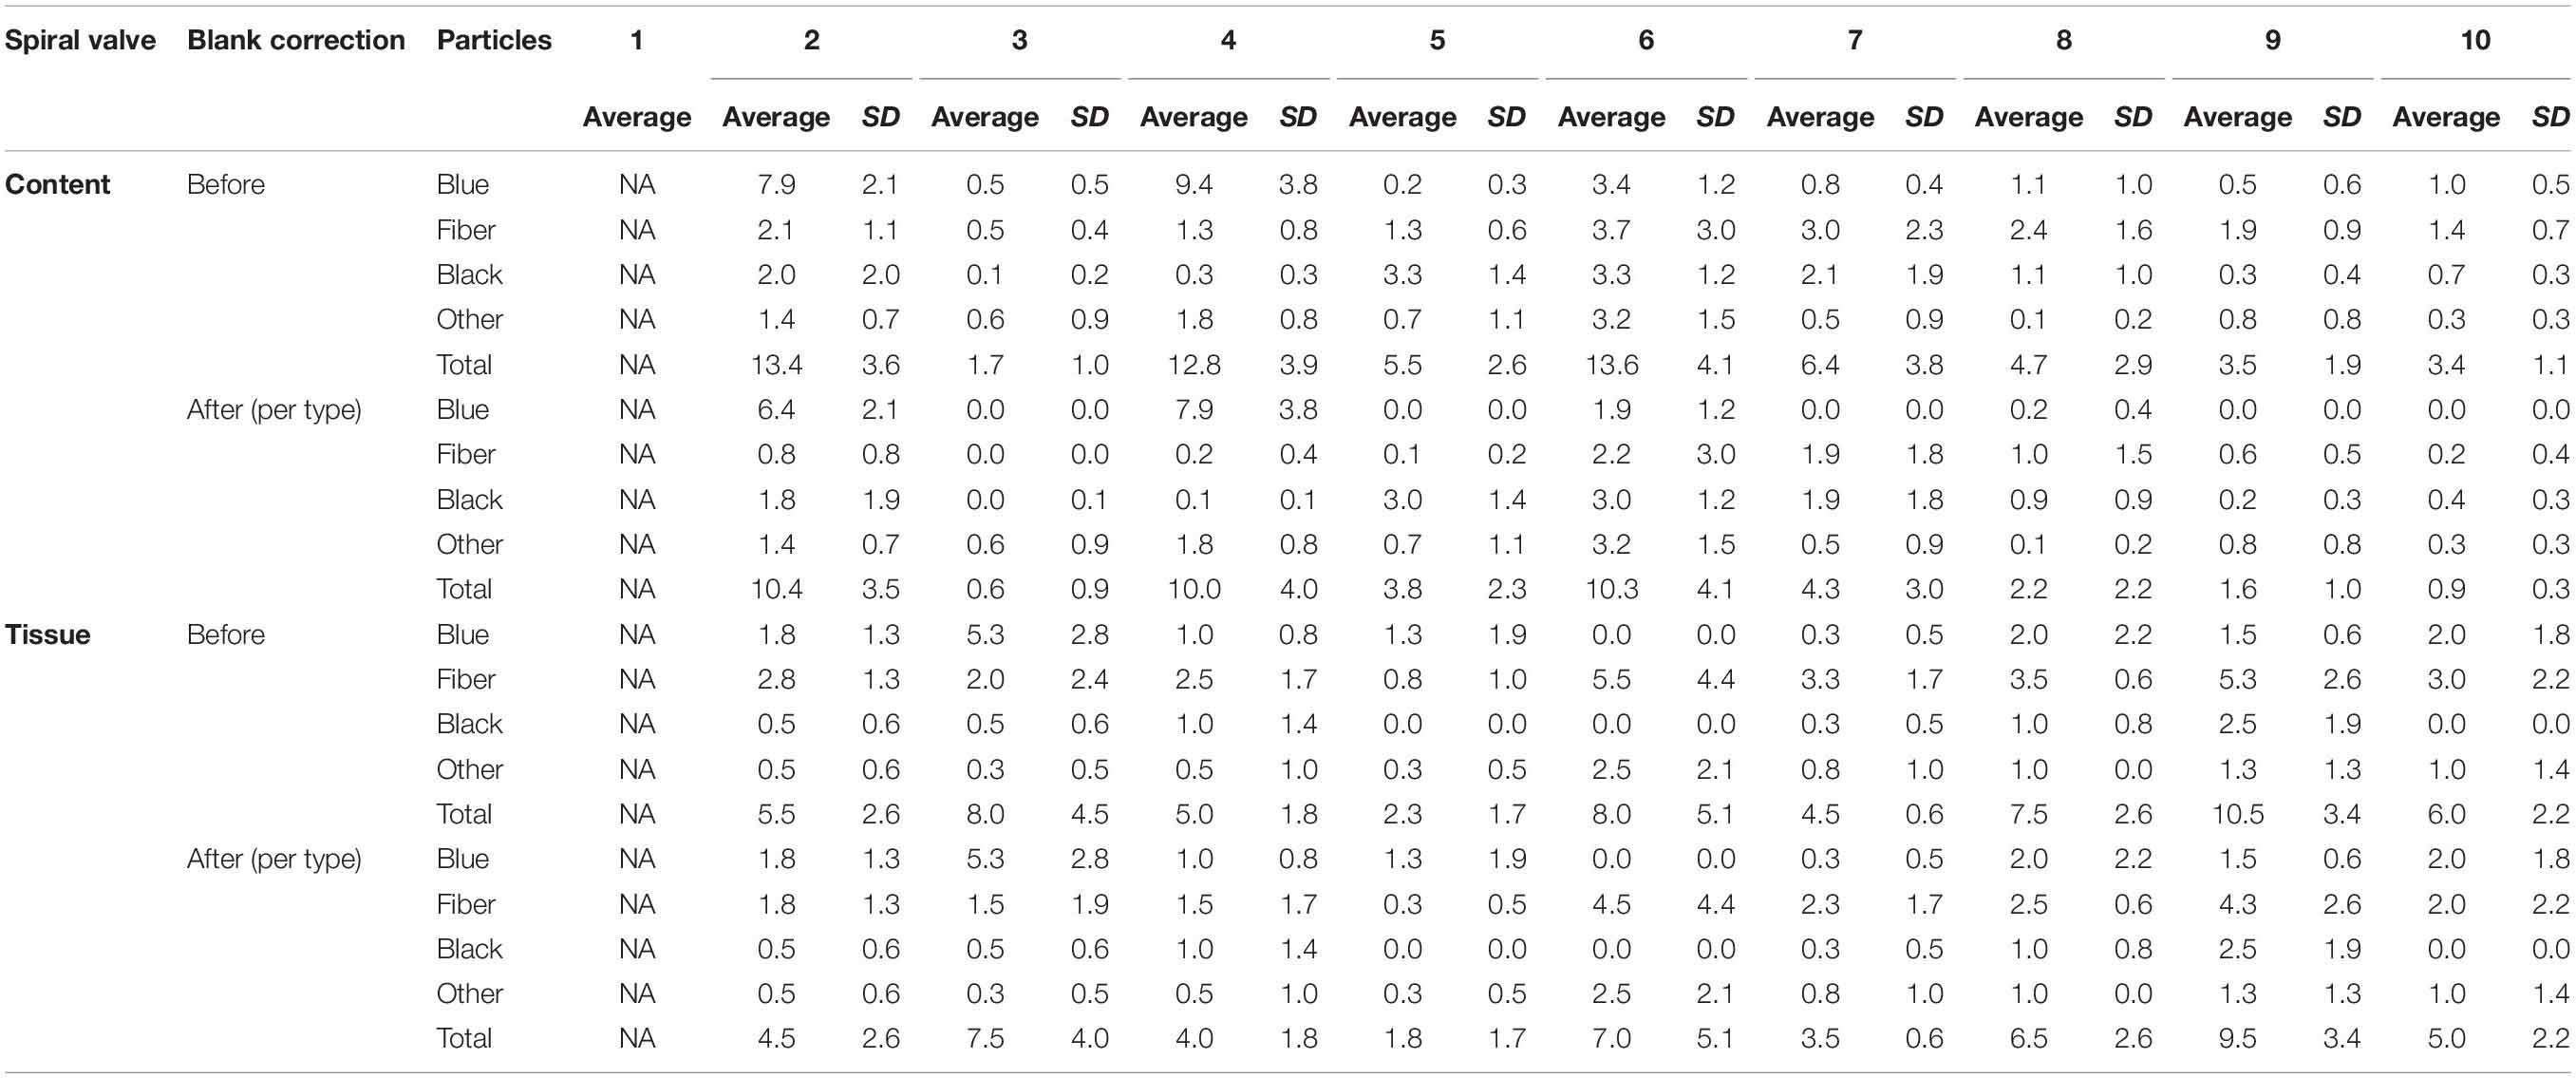
Table 2. The number of plastic particles in spiral content and tissue, expressed as average* number of plastic particles per g w.w. before and after blank correction (per type); SD, Standard Deviation; NA, Not Available; *5 content and 4 tissue replicates per spiral valve.
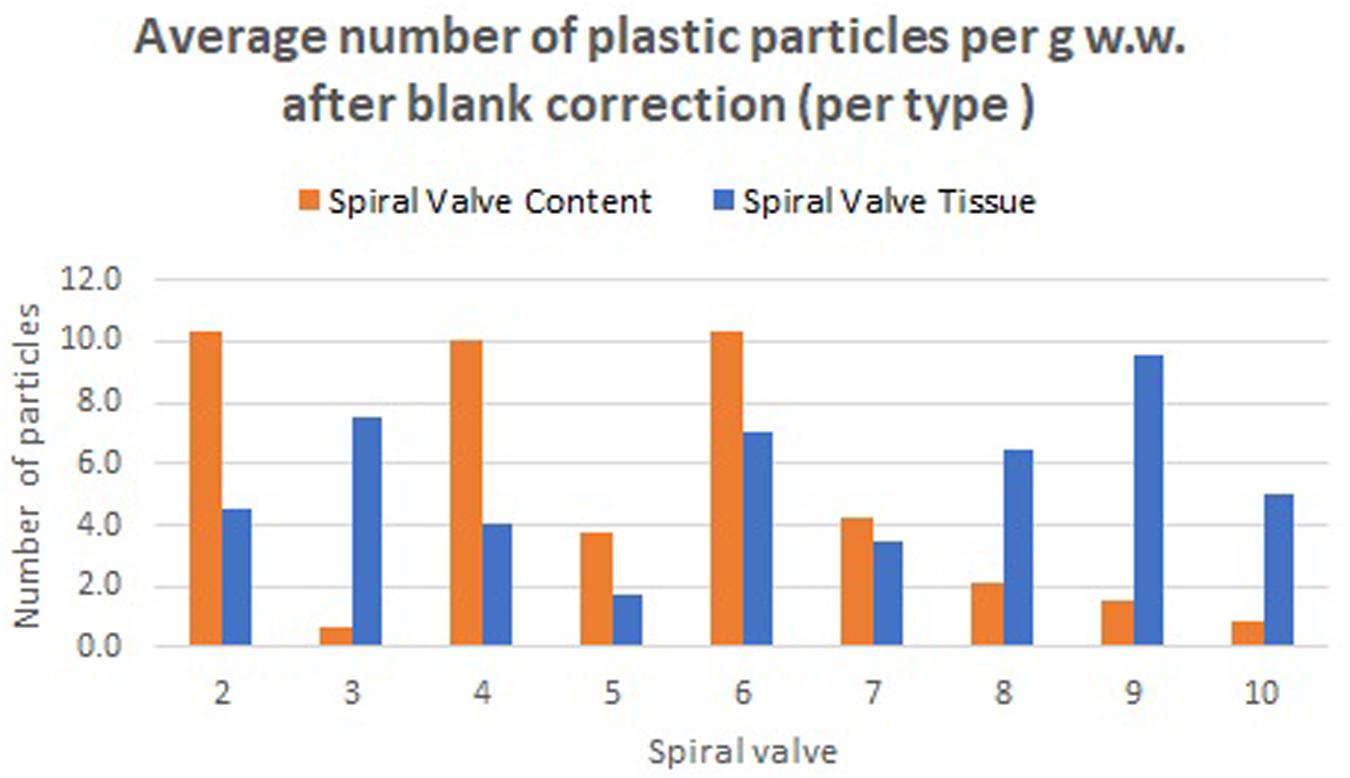
Figure 8. Average number of plastic particles per g w.w. measured in spiral valve content and tissue after blank correction.
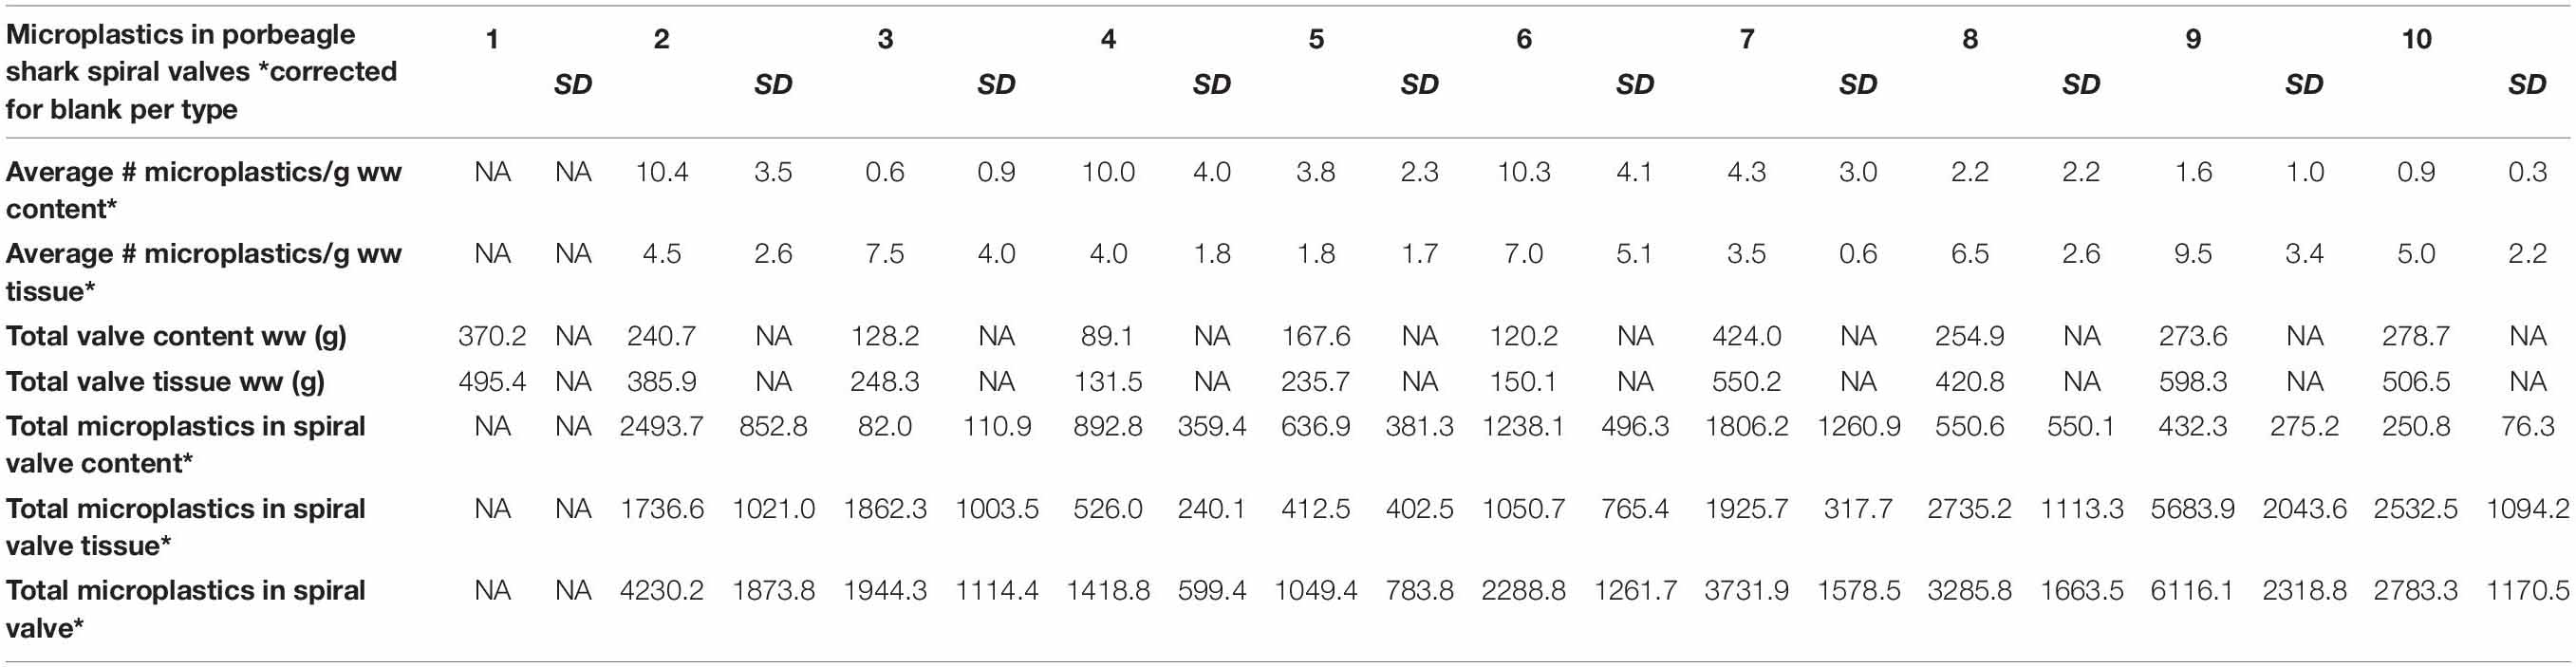
Table 3. Total estimated amount of microplastics in spiral valves of porbeagle sharks.
Validation
After the identification of all isolated particles by microscope, Raman spectroscopy was used as an additional tool to identify polymer types. There were on average 4.9 ± 2.4 particles per g w.w. content and 5.5 ± 2.7 particles per g w.w. tissue. From all filters, a total of 24 particles, at least one particle from each spiral valve, between 84 and– 572 μm were examined by Raman spectroscopy for polymer identification purposes by cataloging a collection of fingerprints. These included the five main observed types of microplastics: a black fiber and transparent, black, red, and blue fragments. Pigment spectra and environmentally driven changes to surface properties, such as weathering and biofouling, hinder spectroscopic identification (Harrison et al., 2014; Beltrán-Sanahuja et al., 2020). The process of degradation, autoxidation of hydrocarbon polymers, entails the formation of novel oxygen-containing groups in the main chain through a series of primary and secondary radical reactions that involve chain scissions and cross-linking of polymer backbone, the formation of polar carbonyls (C = O) and vinyl (CH2 = CH) groups, and finally, changes in the conformation and crystallinity of the polymer (Gómez et al., 2019).
The spectra of the items showed typical characteristics of weathered synthetic polymeric material, but none can be assigned with complete confidence. The water solvent was easily identified at about 1640 cm–1 and used as an internal intensity standard. Although the spectra were not clear enough for full identification, significant signals were present in the OH/NH stretch region between 3000 and 3700 cm–1. These signals were weaker relative to the C-H stretches than would typically be seen for natural carbohydrate-based polymers such as cellulose, carrageenan or chitin, or for proteinaceous material, suggesting that they are indeed synthetic. Although difficult to be certain, the transparent particles showed characteristic features of PET: the signals around 3500–3700 cm–1 and 1970 cm–1, as well as the strong carbonyl signal at 1730 cm–1. Some notable peaks of amide-like and ester character in the spectra in the 1400–1800 cm–1 region of some red particles indicate these may be polyamides. The C-C stretch, CH2 twist and CH2 bend in the spectra of the remaining fragments suggest these might be polyethylene. In addition, four blue fragments from the samples (Supplementary Figure SI) were compared with the spectra of the blue nitrile gloves and the blue plastic from the filter packaging. The blue fragments in the samples gave a clear spectrum, comparable to the spectrum of the blue packaging. Since all blue fragments resulted in the same spectrum, it was concluded that this was not due to contamination: not the polymer spectra, but pigment spectra were obtained. Supplementary Figure SJ illustrates the similarities in spectra.
Statistical Correlation Between Ingested Microplastics and General Health Indices
The correlation between the average plastic particle per g w.w. content (4.9 ± 2.4) and w.w. tissue (5.5 ± 2.7) and the general health indices of porbeagle sharks were examined by comparing the corrected average microplastic concentrations with the Condition Index (0.82 ± 0.06) and Hepatosomatic Index (10.6 ± 2.5). Spearman’s rho correlation showed no statistically significant correlation between the average particle per g w.w. content and the Condition Index (r = -0.008, p = 0.983) and the Hepatosomatic Index (r = 0.165, p = 0.651). Pearson correlation tests showed no statistically significant correlation between the average particle per g w.w. tissue and the Condition Index (r = 0.167, p = 0.668). When controlled for the Fullness Index with partial correlation no significant correlation between the average plastic particle per g w.w. tissue and the Condition Index was found (r = 0.151, p = 0.722). Both tests were also performed for the Hepatosomatic Index and again no statistically significant correlation was observed (Pearson: r = 0.597, p = 0.09 and Partial: r = 0.582, p = 0.130). While no statistically significant correlation was found here due to the significance level set at 0.05, the p-value for the Pearson correlation was below 0.1 and had a moderately positive r-value. This might mean that an increase in average particle per g w.w. tissue possibly relates to an increase in the Hepatosomatic Index. No clear difference was observed between the Pearson correlation and the partial correlation. Therefore, the fullness of the spiral valve did not influence the correlation between the average number of plastic particles per g w.w. tissue and the Hepatosomatic Index.
Discussion and Conclusion
A large part of the study focused on method development as standard techniques for microplastic analysis in large top predator sharks are missing. In a microplastic study using Blue sharks, stomachs were opened and the contents were washed through a 1 mm metal sieve with pre-filtered water (Bernardini et al., 2018). In this study, spiral valve content and tissue were used, representing digestion compared to ingestion. Studies investigating tapeworms or parasites presence in sharks, cut open the spiral valves and remove parts of the lumen tissue (Curran and Caira, 1995; Alarcos et al., 2006) or the contents via suspension, washing or shaking (Henderson et al., 2002; Randhawa and Brickle, 2011). Different methodologies to extract spiral valve content and tissue were explored and the most appropriate method, a combination of gravity and massaging, was applied on the remaining spiral valves. Several studies report microplastic ingestion based on the examination of the whole or substantial parts of the digestive tract (Foekema et al., 2013; Lusher et al., 2013; Phillips and Bonner, 2015; Bernardini et al., 2018; Sampaio et al., 2018; Smith, 2018). Most laboratory equipment was not readily available for the rather large volumes of porbeagle spiral valve content we encountered (e.g., one porbeagle spiral valve content measured 424 g w.w.). Hence, only subsamples of the spiral valve content were analyzed.
This study supports the use of a 10% KOH solution to digest spiral valve content and tissue. The (lipid) content of the spiral valves left fatty residues on the filter after digestion. To improve results, the filters were washed with alkaline soap to decrease the amount of residue. The success of this mixture aligns with previous findings which suggest that a combined alkaline digestion with KOH and NaClO are useful compounds when digesting biota and/or gastrointestinal content for microplastic analysis (Cole et al., 2014; Strand and Tairova, 2016; Enders et al., 2017). This method, using a post soap wash step, proved to be safe, cost effective, with less procedural steps, without affecting any of our spiked microplastics. Although good results were obtained with the alkaline soap, it was decided to harmonize procedures by adopting the combined KOH:NaClO digestion for future biota analysis in our laboratory.
To exclude non-plastic particles during the microscopic analysis, a step to determine the consistency of the larger particles (>100 μm) was added. Fish bone remains were easily distinguished from plastics by carefully touching the item with a needle. On applying pressure, the remains of prey broke down into a powder following alkaline digestion (Kaye et al., 2004). One spiral valve contained a large amount of sand, making visual microplastic analysis impossible, although this was not an issue in the other spiral valves, it would be useful to introduce a density separation and simplify microplastic detection (e.g., Nile red; Maes et al., 2017a) by introducing additional steps after the digestion procedure. This shows that while certain steps of the protocol can be harmonized (e.g., KOH digestion and microplastic quantification), small adaptations might be required to make protocols species or case specific.
Although no values were reported for spiral valve 1, due to the presence of sand, plastics particles were detected in both the content and tissue of all spiral valves. Fibers, blue fragments and black fragments were most prevalent. Remarkably, all spiral valves and some of the blanks contained blue fragments. It was suspected that these fragments were a result of contamination due to the high numbers of particles with this specific combination of shape and color. Although Raman spectroscopy was applied, there is still some uncertainty in terms of the origin of these fragments. At the moment, certified reference materials are unavailable and polymer identification with spectroscopy is wrought with challenges, especially in this small size range of weathered and pigmented particles detection (Lenz et al., 2015; Araujo et al., 2018). The Raman spectroscopy picked up the spectra of the blue pigments more easily than polymer spectra and confirmed that the blue pigment in the packaging of the filters was comparable with some blue fragments in the samples. This could be due to resonance enhancement, where signals from the pigment are enhanced, but signals from the polymer are hidden. The pigment is known as copper phthalocyanine and is used in multiple applications. Several studies mentioned blue plastic fragments in environmental samples and attribute the Raman spectra to this pigment (Van Cauwenberghe et al., 2013, 2015; Karlsson, 2014; Van Cauwenberghe and Janssen, 2014) which makes source tracking rather difficult. It indicates that non-plastic materials, including filter packaging, should be used, wherever possible, to minimize contamination and/or when in doubt, screening for plastic contamination should take place prior to usage. Extra precautions should be sought to further lower the blank values. Only a small portion of samples were higher than the LoQ. This may be partly due to the low number of blanks used. It is therefore recommended to increase the number of procedural blanks and to repeat this over time as contamination might be day dependent.
The high numbers of microplastics in the spiral valves imply that plastic is ingested and digested by porbeagle sharks. In 4 out of 9 spiral valves, more plastic particles per g w.w. were found in tissue samples than in spiral valve content. This indicates that taking samples from solely the content might not represent the actual amount of microplastics in the spiral valve. Moreover, the results of the lipid content and tissue analysis demonstrate that the sample collection via the massaging method might not be enough to collect all content (Supporting Information). This was already observed during the tissue sample collection, small amounts of spiral valve content were stuck to the surface of the tissue. Therefore, it is uncertain whether and how many microplastics in the tissue samples were resulting from the small amounts of content in the tissue samples or if the microplastics were absorbed into the 3D structured lining of the tissue where nutrients are absorbed into the shark’s body. Eventually, this might result in adverse effects on the shark’s health if other organs and tissues are exposed (Browne et al., 2008; Wright et al., 2013; GESAMP, 2015a; Panti et al., 2016). Due to this uncertainty both spiral valve content and tissue should be analyzed and reported jointly for monitoring purposes. Parasites were present within the spiral valves but contained no plastic particles. This could be due to visual cut off point of 10 μm. The collected parasites might ingest particles much smaller than the particle size examined in this study. In addition, the parasites of only one spiral valve were examined and therefore, no conclusions about microplastic ingestion in parasites can be drawn.
To examine if the porbeagle shark’s health was adversely affected by microplastic ingestion, we looked for a correlation between the average plastic particle per g w.w. in spiral valves content/tissue and several general health indices. In this case, the Hepatosomatic Index seemed to be the most relevant health indicator in relation to microplastic ingestion, maybe because it relates more directly to toxic effects (Scacco et al., 2010). Some microplastics will be excreted together with the rest of the spiral valve content. A portion gets stuck within the tissue and could potentially exchange chemicals (Koelmans et al., 2013, 2014) during their extended stay in the digestive tract. Previous studies reported chemical concentration levels in the liver (Bendall et al., 2014) and muscles (Nicolaus et al., 2016) of porbeagles and concluded that current levels were mostly low or undetectable. To preserve these and other vulnerable marine top predator species, examining both microplastics and concentrations of toxic chemicals adsorbed or leaching from microplastics and in specimens itself would be recommended to provide more insights in the toxicity of microplastic particles and associated chemical equilibriums (Koelmans et al., 2013). Moreover, additional ecosystem variables should be considered, such as the presence of parasites and a range of environmental stressors. Although no statistically significant correlation between the average plastic particle per g w.w. tissue and Hepatosomatic Index was observed, the correlation was moderately positive. An explanation could be that liver weight increases due to pathological changes (Scacco et al., 2010) as a result of the increased residence of microplastics in the gut, causing a higher Hepatosomatic Index. All other correlations were not statistically significant (all p > 0.05). This could be due to the small sample size in the analyses (n = 9). However, it is likely that the found concentrations of microplastics in the spiral valve of the porbeagles did not cause effects measurable by general health condition indexes such as the Hepatosomatic Index. Similarly, some fish studies reported no statistical significant relation between plastic ingestion and their condition (Foekema et al., 2013; Zoeter Vanpoucke, 2015).
The presence of microplastics in porbeagle sharks is most likely the result of the contamination of their food supply (Foekema et al., 2013; Lusher et al., 2013) (indirect) and/or internal fragmentation of the larger plastics they ingested (Cliff et al., 2002) (direct). DNA analysis did not allow us to ascertain what the porbeagle sharks diet consisted of and whether prey was the source of microplastics (Supporting Information). Earlier studies indicated potential accumulation and trophic transfer of microplastics across parts of the foodweb (Farrell and Nelson, 2013; Setälä et al., 2014; Lusher et al., 2015a). Studies looking at microplastics in fish from the North Atlantic region report around one microplastic per fish (Foekema et al., 2013; Lusher et al., 2013; GESAMP, 2015b). When recalculating the total amounts of microplastics in the spiral valves of porbeagle sharks, rather large numbers were observed (Table 3). Concentration went up as high as 6116 microplastics per individual spiral valve, suggesting that microplastics are accumulating across the food web, potentially harming critically endangered North East Atlantic porbeagle sharks.
The present work emphasizes the potential for top predator application in microplastic monitoring. Porbeagle sharks are apex predators feeding on a wide range of organisms, including teleosts and cephalopods (Ellis and Shackley, 1995; Joyce et al., 2002; Francis et al., 2009) and play a key role in controlling ecosystem dynamics (Francis et al., 2009). Distances of over 1,000 nautical miles (nm) were recorded by tagged porbeagle sharks, though over 90% of the 143 sharks tagged moved less than 500 nm from their original tagging location (Campana and Gibson, 2008; Pade et al., 2009). Although one porbeagle has been recorded crossing the Atlantic (Francis et al., 2009), tagged sharks in the Celtic Sea mostly remained in that area (Pade et al., 2009). The spatial distribution of incidental porbeagle bycatch reported by the participating vessels confirm that porbeagles are widespread within the Celtic Sea (Ellis and Bendall, 2015). There may be a separate North Atlantic stock off Iceland (Matsumoto, 2006), this North-East Atlantic stock is generally considered to be distinct from those in the North-West Atlantic and Mediterranean (ICES and WGEF, 2007; FAO, 2010). As such, porbeagle sharks could be an ideal species for integrated monitoring across a wider (sub)region. In future, it would be recommended to target spiral valve content in by-caught Elasmobranches, such as the porbeagle shark, for microplastics monitoring purposes. This avoids potential bias from gastric evacuation (Eggers, 1977; Bromley, 1994; Cortés, 1997; Bucking, 2015) and might give a better link to probable impacts and pollutant loads as it relates to digestion (Bucking, 2015). To overcome temporal changes in bycatch rates of porbeagle sharks in gillnets (Bendall et al., 2012; McCully et al., 2013; Ellis and Bendall, 2015) and to support an appropriate microplastics monitoring program, the analysis should be expanded to other by-caught top predator species.
Data Availability Statement
All datasets generated for this study are included in the article/Supplementary Material.
Ethics Statement
Ethical review and approval was not required for the animal study because the porbeagle sharks were obtained dead, captured as seasonal by-catch in gillnet fisheries, and processed for research purposes.
Author Contributions
TM: setup and organization of study and sampling protocols, spiral valves collection, preservation and transport, design microplastic analysis protocols and layout, overview student work, manuscript writing and editing, and manuscript submission. JD: sample analysis and processing, data analysis, reporting, and report writing. AV: analysis protocols, student supervision, and data interpretation. MD: sample collection, dissections, porbeagle measurements. VB: porbeagle collection and organization of dissections. MV: student support, microplastic analysis, and lab supervision. HL: student support, data interpretation, and report writing.
Funding
Samples of dead bycatch of porbeagle shark were collected under the Defra-funded NEPTUNE project (MB5201). The work was partly funded by the CleanAtlantic project (EAPA_46/2016) and the UK DEFRA SLA14 project.
Conflict of Interest
The authors declare that the research was conducted in the absence of any commercial or financial relationships that could be construed as a potential conflict of interest.
Acknowledgments
We thank the skippers and crews of participating vessels for retaining dead specimens for this scientific study. Thanks to G.J. Burt, M. Eade, C. Gordon, S. Hetherington, P. Randall, J. Richardson, A. Riley, J. Ellis, J.F. Silva for assistance in biological sampling. We would like to thank Adil Bakir for the revision of the final manuscript. We are grateful to Rien Dekkers (Centre for Neurogenomics & Cognitive Research, Vrije Universiteit Amsterdam) for his input in tissue histology. Jack Ursem is gratefully acknowledged for preparing the histology slides and Symbiant Pathology Expert Centre for their hospitality in their centre in Hoorn. Lastly, we thank Liron Zada (Institute for Lasers, Life and Biophotonics, Vrije Universiteit Amsterdam for his time and expertise during the Raman measurements.
Supplementary Material
The Supplementary Material for this article can be found online at: https://www.frontiersin.org/articles/10.3389/fmars.2020.00273/full#supplementary-material
References
Alarcos, A. J., Ivanov, V. A., and Sardella, N. H. (2006). Distribution patterns and interactions of cestodes in the spiral intestine of the narrownose smooth-hound shark, Mustelus schmitti Springer, 1939 (Chondrichthyes, Carcharhiniformes). Acta Parasitol. 51, 100–106. doi: 10.2478/s11686-006-0015-7
Alomar, C., and Deudero, S. (2017). Evidence of microplastic ingestion in the shark Galeus melastomus Rafinesque, 1810 in the continental shelf off the western Mediterranean Sea. Environ. Pollut. 23, 223–229. doi: 10.1016/j.envpol.2017.01.015
Araujo, C. F., Nolasco, M. M., Ribeiro, A. M. P., and Ribeiro-Claro, P. J. A. (2018). Identification of microplastics using raman spectroscopy: latest developments and future prospects. Water Res. 142, 426–440. doi: 10.1016/j.watres.2018.05.060
Barboza, L. G. A., Dick Vethaak, A., Lavorante, B. R. B. O., Lundebye, A. K., and Guilhermino, L. (2018). Marine microplastic debris: an emerging issue for food security, food safety and human health. Mar. Pollut. Bull. 133, 336–348. doi: 10.1016/j.marpolbul.2018.05.047
Barboza, L. G. A., and Gimenez, B. C. G. (2015). Microplastics in the marine environment: current trends and future perspectives. Mar. Pollut. Bull. 97, 5–12. doi: 10.1016/j.marpolbul.2015.06.008
Barreto, R., Bornatowski, H., Fiedler, F. N., Pontalti, M., da Costa, K. J., Nascimento, C., et al. (2019). Macro-debris ingestion and entanglement by blue sharks (Prionace glauca Linnaeus, 1758) in the temperate South Atlantic Ocean. Mar. Pollut. Bull. 145, 214–218. doi: 10.1016/J.MARPOLBUL.2019.05.025
Bellas, J., Martínez-Armental, J., Martínez-Cámara, A., Besada, V., and Martínez-Gómez, C. (2016). Ingestion of microplastics by demersal fish from the Spanish Atlantic and Mediterranean coasts. Mar. Pollut. Bull. 109, 55–60. doi: 10.1016/j.marpolbul.2016.06.026
Beltrán-Sanahuja, A., Casado-Coy, N., Simó-Cabrera, L., and Sanz-Lázaro, C. (2020). Monitoring polymer degradation under different conditions in the marine environment. Environ. Pollut. 259:113836. doi: 10.1016/j.envpol.2019.113836
Bendall, V. A., Barber, J. L., Papachlimitzou, A., Bolam, T., Warford, L., Hetherington, S. J., et al. (2014). Organohalogen contaminants and trace metals in North-East Atlantic porbeagle shark (Lamna nasus). Mar. Pollut. Bull. 85, 280–286. doi: 10.1016/j.marpolbul.2014.05.054
Bendall, V. A., Hetherington, S. J., Ellis, J. R., Smith, S. F., Ives, M. J., Gregson, J., et al. (2012). Spurdog, Porbeagle and Common Skate Bycatch and Discard Reduction. Fish. Sci. Partnersh. 2011-2012, Final Report. Lowestoft: Cefas, 88.
Bernardini, I., Garibaldi, F., Canesi, L., Fossi, M. C., and Baini, M. (2018). First data on plastic ingestion by blue sharks (Prionace glauca) from the Ligurian Sea (North-Western Mediterranean Sea). Mar. Pollut. Bull. 135, 303–310. doi: 10.1016/j.marpolbul.2018.07.022
Besseling, E., Foekema, E. M., Van Franeker, J. A., Leopold, M. F., Kühn, S., Bravo Rebolledo, E. L., et al. (2015). Microplastic in a macro filter feeder: humpback whale Megaptera novaeangliae. Mar. Pollut. Bull. 95, 248–252. doi: 10.1016/j.marpolbul.2015.04.007
Besseling, E., Redondo-Hasselerharm, P., Foekema, E. M., and Koelmans, A. A. (2019). Quantifying ecological risks of aquatic micro- and nanoplastic. Crit. Rev. Environ. Sci. Technol. 49, 32–80. doi: 10.1080/10643389.2018.1531688
Beveridge, I., and Justine, J. L. (2007). Pseudolacistorhynchus nanus n. Sp. (Cestoda: Trypanorhyncha) parasitic in the spiral valve of the zebra shark, Stegostoma Fasciatum (Hermann, 1783). Trans. R. Soc. South Aust. 13, 175–181. doi: 10.1080/03721426.2007.10887081
Bonnaterre, P. J. (1788). “Tableau encyclopédique et méthodique des trois regnes de la nature,” Par l’abbé Bonnaterre, ed. R. Bénard (Panckoucke, Charles Joseph: Paris). doi: 10.5962/bhl.title.11660
Bromley, P. J. (1994). The role of gastric evacuation experiments in quantifying the feeding rates of predatory fish. Rev. Fish Biol. Fish. 4, 36–66. doi: 10.1007/BF00043260
Browne, M. A., Dissanayake, A., Galloway, T. S., Lowe, D. M., and Thompson, R. C. (2008). Ingested microscopic plastic translocates to the circulatory system of the mussel, Mytilus edulis (L.). Environ. Sci. Technol. 42, 5026–5031. doi: 10.1021/es800249a
Bucking, C. (2015). Feeding and digestion in elasmobranchs: tying diet and physiology together. Fish Physiol. 34, 347–394. doi: 10.1016/B978-0-12-801286-4.00006-X
Campana, S., and Gibson, J. (2008). Catch and Stock Status of Porbeagle Shark (Lamna nasus) in the Northwest Atlantic to 2007. NAFO Doc. 08/36. Dartmouth: Northwest Atlantic Fisheries Organization.
Cartes, J. E., Soler-Membrives, A., Stefanescu, C., Lombarte, A., and Carrassón, M. (2016). Contributions of allochthonous inputs of food to the diets of benthopelagic fish over the northwest mediterranean slope (to 2300 m). Deep. Res. Part I Oceanogr. Res. Pap. 109, 123–136. doi: 10.1016/j.dsr.2015.11.001
Claessens, M., Van Cauwenberghe, L., Vandegehuchte, M. B., and Janssen, C. R. (2013). New techniques for the detection of microplastics in sediments and field collected organisms. Mar. Pollut. Bull. 70, 227–233. doi: 10.1016/j.marpolbul.2013.03.009
Cliff, G., Dudley, S. F. J., Ryan, P. G., and Singleton, N. (2002). Large sharks and plastic debris in KwaZulu-Natal. South Afr. Mar. Freshw. Res. 53, 575–581. doi: 10.1071/MF01146
Cole, M., Webb, H., Lindeque, P. K., Fileman, E. S., Halsband, C., and Galloway, T. S. (2014). Isolation of microplastics in biota-rich seawater samples and marine organisms. Sci. Rep. 4, 4528. doi: 10.1038/srep04528
Cortés, E. (1997). A critical review of methods of studying fish feeding based on analysis of stomach contents: application to elasmobranch fishes. Can. J. Fish. Aquat. Sci. 54, 726–738. doi: 10.1139/f96-316
Curran, S., and Caira, J. N. (1995). Attachment site specificity and the tapeworm assemblage in the spiral intestine of the blue shark (Prionace glauca). J. Parasitol. 81, 149–157. doi: 10.2307/3283913
Dailey, M. D., and Vogelbein, W. (1990). Clistobothrium carcharodoni gen. et sp. n. (Cestoda: Tetraphyllidea) from the spiral valve of the great white shark (Carcharodon carcharias). J. Helminthol. Soc. Washingt. 57, 108–112.
De Witte, B., Devriese, L., Bekaert, K., Hoffman, S., Vandermeersch, G., Cooreman, K., et al. (2014). Quality assessment of the blue mussel (Mytilus edulis): comparison between commercial and wild types. Mar. Pollut. Bull. 85, 146–155. doi: 10.1016/j.marpolbul.2014.06.006
Diana, B., Jenson, V. R., Deepak, J., Prabhakaran, M. P., Kurup, B. M., and Harikrishnan, M. (2014). Plastic ingestion by bigeye thresher shark alopias superciliosus off ratnagiri southwest coast of India. Int. J. Environ. Sci. 5, 277–281. doi: 10.6088/ijes.2014050100024
Eerkes-Medrano, D., Thompson, R. C., and Aldridge, D. C. (2015). Microplastics in freshwater systems: a review of the emerging threats, identification of knowledge gaps and prioritisation of research needs. Water Res. 75, 63–82. doi: 10.1016/j.watres.2015.02.012
Eggers, D. M. (1977). Factors in interpreting data obtained by diel sampling of fish stomachs. J. Fish. Res. Board Canada 34, 290–294. doi: 10.1139/f77-045
Ellis, J. R., and Bendall, V. A. (2015). Preliminary Estimates of Bycatch Rates of Porbeagle shark Lamna Nasus in Gillnet Fisheries in the Celtic Sea (ICES Divisions VIIf-h) and Associated Biological Observations. Lisbon: WGEF.
Ellis, J. R., and Shackley, S. E. (1995). Notes on porbeagle sharks. Lamna nasus, from the Bristol channel. J. Fish Biol. 46, 368–370. doi: 10.1111/j.1095-8649.1995.tb05976.x
Enders, K., Lenz, R., Beer, S., and Stedmon, C. A. (2017). Extraction of microplastic from biota: recommended acidic digestion destroys common plastic polymers. ICES J. Mar. Sci. 74, 326–331. doi: 10.1093/icesjms/fsw173
Eriksen, M., Lebreton, L. C. M., Carson, H. S., Thiel, M., Moore, C. J., Borerro, J. C., et al. (2014). Plastic pollution in the world’s oceans: more than 5 trillion plastic pieces weighing over 250,000 Tons Afloat at Sea. PLoS One 9:e111913. doi: 10.1371/journal.pone.0111913
FAO (2010). Report of the Third FAO Expert Advisory Panel for the Assessment of Proposals to Amend Appendices I and II of CITES Concerning Commercially-exploited Aquatic Species. Rome: FAO.
Farrell, P., and Nelson, K. (2013). Trophic level transfer of microplastic: Mytilus edulis (L.) to Carcinus maenas (L.). Environ. Pollut. 177, 1–3. doi: 10.1016/j.envpol.2013.01.046
Ferreira, M. (2014). Guidance on Monitoring of Marine Litter in European Seas. Brussels: European commission.
Foekema, E. M., De Gruijter, C., Mergia, M. T., van Franeker, J. A., Murk, A. J., and Koelmans, A. A. (2013). Plastic in north sea fish. Environ. Sci. Technol. 47, 8818–8824. doi: 10.1021/es400931b
Fossi, M. C., Baini, M., Panti, C., Galli, M., Jiménez, B., Muñoz-Arnanz, J., et al. (2017). Are whale sharks exposed to persistent organic pollutants and plastic pollution in the Gulf of California (Mexico)? First ecotoxicological investigation using skin biopsies. Comp. Biochem. Physiol. Part C Toxicol. Pharmacol. 199, 48–58. doi: 10.1016/j.cbpc.2017.03.002
Fossi, M. C., Coppola, D., Baini, M., Giannetti, M., Guerranti, C., Marsili, L., et al. (2014). Large filter feeding marine organisms as indicators of microplastic in the pelagic environment: the case studies of the Mediterranean basking shark (Cetorhinus maximus) and fin whale (Balaenoptera physalus). Mar. Environ. Res. 100, 17–24. doi: 10.1016/j.marenvres.2014.02.002
Francis, M. P., Natanson, L. J., and Campana, S. E. (2009). “the biology and ecology of the porbeagle shark, lamna nasus,” in Sharks of the Open Ocean: Biology, Fisheries and Conservation, eds M. D. Camhi, E. K. Pikitch, and E. A. Babcock (Hoboken, NJ: John Wiley & Sons), 105–113. doi: 10.1002/9781444302516.ch9
GESAMP (2015a). Sources, Fate and Effects of Microplastics in the Marine Environment: a Global Assessment. London: GESAMP.
GESAMP (2015b). “Sources, fate and effects of microplastics in the marine environment: part 2 of a global assessment,” in (IMO, FAO/UNESCO-IOC/UNIDO/WMO/IAEA/UN/UNEP/UNDP), Rep. Stud. GESAMP No. 90 (ed.) P. J. Kershaw (London: GESAMP), 96.
GESAMP (2019). Guidelines for the monitoring and assessment of plastic litter in the ocean. GESAMP Reports Stud. 99:130.
Goede, R. W., and Barton, B. A. (1990). “Organismic indices and an autopsy-based assessment as indicators of health and condition in fish,” in Biological Indicators of Stress, ed S. M. Adam (Bethesda, MD: American Fisheries Society).
Gómez, M., Reggio, D., and Lazzari, M. (2019). Detection of degradation markers from polymer surfaces by a novel SERS-based strategy. Talanta 191, 156–161. doi: 10.1016/J.TALANTA.2018.08.046
Harrison, J. P., Schratzberger, M., Sapp, M., and Osborn, A. M. (2014). Rapid bacterial colonization of low-density polyethylene microplastics in coastal sediment microcosms. BMC Microbiol. 14:232. doi: 10.1186/s12866-014-0232
Hartley, B. L., Pahl, S., Veiga, J., Vlachogianni, T., Vasconcelos, L., Maes, T., et al. (2018). Exploring public views on marine litter in Europe: perceived causes, consequences and pathways to change. Mar. Pollut. Bull. 133, 945–955. doi: 10.1016/j.marpolbul.2018.05.061
Henderson, A. C., Flannery, K., and Dunne, J. (2002). Parasites of the blue shark (Prionace glauca L.). the North-East Atlantic Ocean. J. Nat. Hist. 36, 1995–2004. doi: 10.1080/00222930110078834
Hyslop, E. J. (1980). Stomach contents analysis-a review of methods and their application. J. Fish Biol. 17, 411–429. doi: 10.1111/j.1095-8649.1980.tb02775.x
IUCN (2015). Red List. Available online at: https://www.iucnredlist.org/species/11200/48916453 (accessed April 22, 2020).
Jacobsen, J. K., Massey, L., and Gulland, F. (2010). Fatal ingestion of floating net debris by two sperm whales (Physeter macrocephalus). Mar. Pollut. Bull. 60, 765–767. doi: 10.1016/j.marpolbul.2010.03.008
Jambeck, J. R., Geyer, R., Wilcox, C., Siegler, T. R., Perryman, M., Andrady, A., et al. (2015). Plastic waste inputs from land into the ocean. Science 347, 768–770. doi: 10.1017/CBO9781107415386.010
Joyce, W. N., Campana, S. E., Natanson, L. J., Kohler, N. E., and Pratt, H. L. Jr. (2002). Analysis of stomach contents of the porbeagle shark (Lamna nasus Bonnaterre) in the northwest Atlantic. ICES J. Mar. Sci. 59, 1263–1269. doi: 10.1006/jmsc.2002.1286
Karlsson, T. M. (2014). “Can Microlitter in Sediment and Biota be Quantified?,” in Method Development and Analysis of Microlitter in Field-Collected Biota and Sediment. Gothenburg: University of Gothenburg.
Kaye, G. I., Weber, P. B., and Wetzel, W. L. (2004). The alkaline hydrolysis process. ALN Mag. 108, 1–5.
Koelmans, A. A., Besseling, E., and Foekema, E. M. (2014). Leaching of plastic additives to marine organisms. Environ. Pollut. 187, 49–54. doi: 10.1016/j.envpol.2013.12.013
Koelmans, A. A., Besseling, E., Wegner, A., and Foekema, E. M. (2013). Plastic as a carrier of POPs to aquatic organisms: a model analysis. Environ. Sci. Technol. 47, 7812–7820. doi: 10.1021/es401169n
Kühn, S., van Werven, B., van Oyen, A., Meijboom, A., Bravo Rebolledo, E. L., and van Franeker, J. A. (2017). The use of potassium hydroxide (KOH) solution as a suitable approach to isolate plastics ingested by marine organisms. Mar. Pollut. Bull. 115, 86–90. doi: 10.1016/j.marpolbul.2016.11.034
Lenz, R., Enders, K., Stedmon, C. A., Mackenzie, D. M. A., and Gissel, T. (2015). A critical assessment of visual identification of marine microplastic using Raman spectroscopy for analysis improvement. Mar Pollut Bull. 100, 82–91. doi: 10.1016/j.marpolbul.2015.09.026
Lusher, A. L., Burke, A., O’Connor, I., and Officer, R. (2014). Microplastic pollution in the Northeast Atlantic Ocean: validated and opportunistic sampling. Mar. Pollut. Bull. 88, 325–333. doi: 10.1016/j.marpolbul.2014.08.023
Lusher, A. L., Hernandez-Milian, G., O’Brien, J., Berrow, S., O’Connor, I., and Officer, R. (2015a). Microplastic and macroplastic ingestion by a deep diving, oceanic cetacean: the True’s beaked whale Mesoplodon mirus. Environ. Pollut. 199, 185–191. doi: 10.1016/j.envpol.2015.01.023
Lusher, A. L., Tirelli, V., O’Connor, I., and Officer, R. (2015b). Microplastics in Arctic polar waters: the first reported values of particles in surface and sub-surface samples. Sci. Rep. 5:14947. doi: 10.1038/srep14947
Lusher, A. L., McHugh, M., and Thompson, R. C. (2013). Occurrence of microplastics in the gastrointestinal tract of pelagic and demersal fish from the English Channel. Mar. Pollut. Bull. 67, 94–99. doi: 10.1016/j.marpolbul.2012.11.028
Lusher, A. L., O’Donnell, C., Officer, R., and O’Connor, I. (2016). Microplastic interactions with North Atlantic mesopelagic fish. ICES J. Mar. Sci. 73, 1214–1225. doi: 10.1093/icesjms/fsv241
Maes, T., Barry, J., Stenton, C., Roberts, E., Hicks, R., Bignell, J., et al. (2020). The world is your oyster: low-dose, long-term microplastic exposure of juvenile oysters. Heliyon 6:e03103. doi: 10.1016/j.heliyon.2019.e03103
Maes, T., Jessop, R., Wellner, N., Haupt, K., and Mayes, A. G. (2017a). A rapid-screening approach to detect and quantify microplastics based on fluorescent tagging with Nile Red. Sci. Rep. 7, 44501. doi: 10.1038/srep44501
Maes, T., Van der Meulen, M. D., Devriese, L. I., Leslie, H. A., Huvet, A., Frère, L., et al. (2017b). Microplastics baseline surveys at the water surface and in sediments of the North-East Atlantic. Front. Mar. Sci. 4:135. doi: 10.3389/fmars.2017.00135
Matsumoto, T. (2006). Report of observer program for Japanese tuna longline fishery in the Atlantic Ocean from August 2004 to January 2005. Collect. Vol. Sci. Pap. ICCAT. 59, 663–681.
McCully, S. R., Scott, F., Ellis, J. R., and Pilling, G. M. (2013). Productivity and susceptibility analysis: application and suitability for data poor assessment of elasmobranchs in Northern European Seas. Collect. Vol. Sci. Pap. 69, 1679–1698.
Nelms, S. E., Galloway, T. S., Godley, B. J., Jarvis, D. S., and Lindeque, P. K. (2018). Investigating microplastic trophic transfer in marine top predators. Environ. Pollut. 238, 999–1007. doi: 10.1016/j.envpol.2018.02.016
Nicolaus, E. E. M., Bendall, V. A., Bolam, T. P. C., Maes, T., and Ellis, J. R. (2016). Concentrations of mercury and other trace elements in porbeagle shark Lamna nasus. Mar. Pollut. Bull. 112, 406–410. doi: 10.1016/j.marpolbul.2016.07.047
Nock, A. M., and Caira, J. N. (1988). Disculiceps galapagoensis n. sp. (Lecanicephalidea: Disculicepitidae) from the Shark, Carcharhinus longimanus, with Comments on D. pileatus. J. Parasitol. 74, 153–158. doi: 10.2307/3282492
Pade, N. G., Queiroz, N., Humphries, N. E., Witt, M. J., Jones, C. S., Noble, L. R., et al. (2009). First results from satellite-linked archival tagging of porbeagle shark, Lamna nasus: area fidelity, wider-scale movements and plasticity in diel depth changes. J. Exp. Mar. Bio. Ecol. 370, 64–74. doi: 10.1016/j.jembe.2008.12.002
Panti, C., Fossi, M. C., Baini, M., and Koelmans, A. A. (2016). “Microplastic as a vector of chemicals to fin whale and basking shark in the mediterranean sea: a model-supported analysis of available data,” in Fate and Impact of Microplastics in Marine Ecosystems, eds J. Baztan, B. Jorgensen, S. Pahl, R. C. Thompson, and J.-P. Vanderlinden (Amsterdam: Elsevier).
Pham, C. K., Gomes-Pereira, J. N., Isidro, E. J., Santos, R. S., and Morato, T. (2013). Abundance of litter on condor seamount (Azores, Portugal, Northeast Atlantic). Deep. Res. Part II Top. Stud. Oceanogr. 98, 204–208. doi: 10.1016/j.dsr2.2013.01.011
Phillips, M. B., and Bonner, T. H. (2015). Occurrence and amount of microplastic ingested by fishes in watersheds of the Gulf of Mexico. Mar. Pollut. Bull. 100, 264–269. doi: 10.1016/j.marpolbul.2015.08.041
Randhawa, H. S., and Brickle, P. (2011). Larval parasite gene sequence data reveal cryptic trophic links in life cycles of porbeagle shark tapeworms. Mar. Ecol. Prog. Ser. 431, 215–222. doi: 10.3354/meps09108
Sampaio, C. L. S., Leite, L., Reis-Filho, J. A., Loiola, M., Miranda, R. J., de Anchieta, C. C., et al. (2018). New insights into whale shark Rhincodon typus diet in Brazil: an observation of ram filter-feeding on crab larvae and analysis of stomach contents from the first stranding in Bahia state. Environ. Biol. Fishes 101, 1285–1293. doi: 10.1007/s10641-018-0775-6
Scacco, U., La Mesa, G., and Vacchi, M. (2010). Body morphometrics, swimming diversity and niche in demersal sharks: a comparative case study from the Mediterranean Sea. Sci. Mar. 74, 37–53. doi: 10.3989/scimar.2010.74n1037
Setälä, O., Fleming-Lehtinen, V., and Lehtiniemi, M. (2014). Ingestion and transfer of microplastics in the planktonic food web. Environ. Pollut. 185, 77–83. doi: 10.1016/j.envpol.2013.10.013
Smith, L. E. (2018). Plastic ingestion by Scyliorhinus canicula trawl captured in the North Sea. Mar. Pollut. Bull. 130, 6–7. doi: 10.1016/j.marpolbul.2018.03.001
Steer, M., Cole, M., Thompson, R. C., and Lindeque, P. K. (2017). Microplastic ingestion in fish larvae in the western English Channel. Environ. Pollut. 226, 250–259. doi: 10.1016/j.envpol.2017.03.062
Strand, J., and Tairova, Z. (2016). Microplastic particles in North Sea sediments 2015. DCE - Danish Cent. Environ. Energy. 178, 1–24.
Teuten, E. L., Saquing, J. M., Knappe, D. R. U., Barlaz, M. A., Jonsson, S., Björn, A., et al. (2009). Transport and release of chemicals from plastics to the environment and to wildlife. Philos. Trans. R. Soc. Lond. B. Biol. Sci. 364, 2027–2045. doi: 10.1098/rstb.2008.0284
Thiele, C. J., Hudson, M. D., and Russell, A. E. (2019). Evaluation of existing methods to extract microplastics from bivalve tissue: adapted KOH digestion protocol improves filtration at single-digit pore size. Mar. Pollut. Bull. 142, 384–393. doi: 10.1016/j.marpolbul.2019.03.003
UNEP (2016). Marine Plastic Debris and Microplastics – Global Lessons and Research to Inspire Action and Guide Policy Change. Nairobi: UNEP.
Van Cauwenberghe, L., Devriese, L., Galgani, F., Robbens, J., and Janssen, C. R. (2015). Microplastics in sediments: a review of techniques, occurrence and effects. Mar. Environ. Res. 111, 5–17. doi: 10.1016/j.marenvres.2015.06.007
Van Cauwenberghe, L., and Janssen, C. R. (2014). Microplastics in bivalves cultured for human consumption. Environ. Pollut. 193, 65–70. doi: 10.1016/j.envpol.2014.06.010
Van Cauwenberghe, L., Vanreusel, A., Mees, J., and Janssen, C. R. (2013). Microplastic pollution in deep-sea sediments. Environ. Pollut. 182, 495–499. doi: 10.1016/j.envpol.2013.08.013
Van Franeker, J. A., Blaize, C., Danielsen, J., Fairclough, K., Gollan, J., Guse, N., et al. (2011). Monitoring plastic ingestion by the northern fulmar Fulmarus glacialis in the North Sea. Environ. Pollut. 159, 2609–2615. doi: 10.1016/j.envpol.2011.06.008
van Sebille, E., Wilcox, C., Lebreton, L., Maximenko, N., Hardesty, B. D., van Franeker, J. A., et al. (2015). A global inventory of small floating plastic debris. Environ. Res. Lett. 10:124006. doi: 10.1088/1748-9326/10/12/124006
Werner, S., Budziak, A., Van Fanneker, J. A., Galgani, F., Hanke, G., Maes, T., et al. (2016). Harm caused by Marine Litter. (MSFD GES TG Marine Litter - Thematic Report; No. EUR 28317). Luxembourg: European Union.
Whitacre, D. M. (2010). Reviews of Environmental Contamination and Toxicology. Berlin: Springer Science & Business Media.
Woodall, L. C., Gwinnett, C., Packer, M., Thompson, R. C., Robinson, L. F., and Paterson, G. L. J. (2015a). Using a forensic science approach to minimize environmental contamination and to identify microfibres in marine sediments. Mar. Pollut. Bull. 95, 40–46. doi: 10.1016/j.marpolbul.2015.04.044
Woodall, L. C., Robinson, L. F., Rogers, A. D., Narayanaswamy, B. E., and Paterson, G. L. J. (2015b). Deep-sea litter: a comparison of seamounts, banks and a ridge in the Atlantic and Indian Oceans reveals both environmental and anthropogenic factors impact accumulation and composition. Front. Mar. Sci. 2:3. doi: 10.3389/fmars.2015.00003
Wright, S. L., Thompson, R. C., and Galloway, T. S. (2013). The physical impacts of microplastics on marine organisms: a review. Environ. Pollut. 178, 483–492. doi: 10.1016/j.envpol.2013.02.031
Yeo, B. G., Takada, H., Hosoda, J., Kondo, A., Yamashita, R., Saha, M., et al. (2017). Polycyclic aromatic hydrocarbons (PAHs) and hopanes in plastic resin pellets as markers of oil pollution via international pellet watch monitoring. Arch. Environ. Contam. Toxicol 73, 196–206. doi: 10.1007/s00244-017-0423-8
Keywords: marine litter, microplastics, top predator, porbeagle shark, Lamna nasus, Raman spectroscopy, trophic transfer, food web accumulation
Citation: Maes T, van Diemen de Jel J, Vethaak AD, Desender M, Bendall VA, van Velzen M and Leslie HA (2020) You Are What You Eat, Microplastics in Porbeagle Sharks From the North East Atlantic: Method Development and Analysis in Spiral Valve Content and Tissue. Front. Mar. Sci. 7:273. doi: 10.3389/fmars.2020.00273
Received: 16 July 2019; Accepted: 06 April 2020;
Published: 05 May 2020.
Edited by:
Hrissi Kassiani Karapanagioti, University of Patras, GreeceReviewed by:
Olgaç Güven, Akdeniz University, TurkeyAna Markic, Independent Researcher, Auckland, New Zealand
Copyright © 2020 Maes, van Diemen de Jel, Vethaak, Desender, Bendall, van Velzen and Leslie. This is an open-access article distributed under the terms of the Creative Commons Attribution License (CC BY). The use, distribution or reproduction in other forums is permitted, provided the original author(s) and the copyright owner(s) are credited and that the original publication in this journal is cited, in accordance with accepted academic practice. No use, distribution or reproduction is permitted which does not comply with these terms.
*Correspondence: Thomas Maes, thomas.maes@cefas.co.uk