The Impact of Vessels on Humpback Whale Behavior: The Benefit of Added Whale Watching Guidelines
 Jens J. Currie
 Jessica A. McCordic
 Grace L. Olson
  Stephanie H. Stack
- Pacific Whale Foundation, Wailuku, HI, United States
The concurrent increase in marine tourism and vessel traffic around the world highlights the need for developing responsible whale watching guidelines. To determine the impact of vessel presence on humpback whale behaviors in Maui Nui, a land-based study was conducted from 2015 to 2018 in Maui, Hawai'i. Theodolite tracks were used to summarize humpback whale swim speed, respiration rate, dive time, and path directness to determine the potential impacts of various types of vessel presence on whale behavior. Vessel presence, proximity, and approach type in conjunction with biological parameters were used in a generalized additive modeling framework to explain changes in whale behaviors. The results presented here show increases in swim speed, respiration rate, and path directness in conjunction with decreasing dive times, which has been shown to be an energetically demanding avoidance strategy. These observations, in conjunction with increasing awareness on the implication of non-lethal effects of human disturbance and changing oceanic environments on humpback whales, highlights the need for a pre-cautionary approach to management. Stricter guidelines on whale watching will limit the level of disturbance to individual humpback whales in Hawai'i and ensure they maintain the fitness required to compensate for varying ecological and anthropogenic conditions.
Introduction
The concurrent recovery of humpback whale (Megaptera novaeangliae) populations from exploitation (Bettridge et al., 2015) along with increases in vessel traffic has resulted in increased interactions between whales and vessels. Whale-vessel collisions (Panigada et al., 2006; Carrillo and Ritter, 2010; Ritter, 2012) and targeted tourism (Orams, 2000; Markowitz et al., 2011; Fiori et al., 2019) are an increasing conservation concern for large whales (Forestell, 2007). In Hawai'i, the frequency of collisions between vessels and humpback whales has increased by ~150% from 2000 to 2011 (Lammers et al., 2013) in conjunction with a growing tourism industry, which has increased by 25% between 2014 and 2019 (Hawaii Tourism Authority, 2020). In this paper, we quantify changes in whale behaviors arising from vessel presence and highlight the need for additional vessel guidelines in Hawai'i.
The public's interest in viewing whales in the wild has led to a rapidly growing whale watching industry around the world, that generates billions of dollars in revenue each year (O'Connor et al., 2009). This increased demand for marine tourism needs to occur in conjunction with adequate guidelines and regulations that ensure this activity does not harm the target populations. However, in many areas this has not been the case, with growth outpacing the development of new regulations or strengthening of existing ones (Garrod and Fennell, 2004). Hawai'i is no exception, with the number of visitors to the state who participate in vessel-based tourism, including whale watches, having increased by ~12% from 2009 (Hawaii Tourism Authority, 2020). Between 1999 and 2016, the number of permitted whale watching operators has doubled, resulting in additional targeted tourism for humpback whales (Lammers et al., 2013; Federal Register, 2016). A variety of vessel types are used for commercial whale watching, including large catamarans and smaller vessels equipped with outboard engines (Au and Green, 2000). Outside of the permitted whale watching industry, a variety of commercial and recreation vessels such as kayaks, paddleboards, dive and fishing charters partake in whale watching.
To reduce the risk of harassment or injury to humpback whales in Hawai'i, federal laws, in addition to the Marine Mammal Protection Act, prevent any vessel, person, or craft from approaching whales within 100 yards (~91 m) or placing themselves in the path of a whale (Federal Register, 2016).
State laws restrict the operation of thrill crafts and parasail vessels from December 15 to May 15 each year in the nearshore leeward waters of Maui. In addition to regulations, the Hawaiian Islands Humpback Whale National Marine Sanctuary, NOAA Fisheries Pacific Islands Regional Office, and the Hawaii Department of Land and Natural Resources have jointly held ocean etiquette workshops that are designed to remind ocean users of the regulations and highlight additional guidelines/recommendations to reduce the potential impacts of wildlife viewing (NOAA, 2020). Compliance with the ocean etiquette guidelines is not monitored, and these remain voluntary.
Humpback whales belonging to the Hawai'i distinct population segment (Bettridge et al., 2015) use the main Hawaiian Islands as their breeding and calving grounds. It is estimated that ~55% of the North Pacific population of humpback whales use the Hawaiian Islands as their breeding ground (Calambokidis et al., 2008). The highest densities of humpback whales in Hawai'i occur within the Maui Nui region (Mobley et al., 2001), consisting of Maui, Lāna'i, Kaho'olawe, and Moloka'i. While on the breeding grounds, humpback whales participate in a wide range of energetically taxing behaviors associated with breeding and calving, with behaviors largely determined by age class, sex, and reproductive status (Craig et al., 2003). Spatial segregation of mother-calf dyads within the Hawaiian breeding grounds has been observed (Herman and Antinoja, 1977; Ersts and Rosenbaum, 2003; Craig et al., 2014), with shallow nearshore waters being preferred for mothers with a calf in the Maui Nui region (Currie et al., 2018b).
Previous studies have shown that humpback whales may alter their behavior following encounters with vessels (Corkeron, 1995; Scheidat et al., 2004; Schaffar et al., 2013) resulting in non-lethal disturbance (Braithwaite et al., 2015). These changes include altering swim speed and direction of travel (Scheidat et al., 2004; Schaffar et al., 2013), as well as changes in dive behavior, feeding behavior, and surface activity (Corkeron, 1995). Although it can be difficult to extrapolate short-term disturbances into long-term effects on individuals or populations, several studies indicate that cetaceans likely undergo physiological stress along with behavioral changes in response to anthropogenic disturbance (Rolland et al., 2012; Braithwaite et al., 2015; Machernis et al., 2018). For humpback whales, migration to the breeding areas and reproduction represent a large energetic cost for all individuals, an effect that is most pronounced in lactating females (Christiansen et al., 2014; Bejder et al., 2019). Female humpback whales with a calf show a significant decline in body condition over the course of the breeding season (Bejder et al., 2019), and any energy used in response to disturbance could, in turn, affect the calf's own development and survival (Christiansen et al., 2014; Bejder et al., 2019).
The cumulative impacts of repeated disturbances resulting from vessel presence (Pirotta et al., 2019), in conjunction with changing oceanic environments (Cartwright et al., 2019) highlight the need for a pre-cautionary approach to management. Here, we use a land-based platform to investigate the changes in whale behavior arising from vessel presence, by quantifying whale behaviors before, during, and after various types of vessels were present. We describe the parameters of vessel presence that most impacted the observed behaviors and describe how additional guidelines can be utilized to minimize disturbance to humpback whales.
Materials and Methods
Study Area and Survey Sites
Data were collected from two land-based sampling locations on Maui, Hawai'i: (1) Papawai Point, (20.7753°N, 156.5365°W; 28.9 m elevation) and (2) Pu'u Olai, (20.6359°N, 156.4492°W; 109.7 m elevation) from December 30, 2015–March 27, 2018. Sites were chosen due to elevation, accessibility, and co-occurrence of humpback whales and vessels within the Hawaiian Islands Humpback Whale National Marine Sanctuary waters (Figure 1).
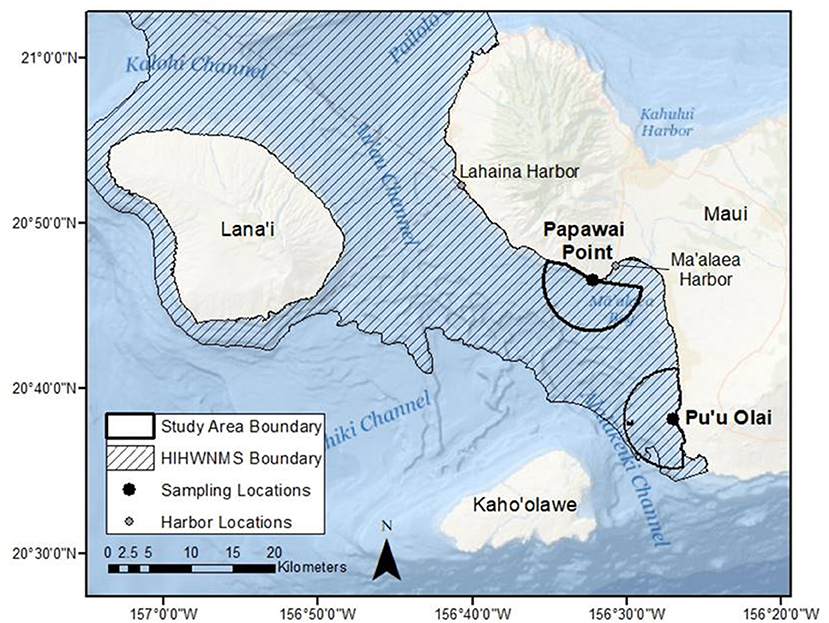
Figure 1. Map depicting the survey area boundaries of the two land-based sites used to observe humpback whale behavior from 2015 to 2018 as well as the extent of the Hawaiian Islands Humpback Whale National Marine Sanctuary (HIHWNMS) in Maui Nui, Hawai'i. Ocean Basemap Source: Esri, GEBCO, NOAA, National Geographic, DeLorme, HERE, Geonames.org, and other contributors.
Data Collection
Observation Platform and Theodolite Calibration
To measure horizontal and vertical angles from the sampling locations to the whales we used a Topcon GTS-311 total station, hereafter referred to as a theodolite. For each survey day, the height in meters (m) and precise location (latitude and longitude) of the theodolite (determined using a Garmin Dakota 20 handheld GPS) were recorded and used to obtain an accurate reference angle between the theodolite and a clearly visible land-based reference point of known latitude and longitude. All data were logged using customizable fields in MAGNET Field software (Topcon Positioning Systems, 2018) run on a laptop computer connected to the theodolite via USB cable.
Scanning Procedures
Surveys took place daily from ~8:00 a.m. to 1:30 p.m. Each survey had a dedicated observer and dedicated data recorder, with roles alternated approximately every hour to reduce fatigue. The observer continually scanned the entire survey area, to a maximum distance of 3 nautical miles (Figure 1) until a humpback whale group was observed, which was then considered the focal group. Reticle binoculars were used to determine the 3 nautical mile limit, as well-confirm humpback whale group parameters. Observers used the theodolite to track the position of each focal group of humpback whales for a maximum of 2 h, or until the group traveled beyond the 3 nautical mile limit of the survey area. If a group was not re-sighted within 30 min of a dive, or the observer was unsure if re-surfacing whales belonged to the initial group, the encounter was ended to ensure accurate data collection. At the end of each encounter, scanning for a new group was resumed. To ensure minimal detection bias, surveys were conducted in Beaufort Sea States of four or less.
Whale Group Parameters
A group was defined as a single humpback whale or multiple whales swimming in the same direction within three body lengths of one another. Groups, as referenced here, represent short-term associations and not persistent affiliations. Encounters were started upon the initial theodolite fix and were assigned a unique, sequential group number, and information on group size, location, and composition were collected (Table 1). For each observation of whales at the surface, the data recorder logged the observed activity along with a timestamp (hh:mm:ss). Upon each surfacing and dive, the observer centered the theodolite view on the group, and timestamped measurements of the horizontal and vertical angles between the whales and the theodolite was logged by the data recorder.
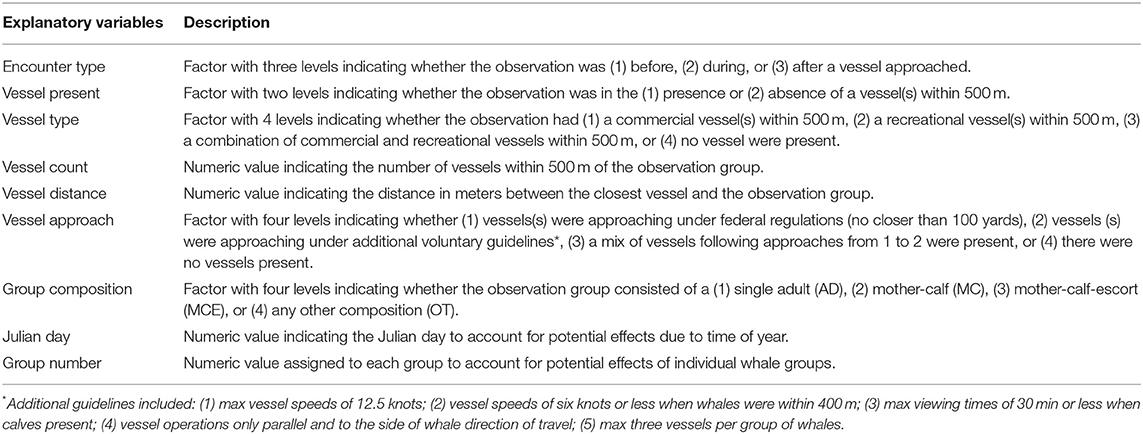
Table 1. List of explanatory variables used in GAM to determine the relationship between vessel activity and humpback whale behavior.
Observations and research methodologies were approved by the National Marine Fisheries Service under research Letter of Confirmation 18101 issued to J. Currie, Pacific Whale Foundation. The research activities were performed on land and in accordance with the guidelines and regulations outlined above.
Vessel Parameters
When boat(s) were observed within 500 m of the focal group, the observer centered the theodolite view on the vessel to obtain horizontal and vertical angles, and the data recorder logged vessel-specific information: position of vessel, type (categorized as either commercial or recreational), presence/absence of engine, and vessel name (if visible).
Data Analysis
All calculations and statistical analyses were completed using R v. 3.5.1 (R Core Team, 2019). To ensure accurate representation of whale behavior, only groups with an observation time of ≥15 min were included in subsequent analysis. Horizontal and vertical angles of whale groups and vessels measured by the theodolite were converted into latitudes and longitudes using previously published equations (Gailey and Ortega-Ortiz, 2000). All distances were measured using the distHaversine function from the geosphere package (Hijmans, 2019) in R to obtain distances between group observations and between each vessel and whale group.
Generalized Additive Modeling
Whale behaviors were modeled as a function of explanatory variables using generalized additive models developed in the mgcv package (Wood, 2004, 2017) in R, which allowed for non-normal response variables and testing of potential non-linear relationships. All models were fitted using penalized regression splines (Wood and Augustin, 2002) with default smoothing values (10 knots) in each spline and smoothing parameters estimated using the GCV (generalized cross validation). A quasi family with a log link was selected for all final models, which allowed the dispersion parameter to be modeled from the data. Model fit was evaluated through visual inspection of residual plots and diagnostic information produced using the gam.check function in R (Wood, 2001).
Explanatory Variables
Group composition, Julian day, and group number were considered as potential explanatory variables as well as the following vessel characteristics: vessel presence/absence, vessel count, vessel type, distance between whale(s) and vessel(s), encounter type, and method of approach (Table 1). Based on vessel name, we identified a subset of vessels belonging to a single operator known to use an approach method which followed these additional guidelines: (1) maximum vessel speeds of 12.5 knots; (2) maximum vessel speed of six knots or less when whales were within 400 m; (3) maximum viewing times of 30 min or less when calves present; (4) vessel was located only parallel and to the side of whale direction of travel; and (5) a maximum of three vessels per group of whales. With the exception of the subset of vessels that were known to follow additional guidelines, it was assumed that all other vessels were following federal approach guidelines only. It is important to note that the manner in which vessels maneuvered and the speed they traveled was not recorded as part of this study. Julian day and group number were included as explanatory variables to account for the potential effects of seasonality and individual differences in whale groups, respectively.
Response Variables
Four metrics were calculated as candidate response variables for whale behavior using previously described methods (McCordic et al., 2017) and included: (1) swim speed (km/h), (2) respiration rate (breaths/min), (3) dive time (minutes), and (4) directness index.
Swim speed as used here represents horizontal speed and was calculated by determining the distance (km) between each pair of discrete behavioral observations and dividing this by the time (hours) between observations. For ease of comparison to other literature, horizontal speed is referred to as swim speed throughout this paper.
Respiration rate was calculated by dividing the number of blows during a surfacing interval and dividing this by the elapsed time (minutes) between the initial and final blows. In cases where multiple whales were present, a single individual was selected and tracked throughout the surfacing interval.
Dive time (minutes) was recorded as the elapsed time between the group's dive and subsequent re-surfacing. If multiple animals were present in a group, and the tracking of a single individual was not possible, dive time was based on the last individual to dive and the first individual to surface.
Directness index calculation followed previously published methods (Scheidat et al., 2004), where straight line distance between the first and last points of a surfacing was divided by the sum of the total distance traveled by the group during the surfacing. Directness index values equal to 100 indicate a straight path, and directness index values equal to 0 indicate a path that returns to its starting point.
Model Selection
Model selection procedures followed (Wood, 2001) where a fully saturated model was initially fit for each response variable, and a final model was selected based on the GCV score, percent of deviance explained, and fit by reviewing the residual plots. The most parsimonious model was selected by decreasing the GCV score and increasing the deviance explained. Terms were tested for removal if they were (1) non-significant linear terms with a parameter coefficient near 0; or (2) non-significant smoothed terms with estimated degrees of freedom (edf) near 0. The linear form of the term was retained if dropping the smoothed term, with edf near 0, did not decrease the GCV score and increase the deviance explained.
Multicollinearity in explanatory variables was tested, and if present, the term with the least support for inclusion in the final model, based on the model selection criteria listed above, was dropped. In cases where correlated variables also had high support for inclusion in the final model (i.e., did not meet dropping criteria), two separate models were presented, one with each of the correlated variables.
Model Output
Individual variable plots (labeled A) are presented for each term of the best fit models. A value of 0 on the y-axis indicates no effect of the covariate on the estimated response, whereas values above 0 indicate a positive relationship, and values below 0 indicate a negative relationship. The x-axis for each variable plot contains small vertical ticks indicating the locations of observations (i.e., a rugplot). To display the absolute value of the response variable (whale behavior) as a function of the explanatory variable(s), the predict function in the stats package (R Core Team, 2019) was used for each of the best fit models and plots created to show the relationship (labeled B).
Results
Survey Effort
We completed 73 survey days between December 2015 and March 2018 and recorded data on 316 humpback whale groups (943 individual whales) and 472 vessel approaches to whales. Of those, 279 focal groups (88%) were of sufficient duration (≥15 min) to use in the analysis and 188 (59%) included data on vessel approaches. The average focal duration across these 279 groups was 19.7 min.
Group Behavior
Swim Speed
The best fit model for swim speed explained 14.1% of the deviance and included smoothed terms for group number and distance between whales and vessels, as well as a categorical term for group composition (Table 2). Groups with calves traveled significantly slower than groups without calves (Table 2; Figure 2).
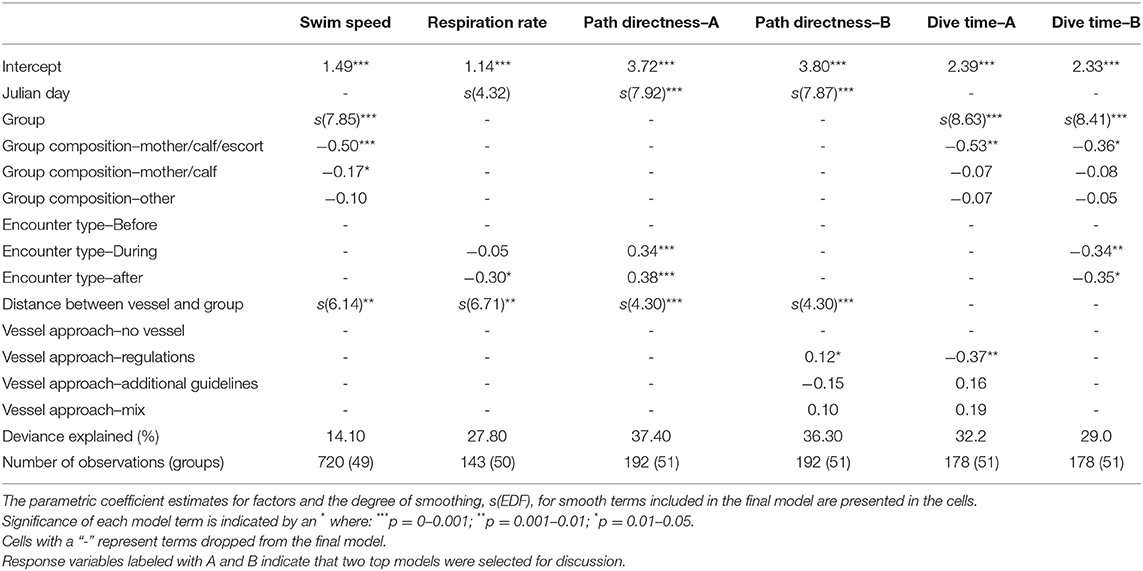
Table 2. Summary of top GAM models showing the relationship between humpback whale behavior and vessel activities, where rows represent candidate explanatory variables and columns represent response variables.
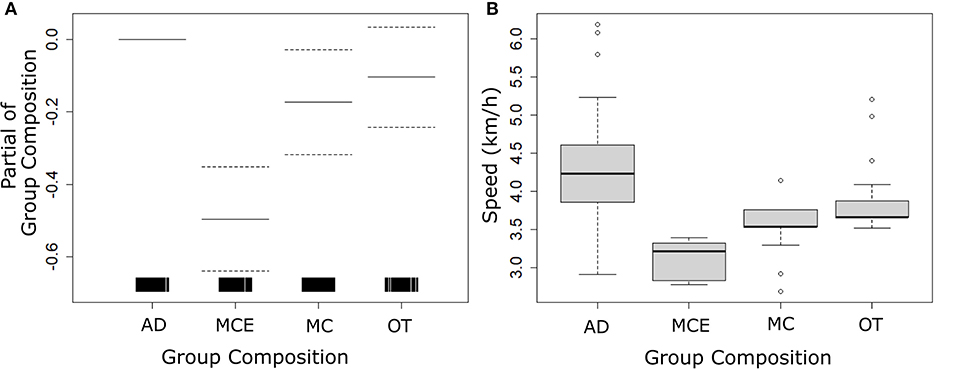
Figure 2. Results from the best fit generalized additive model (GAM) for humpback whale swim speed showing (A) model parameter estimates of group composition (AD-adult, MCE-mother-calf-escort, MC-mother-calf; OT-other) and (B) model predicted swim speeds based on group composition. Dashed lines in image A represent the 95% confidence intervals of the parameter estimate, and vertical ticks indicate the locations of observations (i.e., a rugplot).
The distance between whales and vessels was found to significantly impact swim speed (Table 2) with the largest positive increase in the parameter estimate observed from 75 to 120 m (Figure 3A). Model predictions found similar trends with a second positive increase predicted at 150 to 175 m (Figure 3B).
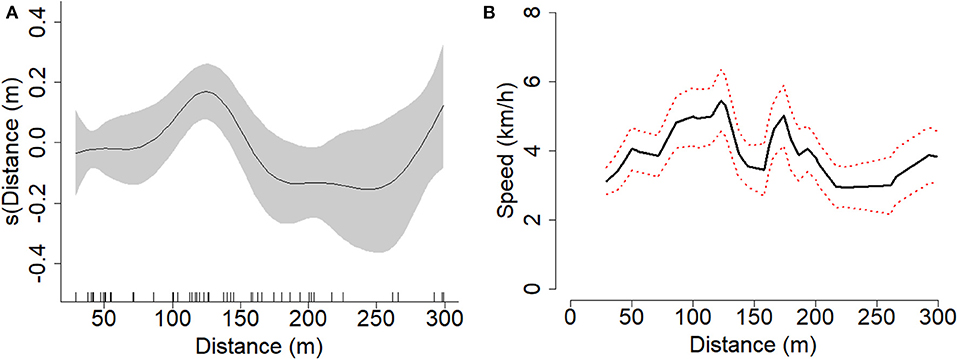
Figure 3. Results from the best fit generalized additive model (GAM) for humpback swim speed showing (A) model parameter estimates of vessel distance to focal group and (B) model predicted swim speed based on vessel distance. The shaded and dashed lines represent the 95% confidence intervals of the parameter estimates and fitted values, respectively. The vertical ticks on image A indicate the locations of observations (i.e., a rugplot).
Dive Time
Two best fit models were used to explain variations in the dive time, as collinearity between two significant variables (encounter type and vessel approach) precluded inclusion of both terms in a single model (Table 2). Both models explained 29–32% of the deviance and included a smoothed term for group, as well as categorical terms for encounter type and method of approach (Table 2). In both models, parameter estimates for mother-calf-escort dive times were significantly less than other groups (Table 2; Figure 4A); however, model prediction found similar mean dive times of 6–8 min across all groups (Figure 4B).
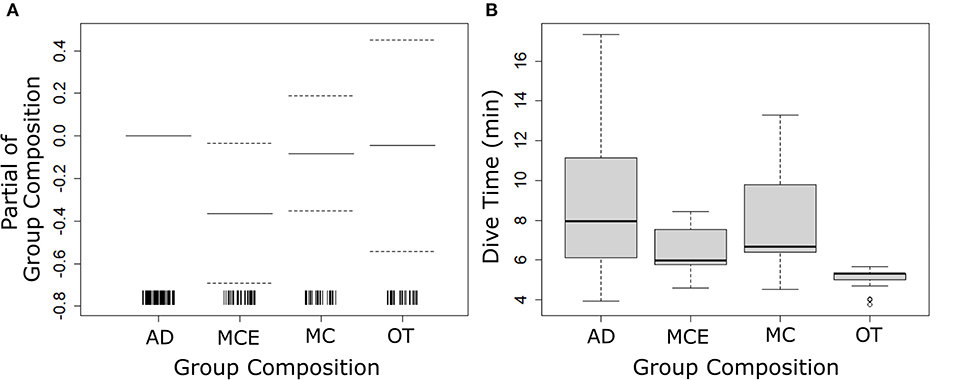
Figure 4. Results from the best fit generalized additive model (GAM) for humpback whale dive time showing (A) model parameter estimates of group composition (AD-adult, MCE-mother-calf-escort, MC-mother-calf; OT-other) and (B) model predicted dive times based on group composition. Dashed lines in image (A) represent the 95% confidence intervals of the parameter estimate, and vertical ticks indicate the locations of observations (i.e., a rugplot).
Dive times were significantly shorter during and after an encounter with a vessel (Table 2; Figure 5A), with model predictions showing an average reduction in dive time of 83% during and after (Figure 5B).
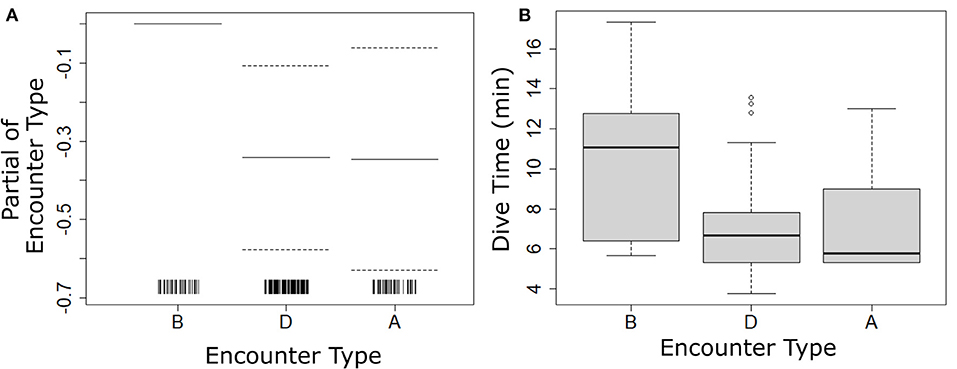
Figure 5. Results from the best fit generalized additive model (GAM) for humpback whale dive time showing (A) model parameter estimates for encounter type (B-Before, D-During, A-After) and (B) model predicted dive times based upon encounter type. Dashed lines in image (A) represent the 95% confidence intervals of the parameter estimate, and vertical ticks indicate the locations of observations (i.e., a rugplot).
Dive times were significantly less when vessels approached the focal group following the federal regulations, while no significant difference was observed when vessels approached following additional guidelines (Table 2; Figure 6A). Model predictions showed a reduction in dive times from an average of 9–5 min (-80%) when vessels approached under federal regulations (Figure 6B).
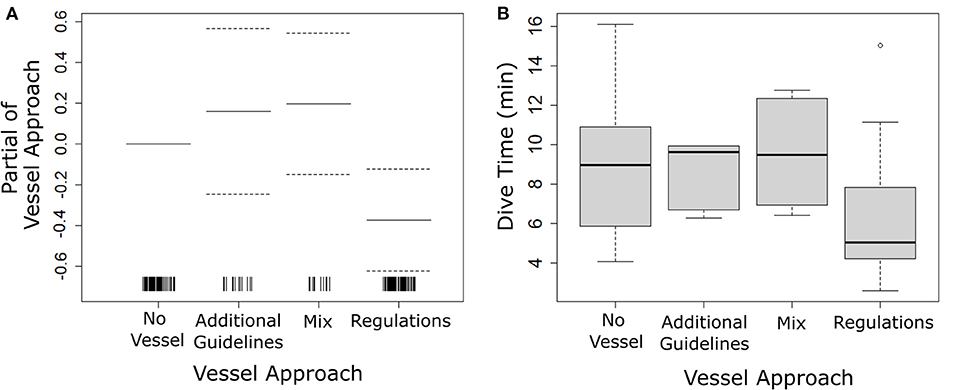
Figure 6. Results from the best fit generalized additive model (GAM) for humpback whale dive time showing group (A) model parameter estimates for vessel approach type (No Vessel: no vessels within 500 m; Additional Guidelines: vessels(s) were approaching under additional voluntary guidelines; Regulations: vessel(s) were assumed approaching under federal regulations only; Mix: multiple vessels approaching with one or more following additional voluntary guidelines and one or more following federal guidelines only) and (B) model predicted dive times based upon vessel approach type. Dashed lines in image (A) represent the 95% confidence intervals of the parameter estimate, and vertical ticks indicate the locations of observations (i.e., a rugplot).
Respiration Rate
The model that best fit the respiration rate explained 27.8% of the deviance and included smoothed terms for Julian day and distance between whales and vessels, as well as a categorical term for encounter type (Table 2). The distance between whales and vessels was found to significantly impact respiration rate (Table 2) with two peaks corresponding to significant positive increases in the parameter estimate for respiration rate observed at 75 to 150 m and 250 to 340 m (Figure 7A). Model predictions found similar trends to parameter estimates (Figure 7B).
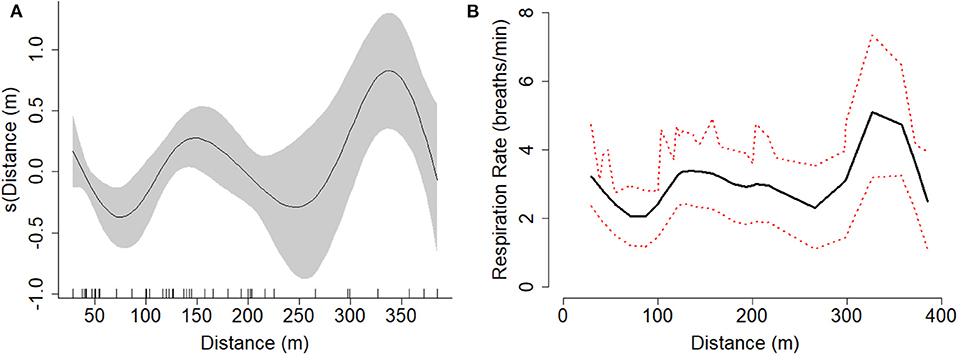
Figure 7. Results from the best fit generalized additive model (GAM) for humpback respiration rate showing (A) model parameter estimates of vessel distance to focal group and (B) model predicted respiration rate based on vessel distance. The shaded and dashed lines represent the 95% confidence intervals of the parameter estimates and fitted values, respectively. The vertical ticks on image (A) indicate the locations of observations (i.e., a rugplot).
Respiration rate was found to be significantly less after vessel(s) left a group of whales (Table 2; Figure 8A). Model predictions found that whales took ~13% fewer breaths both during and after an encounter with a vessel (Figure 8B).
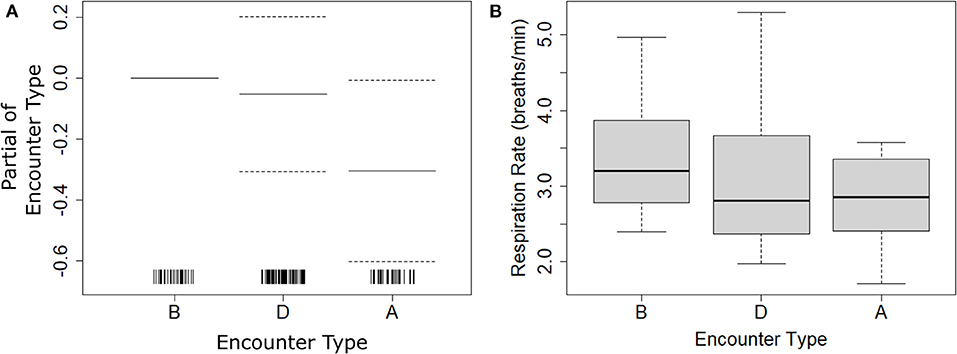
Figure 8. Results from the best fit generalized additive model (GAM) for humpback whale respiration rate showing (A) model parameter estimates for encounter type (B-Before, D-During, A-After) and (B) model predicted respiration rate based upon encounter type. Dashed lines in image (A) represent the 95% confidence intervals of the parameter estimate. Vertical ticks (A) indicate the locations of observations (i.e., rugplot).
Path Directness
Two best fit models are presented to explain variations in the path directness, as collinearity between two significant variables (encounter type and vessel approach) precluded inclusion of both terms in a single model (Table 2). Both models explained 36–37% of the deviance and included smoothed terms for Julian day and distance between whales and vessel(s), as well as categorical terms for encounter type and method of approach (Table 2). The direction of travel became less variable (i.e., straighter) when the distance between vessel(s) and whales went from 50 to 170 m, after which the direction of travel become more variable (i.e., random) (Table 2; Figure 9).
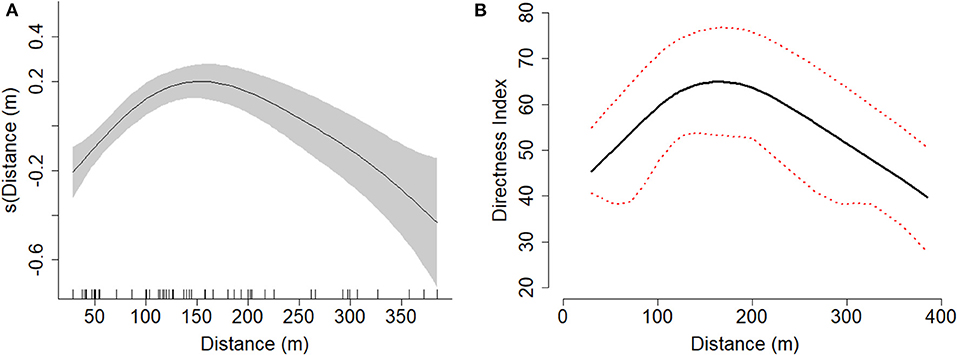
Figure 9. Results from the best fit generalized additive model (GAM) for humpback whale path directness showing (A) model parameter estimates of vessel distance to focal group and (B) model predicted path directness based on vessel distance. The shaded and dashed lines represent the 95% confidence intervals of the parameter estimates and fitted values, respectively. The vertical ticks on image (A) indicate the locations of observations (i.e., a rugplot).
The parameter estimate for directness index was found to be significantly higher during and after vessel(s) approached a group of whales (Table 2; Figure 10A), with model predictions showing whales traveling in a straighter line both during and after an encounter (Figure 10B).
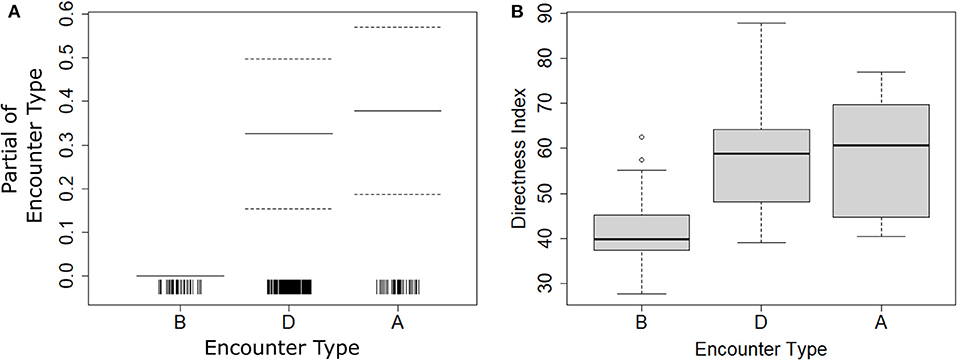
Figure 10. Results from the best fit generalized additive model (GAM) for humpback whale path directness showing (A) model parameter estimates for encounter type (B-Before, D-During, A-After) and (B) model predicted path directness based upon encounter type. Dashed lines in image (A) represent the 95% confidence intervals of the parameter estimate. Dashed lines in image (A) represent the 95% confidence intervals of the parameter estimate and vertical ticks indicate the locations of observations (i.e., a rugplot).
The path directness was significantly higher (i.e., direction of travel was more straight) when vessels approached the focal group following the federal regulations, while no significant difference was observed when vessels approached following additional guidelines (Table 2; Figure 11A). Model predictions showed similar trends, with whales predicted to travel in a straighter line when vessels approached under federal regulations (Figure 11B).
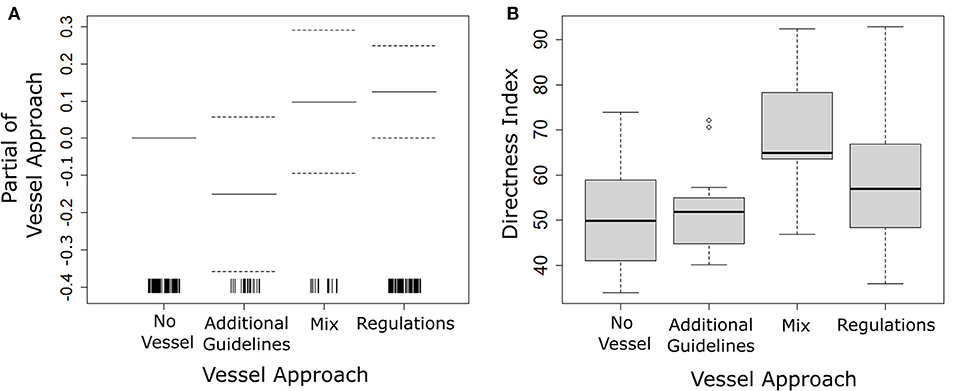
Figure 11. Results from the best fit generalized additive model (GAM) for humpback whale path directness showing (A) model parameter estimates for vessel approach type (No Vessel: no vessels within 500 m; Additional Guidelines: vessels(s) were approaching under additional voluntary guidelines; Regulations: vessel(s) were assumed approaching under federal regulations only; Mix: multiple vessels approaching with one or more following additional voluntary guidelines and one or more following federal guidelines only) and (B) model predicted path directness based upon vessel approach type. Dashed lines in image (A) represent the 95% confidence intervals of the parameter estimate and vertical ticks indicate the locations of observations (i.e., a rugplot).
Discussions
This study used a land-based platform to observe whale behaviors in the presence and absence of vessels. The presence of vessels was found to cause increases in swim speed, respiration rate, and path directness as well as decreases in dive times. The method of approach used by a vessel was found to reduce some of the observed behavior changes. A vessel variable was included in the best fit models for each behavioral response and was the only significant variable explaining whale respiration rate and path directness. These results support the conclusion that vessels in Hawai'i are impacting whale behavior. In the presence of vessels, the observed increase in group swim speed and directness of travel, coupled with decreased dive times suggests humpback whales may be employing a horizontal avoidance strategy (Baker et al., 1983; Frid and Dill, 2002). Vessel proximity to humpback whale groups was found to significantly impact all surface-based behaviors: swim speed, path directness, and respiration rate and aligns with previous work (Williams et al., 2006, 2009; Stamation et al., 2009). However, it is important to note that these relationships are often complex, with various components of vessel presence acting independently on whale behavior (Williams et al., 2006; Stamation et al., 2009). As such, the results cannot be solely attributed to a single cause, but vessel proximity plays a significant role for humpback whales in Hawai'i. Additional biological parameters, such as calf presence, was also found to significantly decrease swim speed and dive time and, as Hawai'i is a calving ground, these groups are frequently observed within the study site (Mobley and Herman, 1985; Brown and Corkeron, 1995; Pack et al., 2012).
Given that vessel presence and proximity, rather than count were primary drivers of the observed behavioral trends suggests that, within Maui Nui, vessel presence is a more important consideration than specific vessel characteristics or number. For respiration rate, swim speed, and directness index, significant behavioral change was predicted well outside the regulated 100-yard approach distance (~91 m), indicating whales may be responding to vessel presence prior to close approaches. The lack of a behavioral response observed during very close encounters, i.e., <100 yards (~91 m), may be related to the legal requirement that vessels to keep their engines in neutral until the whale swims beyond 100 yards (~91 m), resulting in reduced engine noise at this distance. The slow swim speeds, low directness of travel, and low respiration rates at these close distances are also representative of whales interacting with the vessel. Behavioral reactions to disturbance in humpback whales likely arise from a combination of auditory and visual cues (Higham et al., 2014; Sprogis et al., 2020). However, for humpback whales, hearing is more efficient than sight and can be used at longer ranges (Richardson et al., 1998), with noise level a likely driver of humpback whale disturbance (Sprogis et al., 2020) in addition to potential visual cues at closer distances. Further work is needed to determine the mechanistic link between the observed behavior changes and vessel presence.
Observed Changes to Swim Speed and Respiration Rate
The observed peak in swim speed at 125 m as vessels approached the legal approach distance of 100 yards (~91 m), follows previous observations that showed increases in swim speeds as vessels approached (Scheidat et al., 2004; Williams et al., 2006). These responses may indicate a horizontal avoidance strategy as noise from vessel engines has been suggested as a driver of disturbance response (Sprogis et al., 2020). The observed increases in swim speed at 100 and 250 m occurred in conjunction with significant increases in respiration rate, and these behaviors are known to be positively correlated (Williams and Noren, 2009). These results indicate an increase in energy use arising from vessel traffic in Hawai'i, which can lead to both individual and population-level consequences (Lusseau and Bejder, 2007; Cartwright et al., 2019) and is of particular concern for the growth potential of calves (Braithwaite et al., 2015). A reduction in respiration rate after vessels left was found to be marginally significant (p-value = 0.04) and suggests the behavioral responses may be short-term, as seen in previous work (Scheidat et al., 2004). However, it is important to consider that cumulative impacts from vessel activity, even if short-lived, can have detrimental impacts to individuals and populations (Pirotta et al., 2019).
Observed Changes in Path Directness and Dive Time
The observed trend of an indirect path of travel to a more direct path of travel with vessel approach suggests that whales are changing how they swim when boats approach within 150 m. Even after vessels left, groups were observed to continue swimming in a more direct path than before the vessel had approached, indicating a longer behavioral response. These results contrast observations made for killer whales (Orcinus orca), who are thought to travel in a less direct path to evade approaching vessels (Williams et al., 2006). The significant changes observed in path directness were also observed for dive time, with shorter dives observed when vessels were present and after they left. Although previous research has found increases in dive time associated with vessel traffic (Baker et al., 1983; Schaffar et al., 2013; Senigaglia et al., 2016), the results shown here suggest the use of increased swim speeds and faster respiration, in conjunction with shorter dives time and straighter direction of travel, as a possible evasive tactic (Frid and Dill, 2002; Stamation et al., 2009) to move away from vessels.
Observed Changes in Group Behavior Based on Vessel Approach Method
When considering the method of vessel approach and movement around whales, both the path directness and dive time of the whale did not significantly change when vessels followed additional whale watching guidelines. This highlights the potential of further guidelines for approaching humpback whales in reducing behavioral changes. In Hawai'i, nearly half of all licensed whale watching operators conduct tours in the relatively shallow leeward waters of Maui Nui (O'Connor et al., 2009) and given that vessel type did not significantly impact whale behaviors, additional guidelines for all vessels are recommended. The additional whale watching guidelines presented in Table 1 will likely reduce behavioral responses from target whales (Morete et al., 2007; Currie et al., 2017; Sprogis et al., 2020), given the reduced impact observed in this study. The current regulations in place for protecting humpback whales in Hawai'i include a 100-yard approach distance (~91 m), no placing of vessels in the direct path of whales and no thrill craft operations during whale season (Federal Register, 2016). However, the global increase in both commercial and recreational whale watching (O'Connor et al., 2009) and recent concern over the health and status of this distinct population segment (Cartwright et al., 2019) highlight the need to follow a precautionary approach to management. Indeed, significant behavior changes for respiration rate, swim speed, and directness index were observed when vessels were well outside 100 yards (~91 m) at distances up to 400 m. As such, it is important to consider if the current management regimes for whale watching are effective at reducing disturbance. Results presented here, in conjunction with previous work (Morete et al., 2007; Williams and Noren, 2009; Lammers et al., 2013; Currie et al., 2017; Fiori et al., 2019) clearly demonstrate vessel presence as a threat to humpback whales that can be further mitigated with stricter guidelines.
The most important guidelines that vessels followed that minimized whale avoidance behavior related to dive time and path directness were (1) traveling at 12.5 knots and slowing to 6 knots when within 400 m of the whale, (2) limiting viewing time of mom-calf groups to 30 min, and (3) operating only parallel and to the side of whales, never directly in front of or behind the whales. Logistical constraints precluded the use of a second theodolite to simultaneously track vessel movement. Vessels following additional guidelines used a mobile app, Whale and Dolphin Tracker (Currie et al., 2018a), to record their GPS track during trips. Although vessel speed was not recorded as part of this study, informal interviews with captains of this subset of vessels along with review of GPS tracks allowed us to confirm vessel speed as it related to these additional guidelines. There is likely a large variation in how other vessels approached whales which represents a limitation of this study. However, the results show clear differences in whale response to approaches by vessels belonging to the two categories, which suggests that there were different approach types being used. Given these findings, we recommend that these additional whale watching guidelines be implemented within the Hawaiian Islands Humpback Whale National Marine Sanctuary waters. Reduced vessel speeds will allow both whales and boat operators more time to detect and maneuver toward avoidance (Vanderlaan and Taggart, 2007; Currie et al., 2017), while the additional approach guidelines outlined above will avoid unintended disruptions to normal whale behavior (Baker et al., 1983; Stamation et al., 2009).
Conclusions
The present study found significant changes in humpback whale behavior relating to vessel presence, which suggests that the current regulations are not sufficient for minimizing behavioral responses. However, the observed changes could not be conclusively attributed to a single factor or observation and likely relate to a combination of species biology and vessel activity and further research is needed on this aspect. Although observed changes were likely short-term, the occurrence of disturbance on breeding grounds increases the potential risk by reducing humpback whale energy stores in food limited conditions (Williams et al., 2011). Humpback whales in Hawai'i are not feeding and thus must rely on fat reserves to survive breeding ground activities while maintaining enough energy to be able to endure the long migration back to the feeding grounds. The observed avoidance of vessels by increasing swim speed, respiration rate and path directness, while decreasing dive times is energetically demanding during a time when whales are already expending high levels of energy by engaging in breeding activities, nursing, and calving (Braithwaite et al., 2015). Mothers with calves have a tremendous energetic demand while lactating, with previous work illustrating that seemingly minor, short-term avoidance behaviors such as increasing swim speed and path directness may quickly transition to long term avoidance strategies of an area regardless of age class, if the disturbance persists (Lusseau and Bejder, 2007). Increasing environmental variability and the recent humpback whale decline in Hawai'i linked to reduced productivity of key prey resources in Alaska (Cartwright et al., 2019) highlights the need for a precautionary approach to management of Hawai'i's humpback whales. This requires stricter guidelines on the vessel activities to ensure that vessels operate in a manner that does not compromise the fitness of individual whales and their ability to compensate to varying ecological and anthropogenic conditions.
Data Availability Statement
The raw data supporting the conclusions of this article will be made available by the authors, without undue reservation.
Ethics Statement
Ethical review and approval was not required for the animal study because this study was undertaken on land where researchers passively observed whale behaviors around normal vessel traffic. This research did not require any interactions between land-based research crew and whales.
Author Contributions
JC, SS, and JM conceived and conceptualized the study. Fieldwork was conducted primarily by JM with support from JC, SS, AM, and GO. Data processing and quality control was conducted by JM with analysis completed by JC. Interpretation was carried out by JC and SS. All authors contributed to writing of the manuscript as well as commenting on various drafts.
Funding
Funding for this work was provided by Pacific Whale Foundation.
Disclaimer
Frontiers Media SA remains neutral with regard to jurisdictional claims in published maps and institutional affiliations.
Conflict of Interest
The authors declare that the research was conducted in the absence of any commercial or financial relationships that could be construed as a potential conflict of interest.
Acknowledgments
We would like to thank the Topcon staff for technical support as well as granting us an educational license for MAGNET Field software. We would like to thank the research volunteers who contributed to data collection: Bryson Albrecht, Holly Self, Todd Sigley, Michelle Trifari, Simona Clausnitzer, Dylan Laicher, Valentin Neamtu, Carla Patulny, Kaitlin Yehle, Kaleigh Carlson, Lindsey Ellett, Jennifer Goetsch, Lauren Himmelreich, Katie Morrison, Theresa-Anne Tatum-Naecker, and Katie Welsh.
References
Au, W. W. L., and Green, M. (2000). Acoustic interaction of humpback whales and whale-watching boats. Mar. Environ. Res. 49, 469–481. doi: 10.1016/S0141-1136(99)00086-0
Baker, C. S., Herman, L. M., Bays, B. G., and Bauer, G. B. (1983). Impact of Vessel Traffic on Behavior of Humpback Whales in Southeast Alaska: 1982 Season. Settle, WA: National Marine Mammal Laboratory Contract No. 81-ABC-00114.
Bejder, L., Videsen, S., Hermannsen, L., Simon, M., Hanf, D., and Madsen, P. T. (2019). Low energy expenditure and resting behaviour of humpback whale mother-calf pairs highlights conservation importance of sheltered breeding areas. Sci. Rep. 9:771. doi: 10.1038/s41598-018-36870-7
Bettridge, S., Baker, S. C., Barlow, J., Clapham, P. J., Ford, M., Gouveia, D., et al. (2015). Status Review of the Humpback Whale (Megaptera novaeangliae) Under the Endangered Species Act. National Oceanic and Atmospheric Administration National Marine Fisheries Service Southwest Fisheries Science Center: U.S. Department Of Commerce.
Braithwaite, J. E., Meeuwig, J. J., and Hipsey, M. R. (2015). Optimal migration energetics of humpback whales and the implications of disturbance. Conserv. Physiol. 3:cov001. doi: 10.1093/conphys/cov001
Brown, M., and Corkeron, P. (1995). Pod characteristics of migrating humpback whales (Megaptera novaeangliae) off the East Australian coast. BRILL 132, 163–179. doi: 10.1163/156853995X00676
Calambokidis, J., Falcone, E. A., Quinn, T. J., Burdin, A. M., Clapham, P. J., Ford, J. K. B., et al. (2008). SPLASH, Structure of Populations, Levels of Abundance and Status Humpback Whales in North Pacific. Cascadia research Contract AB133F-03-RP-00078.
Carrillo, M., and Ritter, F. (2010). Increasing numbers of ship strikes in the Canary Islands: proposals for immediate action to reduce risk of vessel-whale collisions. J. Cetacean Res. Manage. 11, 131–138.
Cartwright, R., Venema, A., Hernandez, V., Wyels, C., Cesere, J., and Cesere, D. (2019). Fluctuating reproductive rates in Hawaii's humpback whales, Megaptera novaeangliae, reflect recent climate anomalies in the North Pacific. R. Soc. Open Sci. 6:181463. doi: 10.1098/rsos.181463
Christiansen, F., Rasmussen, M. H., and Lusseau, D. (2014). Inferring energy expenditure from respiration rates in minke whales to measure the effects of whale watching boat interactions. J. Exp. Mar. Biol. Ecol. 459, 96–104. doi: 10.1016/j.jembe.2014.05.014
Corkeron, P. J. (1995). Humpback whales (Megaptera novaeangliae) in Hervey Bay, Queensland: behaviour and responses to whale-watching vessels. Can. J. Zool. 73, 1290–1299. doi: 10.1139/z95-153
Craig, A. S., Herman, L. M., Gabriele, C. M., and Pack, A. A. (2003). Migratory timing of humpback whales (Megaptera novaeangliae) in the Central North Pacific varies with age, sex and reproductive status. Behaviour 140, 981–1001. doi: 10.1163/156853903322589605
Craig, A. S., Herman, L. M., Pack, A. A., and Waterman, J. O. (2014). Habitat segregation by female humpback whales in Hawaiian waters: avoidance of males? Behaviour 151, 613–631. doi: 10.1163/1568539X-00003151
Currie, J. J., Stack, S. H., and Kaufman, G. D. (2017). Modelling whale-vessel encounters: the role of speed in mitigating collisions with humpback whales (Megaptera novaeangliae). J. Cetacean Res. Manage. 17, 57–64.
Currie, J. J., Stack, S. H., and Kaufman, G. D. (2018a). Conservation and education through ecotourism: using citizen science to monitor cetaceans in the four-island region of Maui, Hawaii. Tour. Marine Environ. 13, 65–71. doi: 10.3727/154427318X15270394903273
Currie, J. J., Stack, S. H., McCordic, J. A., and Roberts, J. (2018b). Utilizing occupancy models and platforms-of-opportunity to assess area use of mother-calf humpback whales. Open J. Marine Sci. 08, 276–292. doi: 10.4236/ojms.2018.82014
Ersts, P. J., and Rosenbaum, H. C. (2003). Habitat preference reflects social organization of humpback whales (Megaptera novaeangliae) on a wintering ground. J. Zool. 260, 337–345. doi: 10.1017/S0952836903003807
Federal Register (2016). Approach regulations for humpback whales in waters surrounding the Islands of Hawaii under the marine mammal protection act. Fed. Regist. 81, 32010–62018.
Fiori, L., Martinez, E., Orams, M. B., and Bollard, B. (2019). Effects of whale-based tourism in Vava'u, kingdom of Tonga: behavioural responses of humpback whales to vessel and swimming tourism activities. PLoS ONE 14:e0219364. doi: 10.1371/journal.pone.0219364
Forestell, P. H. (2007). “Protecting the ocean by regulating whale watching: the sound of one hand clapping,” in Marine Wildlife and Tourism Management: Insights From the Natural and Social Sciences, eds J. Higham and M. Lück (Wallingford: CABI), 272–293. doi: 10.1079/9781845933456.0272
Frid, A., and Dill, L. M. (2002). Human-caused disturbance stimuli as a form of predation risk. Conserv. Ecol. 6, 1–16. doi: 10.5751/ES-00404-060111
Gailey, G. A., and Ortega-Ortiz, J. G. (2000). Pythagoras: Theodolite Cetacean Tracking. Marine Mammal Research Program Texas A&M University at Galveston.
Garrod, B., and Fennell, D. A. (2004). An analysis of whalewatching codes of conduct. Ann. Tour. Res. 31, 334–352. doi: 10.1016/j.annals.2003.12.003
Hawaii Tourism Authority (2020). Monthly Visitor Statistics. Available online at: https://www.hawaiitourismauthority.org/research/monthly-visitor-statistics/ (accessed August 1, 2020).
Herman, L. M., and Antinoja, R. C. (1977). Humpback whales in the Hawaiian breeding waters: population and pod characteristics. Sci. Rep. Whales Res. Instit. 59–85.
Higham, J., Bejder, L., and Williams, R. (Eds.). (2014). Whale-watching: Sustainable Tourism and Ecological Management. Cambridge: Cambridge University Press. doi: 10.1017/CBO9781139018166
Hijmans, R. J. (2019). Geosphere: Spherical Trigonometry. Available online at: https://CRAN.R-project.org/package=geosphere (accessed July 1, 2020).
Lammers, M. O., Pack, A. A., Lyman, E. G., and Espiritu, L. (2013). Trends in collisions between vessels and North Pacific humpback whales (Megaptera novaeangliae) in Hawaiian waters (1975–2011). J. Cetacean Res. Manage. 13, 73–80.
Lusseau, D., and Bejder, L. (2007). The long-term consequences of short-term responses to disturbance experiences from whalewatching impact assessment. Int. J. Comp. Psychol. 20, 228–236. Available online at: https://escholarship.org/uc/item/42m224qc
Machernis, A. F., Powell, J. R., Engleby, L., and Spradlin, T. R. (2018). An Updated Literature Review Examining the Impacts of Tourism on Marine Mammals Over the Last Fifteen Years (2000-2015) to Inform Research and Management Programs. Available online at: https://repository.library.noaa.gov/view/noaa/18117 (accessed December 6, 2018).
Markowitz, T. M., Richter, C., and Gordon, J. (2011). Effects of tourism on the behaviour of sperm whales inhabiting the kaikoura canyon. Report to New Zealand Department of Conservation, 123.
McCordic, J. A., Currie, J. J., Stack, S. H., Kaplun, S. M., and Kaufman, G. D. (2017). Land-Based Surveys to Determine Effects of Vessel Presence on Humpback Whale Behavior in Maui, Hawaii, USA. Document SC/67a/WW/04 presented to the IWC Scientific Committee: 9 May – 21 May, 16.
Mobley, J., Spitz, S. S., and Grotefendt, R. (2001). Abundance of humpback whales in Hawaiian waters: results of 1993-2000 aerial surveys. Report to the Hawaiian Islands Humpback Whale National Marine Sanctuary, 16.
Mobley, J. R., and Herman, L. M. (1985). Transience of social affiliations among humpback whales (Megaptera novaeangliae) on the Hawaiian wintering grounds. Can. J. Zool. 63, 762–772. doi: 10.1139/z85-111
Morete, M. E., Bisi, T. L., and Rosso, S. (2007). Mother and calf humpback whale responses to vessels around the Abrolhos Archipelago, Bahia, Brazil. J. Cetacean Research and Management 9, 241–248.
NOAA (2020). Boating Guidelines. Hawaiian Islands Humpback Whale National Marine Sanctuary. Available online at: https://hawaiihumpbackwhale.noaa.gov/visit/boating.html (accessed August 20, 2020).
O'Connor, S., Campbell, R., Cortez, H., and Knowles, T. (2009). Whale watching worldwide: tourism numbers, expenditures and expanding economic benefits (Special report from the International Fund for Animal Welfare). Yarmouth, MA: Economists at Large. p. 228.
Orams, M. B. (2000). Tourists getting close to whales, is it what whale-watching is all about? Tour. Manage. 21, 561–569. doi: 10.1016/S0261-5177(00)00006-6
Pack, A. A., Herman, L. M., Spitz, S. S., Craig, A. S., Hakala, S., Deakos, M. H., et al. (2012). Size-assortative pairing and discrimination of potential mates by humpback whales in the Hawaiian breeding grounds. Anim. Behav. 84, 983–993. doi: 10.1016/j.anbehav.2012.07.024
Panigada, S., Pesante, G., Zanardelli, M., Capoulade, F., Gannier, A., and Weinrich, M. T. (2006). Mediterranean fin whales at risk from fatal ship strikes. Mar. Pollut. Bull. 52, 1287–1298. doi: 10.1016/j.marpolbul.2006.03.014
Pirotta, E., Mangel, M., Costa, D. P., Goldbogen, J., Harwood, J., Hin, V., et al. (2019). Anthropogenic disturbance in a changing environment: modelling lifetime reproductive success to predict the consequences of multiple stressors on a migratory population. Oikos 128, 1340–1357. doi: 10.1111/oik.06146
R Core Team (2019). R: A Language and Environment for Statistical Computing. Vienna: Foundation for Statistical Computing. Available online at: http://www.R-project.org/ (accessed July 1, 2020).
Richardson, W. J., Jr, C. R. G., Malme, C. I., Thomson, D. H., Moore, S. E., and Würsig, B. (1998). Marine Mammals and Noise, 1st Edn. San Diego, CA: Academic Press.
Ritter, F. (2012). Collisions of sailing vessels with cetaceans worldwide: first insights into a seemingly growing problem. J. Cetacean Res. Manage. 12, 119–127.
Rolland, R. M., Parks, S. E., Hunt, K. E., Castellote, M., Corkeron, P. J., Nowacek, D. P., et al. (2012). Evidence that ship noise increases stress in right whales. Proc. R. Soc. B Biol. Sci. 279, 2363–2368. doi: 10.1098/rspb.2011.2429
Schaffar, A., Madon, B., Garrigue, C., and Constantine, R. (2013). Behavioural effects of whale-watching activities on an endangered population of humpback whales wintering in New Caledonia. Endanger. Species Res. 19, 245–254. doi: 10.3354/esr00466
Scheidat, M., Castro, C., Gonzalez, J., and Williams, R. (2004). Behavioural responses of humpback whales (Megaptera novaeangliae) to whalewatching boats near Isla de la Plata, Machalilla National Park, Ecuador. J. Cetacean Res. Manage. 6, 63–68.
Senigaglia, V., Christiansen, F., Bejder, L., Gendron, D., Lundquist, D., Noren, D., et al. (2016). Meta-analyses of whale-watching impact studies: comparisons of cetacean responses to disturbance. Mar. Ecol. Prog. Ser. 542, 251–263. doi: 10.3354/meps11497
Sprogis, K. R., Bejder, L., Hanf, D., and Christiansen, F. (2020). Behavioural responses of migrating humpback whales to swim-with-whale activities in the Ningaloo Marine Park, Western Australia. J. Exp. Mar. Biol. Ecol 522, 151254. doi: 10.1016/j.jembe.2019.151254
Stamation, K. A., Croft, D. B., Shaughnessy, P. D., Waples, K. A., and Briggs, S. V. (2009). Behavioral responses of humpback whales (Megaptera novaeangliae) to whale-watching vessels on the southeastern coast of Australia. Mar. Mamm. Sci. 26, 98–122. doi: 10.1111/j.1748-7692.2009.00320.x
Topcon Positioning Systems (2018). Topcon Positioning Systems. California, CA: Topcon Positioning Systems, Inc. Available online at: https://www.topconpositioning.com (accessed March 20, 2018).
Vanderlaan, A. S. M., and Taggart, C. T. (2007). Vessel collisions with whales: the probability of lethal injury based on vessel speed. Mar. Mamm. Sci. 23, 144–156. doi: 10.1111/j.1748-7692.2006.00098.x
Williams, R., Bain, D., Smith, J., and Lusseau, D. (2009). Effects of vessels on behaviour patterns of individual southern resident killer whales Orcinus orca. Endanger. Species Res. 6, 199–209. doi: 10.3354/esr00150
Williams, R., Krkošek, M., Ashe, E., Branch, T. A., Clark, S., Hammond, P. S., et al. (2011). Competing conservation objectives for predators and prey: estimating killer whale prey requirements for chinook salmon. PLoS ONE 6:e26738. doi: 10.1371/journal.pone.0026738
Williams, R., and Noren, D. P. (2009). Swimming speed, respiration rate, and estimated cost of transport in adult killer whales. Mar. Mamm. Sci. 25, 327–350. doi: 10.1111/j.1748-7692.2008.00255.x
Williams, R., Trites, A. W., and Bain, D. E. (2006). Behavioural responses of killer whales (Orcinus orca) to whale-watching boats: opportunistic observations and experimental approaches. J. Zool. 256, 255–270. doi: 10.1017/S0952836902000298
Wood, S. N. (2004). Stable and efficient multiple smoothing parameter estimation for generalized additive models. J. Am. Stat. Assoc. 99, 673–686. doi: 10.1198/016214504000000980
Wood, S. N. (2017). Generalized Additive Models: An Introduction With R, 2nd Edn. Boca Raton, FL: Chapman and Hall/CRC. doi: 10.1201/9781315370279
Keywords: disturbance, humpback whale, tourism, behavioral response, guidelines, vessel traffic, whale behavior
Citation: Currie JJ, McCordic JA, Olson GL, Machernis AF and Stack SH (2021) The Impact of Vessels on Humpback Whale Behavior: The Benefit of Added Whale Watching Guidelines. Front. Mar. Sci. 8:601433. doi: 10.3389/fmars.2021.601433
Received: 01 September 2020; Accepted: 15 January 2021;
Published: 09 February 2021.
Edited by:
Maritza Sepulveda, Universidad de Valparaiso, ChileReviewed by:
Artur Andriolo, Juiz de Fora Federal University, BrazilMarianne Rasmussen, University of Iceland, Iceland
Petter H. Kvadsheim, Norwegian Defence Research Establishment, Norway
Copyright © 2021 Currie, McCordic, Olson, Machernis and Stack. This is an open-access article distributed under the terms of the Creative Commons Attribution License (CC BY). The use, distribution or reproduction in other forums is permitted, provided the original author(s) and the copyright owner(s) are credited and that the original publication in this journal is cited, in accordance with accepted academic practice. No use, distribution or reproduction is permitted which does not comply with these terms.
*Correspondence: Jens J. Currie, research@pacificwhale.org
†Present address: Jessica A. McCordic, Integrated Statistics, Inc., Under Contract to Affiliation: Northeast Fisheries Science Center, National Oceanic and Atmospheric Administration, Washington, DC, United States