Balancing Model Complexity, Data Requirements, and Management Objectives in Developing Ecological Reference Points for Atlantic Menhaden
 Katie Drew1*
  Matthew Cieri2
  Amy M. Schueller3
  Andre Buchheister4
  David Chagaris5
  Geneviève Nesslage6
  Jason E. McNamee7
  James H. Uphoff Jr.8
- 1Atlantic States Marine Fisheries Commission, Arlington, VA, United States
- 2Maine Department of Marine Resources, Boothbay Harbor, ME, United States
- 3National Marine Fisheries Service, Southeast Fisheries Science Center, Beaufort, NC, United States
- 4Department of Fisheries Biology, Humboldt State University, Arcata, CA, United States
- 5Nature Coast Biological Station, Institute of Food and Agricultural Sciences, University of Florida, Gainesville, FL, United States
- 6Chesapeake Biological Laboratory, University of Maryland Center for Environmental Science, Solomons, MD, United States
- 7Rhode Island Department of Environmental Management, Providence, RI, United States
- 8Cooperative Oxford Lab, Maryland Department of Natural Resources, Oxford, MD, United States
Atlantic menhaden is an important forage fish and the target of the largest fishery along the US East Coast by volume. Since 1999, managers at the Atlantic States Marine Fisheries Commission, stakeholders, and scientists have been interested in developing ecological reference points (ERPs) that account for menhaden’s role as a forage species. To accomplish this, we developed a suite of modeling approaches that incorporated predation on menhaden and changes in productivity over time and allowed for evaluation of trade-offs between menhaden harvest and ecosystem management objectives. These approaches ranged in complexity, from models with minimal data requirements and few assumptions to approaches with extensive data needs and detailed assumptions. This included a surplus production model with a time-varying intrinsic growth rate, a Steele-Henderson surplus production model, a multispecies statistical catch-at-age model, an Ecopath with Ecosim (EwE) model with a limited predator and prey field, and a full EwE model. We evaluated how each model could address managers’ objectives and compared outputs across the approaches, highlighting their strengths, weaknesses, and management utility. All models produced estimates of age-1 + biomass and exploitation rate that were similar in trend and magnitude to the single-species statistical catch-at-age model, especially in recent years. While the less complex models were relativity easy to implement and update, they lacked key elements needed to manage multiple species simultaneously. More complex models required a wider array of data and were more difficult to update within the current management time-frames, but produced a more useful framework for managers. Ultimately, an EwE model of intermediate complexity coupled with the existing single-species assessment model was recommended for use in management.
Introduction
Over the past decade, there has been increasing interest in taking into account ecosystem impacts when managing forage species. Much of the work on this issue has concluded that forage fisheries should be managed more conservatively than single-species reference points would suggest, to ensure both the sustainable harvest of forage fish and to reduce ecosystem impacts from their removal. For example, Smith et al. (2011) recommended maintaining forage fish populations at a target biomass of 75% of unexploited biomass to prevent negative consequences to predators, compared to the approximately 60% level implied by fishing at the F that produces the maximum sustainable yield (FMSY). Pikitch et al. (2012) recommended a precautionary approach for forage fish management, including fishing at 50–75% of FMSY and using a biomass threshold of 30–40% of unexploited biomass depending on the quality of data available, in order to sustain both predator and prey species. There has been some criticism of the studies underpinning these recommendations. Essington and Plagányi (2014) highlighted the pitfalls in the approach of reusing ecological models that were developed to address other issues, as they may not have the depth or breadth of ecosystem structure necessary to fully explore questions they were not designed to answer. Hilborn et al. (2017) pointed out that the ecological models used to develop the rule of thumb recommendations in Pikitch et al. (2012) did not account for the weak, environmentally driven stock-recruitment relationship observed for most forage species or the differing selectivities of predators and fisheries, and therefore may overstate the impact of fishing on forage fish abundance and predator population dynamics (but see also the response of Pikitch et al., 2018). However, there remains a general consensus that ecosystem services should be considered when managing forage fisheries, and that developing models tailored to a specific ecosystem, species of interest, and management question provides the best results.
The range of modeling approaches to provide quantitative advice for ecosystem-based fishery management for forage fishes has greatly expanded in the past few decades (Rice and Duplisea, 2014). Early approaches focused on key predator-prey interactions and parsimonious models. For example, Steele and Henderson (1984) showed that the large population fluctuations observed in forage fish species could be recreated with a surplus production model that incorporated a predation function, resulting in multiple equilibrium states for the prey species. The multispecies virtual population analysis (MSVPA) framework was developed as a set of single-species VPAs for key species linked by a feeding model (Helgason and Gislason, 1979; Pope, 1979) to estimate predation mortality on prey species, along with population size and fishing mortality. As processing power and data collection improved, more complex models became possible. The multispecies statistical catch-at-age (MSSCAA) approach translated the MSVPA into the statistical catch-at-age and catch-at-length frameworks to take advantage of the more statistically robust maximum likelihood fitting approach (Lewy and Vinther, 2004; Kinzey and Punt, 2009). Full ecosystem models like Ecopath with Ecosim (Christensen and Walters, 2004) and Atlantis (Fulton et al., 2004; Audzijonyte et al., 2019) were developed to model not just the complete food web from primary production to apex predators but also physical processes, environmental drivers, and socioeconomic factors. As with all quantitative modeling, there is a trade-off between model complexity (i.e., realism) and data requirements (Plagányi et al., 2014; Punt et al., 2016). As model complexity increases, concerns shift from model bias due to the omission of important ecosystem components in simple models to parameter uncertainty that arises as the number of parameters increases in a complex model (Collie et al., 2016). The more complex the model and the more data streams that are needed to support it, the more challenging it is to incorporate into short and moderate-term fisheries management. In addition, model structure affects what kind of management advice can be provided and what kind of questions the model can answer. A multi-model approach allows for the exploration of the trade-offs between model complexity, data requirements, and management objectives to select an approach that makes the best use of the available data and provides information that is relevant to managers and stakeholders.
We applied a multi-model approach to an important forage fish in the northwest Atlantic coastal ecosystem, Atlantic menhaden (Brevoortia tyrannus). Atlantic menhaden have supported one of the largest fisheries in the U.S. since colonial times, with the vast majority of landings being used to produce fish meal and fish oil for use in a variety of products, and a smaller component being used as bait for other commercial and recreational fisheries (SEDAR, 2020a). Atlantic menhaden are also a prey item for a variety of species including larger fish such as striped bass (Morone saxatilis; Walter et al., 2003) and bluefin tuna (Thunnus thynnus; Butler et al., 2010); birds such as bald eagles (Haliaeetus leucocephalus; Mersmann, 1989) and osprey (Pandion haliaetus; Glass and Watts, 2009); and marine mammals like bottlenose dolphin (Tursiops truncatus; Gannon and Waples, 2004). Many of these predator species support valuable commercial and recreational fisheries or ecotourism industries as well as having cultural value. The importance of Atlantic menhaden as a forage fish has long been recognized by scientists, stakeholders, and the body responsible for managing Atlantic menhaden, the Atlantic States Marine Fisheries Commission (ASMFC; Atlantic States Marine Fisheries Commission [ASMFC], 1981). The single-species assessment of Atlantic menhaden has historically used estimates of natural mortality from an MSVPA model to better quantify the effects of predation on the Atlantic menhaden population (Atlantic States Marine Fisheries Commission [ASMFC], 2004, 2011; Garrison et al., 2010). However, this approach had several limitations, one of which was the lack of information regarding the effects of Atlantic menhaden removals on important predator species. ASMFC remained interested in developing quantitative “ecological reference points” (ERPs) that take into account Atlantic menhaden’s role as a forage species to evaluate stock status and set quotas (Atlantic States Marine Fisheries Commission [ASMFC], 2012). ASMFC identified a set of ecosystem management objectives for Atlantic menhaden that it wanted the ERPs to inform, including (1) sustaining Atlantic menhaden to provide for directed fisheries, (2) sustaining Atlantic menhaden to provide for predators, (3) providing stability for Atlantic menhaden and predator fisheries, and (4) minimizing risk due to a changing environment (Atlantic States Marine Fisheries Commission [ASMFC], 2015).
Here we describe the process of model exploration and comparison to develop a tool that provided ERPs for Atlantic menhaden that met managers’ needs. For more detail on the final recommended model and its implementation in a management framework, see Chagaris et al. (2020). For this paper, we had three primary objectives. First, we developed a suite of models capable of estimating ERPs for use in the management of Atlantic menhaden. These models covered a range of complexity levels, model structures, and model assumptions, including two different types of surplus production models, a MSSCAA model, and two Ecopath with Ecosim models of varying levels of complexity. Each model was fit to observed data, including time series of total catch, catch-at-age, indices of young-of-year and age-1+ abundance, and diet data for Atlantic menhaden and other species in the ecosystem. Not all models used all data sources, but model inputs were standardized as much as possible across the candidate models. All of the models were capable of producing reference points that reflected ecosystem considerations in some way, although the definitions of the reference point and the type of information they provided varied depending on model structure. Second, we compared the outputs and estimates of each model, including biomass, exploitation rate, and natural mortality rate of Atlantic menhaden, as well as the stock status based on their ERPs. Example ERPs were calculated for each model based on conditions (e.g., productivity, predator abundance) in 2017, the terminal year of the models. Third, we evaluated the capability and utility of the models to produce management advice for the explicit ecosystem objectives defined for this fishery.
Materials and Methods
Data Standardization
To better evaluate the effects of differences in model structure, model inputs were standardized as much as possible across the candidate models, with all models using the same data sources for the key ecosystem species. The key ecosystem species were defined as Atlantic menhaden, striped bass, Atlantic herring (Clupea harengus), bluefish (Pomatomus saltatrix), spiny dogfish (Squalus acanthias), and weakfish (Cynoscion regalis). These species were selected based on the magnitude of the species’ role as Atlantic menhaden consumers or as alternative prey for Atlantic menhaden predators as indicated by an analysis of the Northeast Fisheries Science Center Food Habits Database (Link and Almeida, 2000)1, the quality and availability of stock assessment data for each species, and the relevance of each species to ASMFC management. All of the key ecosystem species had recently undergone stock assessments with data and population estimates available through 2017, the terminal year of the ERP models (Northeast Fisheries Science Center [NEFSC], 2018a,b, 2019, 2020; Atlantic States Marine Fisheries Commission [ASMFC], 2019; SEDAR, 2020a). Due to differences in structure among models, not all models included all of the key ecosystem species, and some models included additional species or species groups.
Each of the models had somewhat different data requirements. All models required data on Atlantic menhaden, and the ERP models used the same time-series of total removals, life history parameters, and indices of abundance as the Atlantic menhaden single-species model to the extent practicable. For models that required data on other species, datasets from the most recent stock assessments were used; for some models, this included input data like total removals, life history parameters, and indices of abundance, while for other models, the stock assessment estimates of biomass and/or fishing mortality rates were used. More detail on the data used in each model is provided in Section “Model Descriptions” below.
The starting year for each of the ERP models was constrained by the availability of data for the species included in the model. The Atlantic menhaden stock assessment started in 1955, but the starting years for the striped bass, bluefish, and weakfish assessments were 1982–1985, when reliable estimates of recreational catch became available. Diet data were obtained from three large scale monitoring programs: the Northeast Fisheries Science Center Food Habits Database, the North East Area Monitoring and Assessment Program (NEAMAP), and Chesapeake Bay Multispecies Monitoring and Assessment Program (ChesMMAP). These data were supplemented with smaller-scale studies, especially for species that were not well represented in the larger monitoring programs (Garrison et al., 2010).
Model Descriptions
We developed a suite of five models: a surplus production model with a time-varying intrinsic growth rate of the population, r, (SPM TVr; Nesslage and Wilberg, 2019), a Steele-Henderson surplus production model with predation (SPM S-H; Steele and Henderson, 1984; Uphoff and Sharov, 2018), a multispecies statistical catch-at-age model (MSSCAA; Curti et al., 2013; McNamee, 2018), an intermediate complexity Ecopath with Ecosim model with a limited predator and prey field (EwE-MICE; Chagaris et al., 2020), and a full Ecopath with Ecosim model (EwE-Full; Buchheister et al., 2017a,b). We also compared these models to the results of the single species statistical catch-at-age model used to assess Atlantic menhaden (the Beaufort Assessment Model, BAM; Williams and Shertzer, 2015; SEDAR, 2020a). Together, these models covered a wide range of model complexity and data requirements (Table 1). Full descriptions of individual models, including equations, parameter estimates, model diagnostics, and sensitivity runs, are available for the single-species model in SEDAR (2020a) and for the ERP models in SEDAR (2020b). The single-species BAM has been used since 2010 to assess and manage Atlantic menhaden. The BAM was a single-species statistical catch-at-age model that estimated population-size-at-age and recruitment, using 1955 as the start year, and projected the population forward in time (Williams and Shertzer, 2015; SEDAR, 2020a). The BAM used a fleets-as-areas model with each of the fleets broken into areas to reflect differences in selectivity and Atlantic menhaden availability along the coast. The BAM was fit to a time series of total landings and catch-at-age data for each regional fleet, three age-1+ fishery-independent indices, index-at-length data, a larval index, and a juvenile abundance index (SEDAR, 2020a).
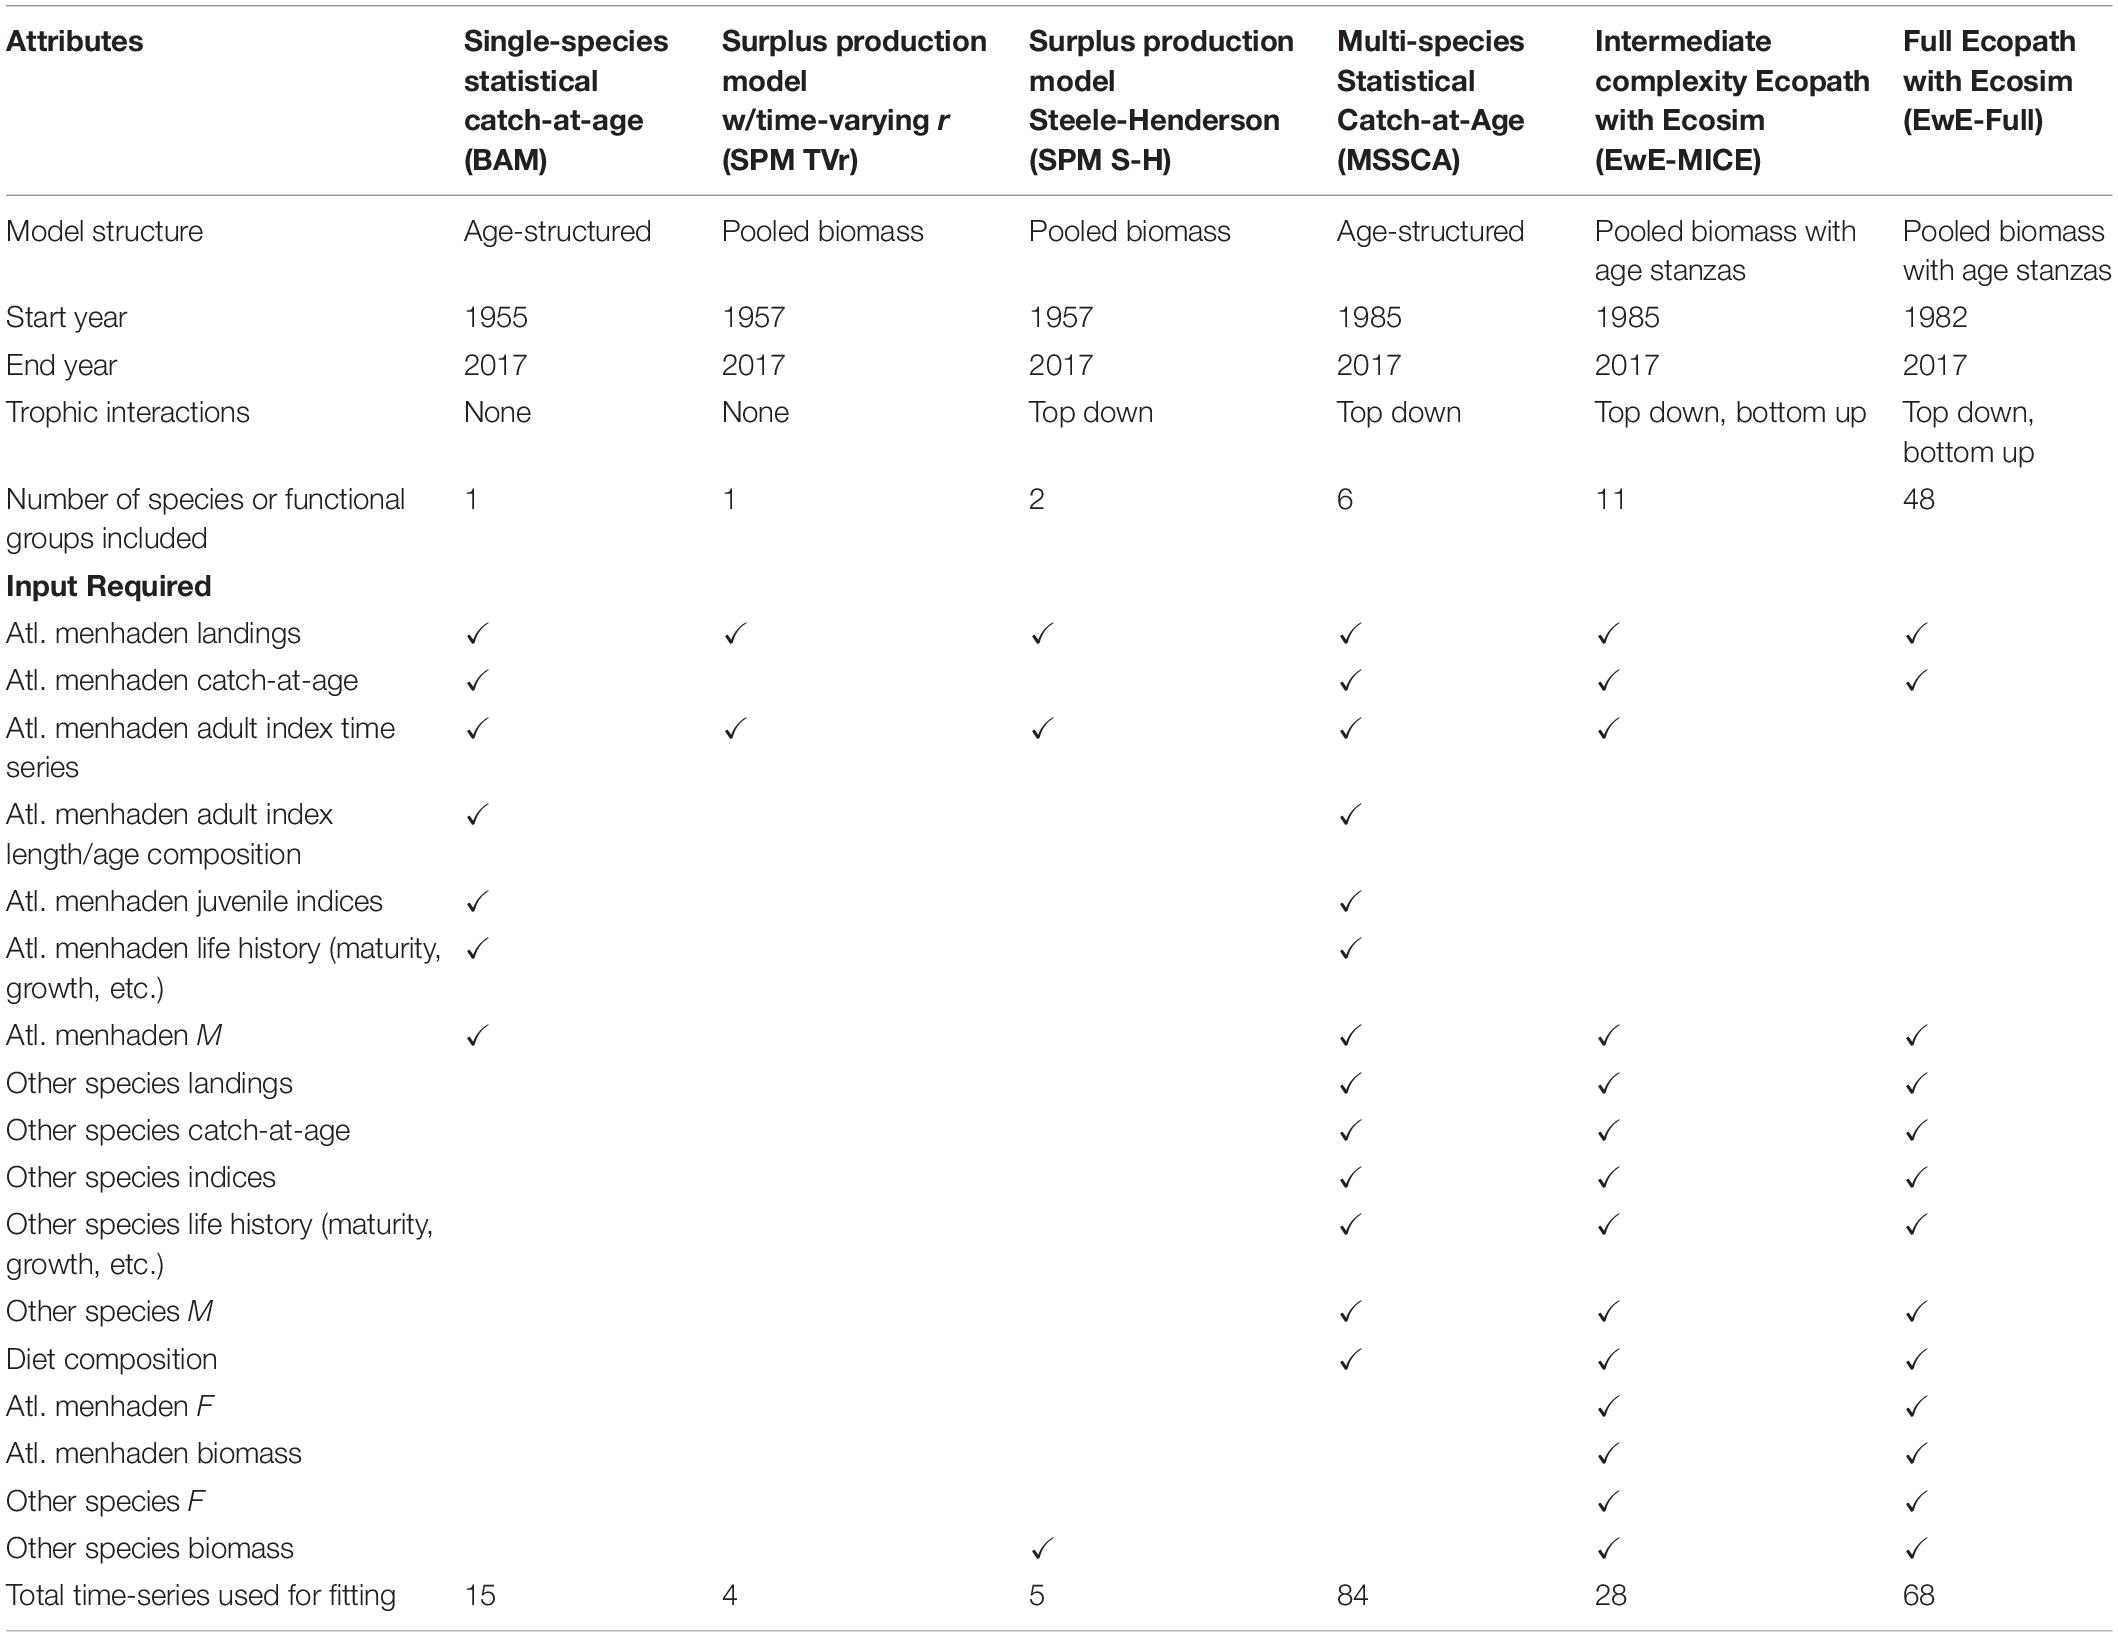
Table 1. Comparison of model structure, attributes, and inputs used for ERP models.
The SPM TVr and SPM S-H were the least complex models, with minimal explicit assumptions about ecosystem dynamics and productivity drivers. They also required the least data. Unlike traditional surplus production models, which estimate a single, time constant value for r, the SPM TVr model estimated an annual r for Atlantic menhaden using a random walk process (Nesslage and Wilberg, 2019; SEDAR, 2020b). The parameter r encompassed a range of population processes, including recruitment, natural mortality, and size-at-age. Estimation of time-varying r captured the overall effects of interannual variability in those processes without attributing changes in productivity to any one driver. The SPM TVr model had minimal data requirements: a time-series of removals and one or more indices of relative abundance for Atlantic menhaden. A fishery-dependent index that covered the entire time-series (1957–2017) was used in addition to two shorter adult fishery-independent indices used in the single-species assessment, to provide the contrast in stock size that surplus production models need to independently estimate r and carrying capacity, K (Hilborn and Walters, 1992).
The SPM S-H model is another variation on the traditional surplus production model which incorporated additional sigmoidal type III predation functions that estimated predation losses from one or more predators (Collie and Spencer, 1993, 1995; Uphoff and Sharov, 2018; SEDAR, 2020b). The SPM S-H model explicitly linked changes in productivity to changes in predator biomass. The SPM S-H model used the same Atlantic menhaden inputs as the SPM TVr: total removals, two adult fishery-independent indices, and the long-term fishery-dependent index. The SPM S-H model also required a time-series of predator biomass. Different combinations of striped bass, bluefish, and spiny dogfish were explored as candidate predators by comparing their SPM S-H models to SPM models (no predator); the final model used striped bass as the sole predator based on AICc, model fit, and how well consumption estimates matched similar parameters for included species derived from feeding experiments and bioenergetics models (SEDAR, 2020b). The base model covered 1985–2017, but a long-term exploratory model was developed by hindcasting striped bass biomass from 1957 to 1981 based on a fishery-independent egg presence-absence index of egg production (Uphoff, 1993, 1997) in the Chesapeake Bay, the main striped bass spawning ground.
The MSSCAA was one of the models of intermediate complexity, with more explicit and detailed assumptions about ecosystem dynamics and more extensive data requirements than the surplus production models, but fewer key predator and prey species than the full EwE model. The MSSCAA was a set of traditional statistical catch-at-age models for the key ecosystem species linked by equations that described trophic interactions (Curti et al., 2013; McNamee, 2018; SEDAR, 2020b). The MSSCAA included a pool of “other ecosystem biomass” to account for alternative prey species that were not explicitly modeled. The MSSCAA was fit to the same datasets used for individual species’ statistical catch-at-age models (total removals, indices of relative abundance, and age composition of the catch and indices), although the inputs were simplified somewhat to reduce the number of fleets and indices of abundance in the model (SEDAR, 2020b). The MSSCAA was also fit to observed diet composition data. The MSSCAA was parameterized with the same life history inputs as the single-species assessments such as size-at-age, maturity schedule, and, for predator species, natural mortality rates. The MSSCAA began in 1985, the earliest year that all catch-at-age data sets were available for the key ecosystem species.
EwE is a dynamic food web model that simulates changes in biomass across all trophic levels, from detritus and primary producers to top predators (Christensen and Walters, 2004). In EwE temporal simulations, biomass dynamics are predicted as a function of prey consumed minus losses to predation and fishing (and migration if included), where consumption is modeled based on foraging arena theory (Ahrens et al., 2012). Importantly, the foraging arena equations account for top–down and bottom–up processes, which allows for the development of trade-off relationships between prey harvest and predator biomass. Additionally, EwE models can produce equilibrium-based MSY reference points and generate emergent stock-recruit relationships under different ecosystem conditions. The basic inputs for EwE are biomass, total mortality or production rate, consumption rates, diet composition, and total removals. The model is calibrated to time series of relative abundance and catch, using fishing effort or fishing mortality as forcing series, by estimating key parameters of the foraging arena equations to improve model fit to observed data.
The EwE-MICE was another intermediate complexity model (Chagaris et al., 2020; SEDAR, 2020b). The EwE-MICE model included the six key ecosystem species, as well as anchovies (Anchoa spp.), benthic invertebrates, zooplankton, phytoplankton, and detritus. The key ecosystem species in the EwE-MICE model were split into age stanzas based on trophic ontogeny and fishery selectivity, generally represented by age-0 and age-1+ fish, or juvenile, sub-adult, and adult fish. The EwE-MICE simulations began in 1985, the earliest year that all single-species assessment results were available for the key ecosystem species.
The EwE-Full model represented the most complex and data-intensive model explored (Buchheister et al., 2017a,b; SEDAR, 2020b). The EwE-Full model described the Northwest Atlantic Continental Shelf ecosystem using 61 trophic groups, compared to 17 trophic groups in the EwE-MICE model. In addition to the key ecosystem species, the EwE-Full model also included other economically important finfish like Atlantic cod (Gadus morhua) and summer flounder (Paralichthys dentatus) and higher non-finfish trophic groups like sharks, sea birds, and marine mammals. The EwE-Full simulations began in 1982, the earliest year that estimates of recreational catch were available for finfish predators and the starting year for many of the single species stock assessments. The EwE-Full model was calibrated to stock assessment estimates of biomass for Atlantic menhaden and other species, where available, unlike the EwE-MICE model, which used the indices of abundance for all species.
Reference Point Definitions
All of the ERP models were capable of producing reference points that reflected ecosystem considerations in some way, although the definitions of the reference point and the type of information they provided varied from model to model (Table 2). The SPM TVr model provided annual estimates of UMSY, the exploitation rate that produces the maximum sustainable yield, which was calculated based on annual estimates of r. This provided sustainable exploitation rate reference points based on the changing productivity of the stock; 75% of UMSY was used as the overfishing threshold. The SPM TVr model also estimated BMSY, the biomass that produces MSY, which did not vary over time, as it was calculated from a time-constant estimate of K; 50% of BMSY was used as the overfished threshold. The SPM S-H model produced reference points in terms of maximum usable production (MUP), the surplus production available to predators and the fishery, instead of single species MSY (Overholtz et al., 2008; Moustahfid et al., 2009). Surplus production available to the fishery alone was defined as MUP minus consumption by predators in the most recent years; the F rate associated with the surplus production available to the fishery, FMUP, provided an overfishing threshold that would allow Atlantic menhaden to maintain its current forage role (Moustahfid et al., 2009). The biomass that produced the maximum usable production, BMUP, was the equivalent of BMSY, for the fishery and modeled predators and was used as the overfished threshold. Since the SPM S-H model did not contain all predators BMUP was used as a threshold to provide some (but unknown) buffering against important predation by an excluded predator or predators.
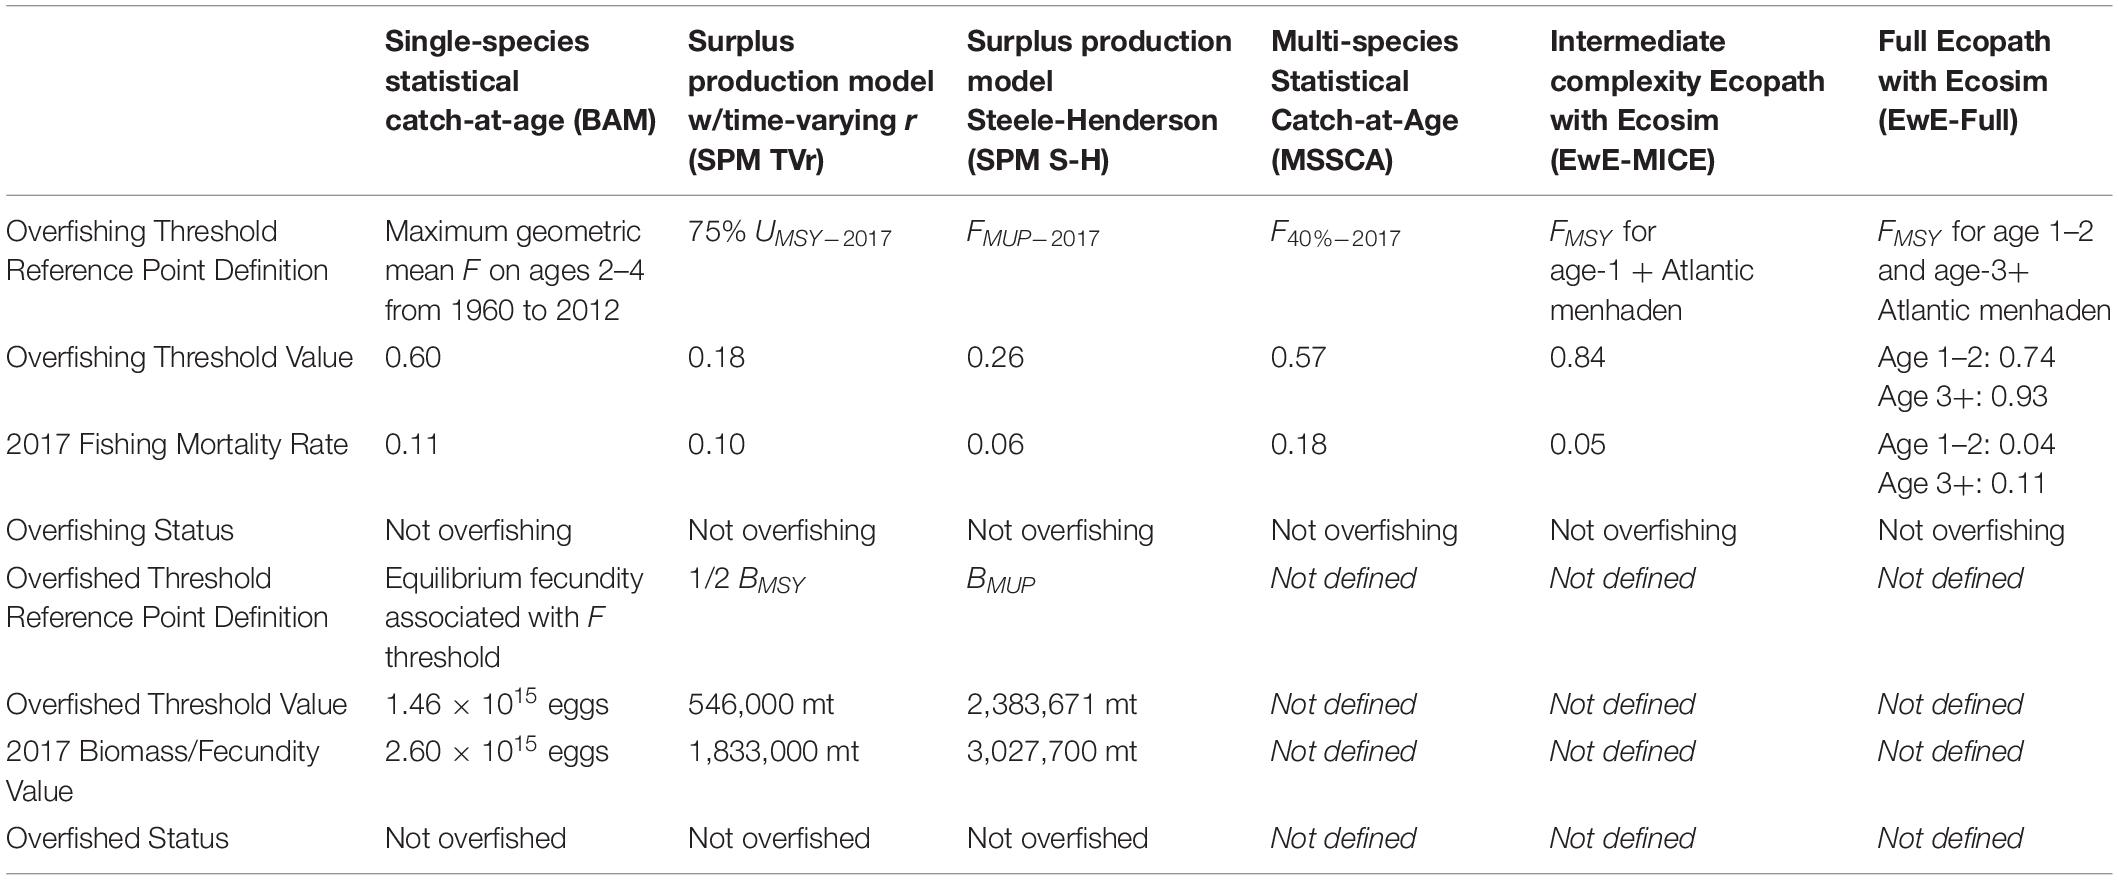
Table 2. Reference points definitions and stock status determinations for the single-species and ERP models based on current ecosystem conditions.
The MSSCAA output (e.g., current selectivity patterns and estimates of M) could be used to calculate MSY- or spawning potential ratio (SPR)-based reference points for Atlantic menhaden as is done with traditional single-species statistical catch-at-age models; F40%SPR, the F rate that results in 40% of the unfished SPR was used as the overfishing threshold. The EwE models calculated FMSY by running long term projections over a range of F or effort values for Atlantic menhaden and identifying the F that produced MSY. Additionally, the EwE models generated menhaden fishing mortality reference points based on the biomass response of their predators and under alternative ecosystem conditions representing different biomass levels of predators and prey in the model. Reference points for all models were calculated based on current ecosystem conditions, i.e., productivity levels or predator consumption levels in the most recent year of the model.
For this study, we focused on F reference points that could be used to provide management advice (i.e., quota recommendations). The surplus production models produced both F and biomass reference points internally, with no additional work required, and both are reported here. Absolute biomass reference points could be derived for the MSSCAA, but development would have required additional work outside of the model and would have been sensitive to assumptions about future recruitment dynamics, predator fishery control rules, and fishery selectivity patterns. Biomass reference points were not provided for the EwE models primarily because initial biomass was not estimated by the model but was a model input, and the coarse age structure and maturity representation in EwE confounded comparisons of spawning biomass across model types.
For comparison, stock status based on the single-species reference points derived from the BAM was also evaluated. The single-species reference points were based on the observed F rates during a sustainable period in the fishery (1960–2012); the overfishing threshold was the maximum geometric mean F-at-age for ages 2–4 over that period, and the overfished threshold was the long term equilibrium egg production that would result from fishing the population at the F threshold (SEDAR, 2020a).
Model Comparisons
We quantitatively and qualitatively compared model estimates and performance. Quantitative metrics included biomass, exploitation rate, natural mortality rates, and stock status metrics. For biomass, exploitation rate, and natural mortality rates, we compared absolute values to assess scale and values relative to their time-series mean to assess trends; Spearman’s rank correlation coefficient was used as a metric of correlation between time-series with a p-value adjusted for multiple comparisons using the Bonferroni correction. Qualitative metrics included the ability to inform management objectives on a time scale consistent with management needs.
To compare Atlantic menhaden population size estimates across models, total age-1+ biomass was used. For the SPM TVr and SPM S-H models, this was equivalent to the total biomass estimates from each model. For the BAM and the MSSCAA model, this was the sum of the beginning of the year biomass at age for ages 1–6+. For the EwE models, total age-1+ biomass was defined as the biomass in the “adult” size class for the EwE-MICE model (which used only two size classes, equivalent to age-0 and age-1+) and the sum of the “medium” and “large” size classes for the EwE-Full model (which used three size classes, with the “small” size class equivalent to age-0). The 95% confidence intervals from the BAM were used as an estimate of the minimum uncertainty for the single-species biomass estimates to facilitate comparisons.
Exploitation rate of Atlantic menhaden was used to compare measures of fishing mortality across models with different structures as well as different units. Exploitation rate was calculated as predicted total age-1+ fishery removals in weight divided by the beginning of the year age-1+ biomass for all models. The EwE models used exploitation rate as an input forcing series, and so were not included in this comparison. The 95% confidence intervals from the BAM were used as an estimate of the minimum uncertainty for the single-species exploitation rate estimates to facilitate comparisons.
The SPM S-H, the MSSCAA, and the EwE models estimated natural mortality from the predation of modeled species, referred to as M2. To compare estimates of total M and M2 across models, biomass-weighted average M and M2 were calculated for the models that had multiple age or size bins for adult Atlantic menhaden (the MSSCAA and EwE-Full models), while the full M2 from the SPM S-H and the full M and M2 on age-1+ Atlantic menhaden from the EwE-MICE were used for the less structured models. The SPM TVr did not produce estimates of M or M2. The SPM S-H included non-modeled predation mortality in the r parameter, so it did not produce estimates of M. The BAM used an age-varying but time-constant M as input, and a biomass-weighted average M on age-1+ was calculated for the BAM for comparison purposes.
We also compared stock status relative to each models’ reference points in the terminal year. Because of differences in scale and currency for each model, we did not compare the absolute values of the reference points. Each model’s terminal year estimate of F or U for Atlantic menhaden was compared to the F or U threshold; overfishing was occurring if the terminal year estimate was above the threshold. Each model’s terminal year estimate of biomass or fecundity for Atlantic menhaden was compared to the biomass or fecundity threshold where available (the surplus production models and the BAM); the stock was overfished if biomass or fecundity was below the threshold. The reference point values were calculated based on the most recent ecosystem conditions for each model.
Because the EwE-MICE was a scaled-down version of the EwE-Full model, we could evaluate the effects of a more limited predator-prey field on our understanding of the ecosystem. We conducted 40–50 years projections using different levels of F on Atlantic menhaden with both EwE models and evaluated the resulting trends in biomass for other species in the ecosystem to determine which predators were most sensitive to menhaden harvest and assess whether the EwE-MICE model was missing predators that were more sensitive to Atlantic menhaden harvest (SEDAR, 2020b).
In addition to model output, we also qualitatively evaluated the models’ abilities to address management objectives and performance measures. Based on the report from the 2015 ASMFC Ecosystem Management Objectives Workshop (Atlantic States Marine Fisheries Commission [ASMFC], 2015), the models needed to be able to (1) explicitly examine the trade-off between fishery removal of Atlantic menhaden and important predator biomass; (2) provide quantitative and understandable advice on removal levels of Atlantic menhaden under various predator biomass or fishing levels; (3) examine the implications and consequences of Atlantic menhaden harvest strategy on important predators within the modeling framework, and (4) be updatable on a timeframe consistent with Atlantic menhaden management.
Results
Quantitative Comparisons of Model Output
All models estimated similar trends in age-1+ biomass estimates and were on similar scales, both in comparison to each other and to the single-species assessment results (Figure 1). All ERP model estimates were significantly correlated with the single-species model estimates of biomass (ρ = 0.42–0.60, p < 0.003), and were generally correlated with each other as well (Table 3). The two surplus production models (SPM TVr and SPM S-H) and the single-species assessment model (BAM) were comparable across the entire time series (1957–2017). All three models showed a decline from the late 1950s to a low in the early 1960s before increasing through the end of the time series, although the surplus production models began increasing sooner than the BAM. The surplus production model estimates of biomass exhibited less interannual variability than the BAM estimates because they did not capture the variability in recruitment that is estimated by the statistical catch-at-age model structure. The MSSCAA model produced estimates of total biomass that were most similar in magnitude and interannual variability to the BAM (Figure 1). Both models showed an increase from 1985 to the early 1990s followed by a decline into the early 2000s and then recovery to levels higher than 1985, although the MSSCAA declined further during the late 1990s and early 2000s. The EwE models followed the overall trend and magnitude of the BAM estimates, but, like the surplus production models, they showed less variability over time than the statistical catch-at-age models because the EwE models did not include annual recruitment deviations (Figure 1). The EwE-Full model was calibrated to the biomass time series from the BAM, whereas the EwE-MICE model was calibrated using fishery-independent indices. Despite these differences, the EwE models were similar to one another and captured the overall trajectories estimated by the BAM and other ERP models.
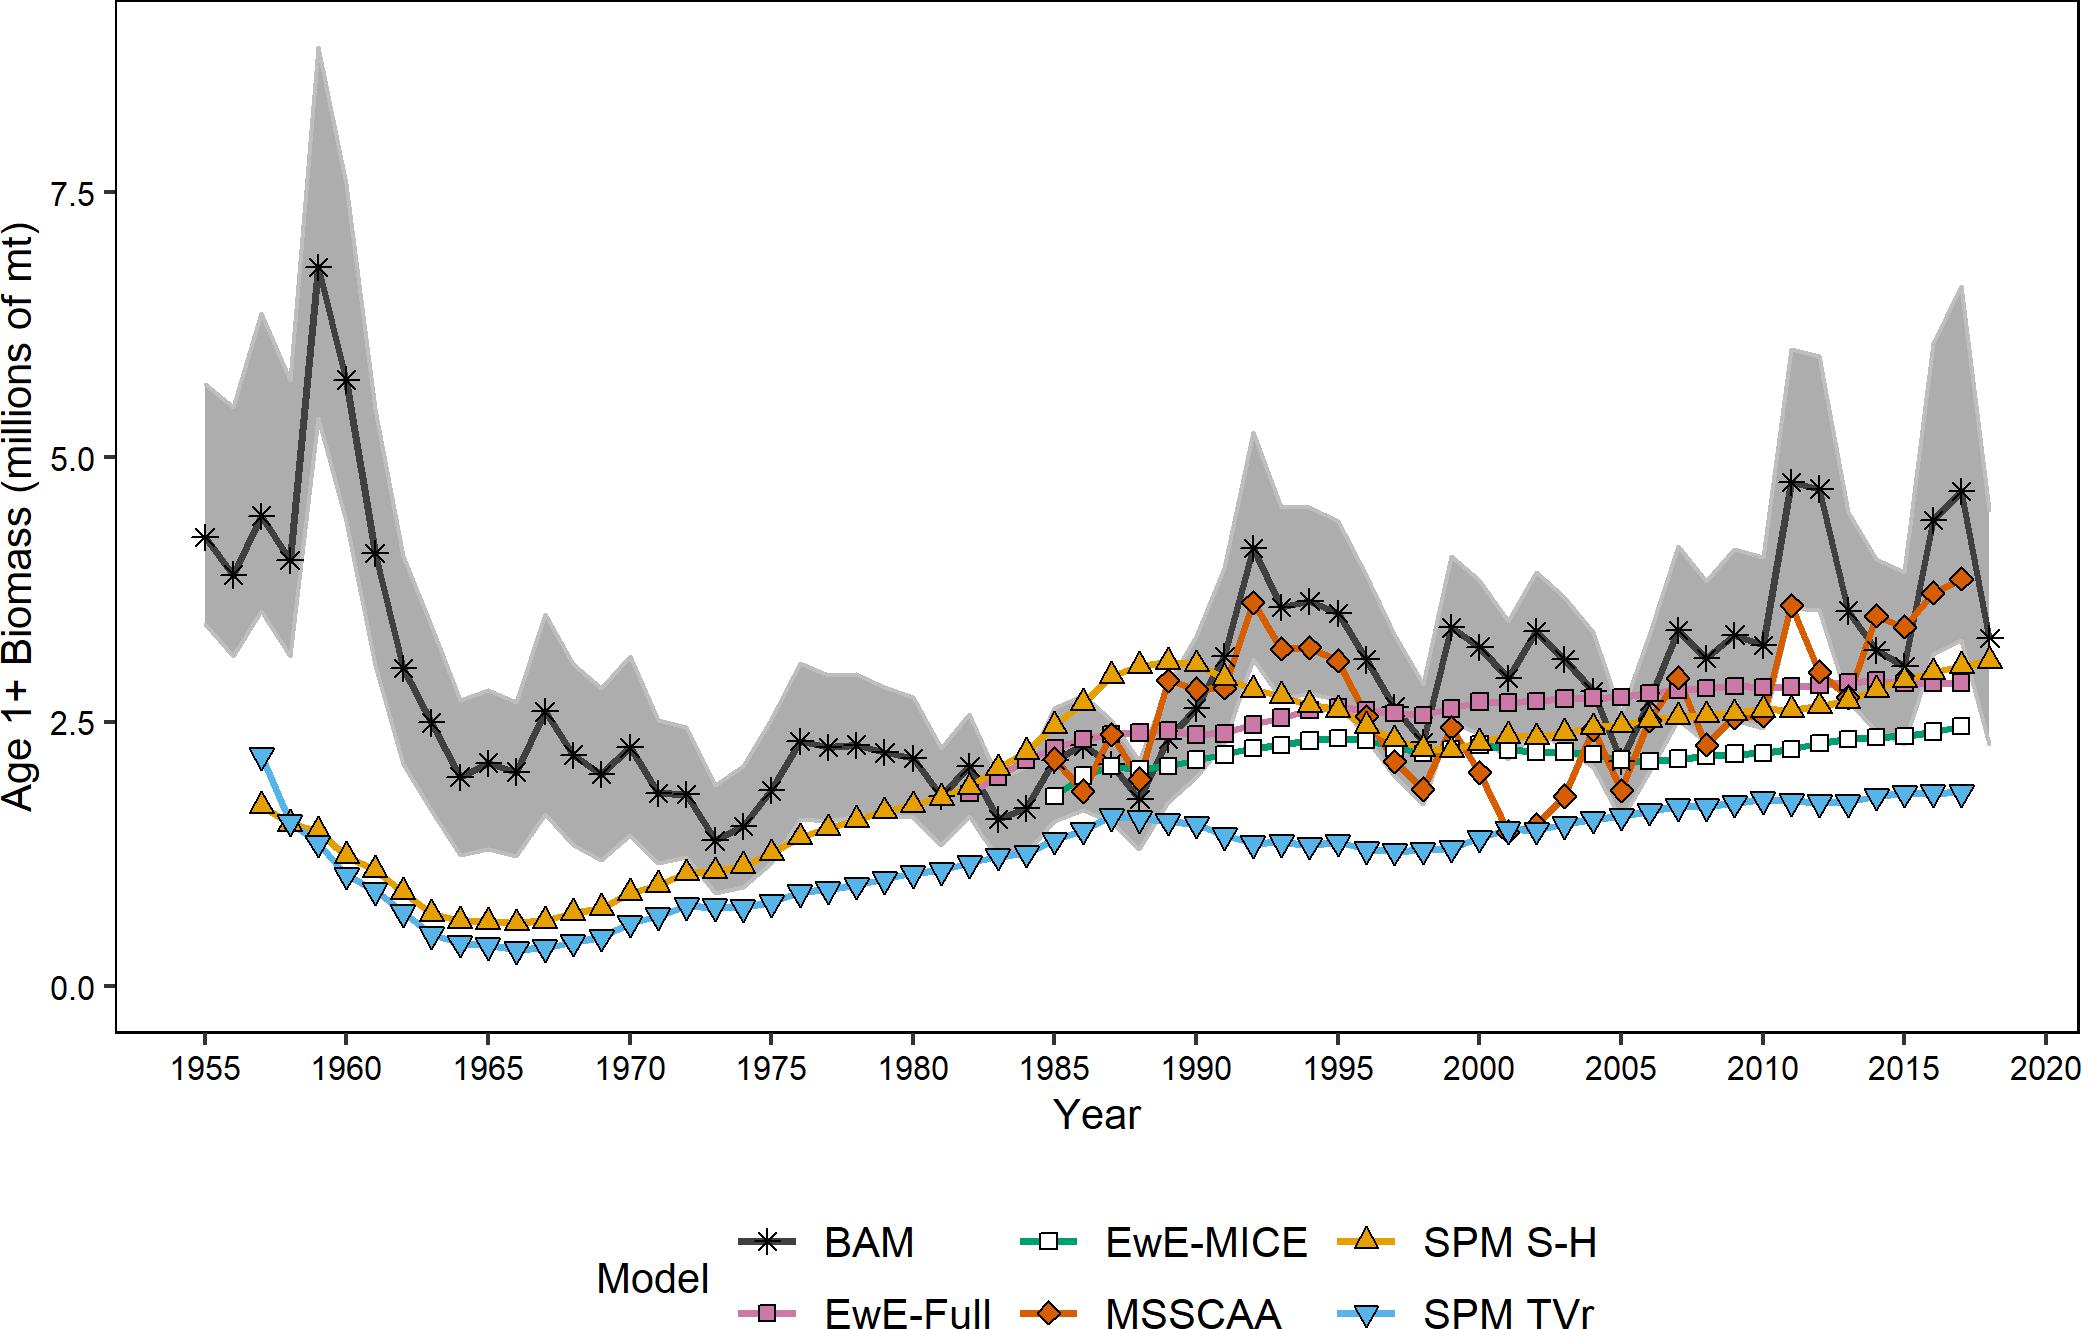
Figure 1. Estimates of age-1+ biomass from the ERP and single-species models. Shaded area indicates the 95% confidence intervals from the single-species assessment model.
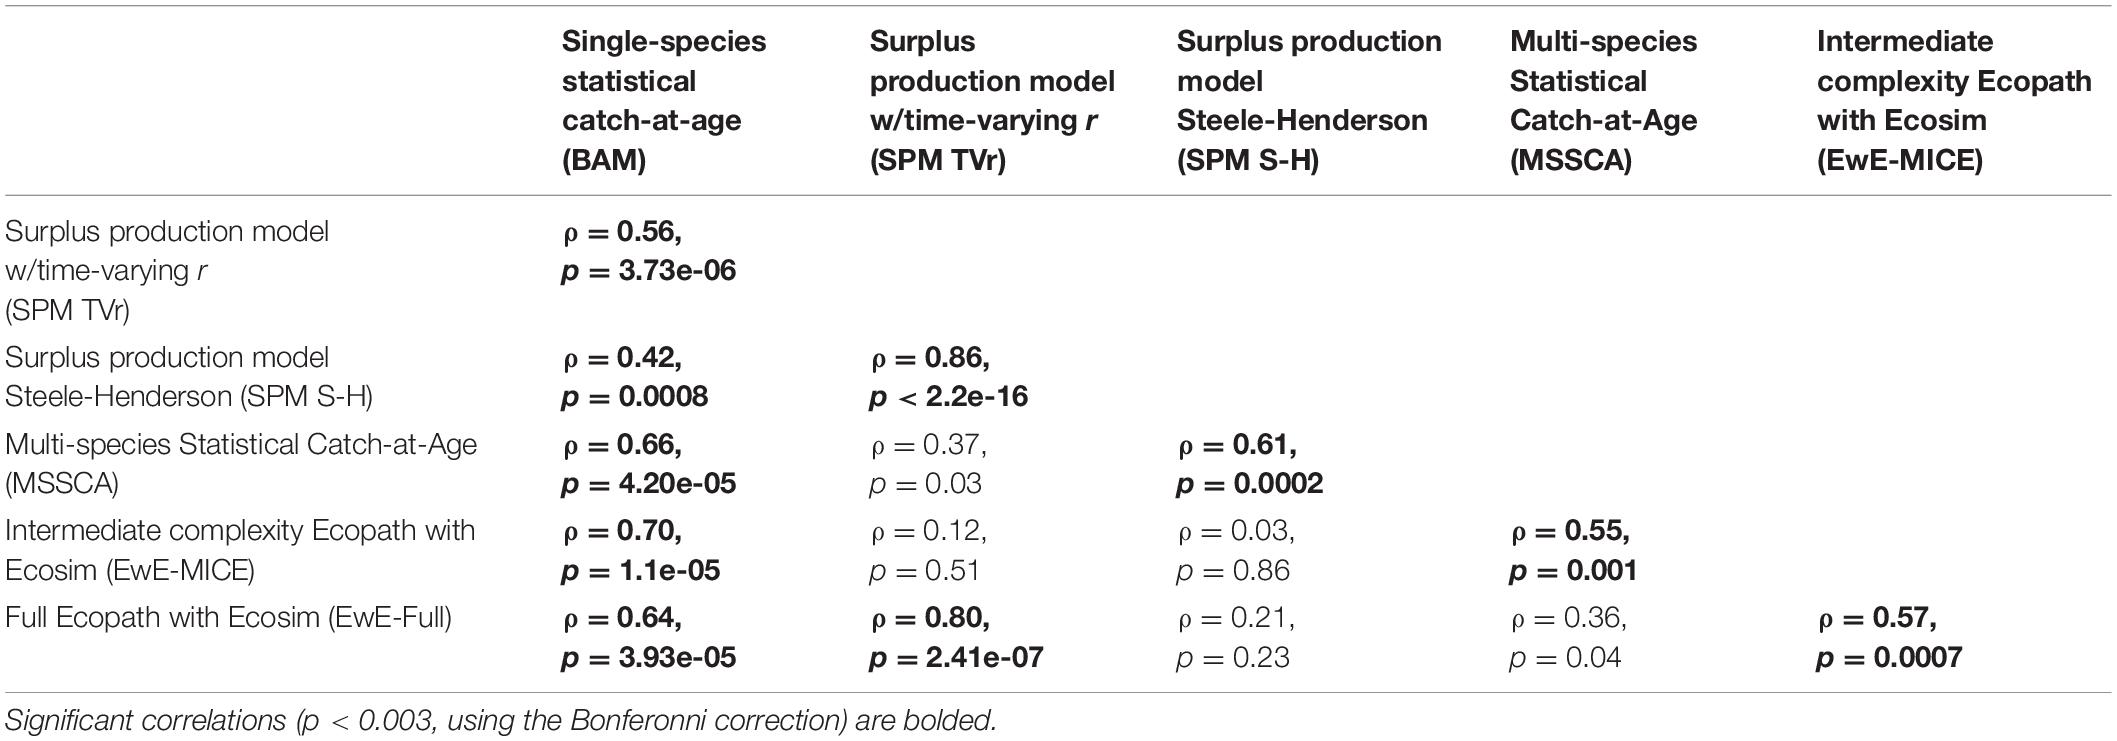
Table 3. Spearman’s rank correlation coefficients and p-values between estimates of age-1+ biomass across models.
Exploitation rates generated by the BAM, SPM TVr, SPM S-H, and MSSCA models were of similar magnitude and exhibited the same declining trends since the mid-1980s (Figure 2). The ERP model estimates of exploitation rate were significantly correlated with the single-species estimates for the full time-series, and with each other (ρ = 0.67–0.98, p < 0.008; Table 4). However, the surplus production models showed a different trend from the BAM estimates in the earliest part of the time-series, the mid-1950s through the mid-1970s. The surplus production models estimated the highest exploitation rates over the entire time series in the early 1960s, followed by a steady decline through the end of the time series. The BAM estimates peaked in the mid-1970s to the mid-1980s before declining. The BAM estimates were lower relative to both the surplus production model estimates and its time-series high during the 1960s, although still higher than the estimates from the most recent years. The MSSCAA does not extend back that far, so no comparisons with that model were possible for this period. The MSSCAA estimates of exploitation rate were very similar to the BAM estimates over the 1985–2017 time period and generally within the MCMC confidence intervals of the BAM estimates, with the exception of the early 2000s (Figure 2). The EwE models used exploitation rates as input forcing time series, and so were not included in this comparison.
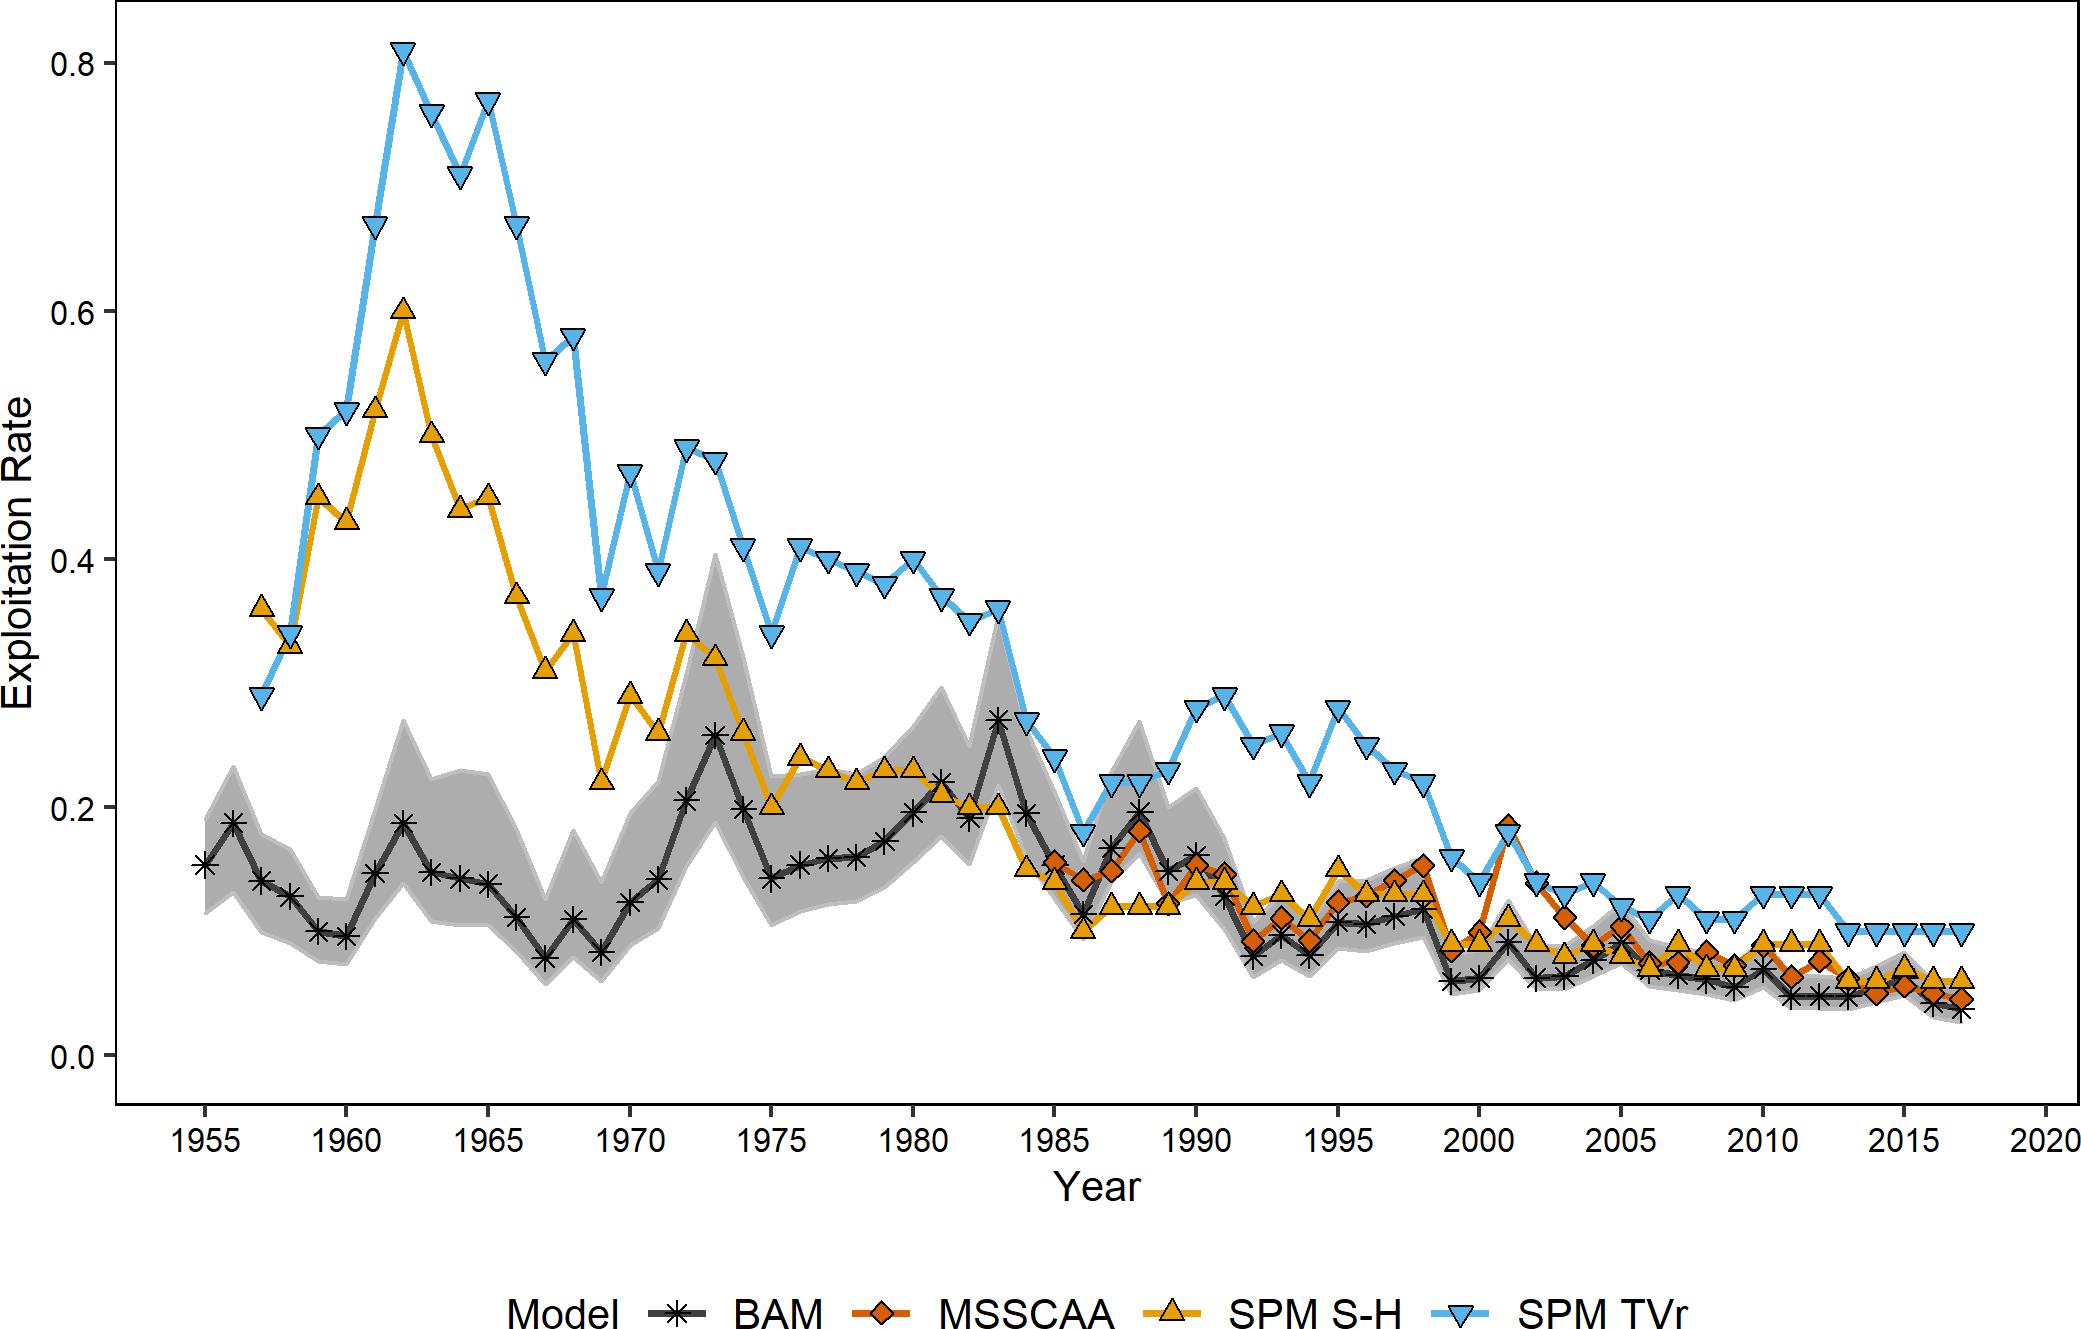
Figure 2. Estimates of exploitation rates from the ERP and single-species models. Shaded area indicates 95% confidence intervals from the single species assessment model.
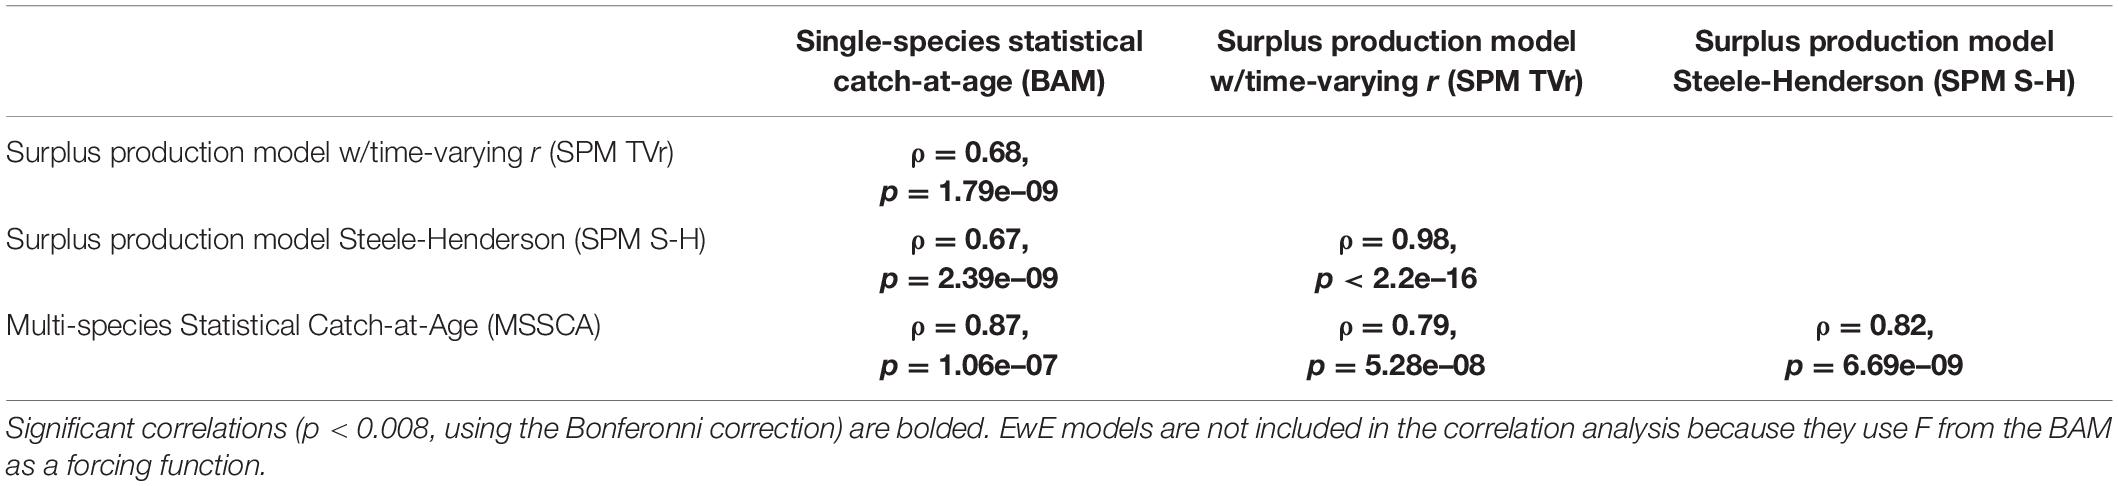
Table 4. Spearman’s rank correlation coefficients and p-values between estimates of exploitation rate across models.
The estimates of modeled predation mortality, M2 from the SPM S-H, MSSCAA, and EwE-MICE models generally showed similar trends over time, with M2 peaking in the late 1990s to early 2000s before declining (Figure 3A). This follows the trend in striped bass biomass over this period. In contrast, the EwE-Full model showed a gradual increase over the entire time-series. The magnitude of M2 estimates varied across models, with the SPM S-H and MSSCAA models estimating the highest M2, followed by the EwE-Full model, and then the EwE-MICE model. Overall, M2 made up a small component of total natural mortality, even for the EwE-Full model (Figure 3B). Total natural mortality showed relatively little trend across all models over the last 30 years. Estimates of M were more variable for the MSSCAA model than for the EwE models, and all three ERP models estimated a higher M than was used as input for the single-species model. The estimates of r from the SPM TVr model showed an inverse pattern to the M2 estimates from the intermediate complexity models, with a decline in productivity from the late 1980s through the early 2000s and then an increase, although not to the levels at the beginning of the time series in the early 1960s (Figure 4).
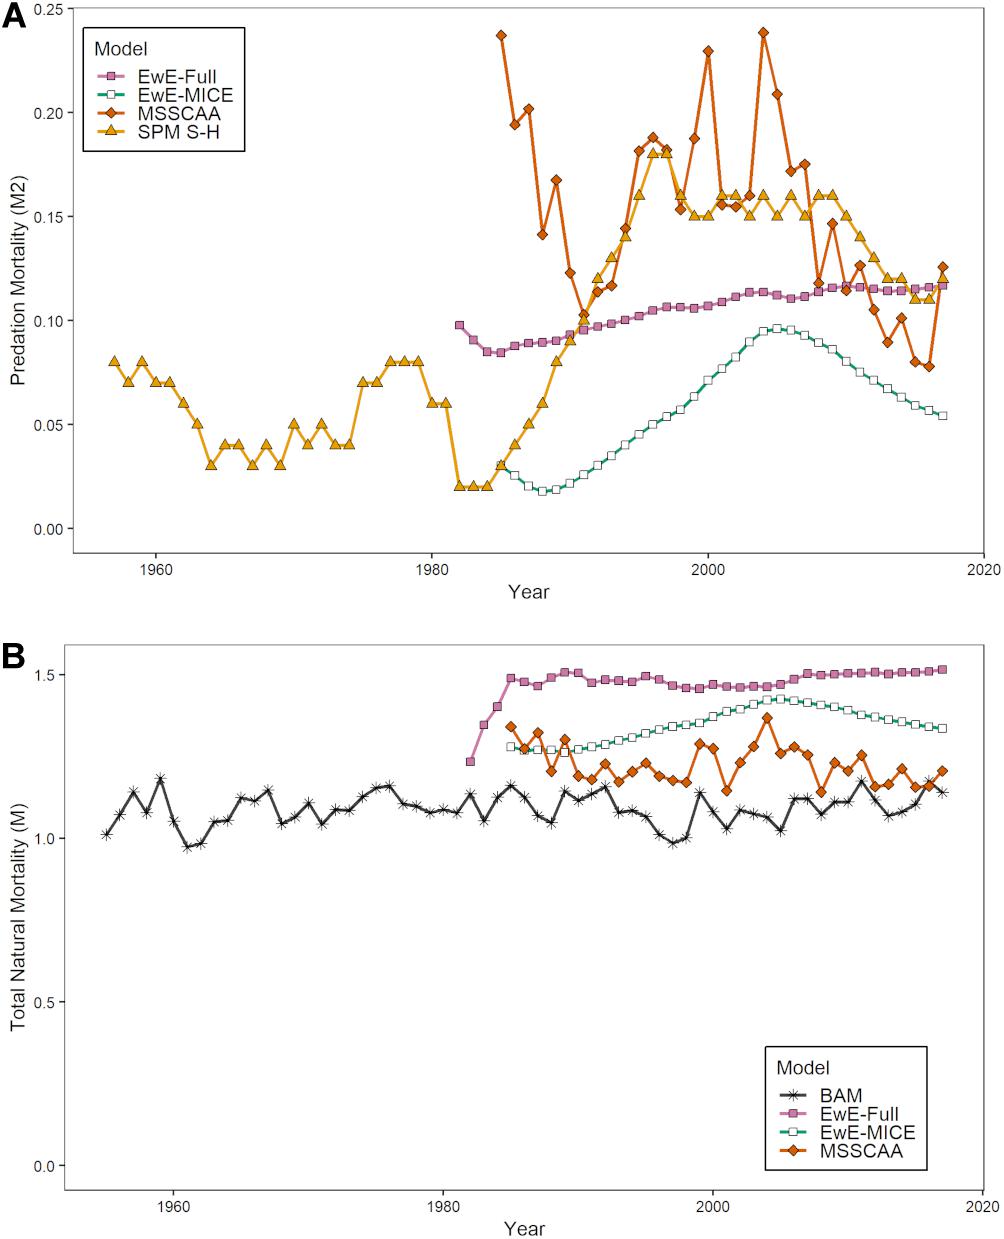
Figure 3. Estimates of biomass-weighted predation mortalityM2 (A) and total natural mortality, M (B) for age-1+ Atlantic menhaden from the ERP models. (B) Includes the biomass-weighted average M for age-1+ Atlantic menhaden used in the single-species assessment.
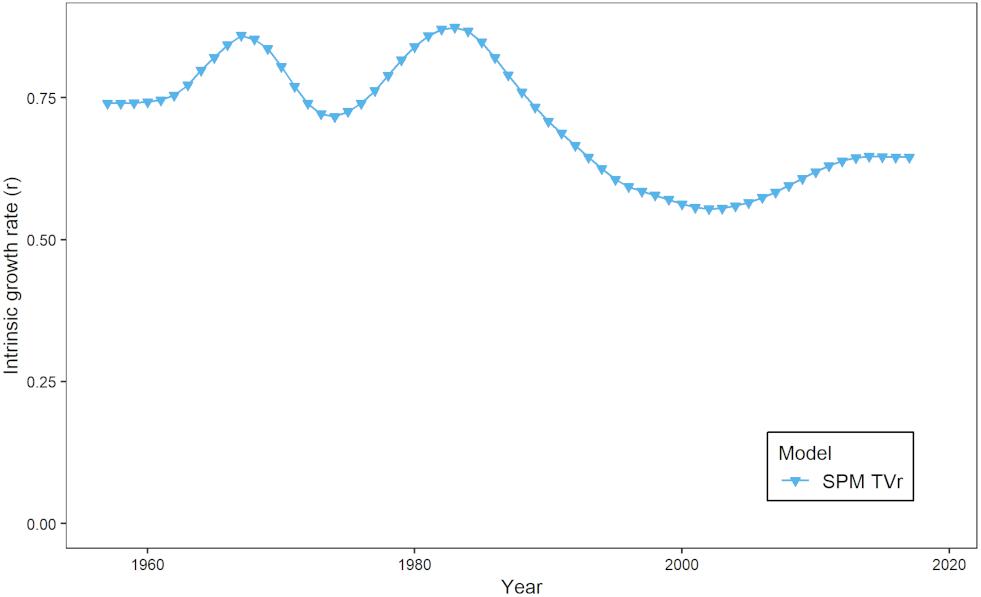
Figure 4. Time-varying intrinsic growth rate, r, from the SPM TVr model.
Estimates of MSY or MSY-proxy reference points from each model are shown in Table 2. Direct comparisons of these estimates are of limited utility, due to differences in model structure (e.g., whether the models used instantaneous annual F rates or catch divided by biomass as the overfishing metric) and the slight differences in scale across models. Comparisons of stock status determinations are more informative, and stock status determinations were also similar across models (Table 2). The single-species assessment determined that the stock was not overfished and overfishing was not occurring in 2017 relative to the single-species reference points (SEDAR, 2020a). The SPM TVr model found that although productivity was lower in recent years than it was at the beginning of the time-series, declining removals brought the exploitation rate under the UMSY threshold in 2017, indicating that Atlantic menhaden were not experiencing overfishing. Biomass was also above the BMSY target in 2017, indicating the stock was not overfished. Similarly, the SPM S-H model found that Atlantic menhaden were not overfished and were not experiencing overfishing in 2017. The MSSCAA model indicated that Atlantic menhaden biomass would increase if fished under 2017 F. The EwE estimates of F in 2017 were lower than the EwE estimates of FMSY the for all age stanzas, indicating overfishing was not occurring in those models.
Qualitative Comparisons of Model Attributes
The most substantial difference among models was their ability to address management objectives and performance metrics (Table 5). The SPM TVr was able to identify changes in productivity over time and adjust the sustainable exploitation rate to take those changes into account. However, the model did not attribute changes in productivity to predation or any other specific cause, and therefore could not be used to evaluate trade-offs between Atlantic menhaden harvest and ecosystem services. The SPM S-H attributed changes in productivity to predation and could provide reference points that allowed for sustainable Atlantic menhaden harvest under different striped bass population levels. However, it could not directly capture the consequences of Atlantic menhaden harvest to the predator populations. External proxy metrics of predator condition relative to modeled consumption could indicate Atlantic menhaden’s influence on striped bass. Condition was not routinely estimated for striped bass, but annual weights-at-age (standard inputs to the catch at age model) could be used as a proxy for condition, although this may be a coarse indicator of condition since fasting striped bass replace lipids with water in a linear fashion (Jacobs et al., 2013). Similarly, the current configuration of the MSSCAA model lacked bottom–up feedback. While it was capable of incorporating changes in productivity due to both predation mortality and variability in recruitment, it could not capture the effects of changes in Atlantic menhaden harvest on the predators as currently formulated.
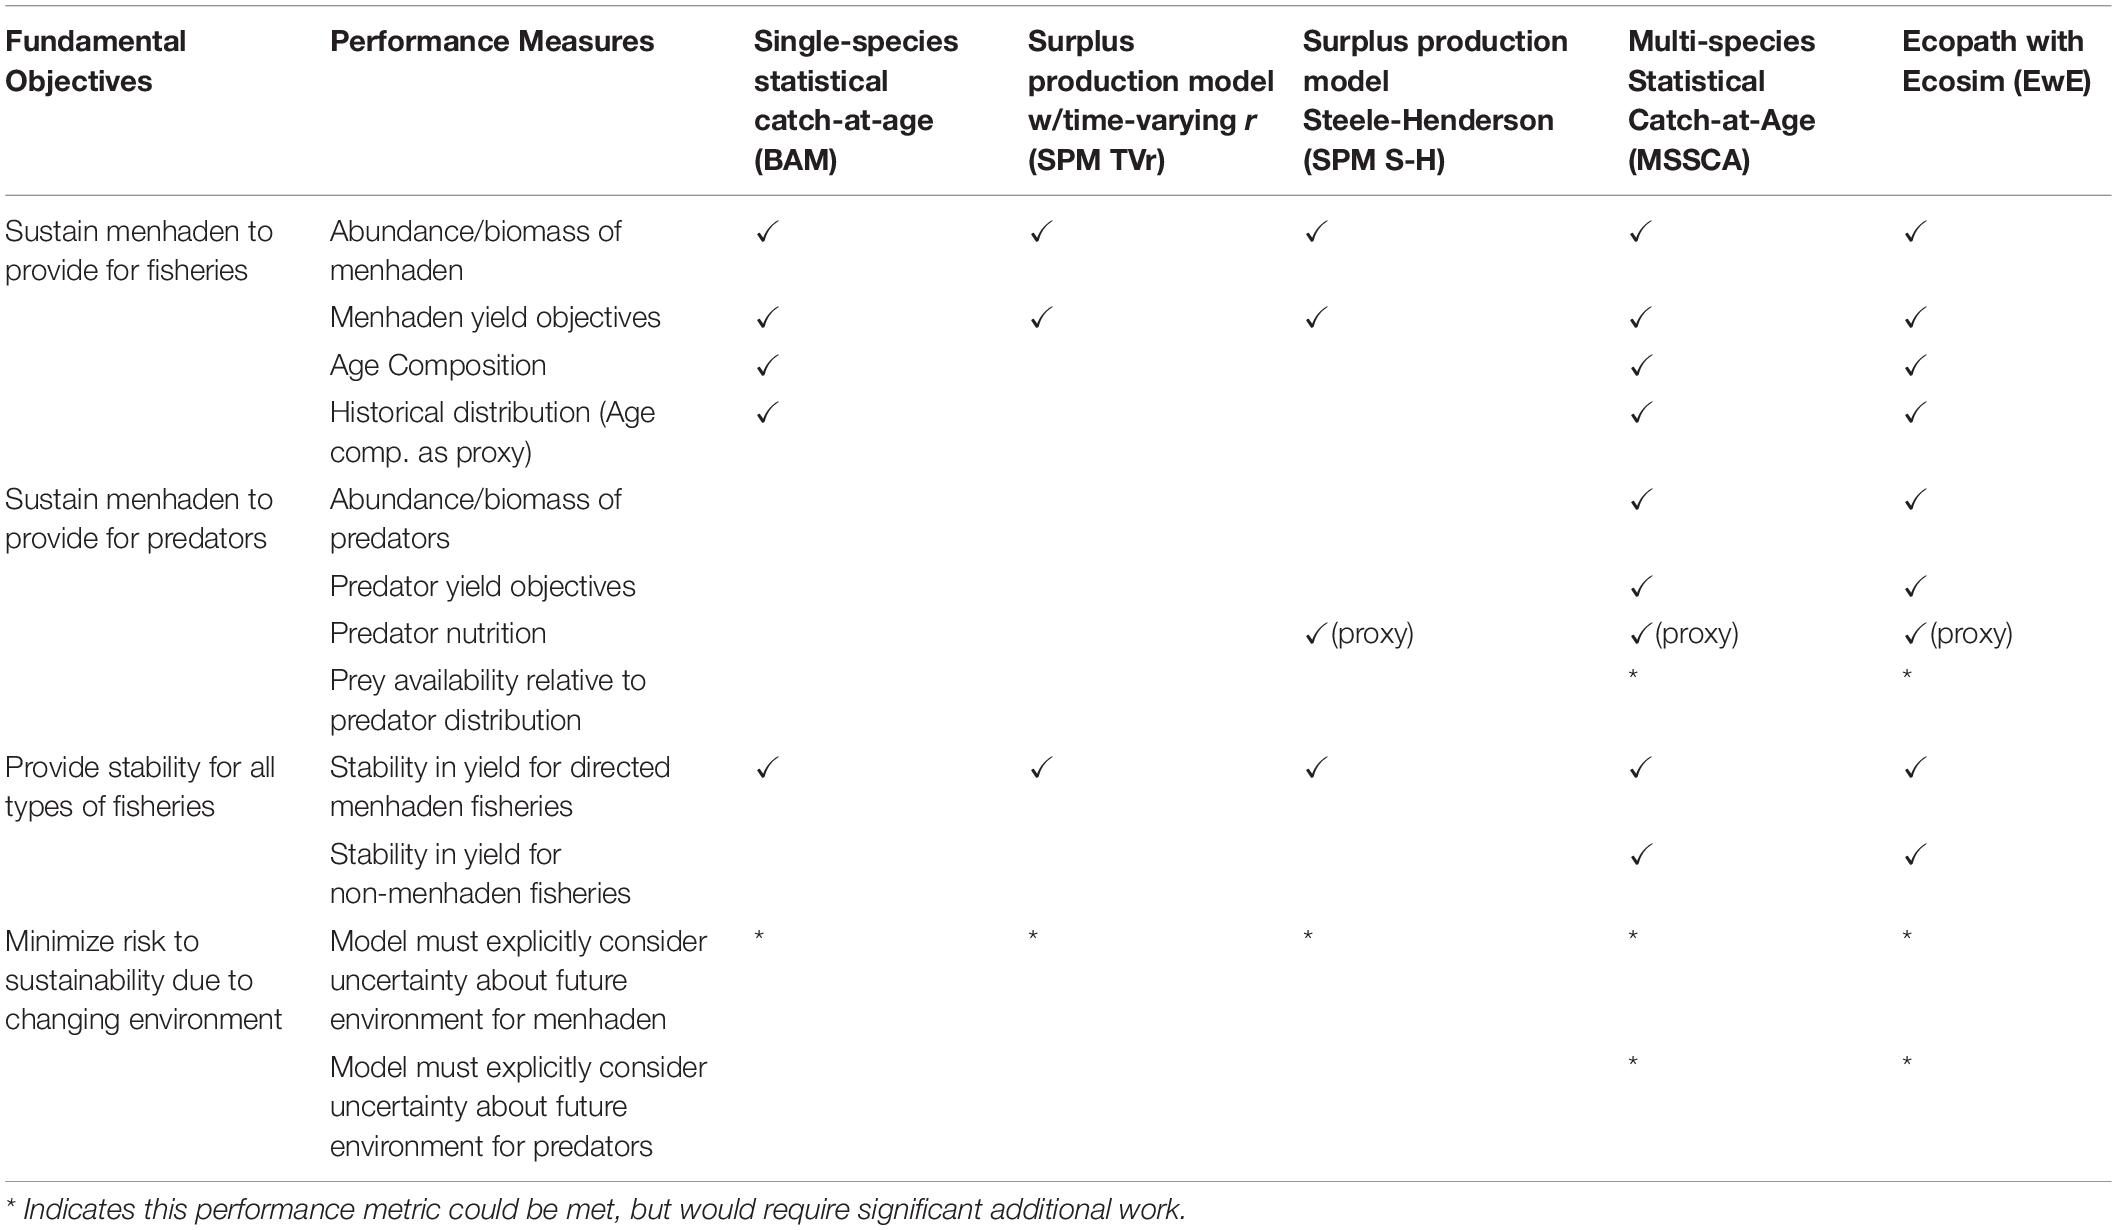
Table 5. Fundamental ecosystem management objectives and their performance measures for Atlantic menhaden, and which ones each model is capable of meeting.
The EwE models were the only models that included both the top–down effects of predation on Atlantic menhaden and the bottom–up effects of Atlantic menhaden population levels on predators necessary to evaluate the trade-offs between Atlantic menhaden harvest and predator biomass. Comparing the performance of the EwE-Full model and the EwE-MICE model indicated that the reduced predator set of the EwE-MICE model was not missing other predators that had a stronger negative response to Atlantic menhaden harvest (Figure 5). Both EwE models indicated that striped bass were the most sensitive finfish predator; that is, increases in fishing pressure on Atlantic menhaden resulted in larger declines in biomass for striped bass than for the other key ecosystem species (Figure 5). The EwE-Full model indicated nearshore piscivorous birds were as sensitive as striped bass to Atlantic menhaden harvest rates, while other predators not included in the EwE-MICE model such as seabirds and demersal piscivores were less sensitive and more similar to bluefish and spiny dogfish in their response to Atlantic menhaden harvest rates (Figure 5). Harvest scenarios that did not cause declines in the biomass of predators included in the EwE-MICE model would be expected to have similar effects for other predators that were only included in the EwE-Full model over the range of scenarios examined here.
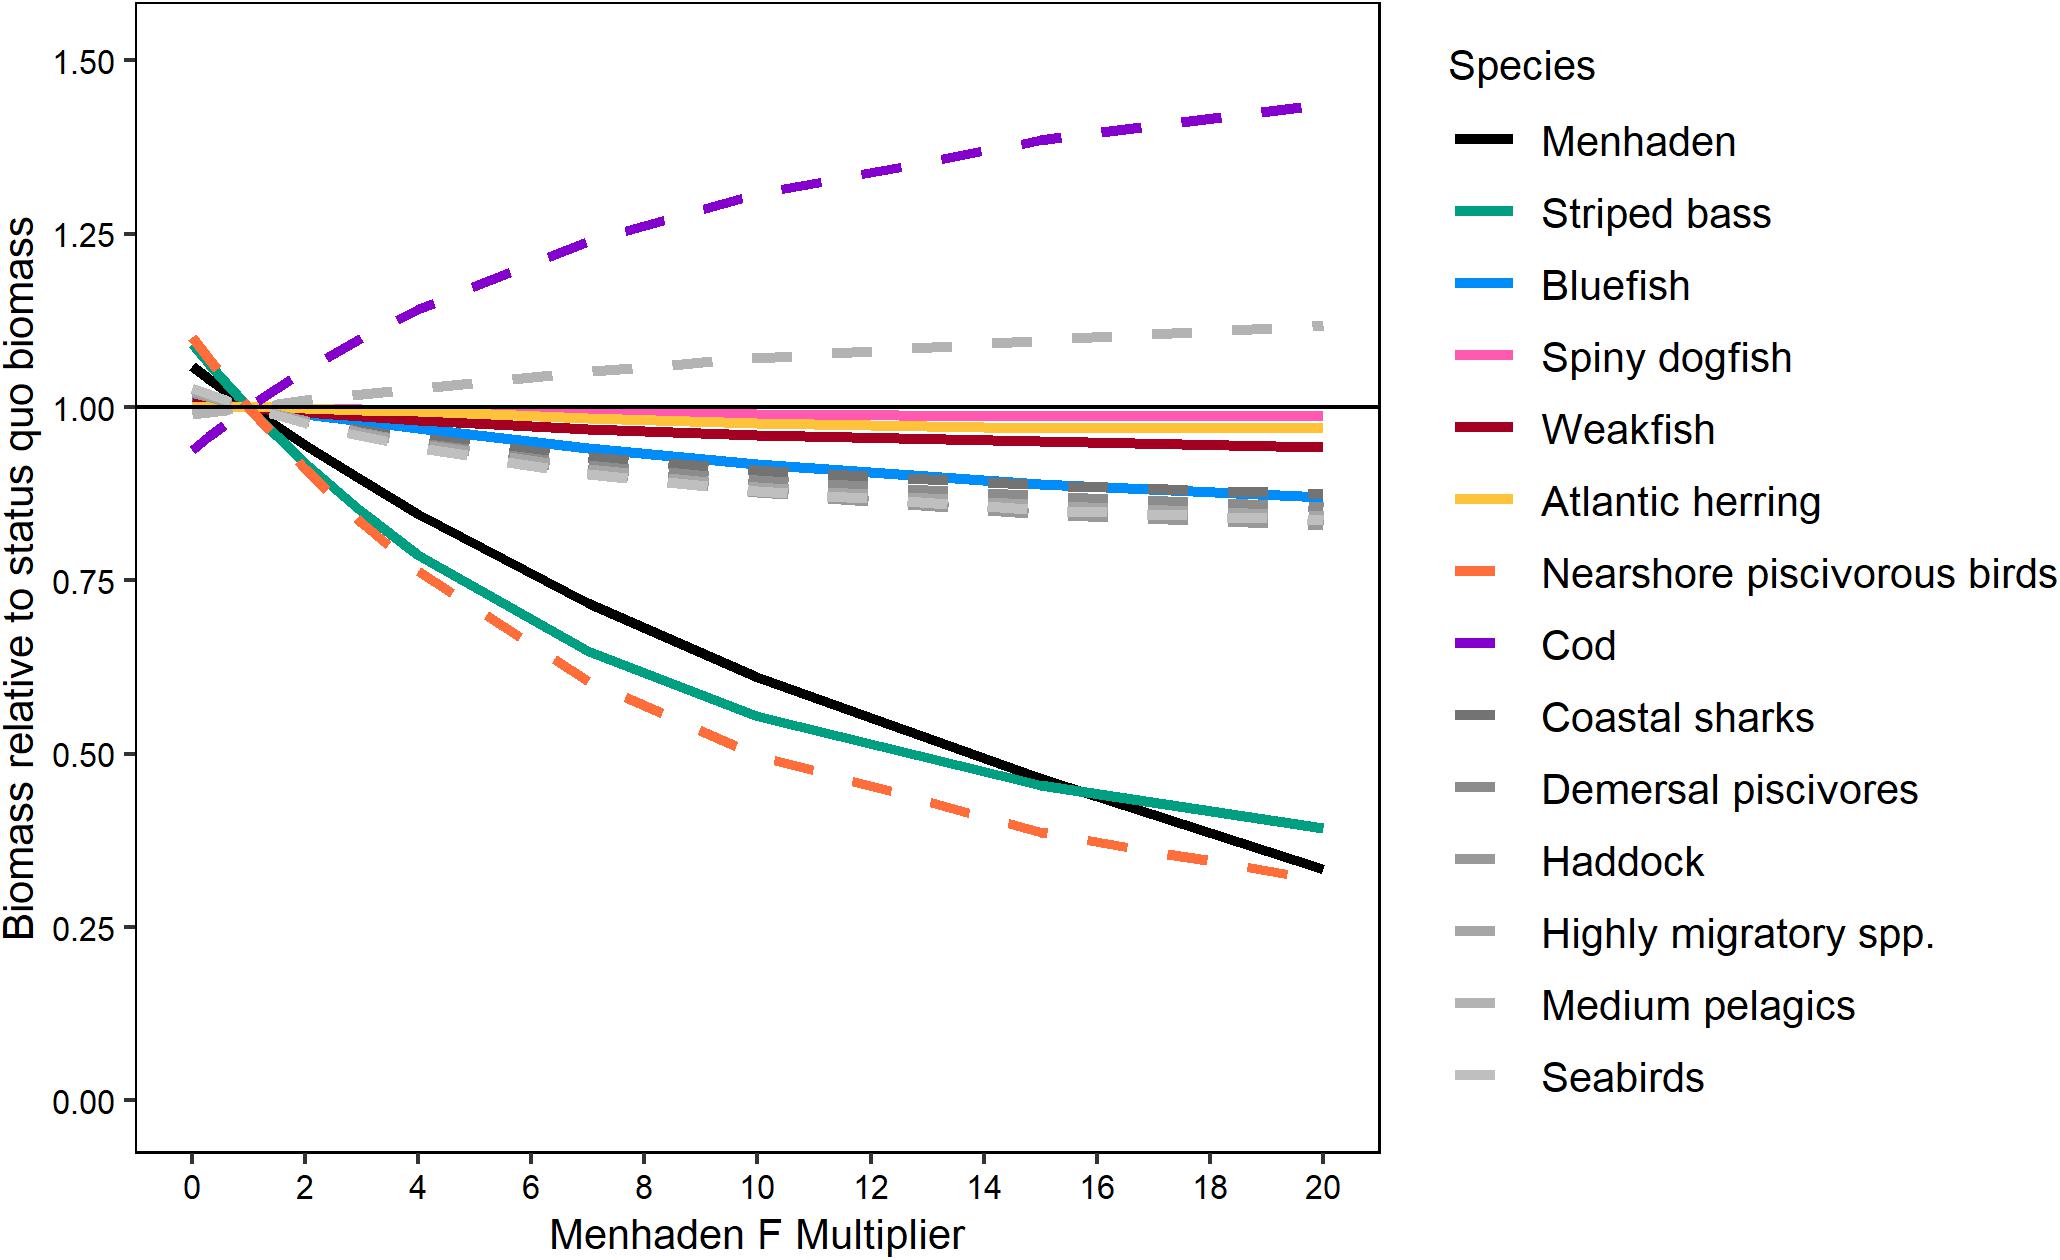
Figure 5. Effect of Atlantic menhaden fishing on equilibrium biomass of select trophic groups (projected for 50 years) relative to their equilibrium biomass under status quo Atlantic menhaden fishing rates from the EwE-Full model. ERP focal species were fished at their target F while Atlantic menhaden F rates were scaled from 0 to 20 times the 2017 values using an F-multiplier. Lines are plotted for all ERP focal species and other trophic groups with non-negligible (>15%) responses. Solid lines indicate species included in both the EwE-Full and EwE-MICE models, while dashed lines indicate species or species groups included only in the EwE-Full model.
The EwE-MICE was deemed to have a more desirable level of complexity for transparent and quantitative examination of trade-offs, but only for the key ecosystem species included. The EwE-Full model would allow that trade-off evaluation for a wider range of predator species, but it had a much greater need for data inputs (e.g., from other assessments and for data poor species) and made more assumptions in describing the ecosystem. These complexities and uncertainties made it more challenging to provide timely advice for management decisions compared to the EwE-MICE model.
Discussion
This multi-model approach, along with the emphasis on standardizing input data and key species across models, allowed us to explore the effects of model structure and assumptions on results and select a model that provided the most relevant information to managers. To the extent practicable, the ERP models used the same time-series of total removals, life history parameters, and indices of abundance as the Atlantic menhaden single-species model, and in some cases (i.e., the EwE models) used output from the single-species model directly. All of the models estimated similar overall trends in Atlantic menhaden population size and exploitation rates over the last 30 years, showing a generally increasing trend in biomass and a decreasing trend in exploitation rate. The magnitude of population size and exploitation rate estimates were also consistent with the estimates from the single-species assessment.
Despite similarities in population size and exploitation rates, the models differed in the level of interannual variability they estimated. These differences were due not to model complexity but to the specifics of model structure. The MSSCAA model, which was as complex as the EwE-MICE model, showed the same level of interannual variability as the single-species model, while the surplus production models, which were the least complex, showed lower interannual variability, more like the EwE models. The difference was in how each model handled recruitment: the statistical catch-at-age models estimated recruitment as annual deviations from mean recruitment and fit to observed indices of young-of-year abundance, while the EwE and surplus production models estimated recruitment or new production as a function of adult biomass. As a result, both the single and MSSCAA models were able to track the observed variability in recruitment, which translated to variability in age-1+ biomass, while the EwE and the surplus production models produced smoother trends. The SPM TVr does allow for some deviations from that relationship with the annual estimates of r, but the level of interannual variability is constrained somewhat by the CV on the random walk function. Sensitivity runs with the EwE-MICE including model-estimated primary production anomalies and configurations with recruitment deviations showed more interannual variability in recruitment. However, neither were incorporated into the final model due to lack of known primary production anomalies over the entire time period for which to compare the estimated values and unstable dynamics resulting from their inclusion. More fully capturing internanual variability in recruitment is a high priority moving forward with model development. This is an important source of model uncertainty for the surplus production and EwE models, and highlights the value of the multi-model approach.
The BAM and the surplus production models showed different trends in exploitation rate at the beginning of the time series, which was likely due to differences in the input data: the surplus production model used a fishery-dependent CPUE index as well as the fishery-independent indices, while the base run of the BAM did not. When the fishery-dependent CPUE index was included in the BAM as a sensitivity run, the trend in estimates of exploitation rate in the early part of the time-series was similar to the surplus production models, peaking at the same time as the surplus production models and declining consistently through the rest of the time-series, with a smaller peak in the 1980s (SEDAR, 2020b). The estimates of the exploitation rate from this run of the BAM were still lower than the estimates from the surplus production models. These models also produced terminal stock status similar to the single-species assessment, which determined that Atlantic menhaden were not overfished and were not experiencing overfishing in 2017.
The models did vary in their estimates of the magnitude and trend of M2, due to the differences in model structure. The models with limited predators (SPM S-H, MSSCAA, and EwE-MICE) showed a trend that followed the biomass trajectory of striped bass, the major predator in those models. The EwE-Full model with a larger predator field showed a flatter trend because changes in striped bass biomass and consumption were offset by changes in the biomass and consumption of other predators like summer flounder and haddock, and also because total M2 in the EwE-Full model was less influenced by changes in the contribution of M2 from a single predator than the intermediate complexity models. Estimates of r from the SPM TVr model were consistent with these estimates, showing lower productivity when M2 peaked in the intermediate complexity models and then an increase in productivity when M2 declined. The SPM TVr model does not attribute changes in productivity to any one mechanism, and changes in r may be related to factors other than predation mortality, such as changes in recruitment.
The ERP models provided insight into the sources of mortality for Atlantic menhaden and how M has changed over time relative to the static value assumed by the single-species model. However, the estimates of M from the ERP models are not independent of the BAM. The estimate of total M from the MSSCAA was the sum of the estimated M2 from modeled predators and a specified M0, the rate of natural mortality from all other sources; M0 was based in part on the empirical estimate of M (Liljestrand et al., 2019) used in the single-species model. The EwE models used Z, F, and biomass from the single-species model as input, and a total M (from Z-F) was parsed into M2 from modeled predators and residual unexplained mortality for the starting year. These inputs from the single-species model were sensitive to the M used in the BAM. Overall, estimates of total M from the ERP models showed more of a trend over time than the time-constant M used in the BAM, but less variability than the estimates of M2.
Mortality from modeled predators was a relatively small component of total natural mortality across all models that had an explicit M term. This is not unreasonable for the intermediate complexity models (i.e., the MSSCAA and the EwE-MICE models), which only modeled four predators, but it is unexpected for the full EwE model, which includes a much larger set of predators. In EwE parlance, this implies that Atlantic menhaden have a low ecotrophic efficiency (EE), meaning that there was a high proportion of “unexplained” mortality in the EwE models that was not caused by the modeled predators. This is likely due to a combination of potential factors which require further research and investigation. First, Atlantic menhaden are subject to significant non-predation mortality events such as hypoxia-driven fish kills and disease (Ahrenholz, 1991; Smith, 1999), which could explain the high estimates of unexplained mortality in the EwE models. Second, limitations and uncertainty in the diet data and predator biomass data may result in underestimates of M2. For example, diet composition estimates can vary significantly across studies and monitoring programs even for species with high sample sizes (e.g., Walter et al., 2003). Sensitivity runs conducted with the EwE-Full model where the diet composition data was set to the maximum observed value for all species resulted in higher estimates of M2, a lower, but still substantial, proportion of unexplained M, and higher EE (SEDAR, 2020b). In addition, there is considerable uncertainty around the estimates of M2 from the EwE-Full model due to high uncertainty in biomass levels and trends of modeled predators such as birds and marine mammals. Third, the model does not fully capture the spatiotemporal dynamics of Atlantic menhaden-predator interactions, potentially missing periods or locations of particularly intensive predation. Fourth, the estimates of mortality (M or Z) and biomass obtained from the BAM for the starting year of the EwE models could be biased high. The M used in the BAM was higher than what was used for other similar forage species (e.g., Atlantic herring, Northeast Fisheries Science Center [NEFSC], 2019), but was empirically derived and based on a comprehensive tagging program (Liljestrand et al., 2019). However, if the M used in the BAM was biased high, it would result in excess unexplained mortality for Atlantic menhaden in the EwE models (and a lower EE value), and it could have led to biomass estimates that were too high or improperly scaled to the rest of the ecosystem. Future modeling and sensitivity analyses should explore how the low proportion of explained M in the models and the resulting ERPs are influenced by model structure, deficiencies in predator diet or biomass data, overly high estimates of Atlantic menhaden M or biomass from the BAM model, and naturally occurring non-predation mortality events.
The true utility of these kinds of ecological models is not the ability to recreate a single-species assessment, but their ability to put those dynamics into an ecosystem context and develop ecological reference points that take into account Atlantic menhaden’s role as a forage fish. The values of these reference points are determined by the ecosystem conditions (e.g., productivity levels, predator consumption levels) under which they are calculated; of the four key ecosystem predators identified here, only spiny dogfish were not considered overfished in 2017. Therefore, levels of Atlantic menhaden removals that would be sustainable under 2017 conditions may not be sustainable when all predators are rebuilt, or during the process of rebuilding. While the models were able to calculate reference point values for different levels of productivity or predation, there is no one “right” answer or reference point value; the sustainable level of Atlantic menhaden fishing mortality depends on the management objectives for the predators and the ecosystem, which is ultimately a decision for managers.
Therefore, it is important that any models used to develop ERPs can explore the scenarios that managers are interested in and can address the performance metrics needed to ensure their policies are attaining their objectives on a timeline that works with their process. This will increase both the utility of the model and buy-in from managers. ASMFC identified two competing objectives for ecosystem management of Atlantic menhaden: sustaining Atlantic menhaden to provide for directed fisheries and sustaining Atlantic menhaden to provide for predators and predator fisheries. To provide the most useful information to management, the selected ERP model needed to allow managers and stakeholders to evaluate the trade-offs between Atlantic menhaden harvest and ecosystem goals. The EwE models were the only models that explicitly modeled both top–down effects of predation on Atlantic menhaden and bottom–up effects of Atlantic menhaden population levels on predators. The EwE-MICE has the desired level of complexity needed for transparent and quantitative examination of trade-offs, and comparisons with the EwE-Full model indicated that the EwE-MICE model was not missing more sensitive predators. However, it could be biased by the overall low predation mortality rates associated with fewer modeled predators and its ability to evaluate the effects of menhaden harvest on other managed or protected species is limited by the choice of species included. For this first set of ERPs, we recommended using the EwE-MICE model to develop ERPs for Atlantic menhaden as it represented the best balance between model complexity, data availability, and the ability to provide the information managers have deemed important. Because the EwE-MICE model did not fully capture the dynamics of variable recruitment, year-class strength, and changes in fleet selectivities, we recommended pairing the ERPs developed from the EwE-MICE model with the single-species assessment model to provide short-term tactical advice on harvest strategies. Since the EwE-MICE model relies on output from the BAM, maintaining and updating the single-species model to provide short-term tactical advice does not represent an additional burden to the assessment process. In this framework, managers would use the EwE-MICE model to explore the trade-offs between Atlantic menhaden harvest and predator biomass in order to select target and threshold F reference points that meet their ecosystem management objectives under long term equilibrium conditions. The single-species assessment model, which better captures short-term variability in recruitment, F, and biomass, would then be used to assess whether overfishing of Atlantic menhaden was occurring and to calculate a total allowable catch that would achieve the ERP F target. For more detail on the EwE-MICE trade-off analysis and integration with the single-species model, see Chagaris et al. (2020). This approach of integrating an ecosystem model into the single-species assessment and management framework was also recently implemented in the Irish Sea (Bentley et al., 2020); see Howell et al. (2020) for a more detailed discussion of the merits of this approach.
ASMFC’s ecosystem management objectives for Atlantic menhaden are not unique (Garcia, 2009). However, other regions or management bodies may prioritize those objectives differently. For ASMFC, understanding both the top–down and bottom–up dynamics of the predator-prey interactions in this ecosystem was important, which made the EwE-MICE combined with the single-species model the best tool given management goals. In a system where understanding the top–down effects of predation mortality and the effects of environmentally driven recruitment are the highest priority, and bottom–up effects are less important, the MSSCAA model might be the best tool, due to its ability to track observed variation in recruitment and the fact that it does not rely on stock assessment output from other species. The multi-model approach, combined with an understanding of managers’ objectives, allows researchers to select the best tool for a particular set of management objectives, instead of trying to make a pre-chosen tool fit the situation.
We focused on selecting a single model through this process, rather than a model averaging approach (Millar et al., 2015), because we wanted a tool that would efficiently explore managers’ questions about ecosystem scenarios and trade-offs, as well as one that could be updated with new data regularly. Maintaining multiple models with different input streams through a model-averaging approach would make this tool less efficient in practice. As managers become more comfortable with this ecosystem approach and can focus on key questions or scenarios, the model-averaging approach could become more tractable in the future.
The formal development of ASMFC’s ecosystem management objectives allowed us to identify high priority areas of future research. ASMFC identified the spatial distribution of Atlantic menhaden relative to fisheries and predator distributions as a performance metric to be assessed. None of the models included spatial or seasonal dynamics and exploring that should be a high priority for the next iteration of these models. While the surplus production models, MSSCAA, and BAM would require additional work to implement spatial dynamics, EwE already has a spatially explicit component, Ecospace, which represents the mixing of biomass among spatial cells while also including trophic interaction processes (Walters et al., 2010). The habitat capacity model in Ecospace (Christensen et al., 2014) is a flexible way to relate to species to their habitat to generate realistic species distribution patterns. Data are a limiting factor here as well; the available diet data indicated there were seasonal and regional differences in diet composition along the Atlantic coast, but the current data, as well as the understanding of the key ERP species’ migration patterns, are not sufficient to support modeling at a finer scale at this time.
In addition, ASMFC identified minimizing risk due to a changing environment as an ecosystem management objective. None of the models, as they were configured, were able to explicitly account for this. The BAM, the SPM TVr, and the MSSCAA models could account for environmentally driven variation in productivity or recruitment in the observed data without identifying an explicit mechanism by estimating the intrinsic growth rate or recruitment annually. However, without a mechanism, these models had no way to predict changes in productivity or recruitment into the future under different environmental conditions. Similarly, EwE has the flexibility to address environmental change through the incorporation of primary productivity forcing functions or downscaled ocean climate models like those from the Intergovernmental Panel on Climate Change, among others, in the Ecospace spatial-temporal framework. Species’ abundances, spatial distributions, and ecosystem indices could then be simulated and management options evaluated under various climate change scenarios. Modeling of environmental factors in this study was limited by the poor understanding of the relationship between specific environmental drivers and recruitment and mortality across all predator and prey species. Advancements are being made on this front (e.g., Munch and Conover, 2000; North and Houde, 2003; Buchheister et al., 2016), but a better understanding of these dynamics would allow the models examined here to more explicitly incorporate uncertainty about future environmental conditions into projections and reference points for both predators and prey. The approach of using the single-species model to provide tactical advice avoids some of the uncertainty in setting catch limits based on the smoothed biomass trends in the EwE models, which do not incorporate recruitment variability. However, it does not fully resolve the question of whether the EwE models overstate the importance of fishing as a driver when environmental factors are not considered in the stock-recruitment relationship (Hilborn et al., 2017), making this an important area of future model development even without the consideration of climate change.
The process used to develop ERPs for Atlantic menhaden provides an example of tailoring multi-species and ecosystem models to address ecosystem management objectives. These models represent advances in incorporating quantitative ecosystem considerations into a traditional single species management framework, but further work on the modeling and data collection are still needed. Collie and Gislason (2001) recommended that biological reference points for forage species be considered moving targets that should be redefined every 5–10 years to match the prevailing level of predation; uncertainty about the impacts of environmental changes on future recruitment and mortality strengthen that recommendation. This adaptive approach aligns with the ASMFC management process, in which Atlantic menhaden undergo an assessment update every 3 years and a benchmark assessment every 6 years. The assessment update adds new years of data but uses the existing model(s), while the benchmark assessment allows for more substantial changes to existing models or development of new models; a similar approach is used by other regions and management bodies. This process of continued improvements can allow for incorporation of environmental drivers, spatio-temporal dynamics, and other advances in our scientific understanding, as well as improving data collection to support those developments, while still providing usable short term scientific advice for management. The multi-model approach described here should be continued through the long term benchmark process to reassess the trade-offs between model complexity, data requirements, and management objectives as these improvements are made. This adaptive, incremental process will improve the quality of management advice provided as our understanding improves and ecosystem management objectives evolve.
Data Availability Statement
The raw data supporting the conclusions of this article will be made available by the authors, without undue reservation.
Author Contributions
KD conducted the model comparisons and wrote the first draft of this report. MC chaired the ERP WG and contributed to the development of all models. AS was the lead modeler for the BAM. AB was the lead modeler for the EwE-Full model. DC was the lead modeler for the EwE-MICE model. GN was the lead modeler for the SPM TVr model. JM was the lead modeler for the MSSCAA. JU was the lead modeler for the SPM S-H model. All the authors contributed to manuscript revision, read, and approved the submitted version.
Funding
This work was supported by National Oceanic and Atmospheric Administration Award No. NA15NMF4740069. Development of the SPM TVr model was supported by Maryland Sea Grant Award under award no. NA4OAR4170090 from the National Oceanic and Atmospheric Administration. Development of the EwE-Full and EwE-MICE models were supported by two Lenfest Ocean Program Grants Nos. 00025536 and 00032187.
Conflict of Interest
The authors declare that the research was conducted in the absence of any commercial or financial relationships that could be construed as a potential conflict of interest.
Acknowledgments
This manuscript has been released as part of the Atlantic Menhaden Ecological Reference Point Stock Assessment Report (SEDAR, 2020b) at http://sedarweb.org/sedar-69 and http://www.asmfc.org/uploads/file/5e4c4064AtlMenhadenERPAssmt_PeerReviewReports.pdf. We thank the members of the ASMFC Menhaden Technical Committee and the ERP WG for the data they provided and their contributions to the discussions around model development. This is contribution number 5954 of the University of Maryland Center for Environmental Science.
Footnotes
References
Ahrenholz, D. W. (1991). Population biology and life history of the North American menhadens, Brevoortia spp. Mar. Fish. Rev. 53, 3–19.
Ahrens, R. N. M., Walters, C. J., and Christensen, V. (2012). Foraging arena theory. Fish Fish. 13, 41–59. doi: 10.1111/j.1467-2979.2011.00432.x
Atlantic States Marine Fisheries Commission [ASMFC] (1981). Fishery Management Plan for Atlantic Menhaden. Arlington, VA: ASMFC, 146.
Atlantic States Marine Fisheries Commission [ASMFC] (2004). Atlantic Menhaden Stock Assessment Report for Peer Review. Atlantic States Marine Fisheries Commission, Stock Assessment Report No. 04-01 (Supplement). Arlington, VA: ASMFC, 145.
Atlantic States Marine Fisheries Commission [ASMFC] (2011). Stock Assessment Report No. 10-02 of the Atlantic States Marine Fisheries Commission Atlantic Menhaden Stock Assessment and Review Panel Reports. Arlington, VA: ASMFC, 326.
Atlantic States Marine Fisheries Commission [ASMFC] (2012). Amendment 2 to the Interstate Fishery Management Plan for Atlantic Menhaden. Arlington, VA: ASMFC, 114.
Atlantic States Marine Fisheries Commission [ASMFC] (2015). Ecosystem Management Objectives Workshop Report. 10 p. Available online at: http://www.asmfc.org/files/Meetings/2015AnnualMeeting/AtlMenhadenBoard.pdf (accessed July 26, 2019).
Atlantic States Marine Fisheries Commission [ASMFC] (2019). Weakfish Stock Assessment Update Report. Arlington, VA: Atlantic States Marine Fisheries Commission.
Audzijonyte, A., Pethybridge, H., Porobic, J., Gorton, R., Kaplan, I., and Fulton, E. A. (2019). AtlAntis: a spatially explicit end-to-end marine ecosystem model with dynamically integrated physics, ecology and socio-economic modules. Methods Ecol. Evol. 10, 1814–1819. doi: 10.1111/2041-210x.13272
Bentley, J. W., Serpetti, N., Fox, C. J., Heymans, J. J., and Reid, D. G. (2020). Retrospective analysis of the influence of environmental drivers on commercial stocks and fishing opportunities in the Irish Sea. Fisheries Oceanogr. 29, 415–435. doi: 10.1111/fog.12486
Buchheister, A., Miller, T. J., and Houde, E. D. (2017a). Evaluating ecosystem-based reference points for Atlantic menhaden. Mar. Coast. Fish. 9, 457–478. doi: 10.1080/19425120.2017.1360420
Buchheister, A., Miller, T. J., Houde, E. D., and Loewensteiner, D. A. (2017b). Technical Documentation of the Northwest Atlantic Continental Shelf (NWACS) Ecosystem Model. Report to the Lenfest Ocean Program, Washington, D.C. University of Maryland Center for Environmental Sciences Report TS-694-17. Available online at: http://hjort.cbl.umces.edu/NWACS/TS_694_17_NWACS_Model_Documentation.pdf (accessed May 26, 2018).
Buchheister, A., Miller, T. J., Houde, E. D., Secor, D. H., and Latour, R. J. (2016). Spatial and temporal dynamics of Atlantic menhaden (Brevoortia tyrannus) recruitment in the Northwest Atlantic Ocean. ICES J. Mar. Sci. 73, 1147–1159. doi: 10.1093/icesjms/fsv260
Butler, C. M., Rudershausen, P. J., and Buckel, J. A. (2010). Feeding ecology of Atlantic bluefin tuna (Thunnus thynnus) in North Carolina: diet, daily ration, and consumption of Atlantic menhaden (Brevoortia tyrannus). Fish. Bull. 108, 56–69.
Chagaris, D., Drew, K., Schueller, A. M., Cieri, M., Brito, J., and Buchheister, A. (2020). Ecological reference points for Atlantic menhaden using an ecosystem model of intermediate complexity. Front. Mar. Sci. 7:606417. doi: 10.3389/fmars.2020.606417
Christensen, V., Coll, M., Steenbeek, J., Buszowski, J., Chagaris, D., and Walters, C. J. (2014). Representing variable habitat quality in a spatial food web model. Ecosystems 17, 1397–1412. doi: 10.1007/s10021-014-9803-3
Christensen, V., and Walters, C. J. (2004). Ecopath with Ecosim: methods, capabilities and limitations. Ecol. Model. 172, 109–139. doi: 10.1016/j.ecolmodel.2003.09.003
Collie, J. S., Botsford, L. W., Hastings, A., Kaplan, I. C., Largier, J. L., Livingston, P. A., et al. (2016). Ecosystem models for fisheries management: finding the sweet spot. Fish Fish. 17, 101–125. doi: 10.1111/faf.12093
Collie, J. S., and Gislason, H. (2001). Biological reference points for fish stocks in a multispecies context. Can. J. Fish. Aquat. Sci. 58, 2167–2176. doi: 10.1139/f01-158
Collie, J. S., and Spencer, P. D. (1993). “Management strategies for fish populations subject to long-term environmental variability and depensatory predation,” in Proceedings of the International Symposium on Management Strategies for Exploited Fish Populations, eds G. Kruse, D. M. Eggers, R. J. Marasco, C. Pautzke, and T. J. Quinn (Fairbanks: Alaska Sea Grant), 629–664.
Collie, J. S., and Spencer, P. D. (1995). Modeling predator-prey dynamics in a fluctuating environment. Oceanogr. Lit. Rev. 12:1130.
Curti, K. L., Collie, J. S., Legault, C. M., and Link, J. S. (2013). Evaluating the performance of a multispecies statistical catch-at-age model. Can. J. Fish. Aquat. Sci. 70, 470–484. doi: 10.1139/cjfas-2012-0229
Essington, T. E., and Plagányi, ÉE. (2014). Pitfalls and guidelines for “recycling” models for ecosystem-based fisheries management: evaluating model suitability for forage fish fisheries. ICES J. Mar. Sci. 71, 118–127. doi: 10.1093/icesjms/fst047
Fulton, E. A., Smith, A. D., and Johnson, C. R. (2004). Biogeochemical marine ecosystem models I: IGBEM—a model of marine bay ecosystems. Ecol. Model. 174, 267–307. doi: 10.1016/j.ecolmodel.2003.09.027
Gannon, D. P., and Waples, D. M. (2004). Diets of coastal bottlenose dolphins from the US mid-Atlantic coast differ by habitat. Mar. Mamm. Sci. 20, 527–545. doi: 10.1111/j.1748-7692.2004.tb01177.x
Garcia, S. M. (2009). “Governance, science and society. The ecosystem approach to fisheries,” in Handbook of Marine Fisheries Conservation and Management, eds Q. R. Grafton, R. Hilborn, D. Squires, M. Tait, and M. Williams (London: Oxford University Press), 87–98.
Garrison, L. P., Link, J. S., Kilduff, D. P., Cieri, M. D., Muffley, B., Vaughan, O., et al. (2010). An expansion of the MSVPA approach for quantifying predator-prey interactions in exploited fish communities. ICES J. Mar. Sci. 67, 856–870. doi: 10.1093/icesjms/fsq005
Glass, K. A., and Watts, B. D. (2009). Osprey diet composition and quality in high- and low-salinity areas of lower Chesapeake Bay. J. Raptor Res. 43, 27–36. doi: 10.3356/jrr-08-22.1
Helgason, T., and Gislason, H. (1979). VPA-analysis with special interaction due to predation. ICES C.M. G:52:10.
Hilborn, R., Amoroso, R. O., Bogazzi, E., Jensen, O. P., Parma, A. M., Szuwalski, C., et al. (2017). When does fishing forage species affect their predators? Fish. Res. 191, 211–221. doi: 10.1016/j.fishres.2017.01.008
Hilborn, R., and Walters, C. J. (1992). Quantitative Fisheries Stock Assessment: Choice, Dynamics and Uncertainty. Berlin: Springer Science & Business Media. doi: 10.1007/978-1-4615-3598-0
Howell, D., Schueller, A. M., Bentley, J. W., Buchheister, A., Chagaris, D., Cieri, M., et al. (2020). Combining ecosystem and single-species modelling to provide ecosystem-based fisheries management advice within current management systems. Front. Mar. Sci. 7:607831. doi: 10.3389/fmars.2020.607831
Jacobs, J. M., Harrell, R. M., Uphoff, J., Townsend, H., and Hartman, K. (2013). Biological reference points for the nutritional status of Chesapeake Bay Striped Bass. N. Am. J. Fish. Manag. 33, 468–481.
Kinzey, D., and Punt, A. E. (2009). Multispecies and single-species models of fish population dynamics: comparing parameter estimates. Nat. Resour. Model. 22, 67–104. doi: 10.1111/j.1939-7445.2008.00030.x
Lewy, P., and Vinther, M. (2004). A Stochastic Age-Length-Structured Multispecies Model Applied to North Sea Stocks. ICES CM 2004/FF:19. Available online at: https://www.ices.dk/sites/pub/CM%20Doccuments/2004/FF/FF2004.pdf (accessed July 15, 2020).
Liljestrand, E. M., Wilberg, M. J., and Schueller, A. M. (2019). Estimation of movement and mortality of Atlantic menhaden during 1966-1969 using a Bayesian multi-state mark-recovery model. Fish. Res. 210, 204–213. doi: 10.1016/j.fishres.2018.10.015
Link, J. S., and Almeida, F. P. (2000). An Overview and History of the Food Web Dynamics Program of the Northeast Fisheries Science Center, Woods Hole, Massachusetts. Available online at: https://repository.library.noaa.gov/view/noaa/3164/noaa_3164_DS1.pdf (accessed October 11, 2018).
McNamee, J. E. (2018). A Multispecies Statistical Catch-at-Age Model for a Mid-Atlantic Species Complex, Thesis, University of Rhode Island Graduate School of Oceanography, Narragansett, RI.
Mersmann, T. J. (1989). Foraging Ecology of Bald Eagles on the Northern Chesapeake Bay with an Examination of Techniques Used in the Study of Bald Eagle Food Habits. Master’s thesis, Virginia Polytechnic Institute and State University, Blacksburg, VA.
Millar, C. P., Jardim, E., Scott, F., Osio, G. C., Mosqueira, I., and Alzorriz, N. (2015). Model averaging to streamline the stock assessment process. ICES J. Mar. Sci. 72, 93–98. doi: 10.1093/icesjms/fsu043
Moustahfid, H., Tyrrell, M. C., and Link, J. S. (2009). Accounting explicitly for predation mortality in surplus production models: an application to longfin inshore squid. N. Am. J. Fish. Manag. 29, 1555–1566. doi: 10.1577/m08-221.1
Munch, S. B., and Conover, D. O. (2000). Recruitment dynamics of bluefish (Pomatomus saltatrix) from Cape Hatteras to Cape Cod, 1973-1995. ICES J. Mar. Sci. 57, 393–402. doi: 10.1006/jmsc.1999.0636
Nesslage, G. M., and Wilberg, M. J. (2019). A performance evaluation of surplus production models with time-varying intrinsic growth in dynamic ecosystems. Can. J. Fish. Aquat. Sci. 76, 2245–2255. doi: 10.1139/cjfas-2018-0292
North, E. W., and Houde, E. D. (2003). Linking ETM physics, zooplankton prey, and fish early-life histories to striped bass Morone saxatilis and white perch M. americana recruitment. Mar. Ecol. Prog. Ser. 260, 219–236. doi: 10.3354/meps260219
Northeast Fisheries Science Center [NEFSC] (2018a). 65th Northeast Regional Stock Assessment Workshop (65th SAW) Assessment Summary Report. 18-08. Woods Hole, MA: NEFSC, 38. doi: 10.25923/vvpm-jy75
Northeast Fisheries Science Center [NEFSC] (2018b). Update on the Status of Spiny Dogfish in 2018 and Projected Harvests at the Fmsy Proxy and Pstar of 40%. Northeast Fisheries Science Center 82 p. Available online at: https://www.mafmc.org/s/2018-Status-Report-for-spiny-dogfish.pdf (accessed May 29, 2019).
Northeast Fisheries Science Center [NEFSC] (2019). 66th Northeast Regional Stock Assessment Workshop (66th SAW) Assessment Summary Report. 19-01. Woods Hole, MA: NEFSC, 40. doi: 10.25923/g6g5-ed18
Northeast Fisheries Science Center [NEFSC] (2020). Operational Assessment of the Black Sea Bass, Scup, Bluefish, and Monkfish Stocks, Updated through 2018. NEFSC Ref Doc 20-01; 160 p. Available online at: http://www.nefsc.noaa.gov/publications (accessed December 8, 2020).
Overholtz, W. J., Jacobson, L. D., and Link, J. S. (2008). An ecosystem approach for assessment advice and biological reference points for the Gulf of Maine-Georges Bank Atlantic herring complex. N. Am. J. Fish. Manag. 28, 247–257. doi: 10.1577/m06-267.1
Pikitch, E., Boersma, P. D., Boyd, I. L., Conover, D. O., Cury, P., Essington, T., et al. (2012). Little Fish, Big Impact: Managing a Crucial Link in Ocean Food Webs. Report. Washington, DC: Lenfest Ocean Program, 108.
Pikitch, E. K., Boersma, P. D., Boyd, I. L., Conover, D. O., Cury, P., Essington, T. E., et al. (2018). The strong connection between forage fish and their predators: a response to Hilborn et al. (2017). Fish. Res. 198, 220–223. doi: 10.1016/j.fishres.2017.07.022
Plagányi, ÉE., Punt, A. E., Hillary, R., Morello, E. B., Thébaud, O., Hutton, T., et al. (2014). Multispecies fisheries management and conservation: tactical applications using models of intermediate complexity. Fish Fish. 15, 1–22. doi: 10.1111/j.1467-2979.2012.00488.x
Pope, J. G. (1979). A modified cohort analysis in which constant natural mortality is replaced by estimates of predation levels. ICES C.M. 1979/H:16:8.
Punt, A. E., MacCall, A. D., Essington, T. E., Francis, T. B., Hurtado-Ferro, F., Johnson, K. F., et al. (2016). Exploring the implications of the harvest control rule for Pacific sardine, accounting for predator dynamics: A MICE model. Eco. Model. 337, 79–95. doi: 10.1016/j.ecolmodel.2016.06.004
Rice, J., and Duplisea, D. (2014). Management of fisheries on forage species: the test-bed for ecosystem approaches to fisheries. ICES J. Mar. Sci. 71, 143–152. doi: 10.1093/icesjms/fst151
SEDAR (2020a). SEDAR 69 - Atlantic Menhaden Benchmark Stock Assessment Report. North Charleston, SC: SEDAR, 691.
SEDAR (2020b). SEDAR 69 - Atlantic Menhaden Ecological Reference Points Stock Assessment Report. North Charleston, SC: SEDAR, 560.
Smith, A. D., Brown, C. J., Bulman, C. M., Fulton, E. A., Johnson, P., Kaplan, I. C., et al. (2011). Impacts of fishing low-trophic level species on marine ecosystems. Science 333, 1147–1150. doi: 10.1126/science.1209395
Smith, J. W. (1999). A large fish kill of Atlantic menhaden, Brevoortia tyrannus, on the North Carolina coast. J. Elisha Mitchell Sci. Soc. 115, 157–163.
Steele, J. H., and Henderson, E. W. (1984). Modeling long-term fluctuations in fish stocks. Science 224, 985–988. doi: 10.1126/science.224.4652.985
Uphoff, J. H. Jr., and Sharov, A. (2018). Striped bass and atlantic menhaden predator-prey dynamics: model choice makes the Difference. Mar. Coast. Fish. 10, 370–385. doi: 10.1002/mcf2.10030
Uphoff, J. R. J. H. (1993). Determining striped bass spawning stock status from the presence or absence of eggs in ichthyoplankton survey data. N. Am. J. Fish. Manag. 13, 645–656. doi: 10.1577/1548-8675(1993)013<0645:dsbsss>2.3.co;2
Uphoff, J. R. J. H. (1997). Use of egg presence-absence to derive probability-based management criteria for upper chesapeake bay striped bass. N. Am. J. Fish. Manag. 17, 663–676. doi: 10.1577/1548-8675(1997)017<0663:uoepat>2.3.co;2
Walter, J. F. III, Overton, A. S., Ferry, K. H., and Mather, M. E. (2003). Atlantic coast feeding habits of striped bass: a synthesis supporting a coast-wide understanding of trophic biology. Fish. Manag. Ecol. 10, 349–360. doi: 10.1046/j.1365-2400.2003.00373.x
Walters, C., Christensen, V., Walters, W., and Rose, K. (2010). Representation of multistanza life histories in Ecospace models for spatial organization of ecosystem trophic interaction patterns. Bull. Mar. Sci. 86, 439–459.
Keywords: ecological modeling, ecosystem-based fisheries management, forage fish management, predator-prey dynamics, Atlantic menhaden, Brevoortia tyrannus
Citation: Drew K, Cieri M, Schueller AM, Buchheister A, Chagaris D, Nesslage G, McNamee JE and Uphoff JH Jr (2021) Balancing Model Complexity, Data Requirements, and Management Objectives in Developing Ecological Reference Points for Atlantic Menhaden. Front. Mar. Sci. 8:608059. doi: 10.3389/fmars.2021.608059
Received: 18 September 2020; Accepted: 13 January 2021;
Published: 03 February 2021.
Edited by:
Johanna Jacomina Heymans, European Marine Board (EMB), BelgiumReviewed by:
Cameron Ainsworth, University of South Florida, United StatesSean Lucey, Northeast Fisheries Science Center (NOAA), United States
Copyright © 2021 Drew, Cieri, Schueller, Buchheister, Chagaris, Nesslage, McNamee and Uphoff. This is an open-access article distributed under the terms of the Creative Commons Attribution License (CC BY). The use, distribution or reproduction in other forums is permitted, provided the original author(s) and the copyright owner(s) are credited and that the original publication in this journal is cited, in accordance with accepted academic practice. No use, distribution or reproduction is permitted which does not comply with these terms.
*Correspondence: Katie Drew, kdrew@asmfc.org