Comparing the Performance of a Remotely Operated Vehicle, a Drop Camera, and a Trawl in Capturing Deep-Sea Epifaunal Abundance and Diversity
 Sarah N. de Mendonça
 Anna Metaxas
- Oceanography Department, Dalhousie University, Halifax, NS, Canada
Deep-sea ecosystems provide services such as food, minerals, and nutrient recycling, yet baseline data on their structure is often lacking. Our limited knowledge of vulnerable deep-sea ecosystems presents a challenge for effective monitoring and mitigation of increasing anthropogenic threats, including destructive fishing and climate change. Using data from two stations differing in total epifaunal abundance and taxonomic composition, we compared the use of imagery collected by two non-invasive tools [remotely operated vehicle (ROV) and drop camera] and data collected with a trawl system, commonly used to quantify epibenthic megafauna in the deep sea. Imagery and trawl data captured different epifaunal patterns, the former being more efficient for capturing epifauna, particularly Pennatulacean recruits. The image-based methods also caused less disturbance, had higher position accuracy, and allow for analyses of spatial structure and species associations; fine-scale distributions could not be elucidated with a trawl. Abundance was greater for some taxa, and diversity accumulated faster with increasing sample size for the drop camera than the ROV at one station. However, there are trade-offs between these tools, including continuous and discrete sampling for the ROV and drop camera, respectively, which can affect follow-up analyses. Our results can be used to inform monitoring frameworks on the use of appropriate sampling tools. We recommend further research into tool sampling biases and biometric relationships to help integrate datasets collected with different tools.
Introduction
Sampling deep-sea ecosystems (at depths >200 m) is extremely challenging because of the absence of ambient light, high pressure and remoteness (Jamieson et al., 2013). Consequently, we have investigated less than 0.0001% of the deep sea (Danovaro et al., 2017b). It is now recognized that deep-sea ecosystems provide provisioning services (e.g., fish and minerals), regulating services (e.g., carbon sequestration), cultural services (e.g., aesthetic), and supporting services (e.g., nutrient recycling) (Folkersen et al., 2018). At the same time, these ecosystems are experiencing increasingly greater anthropogenic impacts, including waste disposal, extractive activities that disturb the seafloor (i.e., fishing, cables/pipelines, mining, oil/gas, acoustics), as well as ocean acidification and climate change (Ramirez-Llodra et al., 2011). Vulnerability to these impacts is enhanced by the generally slow growth, extended longevity, and low recruitment of deep-sea species (Neves et al., 2015; Danovaro et al., 2017b). In addition, deep-sea communities exhibit slow recovery (>10–40 years) from disturbance (Huvenne et al., 2016; Bennecke and Metaxas, 2017; Baco et al., 2019; Simon-Lledó et al., 2019).
Epifaunal communities in the deep sea have been sampled in part with tools which are lowered to the seafloor and collect physical samples, such as trawls, corers and epibenthic sleds (Jamieson et al., 2013). A widely used trawl system includes a net towed along the seafloor, adapted from coastal commercial fishing techniques. Trawls are regularly used for commercial fishing (Hall-Spencer et al., 2002), as well as fish stock assessment (Clark, 1979). Often, trawl data are used to determine patterns in distribution and biomass of megafaunal communities (Kenchington et al., 2011, 2014, 2016a,b; Moritz et al., 2013; Gullage et al., 2017; Murillo et al., 2020).
However, some megabenthos (e.g., sponges, alcyonarians, and gorgonians) and fish, collected through either targeted sampling or as bycatch, may not be well represented in trawl surveys because of their flexibility, size, or behavior (Walsh, 1992; Wassenberg et al., 2002; Auster et al., 2011; McIntyre et al., 2015; Pacunski et al., 2016). For example, corals and sponges may be light and flexible enough to pass through the net or heavy enough to fall through the net (Auster et al., 2011). Sea pens anchor in the sediment (Williams, 1999; Williams and Alderslade, 2011) and some species (e.g., Pennatula rubra, Pennatula aculeata, Virgularia mirabilis, and Protoptilum carpenteri) can contract and withdraw into the sediment (Langton et al., 1990; Kenchington et al., 2011; Ambroso et al., 2013; Chimienti et al., 2018a).
Relatively less invasive tools such as remotely operated vehicles (ROVs), autonomous underwater vehicles (AUVs), drop cameras, towed cameras, camera sleds, rovers and baited cameras, have been used to collect imagery data. ROVs generally hover above or make minimal contact with the seafloor and can maintain a relatively constant speed and height above the bottom while sampling. ROVs are non-destructive, allow for habitat associations and behavior analyses, are suitable in complex/high relief habitats and have high maneuverability (Sward et al., 2019). Recent direct comparisons suggested that ROVs captured a higher abundance of sea pens than trawls (Chimienti et al., 2018b, 2019). Other imaging systems are also less destructive than research trawls. Unlike ROVs, AUVs are not tethered to a ship, and can run imagery transects close to the seafloor, possibly producing less noise and discontinuous lighting than ROVs (Morris et al., 2014). Drop cameras are towed behind a ship and hop along the seafloor capturing still images, only when stationary and in contact with the seafloor. Towed cameras are tethered and towed by a ship, often maintaining a target height above the seafloor without making contact (Drazen et al., 2019). Camera sleds and rovers generally make continuous contact with the seafloor, with sleds being towed by a ship and rovers being autonomous. Baited cameras are deployed as free-falling systems, which rest at a fixed location on the seafloor with an attached bait that attracts fauna (Logan et al., 2017; Drazen et al., 2019). These baited camera systems may capture imagery continuously or at discrete time intervals.
While there is a wealth of literature on individual descriptions and qualitative comparisons of performance for these various deep-sea sampling tools (e.g., Jamieson et al., 2013; Flannery and Przeslawski, 2015; Durden et al., 2016), direct empirical comparisons between the tools and their sampling biases are limited. A few studies have compared quantitatively the megaepifaunal data collected by different tools in a single study area (e.g., abundance, diversity, biomass, size). For example, several studies have compared fish abundance and composition, as well as abundance of select megafauna (e.g., crustaceans, echinoderms, and molluscs) between ROVs or drop cameras and trawls of different sizes (Adams et al., 1995; Nybakken et al., 1998; Kenchington et al., 2011; Ayma et al., 2016; Pacunski et al., 2016; Chimienti et al., 2018b). Other studies have compared abundance and diversity of both megafauna and fish among human-occupied submersibles, camera sleds (analog) and otter trawls (Uzmann et al., 1977) and among AUV, towed cameras, and trawls (Morris et al., 2014). A few studies have focused on comparing diversity, abundance, and size across imaging systems such as AUVs, towed camera systems, or baited cameras (Logan et al., 2017; Schoening et al., 2020).
In this study, we had the opportunity to directly compare the performance of three commonly used tools in quantifying megaepifauna, a ROV (ROPOS), a drop camera (Campod), and a research trawl (Campelen 1800 shrimp trawl) by sampling at the same two locations on the Northwest Atlantic Ocean, in the Laurentian Channel Marine Protected Area (MPA). This opportunity allowed us to: (1) compare the composition of the same benthic assemblages (abundance of the most common morphotaxa and diversity) as quantified using the ROV and the drop camera; and (2) examine differences in image quality and sampling bias, such as catchability, spatial extent, and position accuracy, between the ROV, drop camera, and trawl. We were able to compare tool performance in two locations which differed in megafaunal density, community composition, and environmental characteristics, using a replicated sampling design. Monitoring and research logistics related to operation and maintenance costs, frequency of use and technical specifics are outside of the scope of this study, as those factors change rapidly with evolving technology, are highly variable between tools in the same category, as well as dependent on the research objectives, finances and the specific ecosystem.
Detected differences in species abundance or diversity among tools could imply varying catchabilities. Although many studies have used some of these tools, such empirical (quantitative and qualitative) direct comparisons across all three tools used to characterize the same assemblage have not been made to our knowledge. These types of comparisons can provide insight into the selection of the most appropriate tool(s) for capturing a targeted species or different ecological attributes of interest, thus ensuring high data quality and supporting appropriate data interpretation. Our study can both guide the collection of relevant baseline data and enhance monitoring efforts of deep-sea ecosystems. However, our study also underscores the need for more detailed evaluation of catchability, encompassing other tools, species, ecosystems, and ecological attributes of interest.
Materials and Methods
Study Site
Our sampling areas were in the Laurentian Channel MPA, located in a deep submarine valley off the southwest coast of Newfoundland, Canada (Figure 1), which is ∼ 11,580 km2 (DFO, 2019) and ∼115–490 m deep (Lacharité et al., 2020). We sampled two stations, LC2 and LC5, to capture a range of taxonomic diversity and abundance. A map of biophysical seafloor features classified station LC2 as part of a benthoscape characterized by intermediate depth (200–400 m) with low relief (0.5–1°), very abundant pockmarks (>5 km–2), sparse ice scours (<1 km–2), and mixed sediment with some gravel (Lacharité et al., 2020). Station LC5 was classified as deep (>400 m) with low relief, sparse pockmarks (<1 km–2), abundant ice scours (>2 km–2), and sandy mud with gravel traces. The environmental conditions (bathymetry, pockmarks, ice scours, and slope) were similar within stations as supported by Lacharité et al. (2020) and video observations of the sampled areas. Thus, we assumed that our results could be attributed mostly to how the tools captured the morphotaxa, rather than spatial patterns in environmental variables.
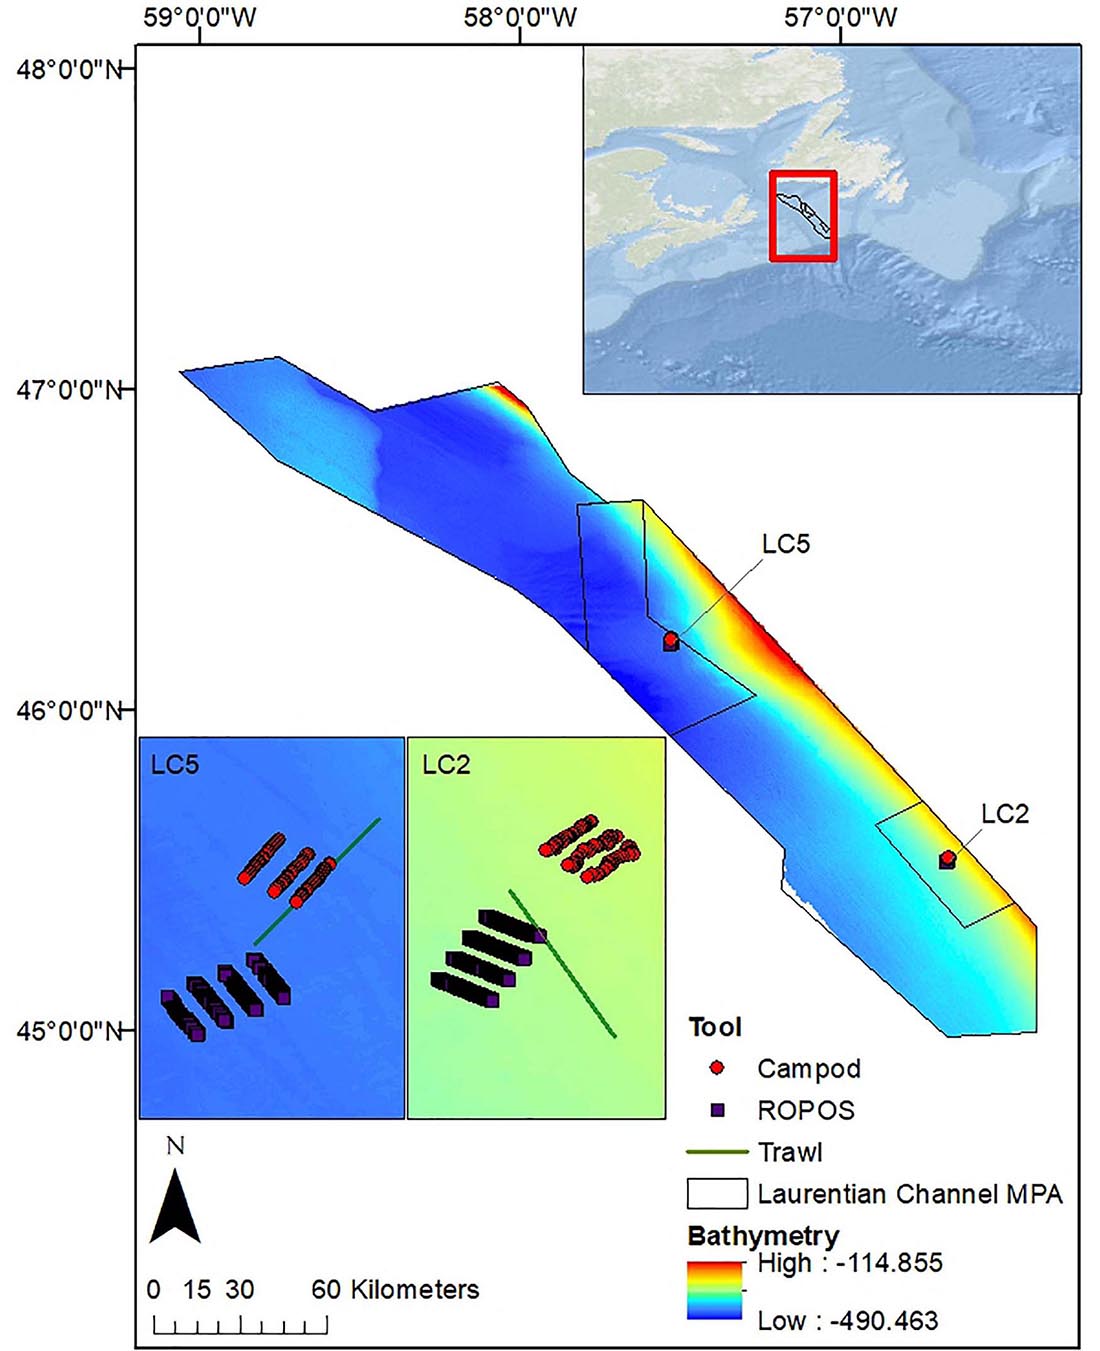
Figure 1. Map of the Laurentian Channel MPA (boundary provided by DFO), in Atlantic Canada off the southwest coast of Newfoundland indicating the locations of the two sampling stations (LC2 and LC5). Shown are 8 400-m ROPOS transects, 3 400-m Campod transects, and trawl set at station LC5 (inset i) and LC2 (inset ii). Esri (2020) for World Ocean Base layer, using coordinate system GCS_WGS_1984. Bathymetry data layer (in meters) is from Lacharité et al. (2020). This MPA is located within a deep submarine valley in the Northwest Atlantic and was designated to protect corals (predominately sea pens), several fish and shark species, as well as leatherback turtles (DFO, 2019).
Imagery
We used two different tools to collect and compare imagery from the two stations. In 2017, we performed 8 400-m parallel transects with the ROV Remotely Operated Platform for Ocean Sciences (ROPOS1). Sampling was based on a systematic cluster design with alternating spatial lags, recommended for capturing spatial patterns in the absence of prior knowledge (Fortin et al., 1989). Transects were spaced at spatial lags of 10 m and groups of two were spaced at 200 m (Figure 2). This design allowed us to combine a large spatial extent with high spatial resolution. We used continuous video collected with a downward-facing Insite Pacific Zeus-Plus HD camera (1,920 × 1,080 pixels) to capture epibenthic fauna and quantify sampling area. The ROV includes 3 × 400 W HMI and 3 × 350 W LED primary light sources, as well as 8 × 150 W LED lights used to fill in shadows near the vehicle and for additional sampling, e.g., using the manipulator arms and attached equipment. Video was stored as a series of MPEG files for easier processing, resulting in 70 video segments at station LC2 and 68 at LC5. Metadata included a real-time comment log, voiceover comments on videos, closed-caption encoding (geo-referencing; using Digital Rapids StreamZHD recorders, Canadian Scientific Submersible Facility, 1995–2020), date, time, latitude, longitude, depth, heading, pitch, roll, forward velocity, starboard velocity, downward velocity, altitude above seafloor, as well as temperature and salinity from a CTD. Specimens, water samples and sediment samples were collected opportunistically.
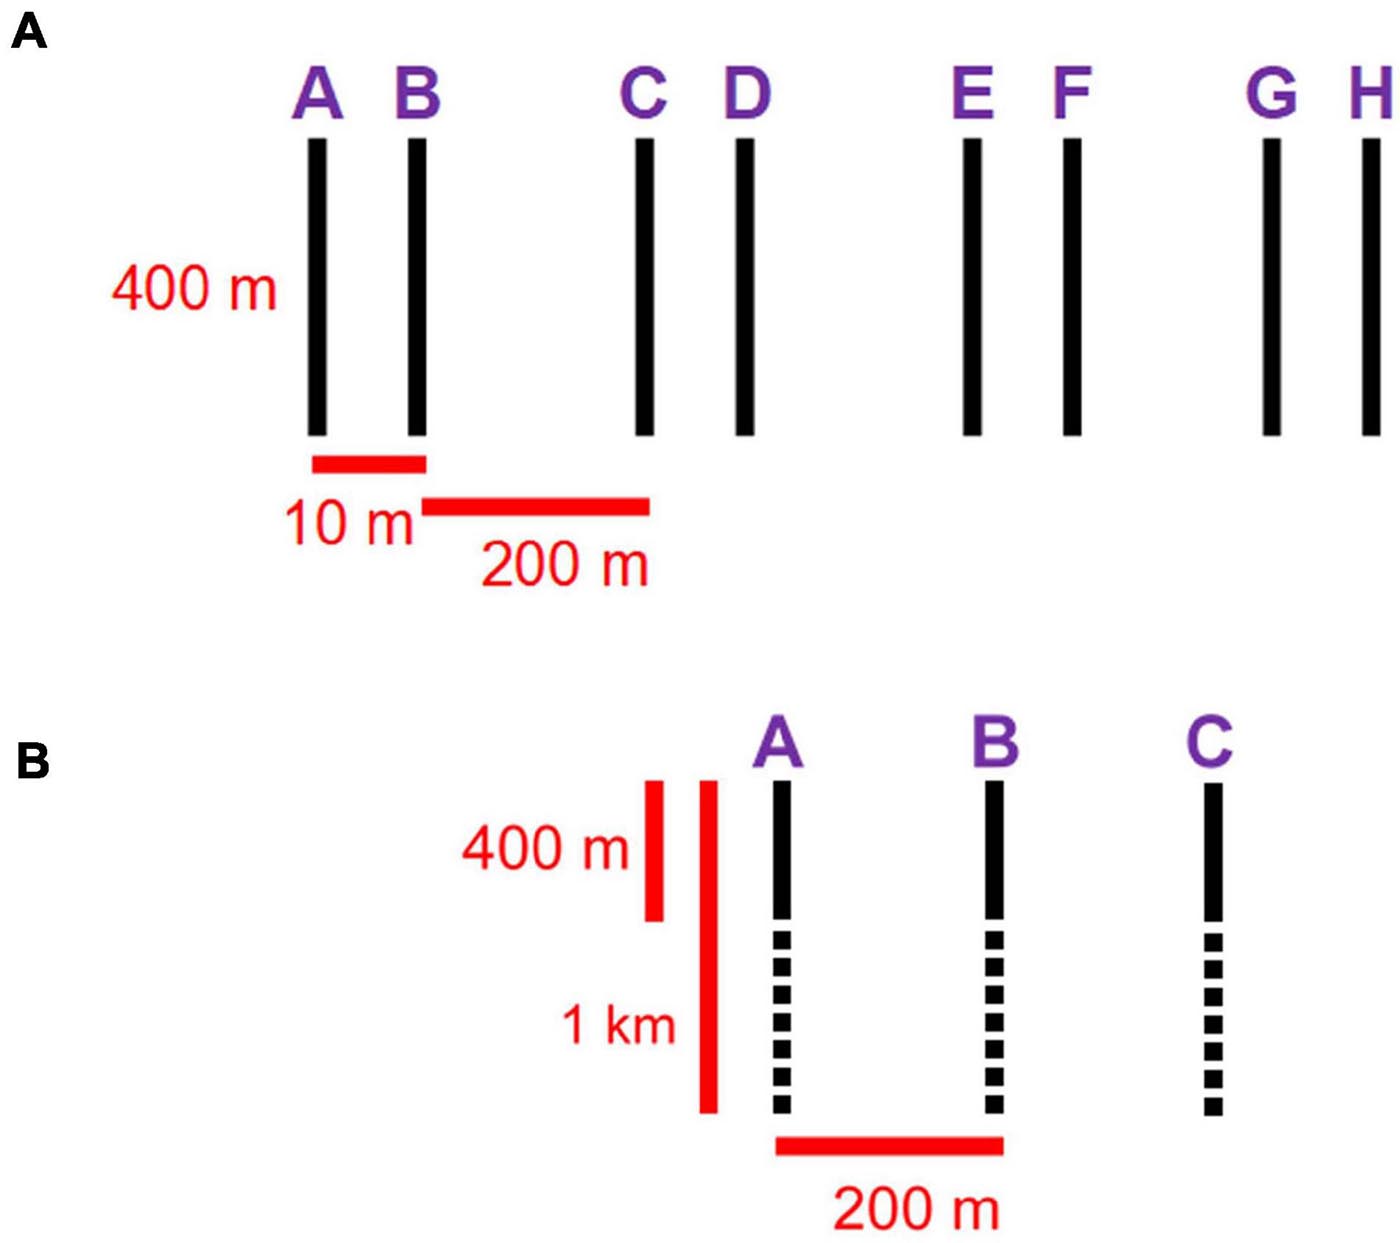
Figure 2. (A) ROPOS sampling design: 8 400-m parallel transects, spaced at spatial lags of 10 m and pairs spaced at 200 m. (B) Campod sampling design: 3 1-km parallel transects spaced at 200 m; 400-m segments (solid back lines) were used for comparisons with ROPOS transects.
In 2018, we collected additional imagery with the drop camera Campod [operated by the Department of Fisheries and Oceans (DFO)—Canada, Bedford Institute of Oceanography]. The sampling design was modified from the one used with ROPOS to 3 1-km parallel transects at ∼200 m spacing because the passive drifting of Campod makes maneuvering difficult. Still images (JPEG) were captured every 10 s, timed to manual hops of the camera along the seafloor, using a downward facing NIKON D810 camera (7,360 × 4,912 pixels). This drop camera system had two Quantum Qflash Model T5D-R light sources, which were operated at full power at 150 W. A total of 2,886 images at station LC2 and 2,202 images at LC5 were captured over the longer transects; however, we only processed images corresponding to a 400-m segment of each transect to make the transect arrays comparable between sampling tools (Figure 2). We used a real-time comment log and other metadata (date, time, latitude, longitude, depth and altitude) were provided by the Campod technical crew after post-processing of the Navnet, CTD, altimeter and USBL systems.
Trawl
Biomass of all caught coral species (sea pens, gorgonians, soft corals, cup corals) was estimated from DFO (Newfoundland and Labrador Region) trawl surveys performed using a Campelen 1800 Shrimp Cosmos Trawl in the 3Ps NAFO region (which included the Laurentian Channel MPA) in 2010 (McCallum and Walsh, 1996). We used data from two tows, 0.9 nautical miles in length (17–18 min at three knots), providing catch weights (kg) for five unique coral records (Duva florida, Funiculina quadrangularis, Halipteris finmarchica, Pennatula cf. aculeata, Sea pen sp.), as well as tow metadata (e.g., date, set, NAFO region, distance, duration, damage, depth, temperature, start/end latitude/longitude, gear type).
The principle of stationarity, that the same ecological processes are assumed to be occurring throughout a given area, can be rendered invalid at increasing distances between points of interest (Dale and Fortin, 2014). To avoid non-stationarity, we limited comparisons to data within a 2-km buffer around each starting point of the ROPOS transects. This encompassed the entire ROPOS and Campod tracks, but only one full trawl track at each station was within the selected 2-km station radius.
Area swept by each trawl set was calculated as tow distance multiplied by wing spread adjusted for the ship used (area = distance×wingspread). Assuming a depth of ∼400 m at the Laurentian Channel, and using the median value for wing spread of 16.5 m on CCGS A. Needler (Walsh et al., 2009), we estimated the area per trawl as 27,502 m2. We estimated biomass in g m–2 by dividing biomass (kg tow–1) by the estimated area swept by the trawl, after weight conversion to grams [biomass(g m−2)×biomass(kg)×1,000area−1]. Similarly to biomass (kg), the estimated biomass per unit area (g m–2) assumes corals were evenly distributed across the trawled area.
Imagery Analysis
Using the Video and Track Replay feature in the software application Ocean Floor Observation Protocol (OFOP 3.3.8c, Huetten and Greinert, 2008; Scientific Abyss Mapping Services, 2009), position data from ROPOS was synced to video with timestamps, and images were extracted at a target distance interval of 1.5 m. We confirmed the start/end of each transect in ArcGIS (Version 10.5 Esri, 2016) and excluded off-transect or overlapping images. We aimed to analyze every 4th image. Images were included in the analysis if the total area was less than 6 m2 as estimated by the scaling lasers spaced 10 cm apart, and if image clarity permitted an unobstructed view of the seafloor (see Figure 3 for example imagery). Obscured sections were cropped out to permit taxonomic identification (i.e., removing suspended particles, pelagic animals near the camera, sediment plumes, or sections of low light). Images were deemed unsuitable if they required >50% cropping. Overall, this protocol resulted in ∼ 6-m spacing between images; when images were deemed unsuitable the next sequentially suitable image at a distance of 1.5–6 m was analyzed instead. We filtered out 50% of the analyzed ROPOS images to reduce sampling size, making it comparable to Campod (which generated fewer images), which resulted in a final spacing of ∼12 m between images for ROPOS.
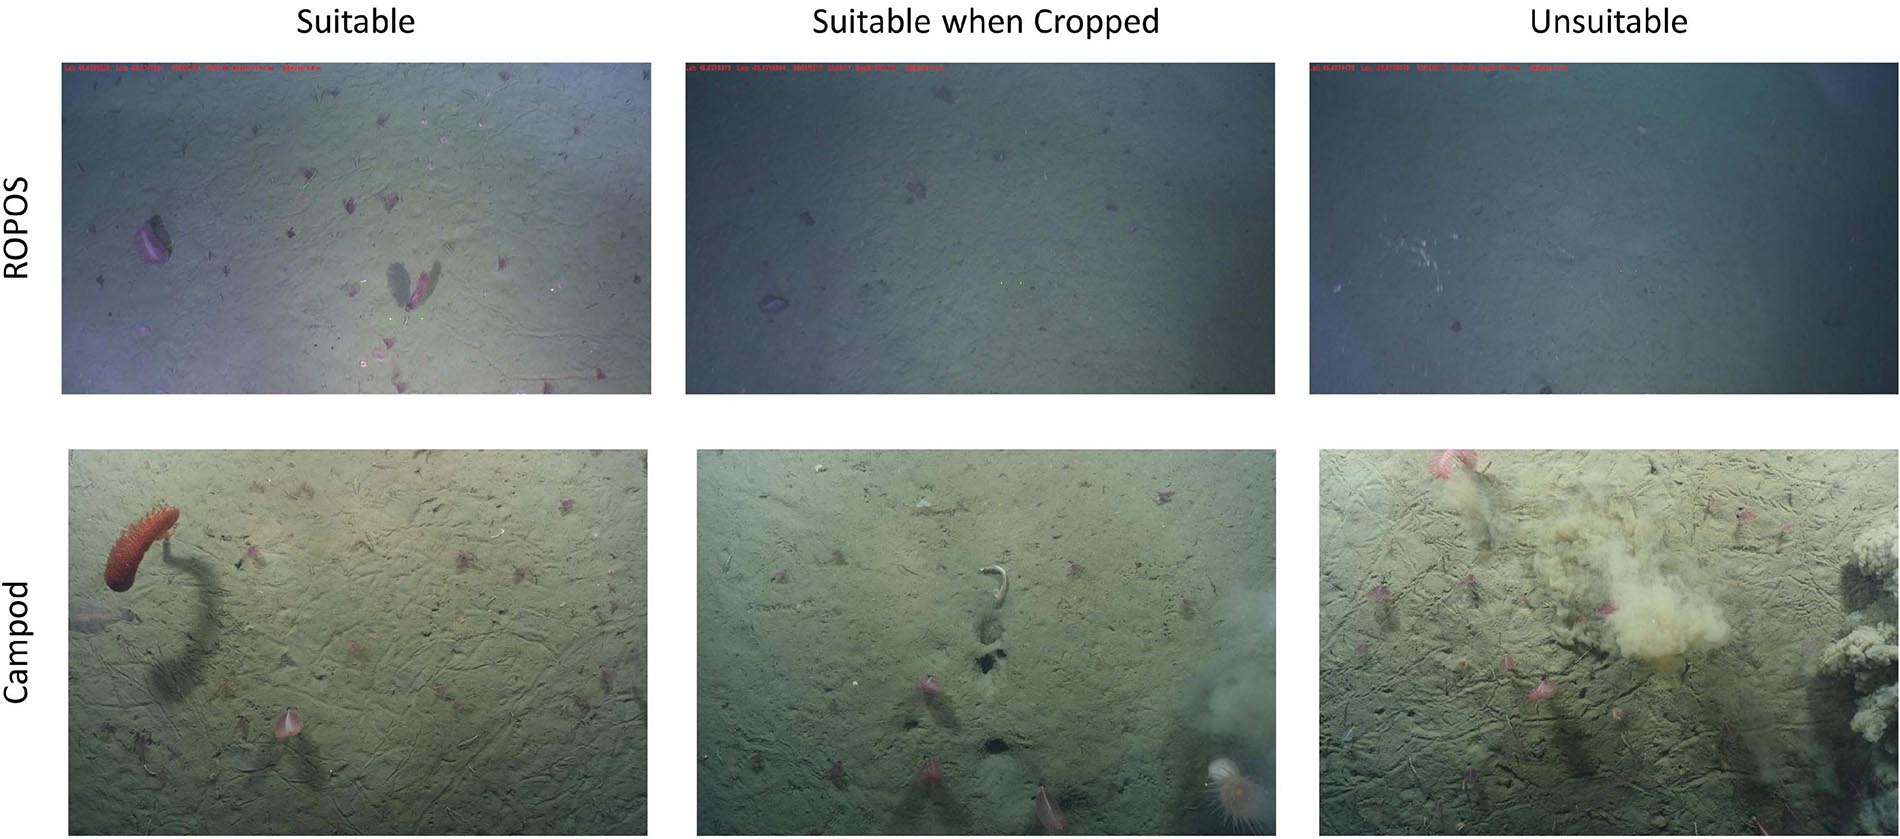
Figure 3. Examples of imagery collected by the ROV ROPOS (first row) and the drop camera Campod (second row), deemed suitable (left) or unsuitable (right) for analysis (e.g., poor illumination, blurry edges, sediment plumes). If less than 50% of an image was unsuitable and the scaling lasers were visible (middle), then those images were cropped before enumerating fauna and calculating the area analyzed.
Due to the passive drifting of Campod, we used a target time interval of 10 s rather than a target distance between images, which, assuming a speed of one knot (0.514 m s–1), corresponds to ∼ 5-m spacing. However, this was likely an overestimate of distance due to slower drifting of the camera than expected. To maintain a standard image analysis protocol (using ImageJ software; Abràmoff et al., 2004) consistent to that used for the ROPOS analysis, we analyzed every 4th image for a 400-m section of each transect (spacing ∼40 s, ∼20 m) using the same protocols as for ROPOS.
All megafauna >2 cm in the largest dimension were enumerated and identified to morphospecies using a reference guide based on World Register of Marine Species (WoRMS). If morphospecies were too numerous to count or colonial, e.g., holothuroidea and encrusting sponges, they were recorded as percent cover instead of counts. We used the point method to estimate percent cover (209 points for ROPOS and 204 for Campod, respectively, due to differences in image resolution), including only the number of points that fell onto the cropped area of the image.
Data Analysis
We aimed to avoid spatial overlap of sampling among tools and thus minimizing potential confounding effects. However, some overlap may have occurred between the trawl track and Campod (CON46) at LC5, and ROPOS (2A) at LC2 (Figure 1). Since these tools have different levels of position accuracy it was difficult to interpret distances between their tracks, in particular for the trawl, as latitudes and longitudes reflect the vessel position rather than having positional equipment directly mounted on the trawl itself.
For each transect of each tool, we evaluated image quality based on a number of criteria: total images captured, number of suitable images selected for analysis, total area covered by images and total area of images deemed unsuitable for analysis. For analysis, we selected the most abundant taxonomic groups (see Figure 4), determined as those recorded on at least 11 of 22 total transects in the study. The less abundant taxa were either aggregated to form groups of higher abundance (e.g., Actiniaria (O.) spp.) or excluded (i.e., too few counts) from the analyses.
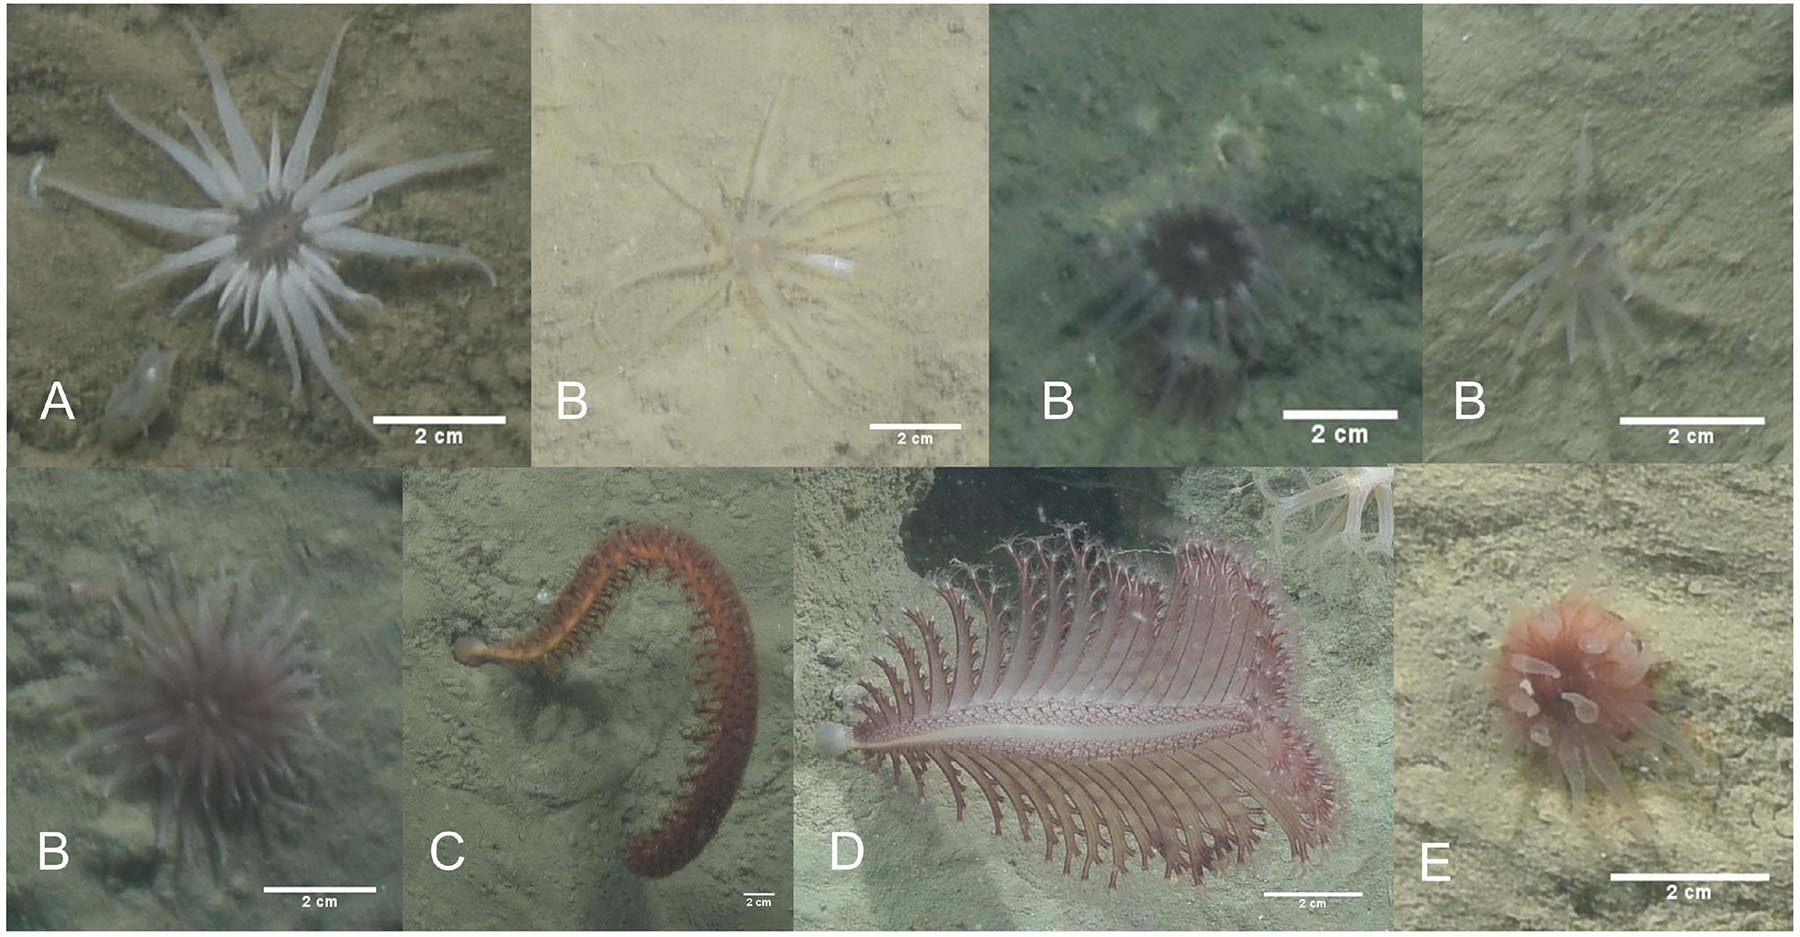
Figure 4. Examples of the most abundant taxonomic groups (scale bars are 2 cm). (A) Actiniaria (O.) sp. 23, (B) Actiniaria (O.) spp., (C) Anthoptilum spp., (D) Pennatula sp. 2, and (E) Scleractinia (O.) spp.
To make the sampling design used by ROPOS comparable to that of Campod (which included 3 400-m transects) for statistical analyses, we assembled the eight individual ROPOS transects (A-H) into four groups of 3 400-m transects, ∼200 m apart (ROPOS_ACE, ROPOS_BDF, ROPOS_CEG, ROPOS_DFH). We compared the abundance of the most abundant taxa among sampling designs (5 levels: Campod, ROPOS_ACE, ROPOS_BDF, ROPOS_CEG, and ROPOS_DFH) using one-way type 2 ANOVAs (Underwood, 1997). We detected a lack of normality using Shapiro-Wilk tests and normal quantile plots, and heteroscedacity using Levene’s tests and residual plots. Although we explored several data transformations (e.g., loge and square root versions), none improved heteroscedasticity and normality; therefore we used the untransformed data (abundance of individuals or colonies m–2) in the ANOVAs. Post hoc comparisons for significant pairwise differences in treatment means were performed with Tukey’s HSD tests (Abdi and Williams, 2010).
We used all 8 400-m ROPOS transects (ROPOS_all) for some analyses. Including all aggregated taxa, we calculated morphospecies accumulation curves using the random method for each sampling design at each station, with 999 permutations. We used non-metric multi-dimensional scaling (NMDS) to explore similarities in the composition of the assemblages among sampling designs within stations and between stations. Significant patterns were explored using permutational multivariate analysis of variance (PERMANOVA) on the Bray–Curtis dissimilarity matrix with 999 permutations using the “Adonis” function. All statistical analyses were done with R version 3.6.1; packages Tidyverse, Reshape, Vegan, Car, and Agricolae.
Results
Overall, image quality was high for both tools and most transects, except for ROPOS at LC5. For ROPOS, more images per transect were unsuitable at LC5 than at LC2 (Table 1). A higher proportion of images collected by Campod than by ROPOS were unsuitable, and only half the images were selected for analysis. However, it was often possible to replace unsuitable images, except for ROPOS at LC5 where fewer images were analyzed. Less area needed to be cropped out of images by ROPOS at LC2 than by ROPOS at LC5 and by Campod at both sites (10–40% of the area was cropped out of images with unsuitable sections). Mean altitude (and standard deviation) above the sea floor was consistent across all transects, at ∼1–2 m and thus did not affect image quality (Table 2).
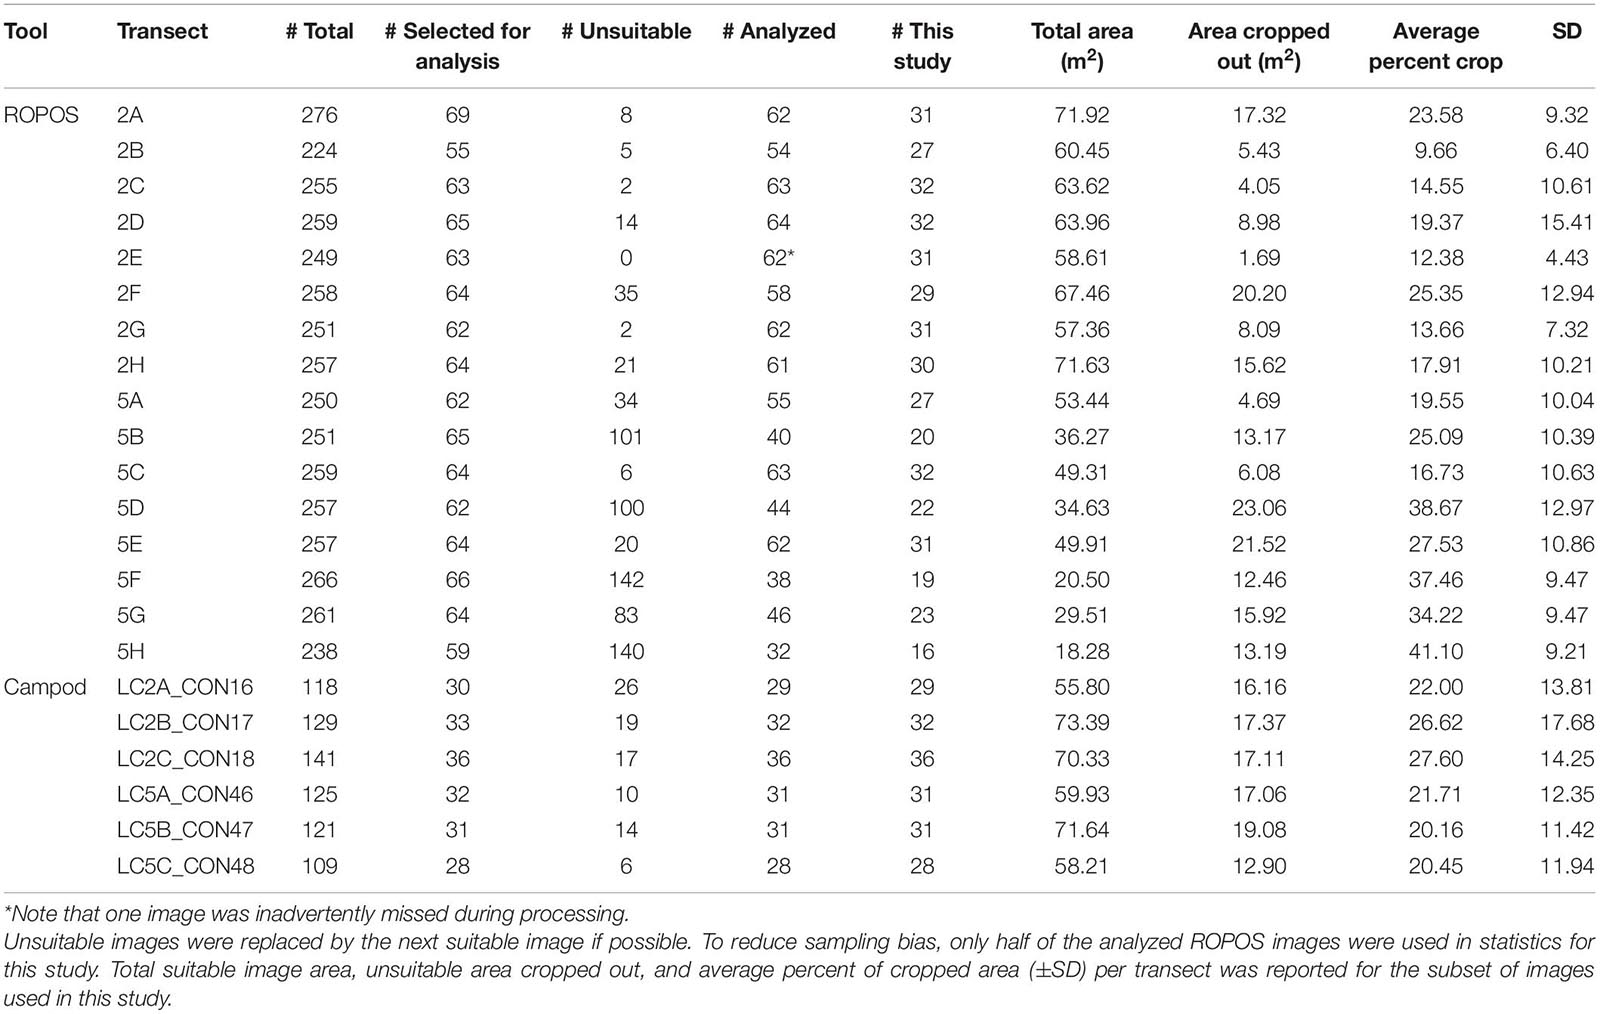
Table 1. Quality of imagery collected by the ROV ROPOS and the drop camera Campod, by 400-m transects at stations LC2 and LC5 in the Laurentian Channel MPA.
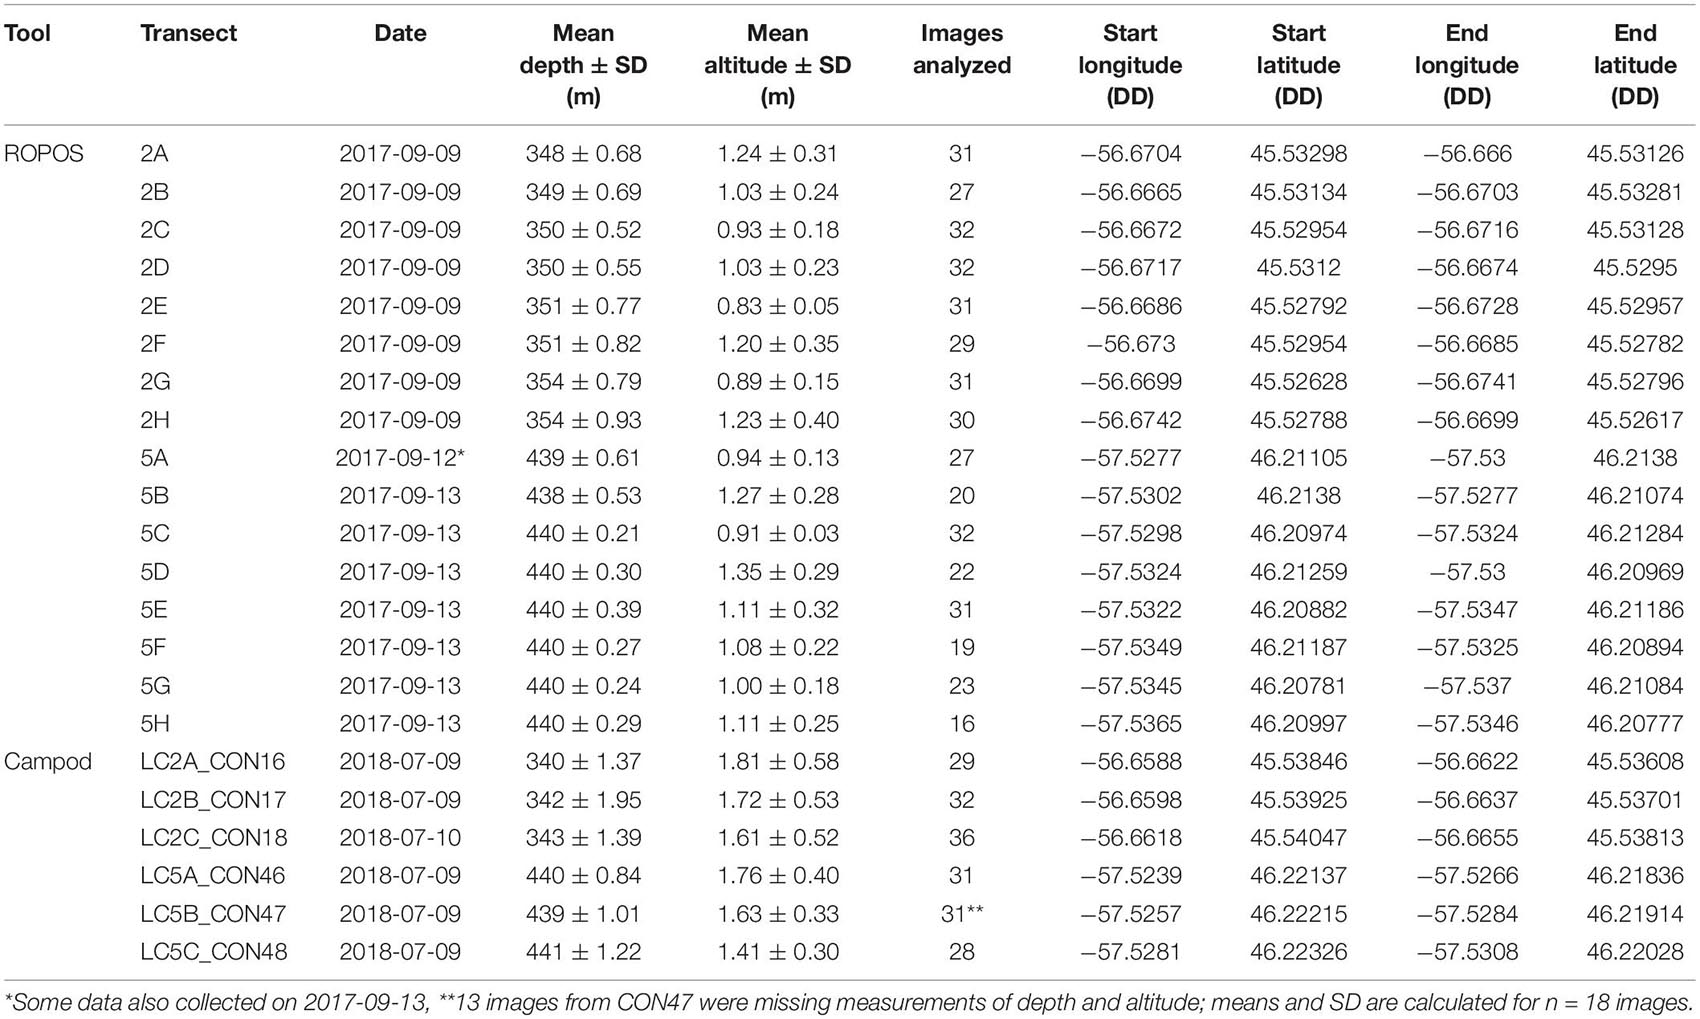
Table 2. Summary of imagery transect metadata at stations LC2 and LC5 in the Laurentian Channel MPA. DD: decimal degrees.
There were some differences between stations in the detected species composition and some taxa were only found at one station [LC2 only: Pennatulacea (O.) sp. 5, Pennatulacea (O.) spp., Protoptilum sp. 1, Asteroidea (C.) spp., Decapoda (O.) spp., Actiniaria (O.) sp. 19; LC5 only: Actiniaria (O.) sp. 23, Cerianthidae (F.) spp., Gersemia sp. 1; Tables 3, 4]. The only taxon recorded as percent cover at both stations was Holothuroidea (C.) sp. 1. Average percent cover (±SE) was less at LC2 than at LC5, for ROPOS (all eight transects; LC2 0.000 ± 0% and LC5 0.005 ± 0.003%) but varied for Campod (all three transects; LC2 0.273 ± 0.3% and LC5 0.060 ± 0.003%).
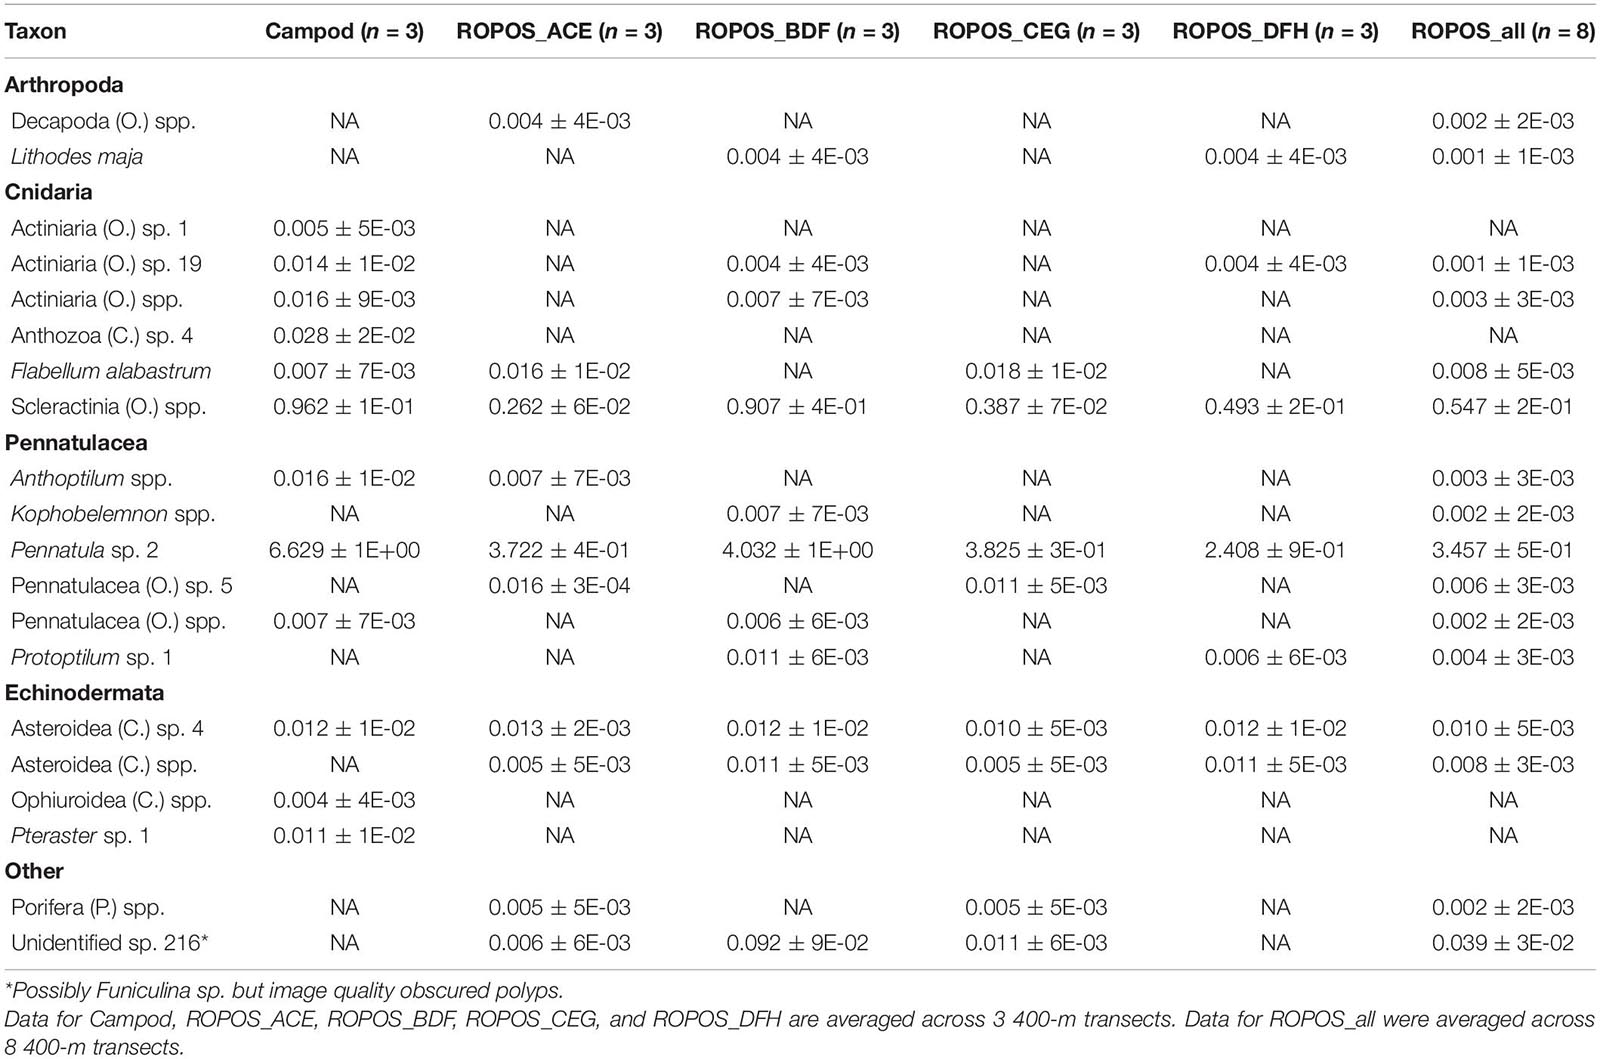
Table 3. Abundance of individuals or colonies m–2 (mean ± SE) at station LC2 in the Laurentian Channel MPA averaged across transect and then averaged across each of six sampling designs.
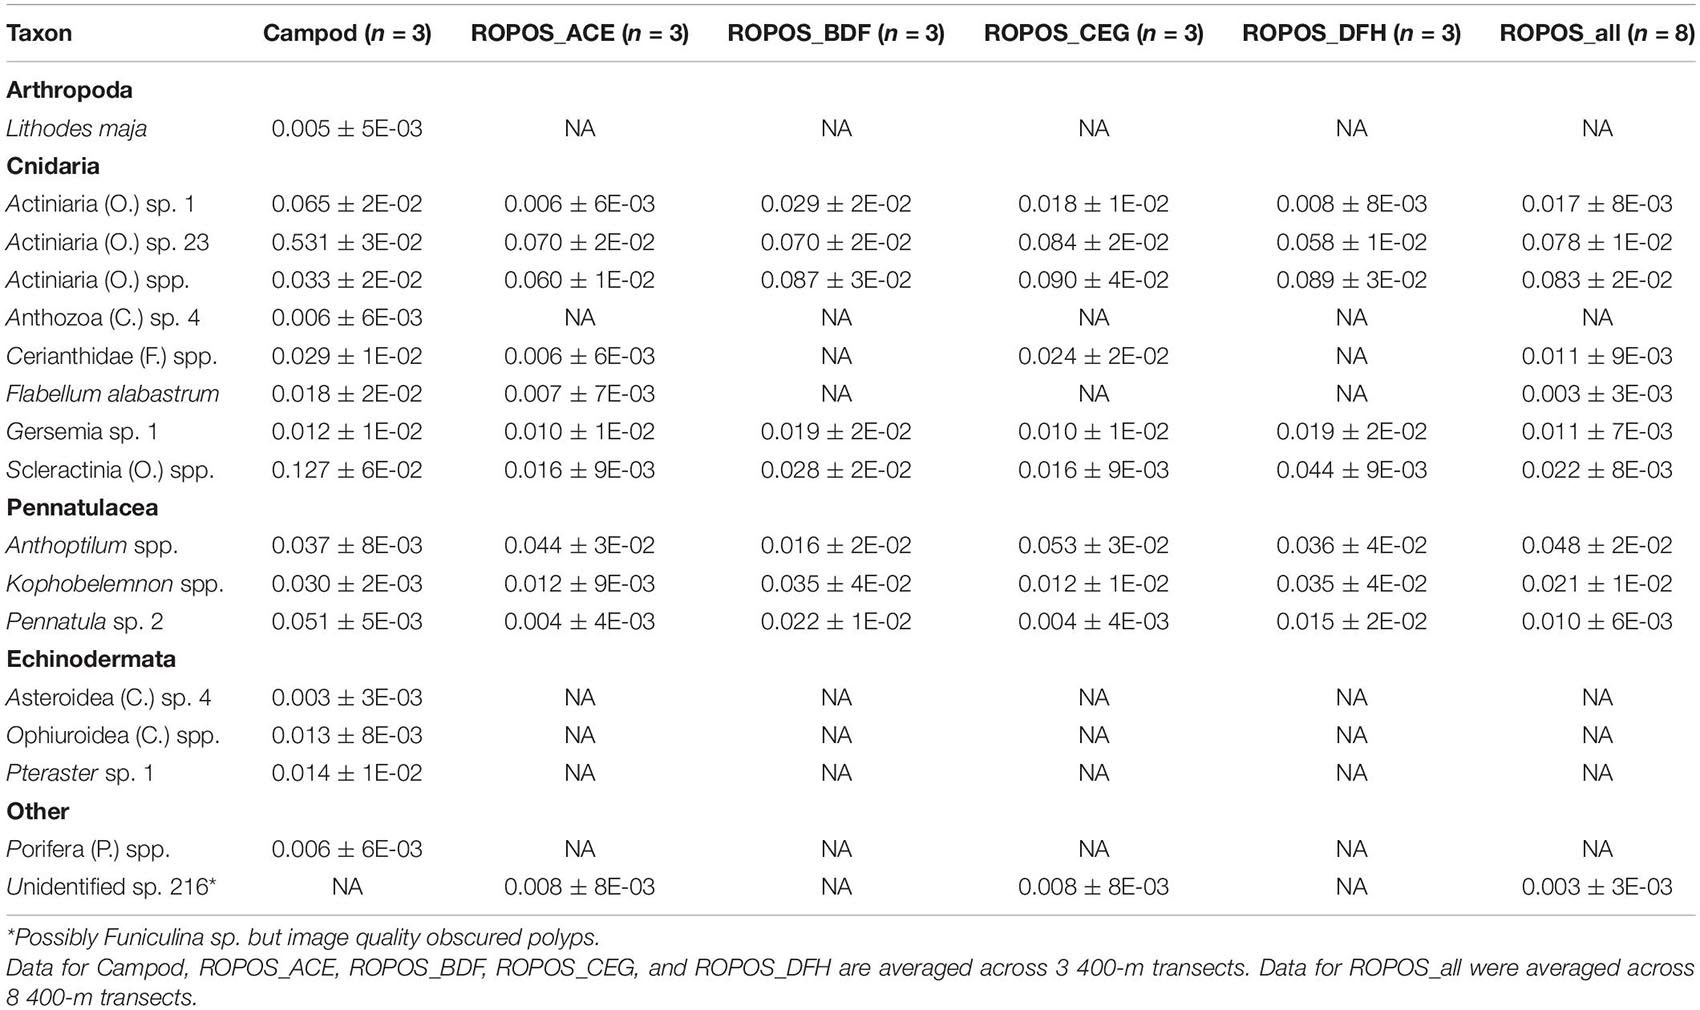
Table 4. Abundance of individuals or colonies m–2 (mean ± SE) at station LC5 in the Laurentian Channel MPA averaged across transect and then averaged across each of six sampling designs.
The abundance of taxa varied between tools and stations. Abundance was much greater at LC2 than at LC5, but was dominated by a few species, particularly Pennatula sp. 2. (Figure 5). Campod captured significantly higher abundance of Actiniaria (O.) sp. 23 than all ROPOS designs and of Pennatula sp. 2 than two of four ROPOS designs, but only at station LC5 (Table 5).
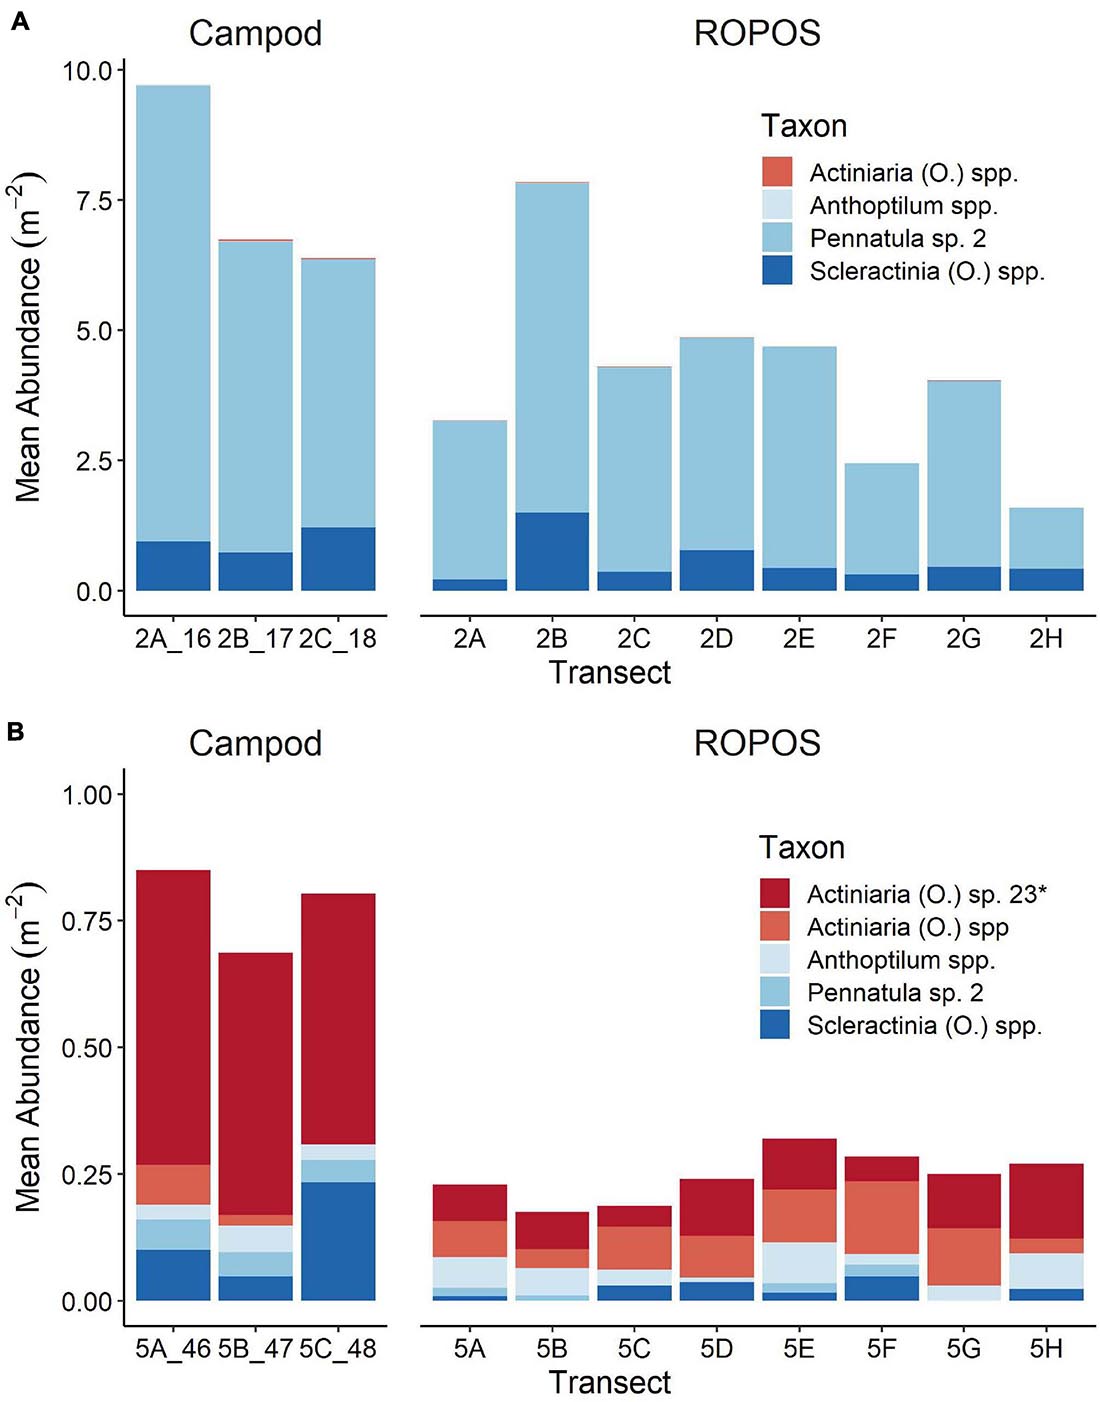
Figure 5. Mean abundance of individuals or colonies m–2 in each transect for abundant taxa (present in at least 11 of 22 transects) at (A) station LC2 and (B) station LC5 in the Laurentian Channel MPA. Abundance was averaged across images for each transect (n = 16–36), see Table 1 for number of images per transect. Different scales on y-axis, *denotes taxon that was only found at one of these stations.
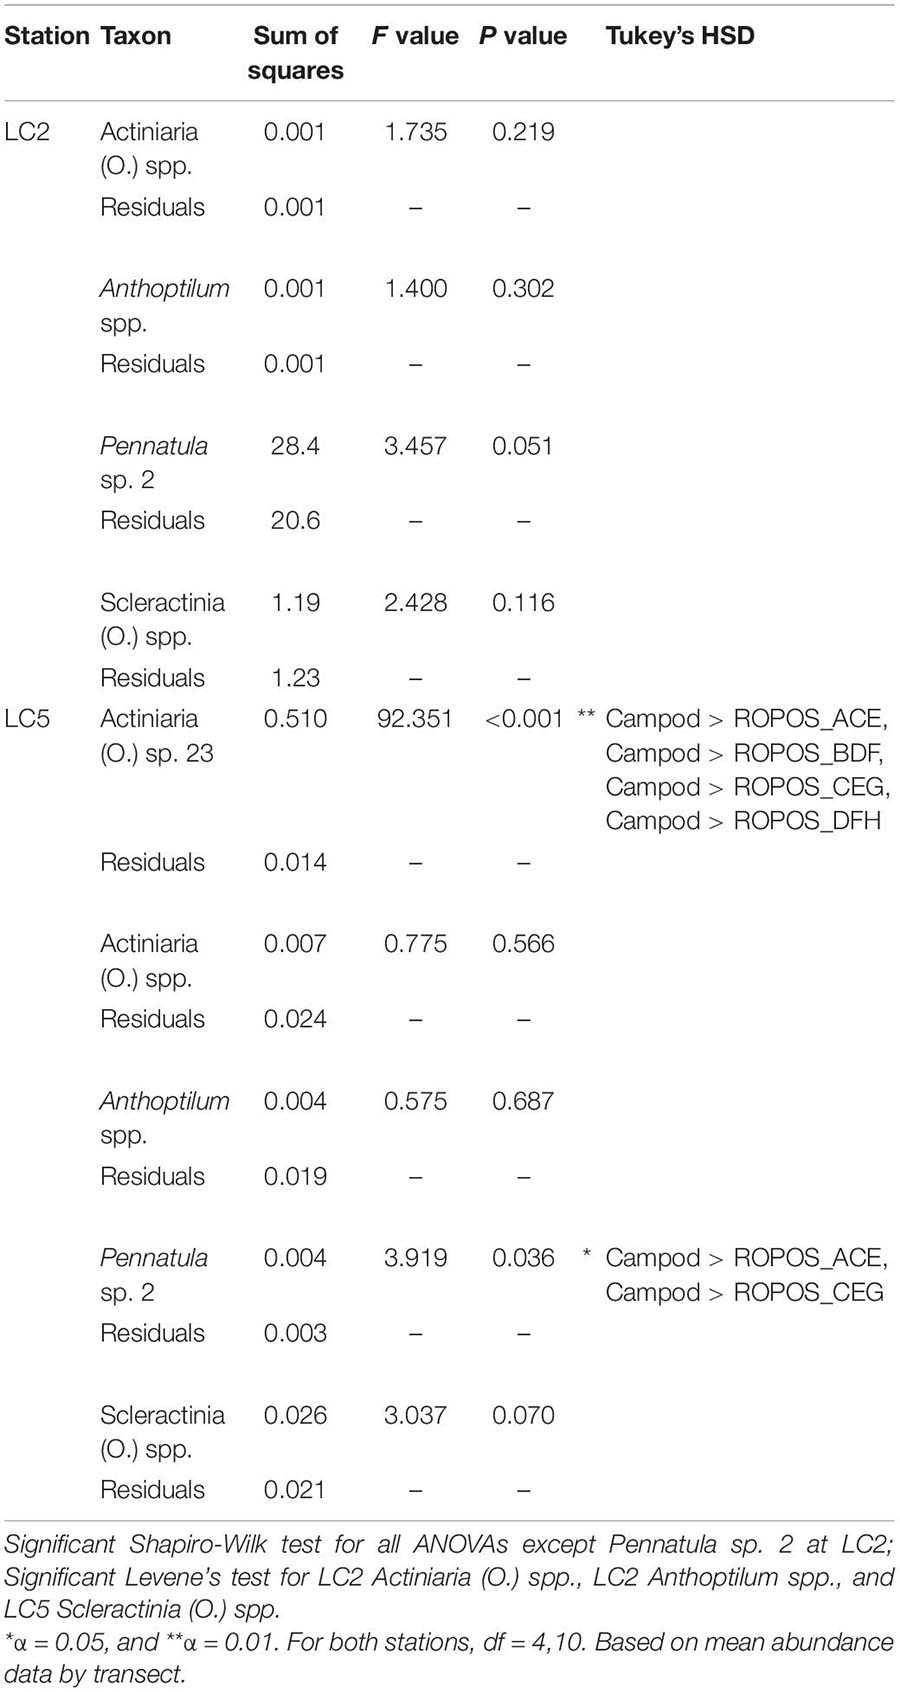
Table 5. One-way ANOVAs (type 2) on untransformed data, using five fixed levels of design: Campod, ROPOS_ACE, ROPOS_BDF, ROPOS_CEG, and ROPOS_DFH (3 400 m transects) for abundant taxa (present in at least 11 of 22 total transects), at stations LC2 and LC5 in the Laurentian Channel MPA.
Morphospecies accumulation curves were similar for Campod and ROPOS at LC2 (Figure 6) but the curve was steeper for Campod than all ROPOS designs at LC5. A plateau of the morphospecies accumulation curves was not reached at either station, except when all ROPOS transects were combined at LC5. Significant differences in species composition existed between the two stations (Figure 7A and Table 6). Based on the NMDS plots and PERMANOVAs, the imagery tools produced similar assemblages at LC2 (overlapping 95% confidence interval for tools) but not at LC5 (Figures 7B,C and Table 6).
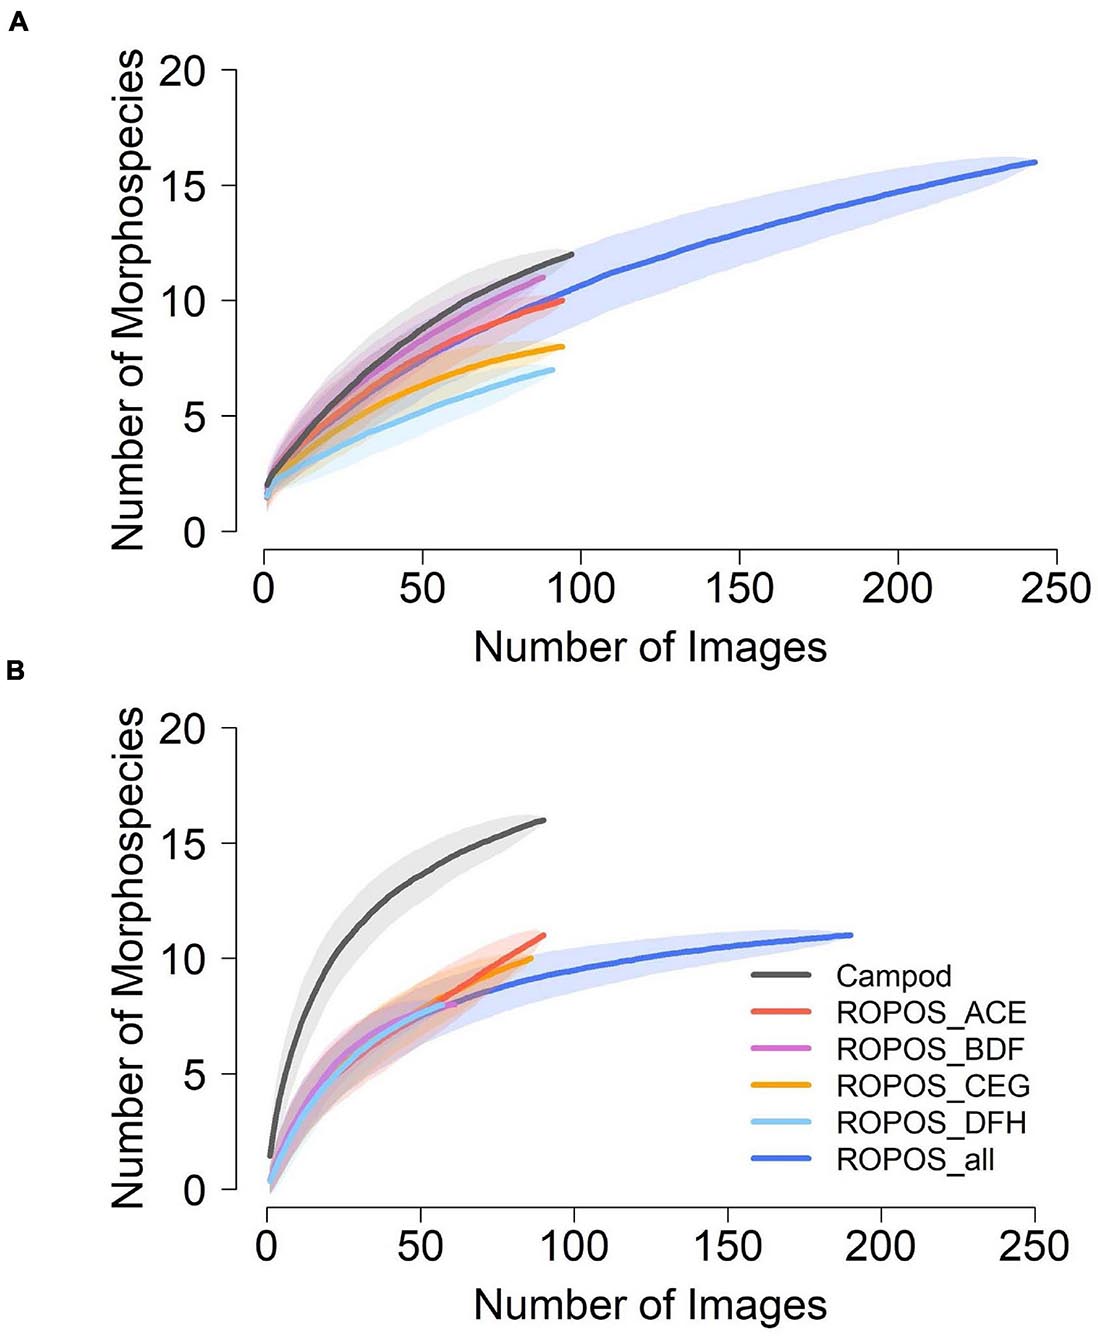
Figure 6. Morphospecies accumulation curves at (A) station LC2 and (B) station LC5 in the Laurentian Channel MPA, based on abundance per photo across each of the six sampling designs; Campod, ROPOS_ACE, ROPOS_BDF, ROPOS_CEG, ROPOS_DFH (3 400 m transects), and ROPOS_all (8 400 m transects). Used random method with 999 permutations; shaded confidence interval are one SD.
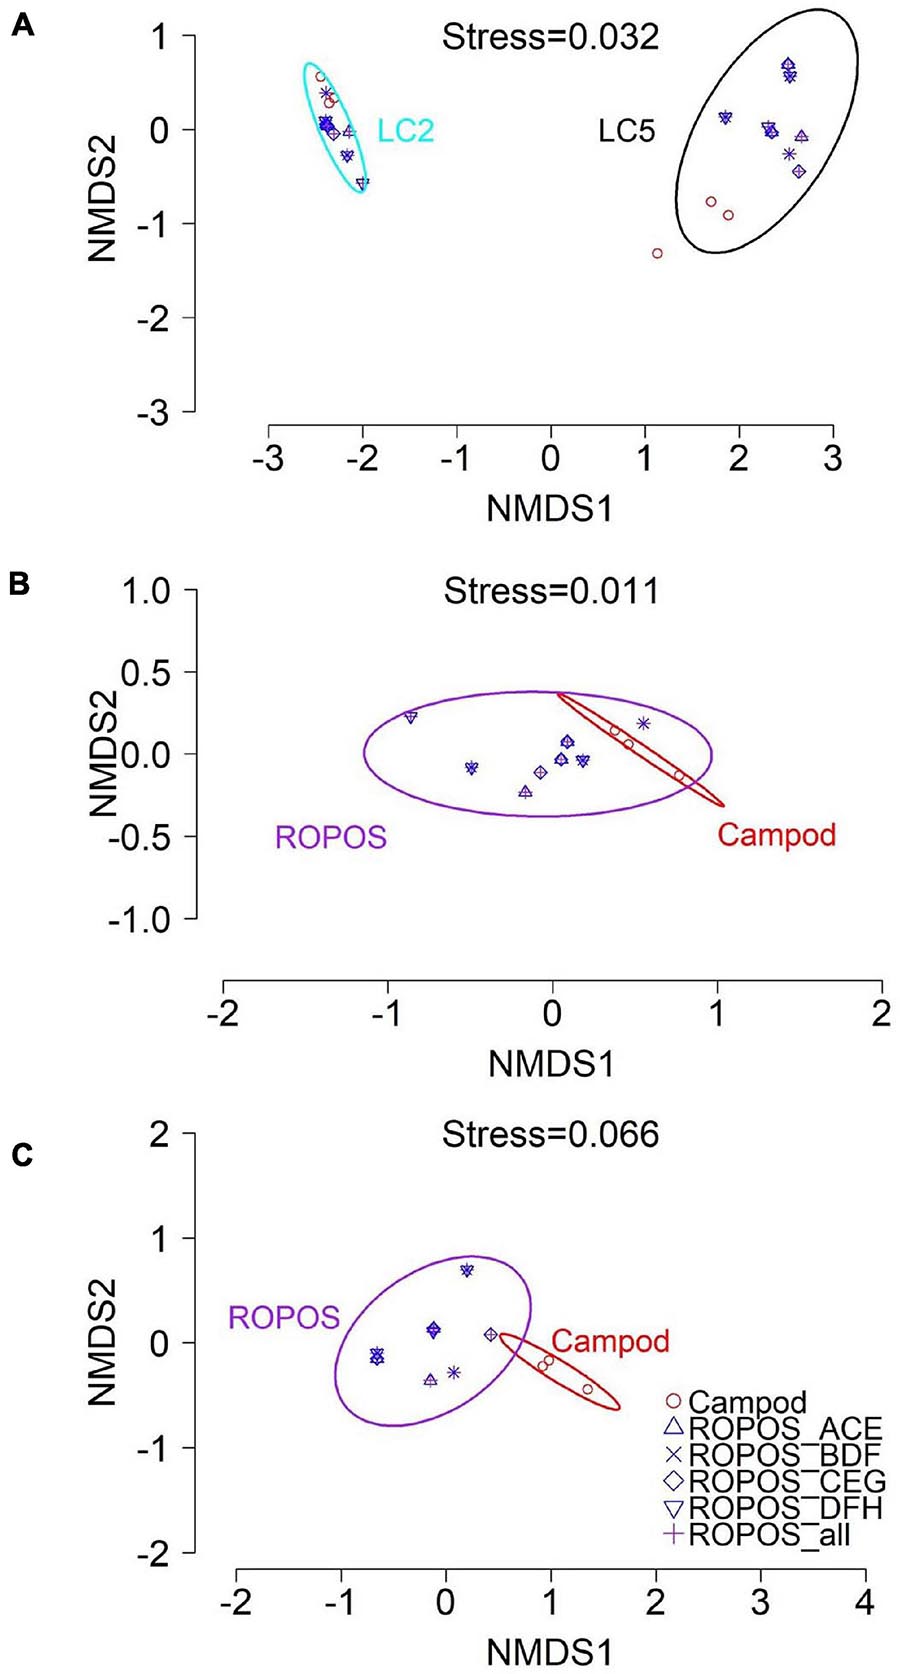
Figure 7. Non-metric multi-dimensional scaling (NMDS) plot of the assemblages in the Laurentian Channel MPA (mean abundance m– 2 per transect for n = 23 aggregated taxa) using Bray-Curtis dissimilarity with 95% CI for station and tool groups, at (A) station LC2 and LC5; (B) station LC2 for each sampling design and (C) station LC5.
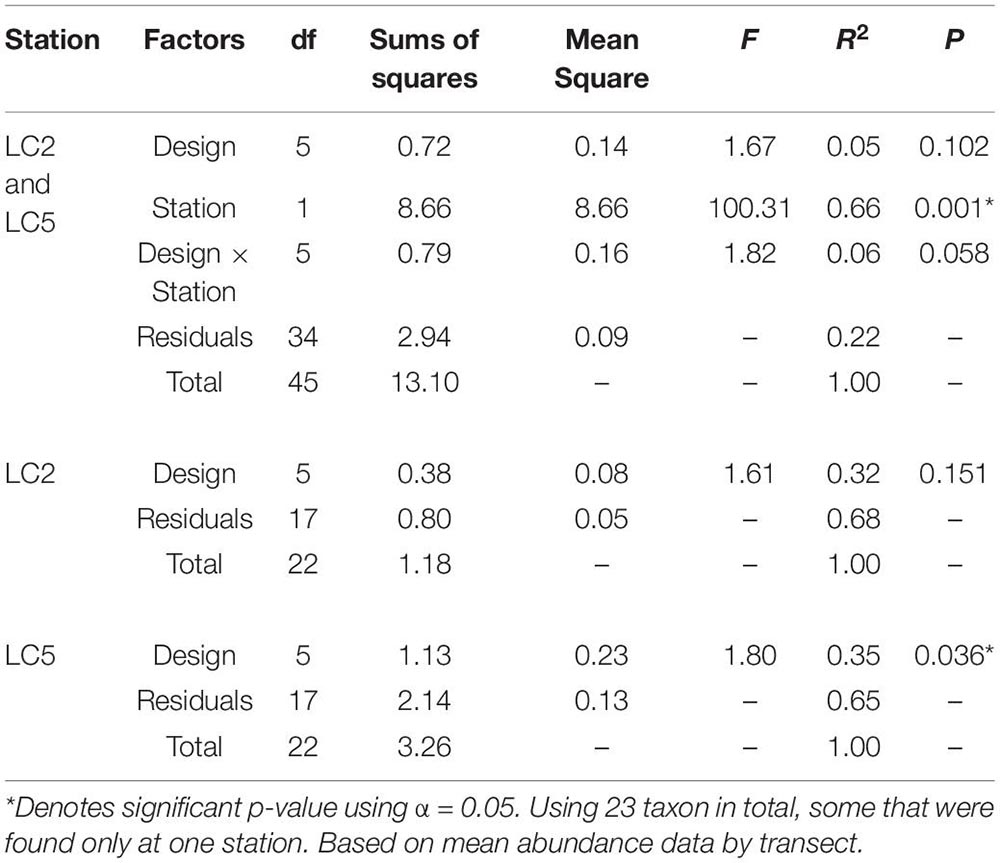
Table 6. Permutational multivariate analysis of variance (PERMANOVA) of distance matrix using Bray–Curtis dissimilarity and 999 permutations examining the effect of sampling designs Campod, ROPOS_ACE, ROPOS_BDF, ROPOS_CEG, ROPOS_DFH (3 400 m transects), and station (LC2 and LC5) in the Laurentian Channel MPA.
The trawl only captured a few taxa (Table 7) with overall low catch weights, except for sea pens (not taxonomically resolved) at LC5. Biomass normalized to sampled area ranged from <0.01 to 1.45 gm–2 for Pennatula cf. aculeata, likely the same species as Pennatula sp. 2 from the imagery analysis (2.408 ± 0.9 to 6.629 ± 1 m–2 at LC2; 0.004 ± 0.004 to 0.051 ± 0.005 m–2 at LC5).
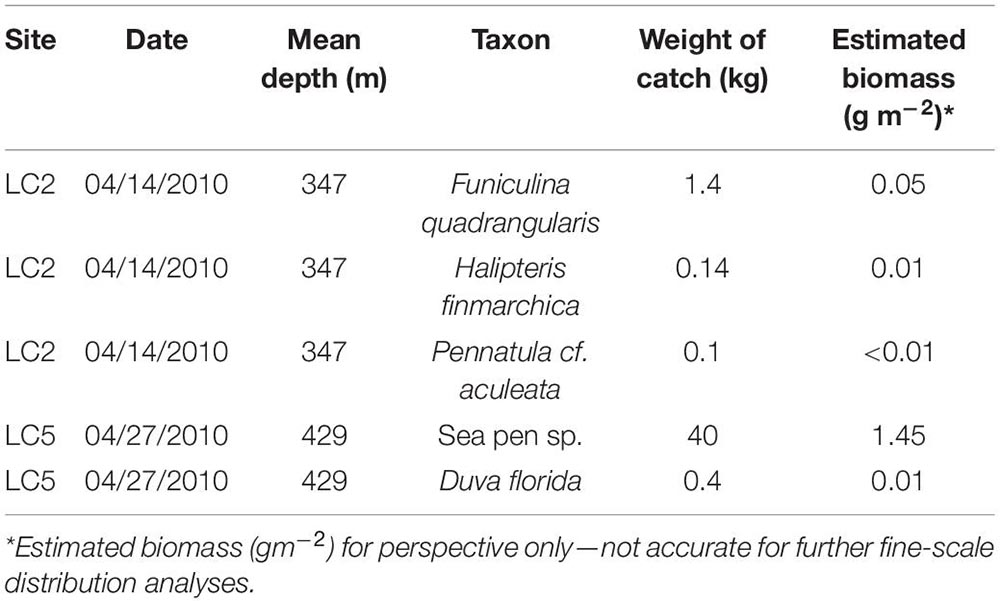
Table 7. Coral biomass from Fisheries and Oceans Canada (Newfoundland and Labrador Region) multispecies surveys using a Campelen 1800 Shrimp Trawl from one trawl set at station LC2 and LC5.
Discussion
We examined differences in the estimation of abundance and diversity, as well as sampling performance and biases among the ROV, drop camera and trawl when applicable. Image quality was impacted by several factors including resolution (based on camera and file type), speed and mode of movement, elevation above seafloor, sufficiently uniform lighting and obstruction by plumes of resuspended sediment and animals in the water column. Extracted frame grabs from video of a moving camera (ROV) had reduced quality compared to stills (drop camera), likely related to motion blur (i.e., caused by a moving camera or target) and compression of the video file. It was usually possible to replace unsuitable images with neighboring ones, except for the ROPOS transects at LC5, where significant fish activity created sediment plumes that obstructed many images resulting in a slight sampling bias of fewer images (Table 1). This fish behavior may have been a response to the motion, sound, or constant bright lighting of the ROV in an otherwise low light environment. However, the drop camera produced a yet higher proportion of unsuitable images, as the tool itself caused some sediment disturbance.
Taxon-specific abundance (particularly for Pennatula and Actiniaria) was higher and accumulation curves steeper when using the drop camera than the ROV, but only at one station. However, the curves did not reach an asymptote with either tool, suggesting more than 90 images were required to fully capture diversity. These taxon-specific differences suggest the tools had different catchabilities for different morphospecies, possibly because poor image quality compromised the ability to distinguish smaller sized individuals (e.g., Pennatula sp. 2 recruits) or taxa with similar coloration to the sediment (Table 8). Another study comparing imagery from towed cameras and an AUV, similarly concluded that higher resolution imagery both leads to detection of higher faunal densities and accounts for smaller fauna (Schoening et al., 2020). Minimizing the altitude of the camera, to obtain higher resolution imagery, should also result in higher taxonomic resolution (Schoening et al., 2020). A towed camera produced imagery of lower resolution when sampling from an altitude of ∼3 m than ∼1 m, resulting in reduced taxonomic identification (Jones et al., 2009).
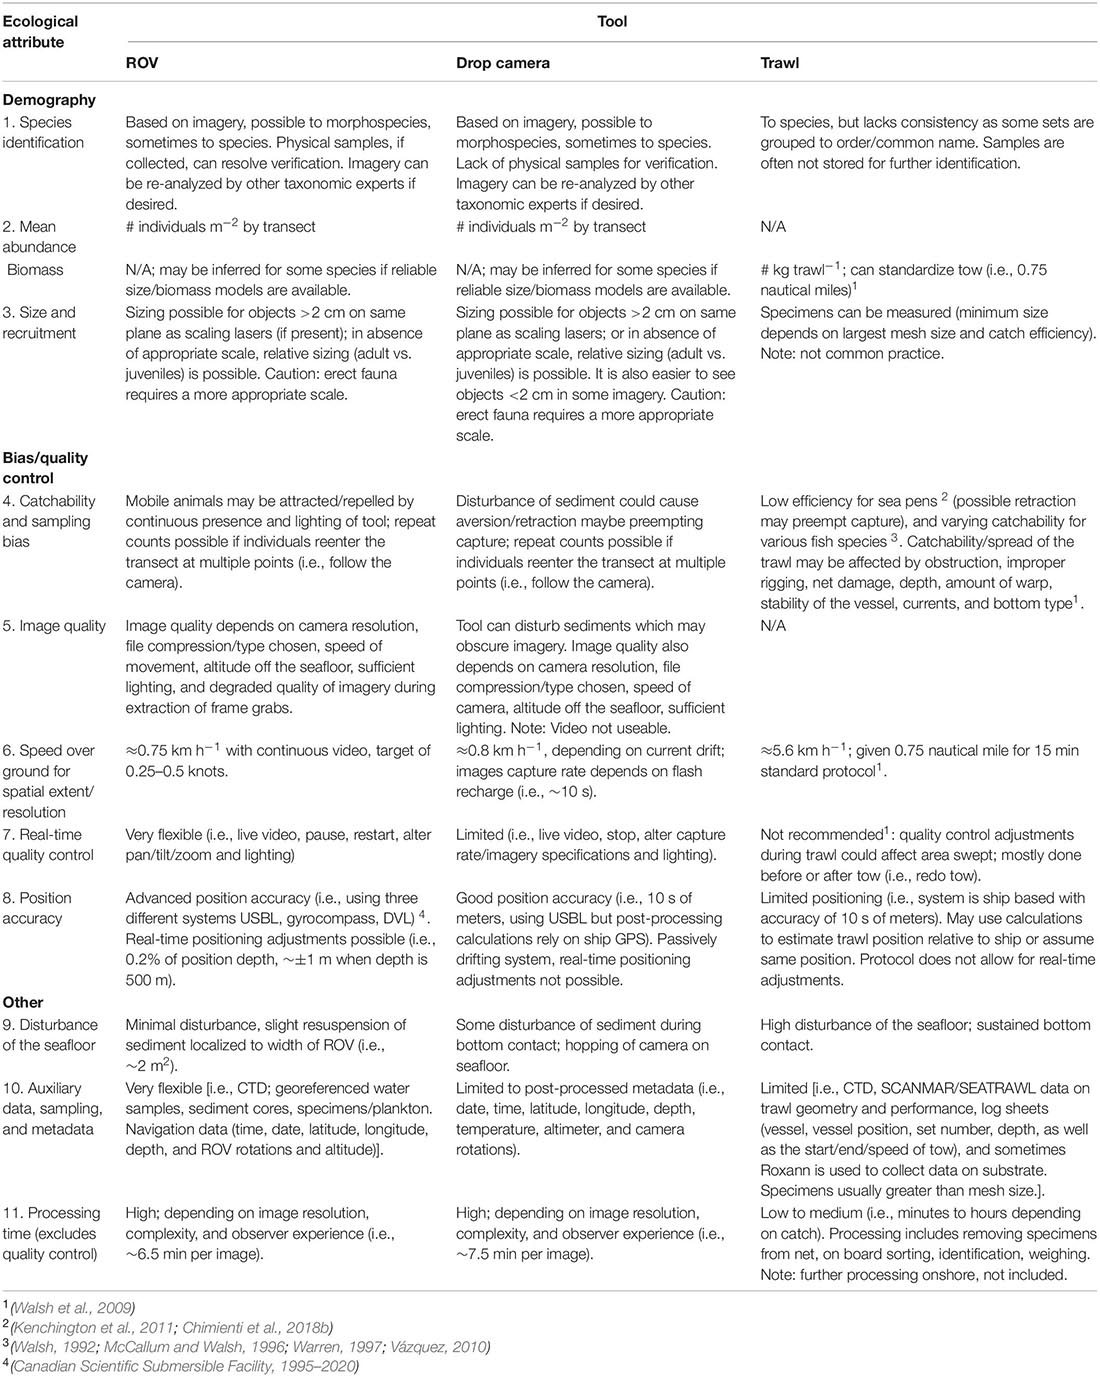
Table 8. Qualitative comparisons of three sampling tools [a remotely operated vehicle (ROPOS), a drop camera (Campod), and a trawl (Campelen 1800 Shrimp Trawl)] for capturing different ecological attributes and sampling biases for deep-sea megaepifauna.
Sampling adjustments that enhance image quality are needed to optimize data analysis, such as constraining the altitude off the seafloor and speed of the camera movement. In addition, certain video imagery file types during data collection may improve resolution and allow reliable detection of recruits and smaller taxa. In general, differences in catchability between tools may make some tools better suited than others for capturing morphospecies with different magnitudes/patterns of abundance (i.e., very abundant vs. rare morphospecies), affecting tool performance. Catchability and sampling biases of all sampling tools need to be compared quantitatively for different species and ecosystems by sampling the same locations and ecological attributes, preferably at the same time. To our knowledge, ours is the first study that compares empirically catchability from a drop camera to that of a ROV and a trawl (with ∼16.5 m wing spread) in the peer-reviewed literature.
Trawls are used to assess fish stocks (Trenkel et al., 2004; McIntyre et al., 2015), and sometimes invertebrates, such as octopus, decapods, sea pens, sponges, holothurians, and some gorgonians (Junceella sp. and alcyonaria) (Adams et al., 1995; Wassenberg et al., 2002; Pitcher et al., 2007; Ayma et al., 2016; Pacunski et al., 2016; Chimienti et al., 2018b, 2019; Zhulay et al., 2019; Dinn et al., 2020). Otter trawls have a flexible mouth that is better suited for capturing mobile fauna but is less effective for epibenthic fauna (Jamieson et al., 2013). In this study, we showed different patterns in relative abundance for sea pens (Order Pennatulacea) sampled by ROV from those based on biomass data from the trawls. Trawls may have lower capture efficiency for some invertebrates than the drop camera and ROV. Kenchington et al. (2011) suggested ∼5.2% sea pen catch efficiency for the Campelen Trawl compared to Campod. Similarly, sea pen density of P. rubra was higher based on ROV data than trawl data (Chimienti et al., 2018b).
Trawls are likely more appropriate for assessing some mobile fauna, yet in this study drop camera and ROV appeared to capture sessile fauna and recruits more effectively. Past studies have also found that trawls tend to undersample abundance and diversity compared to imagery returning higher abundance estimates for many but not all species (e.g., Uzmann et al., 1977; Nybakken et al., 1998; Morris et al., 2014). The higher abundance recorded from trawls for some species, such as squid, herring, mackerel, and butterfish, were likely the result of a photonegative response to the lighting on the submersible or camera sled (Uzmann et al., 1977). Logan et al. (2017) recorded overall higher fish abundances and diversity with a baited camera than a towed camera, yet this varied with habitat and functional group, where towed camera recorded higher abundances of species with cryptic or territorial behavior.
Comparisons of data obtained by imagery tools and trawls are challenging, as the tools appear to have different catchability limitations and capture different epifaunal patterns. In our study, the high catch weights combined with low numerical abundance captured by the trawl may have been the result of larger sea pen species at one of the stations (LC5), and/or smaller individuals being missed because of net size. Trawls have reduced catchability for small species such as Kophobelemnon spp. (Kenchington et al., 2011). Kenchington et al. (2011) also reported varying mean weights for the sea pen species in the Laurentian Channel and our imagery suggested the composition of sea pens may vary by station. Additionally, some sea pens have a withdrawal response (Langton et al., 1990; Ambroso et al., 2013; Chimienti et al., 2018b), which may result in an underestimate of abundance and biomass.
Qualitative Comparison of Tools
Overall, imagery tools appeared to perform better than trawls for most ecological attributes with fewer sampling biases and causing less disturbance, within a smaller footprint (Table 8). All three tools can be used to identify morphospecies, commonly used for image analyses, which can be verified subsequently with physical samples collected by a ROV or trawl but not a drop camera. However, taxonomic identification using imagery is constrained and efforts on global standardization are underway (Howell et al., 2019). Sizing taxa can allow for examination of population dynamics, such as recruitment events (Bak and Meesters, 1998; Chimienti et al., 2018b), although this is not currently common practice for most of the trawl samples in our region. Imagery may be used to estimate size only of non-erect taxa lying on the same plane as the lasers, but in our study, the scaling lasers in both drop camera and ROV imagery were deemed unsuitable to size sea pens.
Tool-specific operational effects likely impacted overall catchability. Lighting, noise, and physical disturbance of sediment may have led to the attraction or aversion of some morphospecies. Fish behavioral reactions to ROVs and trawls have been recorded in previous studies (Adams et al., 1995; Trenkel et al., 2004; McIntyre et al., 2015; Ayma et al., 2016). Other factors including obstruction, improper rigging, net damage, depth, amount of warp, stability of the vessel, currents and bottom type are known to affect trawl sampling (Walsh et al., 2009). The ROV had the highest real time quality control, which was otherwise limited for the drop camera and trawl systems either due to the passive tow sampling nature or operation protocols (Table 8). Positioning accuracy was highest for the ROV at ∼±1 m, and estimated as ∼±10 s of meters for the drop camera and trawl, although the trawl position accuracy has additional limitations as positional equipment is mounted on the vessel rather than on the trawl. Furthermore, wire-out for trawls is often three times the depth to the seafloor and the trawl can be 1,000 s of m below or behind the vessel (Jamieson et al., 2013).
The ROV sampled at a rate of approximately 0.75 km h–1, slightly slower than the drop camera (0.8 km h–1); the trawl had the most efficient sampling time at ∼5.6 km h–1 (Table 8). Processing time was estimated to be higher for imagery, at ∼6.5 min per image for ROPOS and ∼7.5 min per image for the drop camera likely due to the higher imagery resolution. Trawl processing time on ship is highly variable, ranging from minutes to hours depending on catch size.
Ultimately, the data collected using different tools may be used in different types of analyses. For example, the more flexible datasets with detailed metadata, such as geo-referenced faunal records collected continuously along video transects, allow for analyses of spatial structure and species associations (Table 8). Further, there are trade-offs between data resolution (complete transect with ROV and snapshots with drop camera) and image quality, as well as sampling/processing time and data quality, which could affect analyses. Overall, real time control of sampling, less disturbance, and higher position accuracy than trawls are desirable features of ROVs.
Future Research and Recommendations
More baseline data are needed to understand the structure and function of deep sea communities and develop strategies for monitoring and conservation (Danovaro et al., 2017a; Aguzzi et al., 2019). However, for this data to be meaningful, appropriate and quantitative tools should be used. It is evident that different tools have different efficiencies in capturing different species, often rendering results incomparable.
Further research is needed into the utility of available sampling tools for different types of analyses. ROVs collect data that may be used to define taxa-specific habitat relationships at more spatially discrete scales, as well as community structure and biogeographic affinities (Zhulay et al., 2019). Key research foci should include size relationships, other biometric relationships, the integration of datasets between tools, ground truthing, and catchability studies. The development of biometric relationships (e.g., inferring biomass from imagery) from trawl catches can help with integration of data from the different tools, allowing the use of historical datasets from trawls as we move toward less destructive monitoring (Chimienti et al., 2019). Research that directly and empirically compares tools should be prioritized, as more than one tool is required to ground truth data and understand catchability. For example, Pacunski et al. (2016) suggested using both ROV and trawl to assess fish stocks and developing statistical methods to combine data from the two tools. In addition, low detectability of animals due to either their visibility (i.e., cryptic) or observer perception is often ignored in most studies (Katsanevakis et al., 2012). Research into methods for sizing erect taxa is also needed, potentially through 3D photo mosaicking (Kwasnitschka et al., 2013; Bennecke et al., 2016; Gerdes et al., 2019). Lastly, imagery appears to have greater catchability for sessile fauna compared to trawl, yet is a more time-intensive to process. Thus, research into automation of image processing, will also be a great benefit to future deep-sea research (e.g., Lacharité et al., 2015).
Conclusion
Overall, imagery tools appeared to better capture epibenthic fauna than a trawl and provided more informative datasets that can allow for various follow-up analyses, such as on spatial structure and species associations. We found evidence that drop cameras may be better than ROVs at capturing both abundance [Actiniaria (O.) sp. 23 and Pennatula sp. 2] and diversity (morphospecies accumulation curves at LC5) of some taxonomic groups, possibly due to its higher imagery resolution and catchability for some species. However, more research is needed to understand the catchability of all these tools, and allow for better interpretation and integration of datasets, to ensure effective sampling in deep-sea environments. Catchability studies are essential to address whether we are effectively and quantitively capturing our target species or ecological attributes, to ensure high data quality and accurate representativity.
Data Availability Statement
The datasets related to ROV and drop camera presented in this article are not readily available because they are part of ongoing thesis work by SD. The data analyzed in this study related to trawl was obtained from Fisheries and Oceans Canada (DFO). Requests to access the trawl data should be directed to Fisheries and Oceans Canada (DFO) at info@dfo-mpo.gc.ca. Requests to access the imagery datasets should be directed to sarah.de.mendonca@dal.ca.
Author Contributions
SD conceptualized the study. SD and AM designed the ROV and drop camera sampling. SD led ROV and drop camera imagery collection, with assistance from those in acknowledgments. SD and those in acknowledgments conducted the analysis of imagery and data. Both authors contributed to the writing of the manuscript.
Funding
Funding was provided to NSERC grant (NETGP 468437 – 14) to AM. SD was funded by scholarships from Natural Sciences and Engineering Research Council of Canada, Nova Scotia Graduate Scholarship program, and Faculty of Graduate Studies, Dalhousie University. This research is sponsored by the NSERC Canadian Healthy Oceans Network and its Partners: Department of Fisheries and Oceans Canada and INREST (representing the Port of Sept-Îles and City of Sept-Îles). This research is in part of an ongoing graduate thesis.
Conflict of Interest
The authors declare that the research was conducted in the absence of any commercial or financial relationships that could be construed as a potential conflict of interest.
Acknowledgments
We would like to thank Peter Lawton (Chief Scientist) and the crews and scientists involved on the collaborative CHONe-DFO research cruises on the research vessels CCGS Hudson and CCSG Martha L. Black, with the remotely operated vehicle ROPOS and drop camera Campod. Vonda Wareham-Hayes and Bárbara de Moura Neves (DFO-Newfoundland and Labrador) provided their invertebrate expertise, advice, and data on the Laurentian Channel (MPA boundaries and trawl data). Craig Brown (DAL) and Myriam Lacharité (UTAS) provided benthoscape data essential to cruise planning. Callum Mireault (deceased), Beatrice Proudfoot, Tamara Wilson, Marion Boulard, and Adam Stoer provided assistance at sea. We would also like to thank Kate Arpin for image analysis, and Remi Daigle for advice with R code data processing. Vincent Auger, Robert Benjamin, Peter Pledge, and Luiz Mello provided expertise on tools.
Footnotes
References
Abdi, H., and Williams, L. J. (2010). “Tukey’s honestly signiflcant difference test (HSD),” in Encyclopedia of Research Design, ed. N. Salkind (Thousand Oaks, CA: Sage).
Abràmoff, M. D., Magalhães, P. J., and Ram, S. J. (2004). Image processing with imageJ. Biophoton. Int. 11, 36–41. doi: 10.1117/1.3589100
Adams, P. B., Butler, J. L., Baxter, C. H., Laidig, T. E., Dahlin, K. A., and Wakefield, W. W. (1995). Population estimates of Pacific coast groundfishes from video transects and swept-area trawls. Fish. Bull. 93, 446–455. doi: 10.1016/j.simpat.2011.09.002
Aguzzi, J., Chatzievangelou, D., Marini, S., Fanelli, E., Danovaro, R., Flögel, S., et al. (2019). New high-tech flexible networks for the monitoring of deep-sea ecosystems. Environ. Sci. Technol. 53, 6616–6631. doi: 10.1021/acs.est.9b00409
Ambroso, S., Dominguez-carrió, C., Grinyó, J., López-González, P. J., Gili, J.-M., Purroy, A., et al. (2013). In situ observations on withdrawal behaviour of the sea pen Virgularia mirabilis. Mar. Biodivers. 43, 257–258. doi: 10.1007/s12526-013-0172-5
Auster, P. J., Gjerde, K., Heupel, E., Watling, L., Grehan, A., and Rogers, A. D. (2011). Definition and detection of vulnerable marine ecosystems on the high seas: problems with the “move-on” rule. ICES J. Mar. Sci. 68, 254–264. doi: 10.1093/icesjms/fsq074
Ayma, A., Aguzzi, J., Canals, M., Lastras, G., Bahamon, N., Mecho, A., et al. (2016). Comparison between ROV video and Agassiz trawl methods for sampling deep water fauna of submarine canyons in the Northwestern Mediterranean Sea with observations on behavioural reactions of target species. Deep. Res. Part I Oceanogr. Res. Pap. 114, 149–159. doi: 10.1016/j.dsr.2016.05.013
Baco, A. R., Roark, E. B., and Morgan, N. B. (2019). Amid fields of rubble, scars, and lost gear, signs of recovery observed on seamounts on 30- To 40-year time scales. Sci. Adv. 5, 1–7. doi: 10.1126/sciadv.aaw4513
Bak, R. P. M., and Meesters, E. H. (1998). Coral population structure: the hidden information of colony size-frequency distributions. Mar. Ecol. Prog. Ser. 162, 301–306. doi: 10.3354/meps162301
Bennecke, S., Kwasnitschka, T., Metaxas, A., and Dullo, W. C. (2016). In situ growth rates of deep-water octocorals determined from 3D photogrammetric reconstructions. Coral Reefs 35, 1227–1239. doi: 10.1007/s00338-016-1471-7
Bennecke, S., and Metaxas, A. (2017). Effectiveness of a deep-water coral conservation area: evaluation of its boundaries and changes in octocoral communities over 13 years. Deep. Res. Part II Top. Stud. Oceanogr. 137, 420–435. doi: 10.1016/j.dsr2.2016.06.005
Canadian Scientific Submersible Facility (1995-2020). ROPOS Technical Sheet: ROPOS Specifications. Available online at: http://www.ropos.com/index.php/ropos-rov/ropos-specifications (accessed January 29, 2019)
Chimienti, G., Angeletti, L., and Mastrototaro, F. (2018a). Withdrawal behaviour of the red sea pen pennatula rubra (Cnidaria: Pennatulacea). Eur. Zool. J. 85, 64–70. doi: 10.1080/24750263.2018.1438530
Chimienti, G., Angeletti, L., Rizzo, L., Tursi, A., and Mastrototaro, F. (2018b). ROV vs trawling approaches in the study of benthic communities: the case of Pennatula rubra (Cnidaria: Pennatulacea). J. Mar. Biol. Assoc. UK 98, 1–11. doi: 10.1017/S0025315418000851
Chimienti, G., Di Nisio, A., Lanzolla, A. M. L., Andria, G., Tursi, A., and Mastrototaro, F. (2019). Towards non-invasive methods to assess population structure and biomass in vulnerable sea pen fields. Sensors (Switzerland) 19, 1–12. doi: 10.3390/s19102255
Clark, S. H. (1979). Application of bottom-trawl survey data to fish stock assessment. Fisheries 4, 9–15.
Dale, M. R. T., and Fortin, M.-J. (2014). Spatial Analysis?: A Guide for Ecologists, 2nd Edn. Cambridge: Cambridge University Press, doi: 10.1016/B978-0-444-53868-0.50013-7
Danovaro, R., Aguzzi, J., Fanelli, E., and Smith, C. R. (2017a). An ecosystem-based deep-ocean strategy. Science 355, 452–454.
Danovaro, R., Corinaldesi, C., Dell’Anno, A., and Snelgrove, P. V. R. (2017b). The deep-sea under global change. Curr. Biol. 27, R461–R465. doi: 10.1016/j.cub.2017.02.046
DFO (2019). Laurentian Channel Marine Protected Area (MPA). Available online at: https://www.dfo-mpo.gc.ca/oceans/mpa-zpm/laurentian-laurentien/index-eng.html (accessed May 14, 2020)
Dinn, C., Zhang, X., Edinger, E., and Leys, S. P. (2020). Sponge communities in the eastern Canadian Arctic: species richness, diversity and density determined using targeted benthic sampling and underwater video analysis. Polar Biol. 43, 1287–1305. doi: 10.1007/s00300-020-02709-z
Drazen, J. C., Leitner, A. B., Morningstar, S., Marcon, Y., Greinert, J., and Purser, A. (2019). Observations of deep-sea fishes and mobile scavengers from the abyssal DISCOL experimental mining area. Biogeosciences 16, 3133–3146. doi: 10.5194/bg-16-3133-2019
Durden, J., Schoening, T., Althaus, F., Friedman, A., Garcia, R., Glover, A. G., et al. (2016). Perspectives in visual imaging for marine biology and ecology: from acquisition to understanding. Oceanogr. Mar. Biol. 54:1S72.
Esri (2020). World Ocean Base Map. Available online at: https://www.arcgis.com/home/item.html?id=1e126e7520f9466c9ca28b8f28b5e500 (accessed March 8, 2021).
Flannery, E., and Przeslawski, R. (2015). Comparison of Sampling Methods to Assess Benthic Marine Biodiversity: Are Spatial and Ecological Relationships Consistent Among Sampling Gear? Record 2015/07. Canberra, NSW: Geoscience Australia, doi: 10.11636/Record.2015.007
Folkersen, M. V., Fleming, C. M., and Hasan, S. (2018). The economic value of the deep sea: a systematic review and meta-analysis. Mar. Policy 94, 71–80. doi: 10.1016/j.marpol.2018.05.003
Fortin, M.-J., Drapeau, P., and Legendre, P. (1989). Spatial autocorrelation and sampling design in plant ecology. Vegetatio 83, 209–222. doi: 10.1007/BF00031693
Gerdes, K., Martínez Arbizu, P., Schwarz-Schampera, U., Schwentner, M., and Kihara, T. C. (2019). Detailed mapping of hydrothermal vent fauna: a 3D reconstruction approach based on video imagery. Front. Mar. Sci. 6:96. doi: 10.3389/fmars.2019.00096
Gullage, L., Devillers, R., and Edinger, E. (2017). Predictive distribution modelling of cold-water corals in the Newfoundland and Labrador region. Mar. Ecol. Prog. Ser. 582, 57–77. doi: 10.3354/meps12307
Hall-Spencer, J., Allain, V., and Fosså, J. H. (2002). Trawling damage to Northeast Atlantic ancient coral reefs. Proc. R. Soc. B Biol. Sci. 269, 507–511. doi: 10.1098/rspb.2001.1910
Howell, K. L., Davies, J. S., Allcock, A. L., Braga-Henriques, A., Buhl-Mortensen, P., Carreiro-Silva, M., et al. (2019). A framework for the development of a global standardised marine taxon reference image database (SMarTaR-ID) to support imagebased analyses. PLoS One 14:e218904. doi: 10.1371/journal.pone.0218904
Huetten, E., and Greinert, J. (2008). Software controlled guidance, recording and post-processing of seafloor observations by ROV and other towed devices: the software package OFOP. Geophys. Res. Abstr. 10:EGU2008-A-03088.
Huvenne, V. A. I., Bett, B. J., Masson, D. G., Le Bas, T. P., and Wheeler, A. J. (2016). Effectiveness of a deep-sea cold-water coral Marine Protected Area, following eight years of fisheries closure. Biol. Conserv. 200, 60–69. doi: 10.1016/j.biocon.2016.05.030
Jamieson, A. J., Boorman, B., and Jones, D. O. (2013). “Deep-sea benthic sampling,” in Methods for the Study of Marine Benthos, ed. A. Eleftheriou (Chichester: John Wiley and Sons), 285–348.
Jones, D., Bett, B. J., Wynn, R. B., and Masson, D. G. (2009). The use of towed camera platforms in deep-water science. Underw. Technol. 28, 41–50. doi: 10.3723/ut.28.041
Katsanevakis, S., Weber, A., Pipitone, C., Leopold, M., Cronin, M., Scheidat, M., et al. (2012). Monitoring marine populations and communities: methods dealing with imperfect detectability. Aquat. Biol. 16, 31–52. doi: 10.3354/ab00426
Kenchington, E., Beazley, L. I., Lirette, C., Murillo, F. J., Guijarro, J., Wareham, V., et al. (2016a). Delineation of Coral and Sponge Significant Benthic Areas in Eastern Canada Using Kernel Density Analyses and Species Distribution Models. Ottawa, ON: Canadian Science Advisory Secretariat, 178.
Kenchington, E., Lirette, C., Murillo, F. J., Beazley, L., Guijarro, J., Wareham, V., et al. (2016b). Kernel Density Analyses of Coral and Sponge Catches from Research Vessel Survey Data for Use in Identification of Significant Benthic Areas. Ottawa, ON: Ocean and Ecosystem Sciences Division Fisheries and Oceans Canada.
Kenchington, E., Murillo, F. J., Cogswell, A., and Lirette, C. (2011). Development of Encounter Protocols and Assessment of Significant Adverse Impact by Bottom Trawling for Sponge Grounds and Sea Pen Fields in the NAFO Regulatory Area. Dartmouth, NS: Northwest Atlantic Fisheries Organization.
Kenchington, E., Murillo, F. J., Lirette, C., Sacau, M., Koen-Alonso, M., Kenny, A., et al. (2014). Kernel density surface modelling as a means to identify significant concentrations of vulnerable marine ecosystem indicators. PLoS One 9:e109365. doi: 10.1371/journal.pone.0109365
Kwasnitschka, T., Hansteen, T. H., Devey, C. W., and Kutterolf, S. (2013). Doing fieldwork on the seafloor: photogrammetric techniques to yield 3D visual models from ROV video. Comput. Geosci. 52, 218–226. doi: 10.1016/j.cageo.2012.10.008
Lacharité, M., Brown, C. J., Normandeau, A., and Todd, B. J. (2020). “Geomorphic features and benthos in a deep glacial trough in Atlantic Canada,” in Seafloor Geomorphology as Benthic Habitat, eds P. T. Harris and E. Baker (Amsterdam: Elsevier), 691–704. doi: 10.1016/b978-0-12-814960-7.00041-5
Lacharité, M., Metaxas, A., and Lawton, P. (2015). Using object-based image analysis to determine seafloor fine-scale features and complexity. Limnol. Oceanogr. Methods 13, 553–567. doi: 10.1002/lom3.10047
Langton, R. W., Langton, E. W., Theroux, R. B., and Uzmann, J. R. (1990). Distribution, behavior and abundance of sea pens, Pennatula aculeata, in the Gulf of Maine. Mar. Biol. 107, 463–469. doi: 10.1007/BF01313430
Logan, J. M., Young, M. A., Harvey, E. S., Schimel, A. C. G., and Ierodiaconou, D. (2017). Combining underwater video methods improves effectiveness of demersal fish assemblage surveys across habitats. Mar. Ecol. Prog. Ser. 582, 181–200. doi: 10.3354/meps12326
McCallum, B. R., and Walsh, S. J. (1996). Groundfish Survey Trawls Used at the Northwest Atlantic Fisheries Centre, 1971-Present. Dartmouth, NS: Northwest Atlantic Fisheries Organization.
McIntyre, F. D., Neat, F., Collie, N., Stewart, M., and Fernandes, P. G. (2015). Visual surveys can reveal rather different “pictures” of fish densities: comparison of trawl and video camera surveys in the Rockall Bank, NE Atlantic Ocean. Deep. Res. Part I Oceanogr. Res. Pap. 95, 67–74. doi: 10.1016/j.dsr.2014.09.005
Moritz, C., Lévesque, M., Gravel, D., Vaz, S., Archambault, D., and Archambault, P. (2013). Modelling spatial distribution of epibenthic communities in the Gulf of St. Lawrence (Canada). J. Sea Res. 78, 75–84. doi: 10.1016/j.seares.2012.10.009
Morris, K. J., Bett, B. J., Durden, J. M., Huvenne, V. A. I., Milligan, R., Jones, D. O. B., et al. (2014). A new method for ecological surveying of the abyss using autonomous underwater vehicle photography. Limnol. Oceanogr. Methods 12, 795–809. doi: 10.4319/lom.2014.12.795
Murillo, F. J., Kenchington, E., Koen-Alonso, M., Guijarro, J., Kenchington, T. J., Sacau, M., et al. (2020). Mapping benthic ecological diversity and interactions with bottom-contact fishing on the Flemish Cap (northwest Atlantic). Ecol. Indic. 112:106135. doi: 10.1016/j.ecolind.2020.106135
Neves, B., de, M., Edinger, E., Layne, G. D., and Wareham, V. E. (2015). Decadal longevity and slow growth rates in the deep-water sea pen Halipteris finmarchica (Sars, 1851) (Octocorallia: Pennatulacea): implications for vulnerability and recovery from anthropogenic disturbance. Hydrobiologia 759, 147–170. doi: 10.1007/s10750-015-2229-x
Nybakken, J., Craig, S., Smith-Beasley, L., Moreno, G., Summers, A., and Weetman, L. (1998). Distribution density and relative abundance of benthic invertebrate megafauna from three sites at the base of the continental slope off central California as determined by camera sled and beam trawl. Deep. Res. Part II Top. Stud. Oceanogr. 45, 1753–1780. doi: 10.1016/S0967-0645(98)80016-7
Pacunski, R., Lowry, D., Hillier, L., and Blaine, J. (2016). A Comparison of Groundfish Species Composition, Abundance, and Density Estimates Derived from a Scientific Bottom-Trawl and a Small Remotely-Operated Vehicle for Trawlable Habitats. Washington, DC: Washington Department of Fish and Wildlife Fish Program Science Division.
Pitcher, C. R., Doherty, P., Arnold, P., Hooper, J., Gribble, N., Bartlett, C., et al. (2007). Seabed Biodiversity on the Continental Shelf of the Great Barrier Reef World Heritage Area. Hobart, TAS: CSIRO Marine & Atmospheric Research.
Ramirez-Llodra, E., Tyler, P. A., Baker, M. C., Bergstad, O. A., Clark, M. R., Escobar, E., et al. (2011). Man and the last great wilderness: human impact on the deep sea. PLoS One 6:e22588. doi: 10.1371/journal.pone.0022588
Schoening, T., Purser, A., Langenkämper, D., Suck, I., Taylor, J., Cuvelier, D., et al. (2020). Megafauna community assessment of polymetallic-nodule fields with cameras: platform and methodology comparison. Biogeosciences 17, 3115–3133. doi: 10.5194/bg-17-3115-2020
Scientific Abyss Mapping Services (2009). OFOP Documentation: Version 3.2.0k. 1–42. Available online at: http://www.ofop-by-sams.eu/ (accessed November 7, 2017)
Simon-Lledó, E., Bett, B. J., Huvenne, V. A. I., Köser, K., Schoening, T., Greinert, J., et al. (2019). Biological effects 26 years after simulated deep-sea mining. Sci. Rep. 9:8040. doi: 10.1038/s41598-019-44492-w
Sward, D., Monk, J., and Barrett, N. (2019). A systematic review of remotely operated vehicle surveys for visually assessing fish assemblages. Front. Mar. Sci. 6:134. doi: 10.3389/fmars.2019.00134
Trenkel, V. M., Francis, R. I. C. C., Lorance, P., Mahévas, S., Rochet, M. J., and Tracey, D. M. (2004). Availability of deep-water fish to trawling and visual observation from a remotely operated vehicle (ROV). Mar. Ecol. Prog. Ser. 284, 293–303. doi: 10.3354/meps284293
Underwood, A. J. (1997). Experiments in Ecology: Their Logical Design and Interpretation Using Analysis of Variance. New York, NY: Cambridge University Press, 504.
Uzmann, J. R., Cooper, R. A., Theroux, R. B., and Wigley, R. L. (1977). Synoptic comparison of three sampling techniques for estimating abundance and distribution of selected megafauna: submersible vs. camera sled vs. otter trawl. Mar. Fish. Rev. 39, 11–19.
Vázquez, A. (2010). Catchability Comparison Between Lofoten and Campelen Gears. Dartmouth, NS: Northwest Atlantic Fisheries Organization.
Walsh, S., Hickey, W. H., Porter, J., Delouche, H., and MacCallum, B. R. (2009). NAFC survey trawl operations manual: Version 1.0. St. John’s, NL: Northwest Atlantic Fisheries Centre.
Walsh, S. J. (1992). Size-dependent selection at the footgear of a Groundfish survey trawl. North Am. J. Fish. Manag. 12, 625–633.
Warren, W. G. (1997). Report on the comparative fishing trial between the Gadus Atlantica and Teleost. NAFO Sci. Counc. Stud. 29, 81–92.
Wassenberg, T. J., Dews, G., and Cook, S. D. (2002). The impact of fish trawls on megabenthos (sponges) on the north-west shelf of Australia. Fish. Res. 58, 141–151. doi: 10.1016/S0165-7836(01)00382-4
Williams, G. (1999). Index pennatulacea annotated bibliography and indexes of the sea pens (Coelenterata: Octocorallia) of the World 1469-1999. Proc. Calif. Acad. Sci. 51, 19–103.
Williams, G., and Alderslade, P. (2011). Three new species of pennatulacean octocorals with the ability to attach to rocky substrata (Cnidaria: Anthozoa: Pennatulacea). Zootaxa 3001, 33–48. doi: 10.11646/zootaxa.3001.1.2
Keywords: sampling tools, imagery, sea pens, monitoring, epifauna, marine protected area, corals, deep sea
Citation: de Mendonça SN and Metaxas A (2021) Comparing the Performance of a Remotely Operated Vehicle, a Drop Camera, and a Trawl in Capturing Deep-Sea Epifaunal Abundance and Diversity. Front. Mar. Sci. 8:631354. doi: 10.3389/fmars.2021.631354
Received: 19 November 2020; Accepted: 27 April 2021;
Published: 10 June 2021.
Edited by:
Jose Angel Alvarez Perez, Universidade do Vale do Itajaí, BrazilReviewed by:
Autun Purser, Alfred Wegener Institute Helmholtz Centre for Polar and Marine Research (AWI), GermanyGiovanni Chimienti, University of Bari Aldo Moro, Italy
Copyright © 2021 de Mendonça and Metaxas. This is an open-access article distributed under the terms of the Creative Commons Attribution License (CC BY). The use, distribution or reproduction in other forums is permitted, provided the original author(s) and the copyright owner(s) are credited and that the original publication in this journal is cited, in accordance with accepted academic practice. No use, distribution or reproduction is permitted which does not comply with these terms.
*Correspondence: Sarah N. de Mendonça, sarah.de.mendonca@dal.ca